Back to Journals » Infection and Drug Resistance » Volume 19
Nomogram for Predicting Poor Prognosis of Newly Diagnosed Active Pulmonary Tuberculosis Based on PNI: Development and Internal Validation
Received 6 March 2026
Accepted for publication 26 May 2026
Published 9 June 2026 Volume 2026:19 601572
DOI https://doi.org/10.2147/IDR.S601572
Checked for plagiarism Yes
Review by Single anonymous peer review
Peer reviewer comments 1
Editor who approved publication: Dr Hazrat Bilal
Ni Feng,1,2 Junjie Wang,1,2 Yi Li2
1School of Clinical Medicine, North Sichuan Medical College, Nanchong, 637000, People’s Republic of China; 2Department of Infectious Diseases, Suining Central Hospital, Suining, 629000, People’s Republic of China
Correspondence: Yi Li, Email [email protected]
Objective: To investigate the correlation between the Prognostic Nutrition Index (PNI) and adverse prognosis in treatment-naive patients with active pulmonary tuberculosis(TB), and to construct and validate an individualized risk prediction nomogram.
Methods: A retrospective study included 165 patients with newly diagnosed active TB from January 2022 to February 2025. Treatment outcomes at 2 and 6 months were classified as good prognosis (markedly effective) or poor prognosis (effective, ineffective, deteriorated). Optimal PNI cut-offs were determined by ROC. Predictors were selected using LASSO regression. A nomogram was constructed by multivariate Logistic regression and internally validated with 1000 bootstrap samples. Model performance was evaluated by ROC, calibration curve and decision curve analysis.
Results: Optimal PNI cut-offs for poor prognosis at 2 and 6 months were 44.85 and 42.6. The nomogram achieved an AUC of 0.789 at 2 months. Adding PNI significantly improved discrimination (NRI=0.396, IDI=0.054). Calibration was satisfactory, and the model showed clinical net benefit. PNI provided greater incremental value for short-term prognosis.
Conclusion: A PNI-based nomogram can effectively predict poor prognosis in newly diagnosed active TB patients. A PNI threshold of < 45 is recommended for high-risk screening to enable early nutritional and immune intervention. External validation is needed before widespread application.
Keywords: prognostic nutrition index, pulmonary tuberculosis, treatment-naive, adverse prognosis, nomogram model
Introduction
Pulmonary Tuberculosis (PTB) is a chronic respiratory infectious disease caused by Mycobacterium tuberculosis invading the lungs. According to the 2024 Global Tuberculosis Report, 1 approximately 10.8 million new TB cases were reported worldwide in 2023, and the number of deaths from tuberculosis reached as high as 1.25 million. China is still listed as one of the 30 high-burden countries for tuberculosis, accounting for 6.8% of the global incidence. With the development of standardized treatment regimens recommended by the World Health Organization, most tuberculosis patients can achieve good treatment and prognostic outcomes, but some patients have poor treatment and prognostic results.2 Studies have shown3 that nutritional and immune status are closely related to the prognosis of tuberculosis. The Prognostic Nutrition Index (PNI) is a comprehensive key indicator for evaluating nutritional and immune status, and its calculation formula4 is: PNI = serum albumin (g/L) + 5 × peripheral blood lymphocyte count (×109/L). At present, a large number of studies have indicated that PNI is closely associated with the prognosis and all-cause mortality of various malignant tumors,4–7 cardiovascular diseases,8 digestive system9 and immune system diseases.10 It has also been confirmed that PNI is closely related to the risk of death in tuberculosis patients.11 Yuan et al12 reported that PNI combined with the 3rd-day APACHE II score in ICU patients could effectively predict the 30-day mortality of severe tuberculosis patients (AUC = 0.952). Tan et al13 identified low PNI as an independent predictor of unfavorable treatment outcomes in PTB (adjusted OR = 23.667). However, few studies have explored the predictive value of PNI for poor prognosis in patients with active pulmonary tuberculosis during the intensive phase (month 2) and consolidation phase (month 6) of anti-tuberculosis treatment. In particular, a nomogram prediction model integrating multiple clinical factors has not yet been developed and validated.Therefore, this retrospective cohort study incorporated PNI and other clinical predictors, with the following aims: (1) To explore the association of PNI with poor prognosis in newly diagnosed active PTB patients during the intensive and consolidation phases of anti-tuberculosis treatment; (2) To screen independent risk factors for unfavorable anti-tuberculosis outcomes; (3) To construct and validate a nomogram model for predicting the probability of poor prognosis in newly diagnosed active PTB patients, so as to facilitate early clinical risk stratification and targeted nutritional-immune intervention.
Materials and Methods
Patients
Treatment-naive patients with active pulmonary tuberculosis admitted to the Department of Infectious Diseases, Suining Central Hospital, Sichuan Province from January 2022 to February 2025 were collected. A total of 165 patients who met the inclusion and exclusion criteria were enrolled, including 117 males and 48 females. The diagnostic criteria for treatment-naive patients with active pulmonary tuberculosis were in accordance with WS 288–2017 Diagnosis of Pulmonary Tuberculosis14 and Expert Consensus on the Standard and Clinical Application of Activity Judgment of Pulmonary Tuberculosis.15
Inclusion Criteria
1) Treatment-naive patients with active pulmonary tuberculosis who visited the outpatient clinic of the Department of Infectious Diseases, Suining Central Hospital; 2) Aged ≥ 18 years; 3) Conforming to the diagnostic criteria for treatment-naive active pulmonary tuberculosis; 4) Patients who completed 6-month standardized anti-tuberculosis treatment (isoniazid, rifampicin or rifapentine, pyrazinamide and ethambutol for 2 consecutive months, followed by isoniazid and rifampicin for 4 consecutive months).
Exclusion Criteria
1) Patients with retreated active pulmonary tuberculosis; 2) Patients with drug-resistant pulmonary tuberculosis; 3) Patients complicated with acquired immunodeficiency syndrome, malignant tumors, hematological diseases or autoimmune diseases; 4) Patients with irregular medication taking, poor compliance, irregular follow-up or sudden death due to other diseases; 5) Patients with severe lack of clinical data.
This study has been approved by the Ethics Committee of Suining Central Hospital (Ethics Approval No.: KYLLKS20250108), and written informed consent was waived due to the retrospective nature.The research was conducted in strict accordance with the Declaration of Helsinki and relevant ethical guidelines, ensuring full protection of the rights, safety and privacy of research participants.
Methods
Clinical medical records of patients were retrieved through the electronic medical record system. Name, gender, age, height, weight, contact information, occupation, smoking history, drinking history, past medical history, comorbidities, length of hospital stay and treatment regimen of all subjects were collected. All enrolled patients underwent routine relevant laboratory tests before treatment. Serum albumin (ALB), white blood cell count (WBC), neutrophil count (NEUT), lymphocyte count (Lym), high-sensitivity C-reactive protein (hs-CRP), procalcitonin (PCT), alanine aminotransferase (ALT), aspartate aminotransferase (AST), platelet count (PLT), CD4⁺T lymphocyte count, Sputum or bronchoalveolar lavage fluid (BALF) etiological examination for tuberculosis: positive or negative (A positive result is defined as any one of the following: acid-fast bacilli detected by smear microscopy, positive TB-DNA, MTB positive by Xpert, Mycobacterium tuberculosis complex detected by NGS, or growth of Mycobacterium tuberculosis observed on Löwenstein-Jensen medium), triglycerides (TG) and fasting plasma glucose (FPG) were recorded. Calculation of prognostic nutrition index, ratios and other indexes was performed: 1) Prognostic Nutrition Index(PNI)4 = serum albumin (g/L) + 5 × peripheral blood lymphocyte count (×109/L); 2) Triglyceride-glucose index (TyG)16 = ln[triglycerides (mg/dL) × fasting plasma glucose (mg/dL)/2]; 3) Neutrophil-to-lymphocyte ratio (NLR):17 Neutrophil count / Lymphocyte count; 4) Platelet-to-lymphocyte ratio (PLR):15 Platelet count / Lymphocyte count; 5) HALP score:18 Hemoglobin (g/L) × Albumin (g/L) × Lymphocyte count (×109/L) / Platelet count (×109/L)
Patients were divided into three groups according to the tertile of PNI:T1 group: the lowest tertile (low PNI group); T2 group: the middle tertile (moderate PNI group);T3 group: the highest tertile (high PNI group).
Statistical Analysis
Sample size assessment in this study was performed based on the Events Per Variable (EPV) criterion to ensure the robustness of model development. In accordance with the precise sample size calculation method proposed by Riley et al17 and recommendations from previous simulation studies, an estimated 15–20 candidate predictive variables were planned for inclusion.18 To meet the minimum recommended criterion of EPV ≥ 10 and control the risk of overfitting, the minimum required number of events (ie, the number of primary endpoint “poor prognosis” events) was estimated to be 150–200 cases. Ultimately, a total of 165 patients were enrolled in the present study, among whom 71 cases developed poor prognosis at the 2-month follow-up (43.03%), which satisfied the requirement of EPV ≥ 10.
Handling of Missing Data: No missing values were observed for the primary exposure variable (PNI) and outcome variables. A small proportion of missing data existed in several covariates, with the missing rate of each variable less than 5%. To fully utilize available data and reduce potential bias arising from complete-case analysis, multiple imputation was adopted to handle missing covariates. The pooled results were synthesized according to Rubin’s rules.
All data were analyzed using R language (4.0.1). Continuous variables conforming to normal distribution were described as “mean ± standard deviation” and compared between groups using t-test. If continuous variables were not normally distributed, Mann–Whitney U-test was used, and the results were expressed as median (interquartile range). Categorical variables were described as “frequency and percentage (%)” and compared using chi-square test. To quantify the effect size of differences between groups, the standardized mean difference (SMD) was also reported, and SMD > 0.1 indicated a meaningful difference between groups.The optimal clinical cut-off value of PNI was determined using the Youden index. Statistically significant variables in the univariate analysis were further screened by the Least Absolute Shrinkage and Selection Operator (LASSO) regression.All continuous predictive variables were standardized prior to entry into the LASSO model. The optimal penalty parameter λ was determined via 10-fold cross-validation (the model corresponding to λ.min was selected), and variables with non-zero coefficients were retained. The variance inflation factor (VIF) of each variable in the final model was calculated; VIF < 5 was taken as the criterion for no severe multicollinearity, and the results are presented in Supplementary Table S1. Restricted cubic splines were applied to fit the Logistic regression model for continuous variables to test for potential nonlinear relationships with poor prognosis.
Variables screened by LASSO regression were incorporated into the multivariate Logistic regression model to construct the base prediction model. PNI was further added into the base model to establish the comprehensive model, so as to quantify the incremental predictive value of PNI.The receiver operating characteristic (ROC) curve and the area under the curve (AUC) were used to evaluate the discrimination ability of the models. The integrated discrimination improvement (IDI) and net reclassification improvement (NRI) were adopted to quantify the improvement in predictive performance of the base model after the addition of PNI.Calibration curves were used to assess the consistency between model-predicted risk and actual clinical risk. Decision curve analysis (DCA) was performed to evaluate the clinical net benefit of the models. To avoid model overfitting and optimistic bias, internal validation was conducted via 1000 bootstrap resamples. Finally, the prediction model was visualized and presented as a nomogram.
Evaluation Criteria for Prognostic Efficacy
Referring to the Clinical Diagnosis and Treatment Guidelines (Tuberculosis Volume) issued by the Chinese Medical Association in 2005, continuous negative (or conversion to negative) Mycobacterium tuberculosis culture, significant absorption of lesions ≥ 1/2 shown by chest X-ray or CT, and reduction, closure or no change of cavities were classified as markedly effective. Patients with < 50% reduction of lesion range shown by chest X-ray, positive sputum culture, and relieved clinical symptoms (cough, chest pain, fatigue, etc.) were classified as effective. Patients with no changes in Mycobacterium tuberculosis in sputum and chest X-ray or CT were classified as ineffective. Patients with recurrence of positive Mycobacterium tuberculosis in sputum, enlargement of cavities or appearance of new cavities, and increase of lesions shown by chest X-ray or CT were classified as deteriorated. Markedly effective was defined as good prognosis, while effective, ineffective and deteriorated were defined as adverse prognosis.
Evaluation Time for Prognostic Efficacy
At the end of the 2nd month and the 6th month of anti-tuberculosis treatment.
Results
General Data Characteristics Among the Three Groups
As shown in Table 1, the final subjects were divided into three groups based on the tertile interval of PNI: T1 group (n=55), T2 group (n=55) and T3 group (n=55). There were statistically significant differences in age, weight, BMI, gender, etiological results, TB etiological results of sputum and BALF and length of hospital stay among the three groups (all P < 0.05). Specifically, compared with T1 group, T2 group and T3 group were younger, heavier, had higher BMI, fewer males, fewer positive rates of TB etiological tests in sputum or BALF, and shorter length of hospital stay. However, there were no statistically significant differences in height, smoking history and IGRA between the groups (P > 0.05).
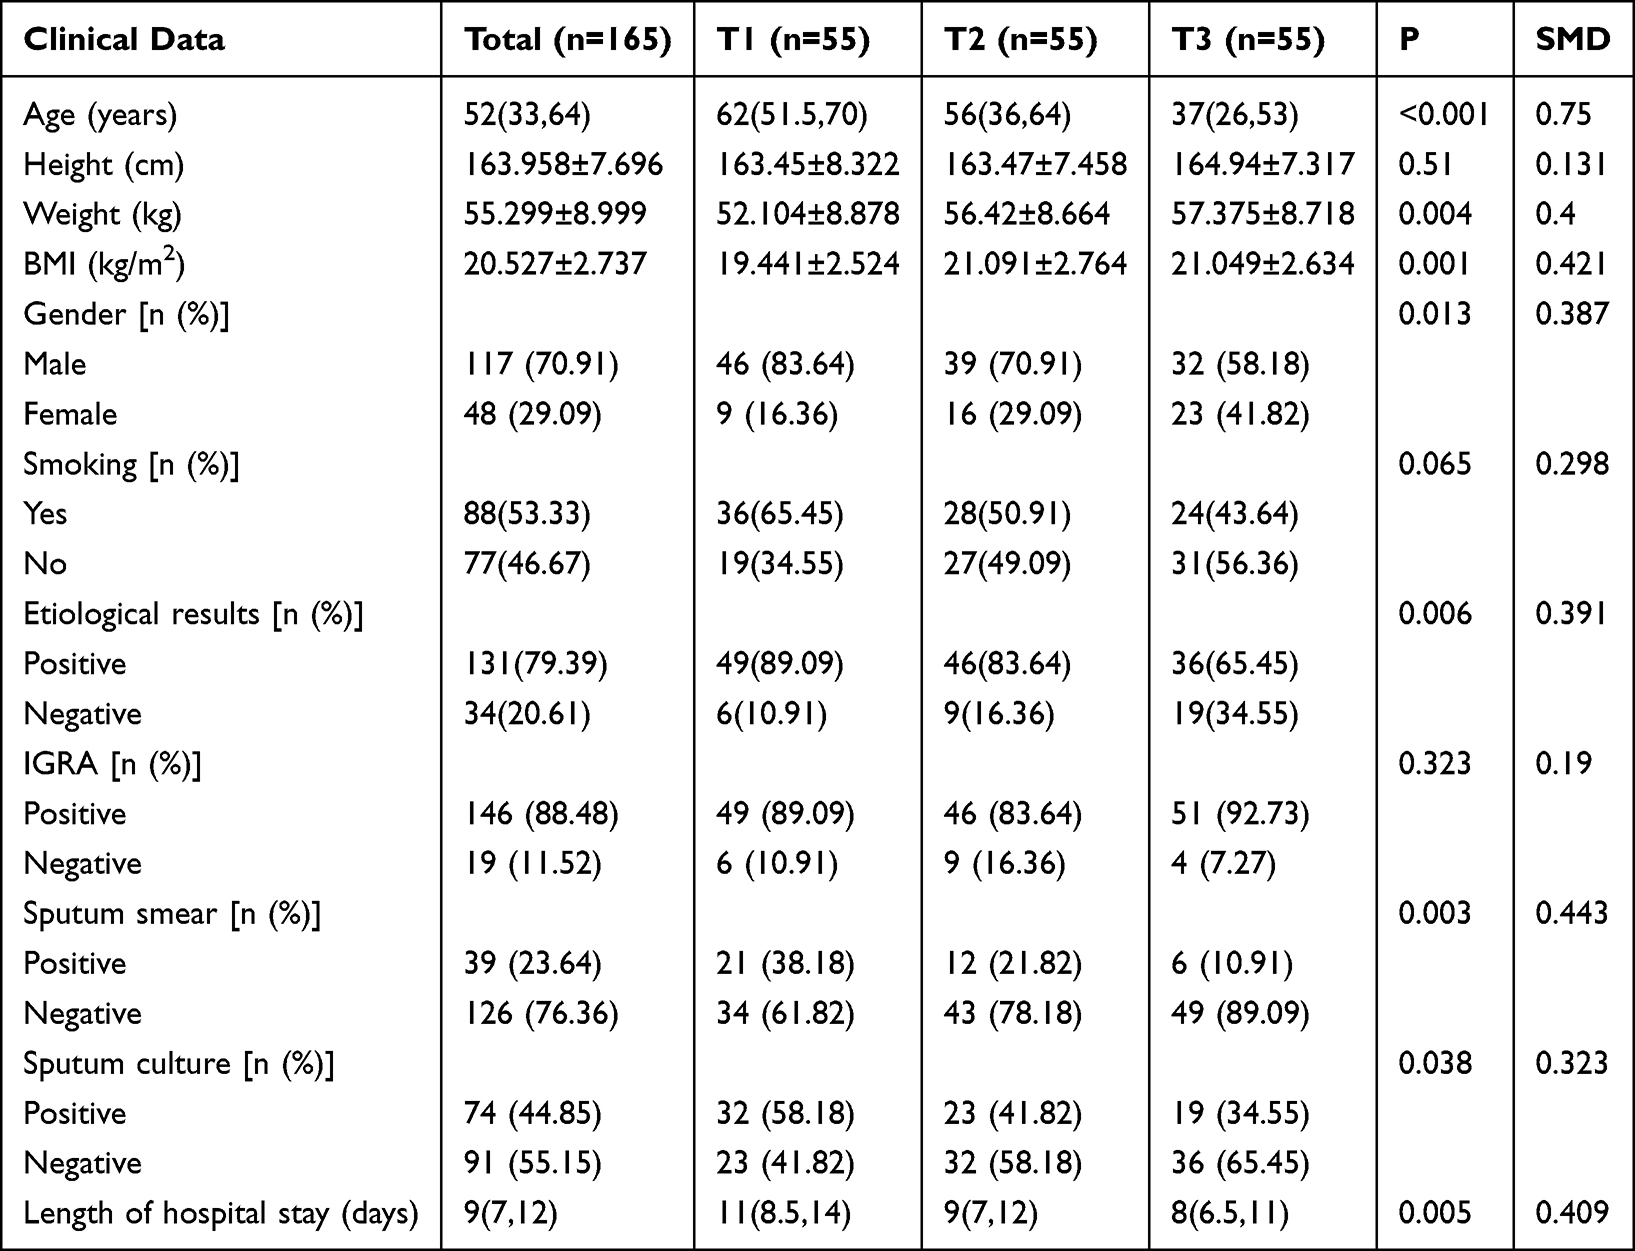 |
Table 1 Comparison of General Data Among the Three Groups |
Comparison of Comorbidities Among the Three Groups
As shown in Table 2, the proportions of T1 group complicated with diabetes mellitus (36.36% VS 20% VS 16.36%, P=0.033), chronic obstructive pulmonary disease(COPD) (23.64% VS 18.18% VS 5.45%, P=0.027) and respiratory failure (12.73% VS 1.82% VS 0.00%, P=0.004) were significantly higher than those of T2 group and T3 group. In addition, the proportion of T1 group complicated with pulmonary cavity was also significantly higher (54.55% VS 38.18% VS 21.82%, P=0.002).
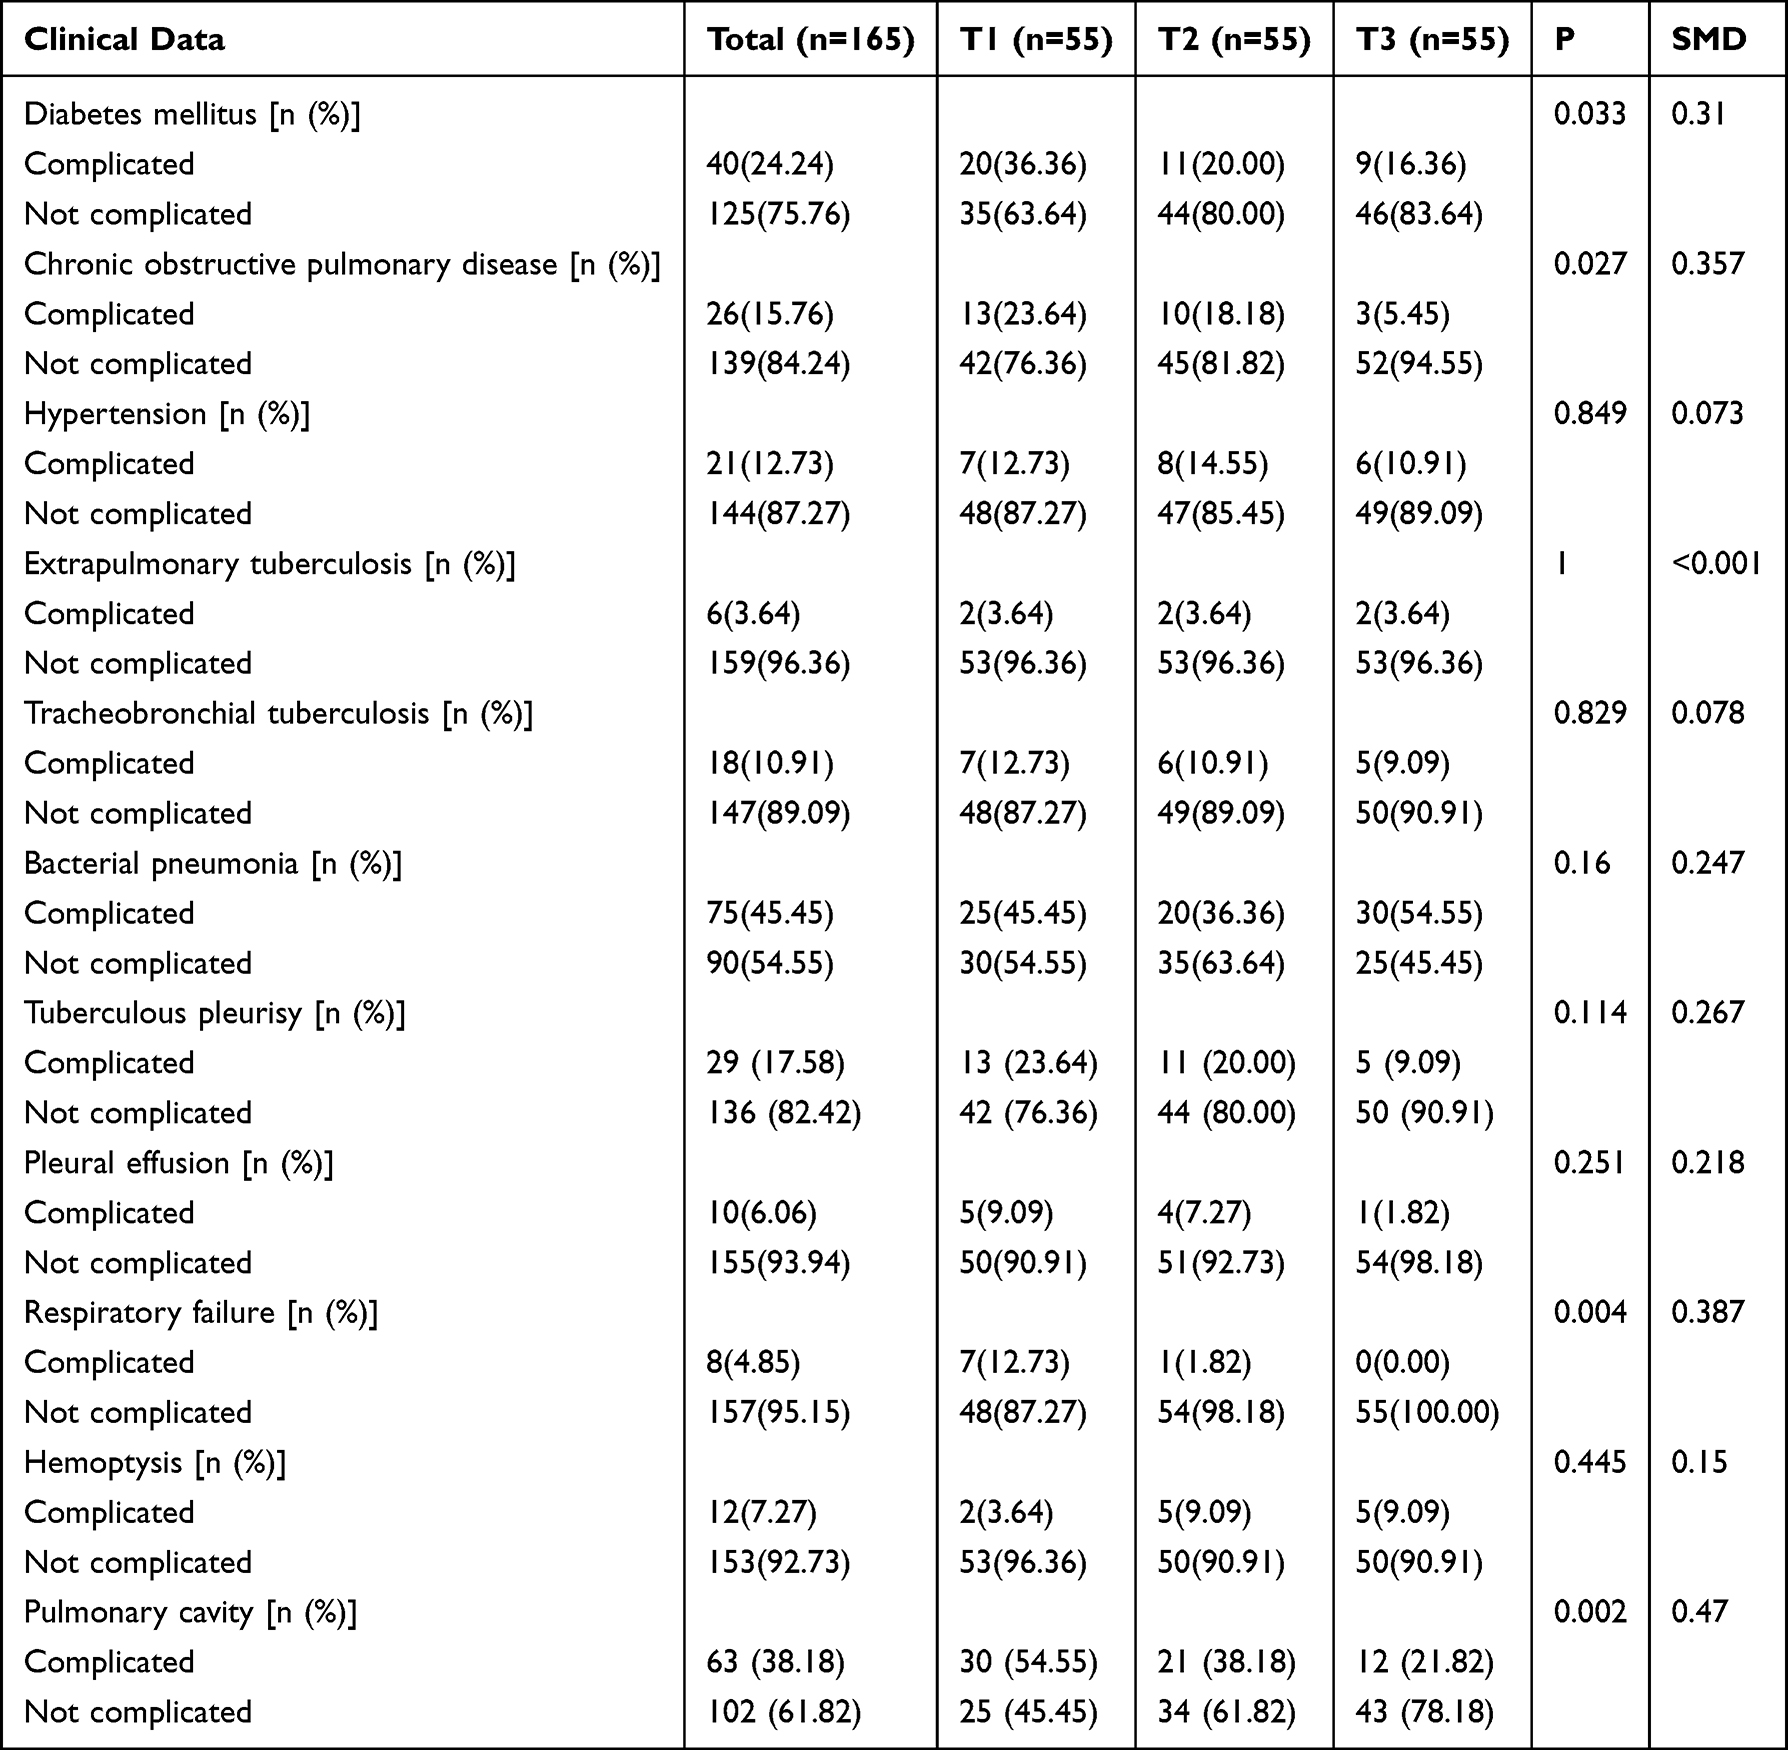 |
Table 2 Comparison of Comorbidities Among the Three Groups |
Comparison of Laboratory Data Among the Three Groups
As shown in Table 3, there were statistically significant differences in lymphocytes, Hb, ALB, hs-CRP and CD4⁺T cell count among the three groups (P < 0.05). All the aforementioned indicators in T1 group were significantly lower than those in T2 group and T3 group. There were no statistically significant differences in white blood cells, neutrophils, PLT, TG, FBG, ALT, AST, PCT and other indicators among the three groups (P > 0.05).
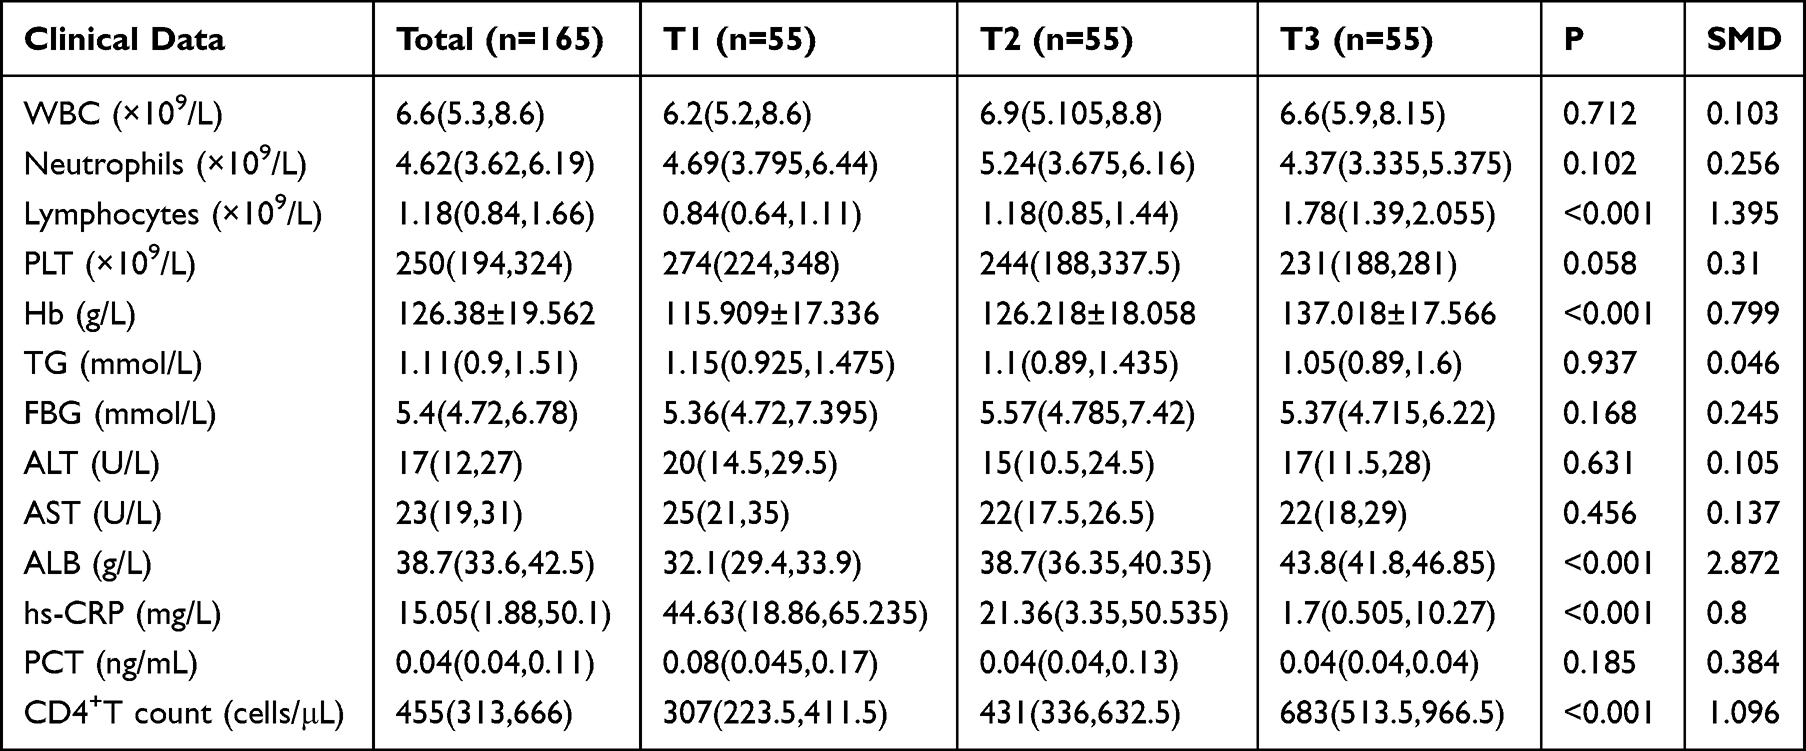 |
Table 3 Comparison of Laboratory Data Among the Three Groups |
Comparison of Ratios, Indexes and Scores Among the Three Groups
As shown in Table 4, NLR and PLR in T1 group were significantly higher than those in the T2 and T3 groups (both P < 0.001), while the HALP score and PNI were significantly the lowest in T1 group (P < 0.001).
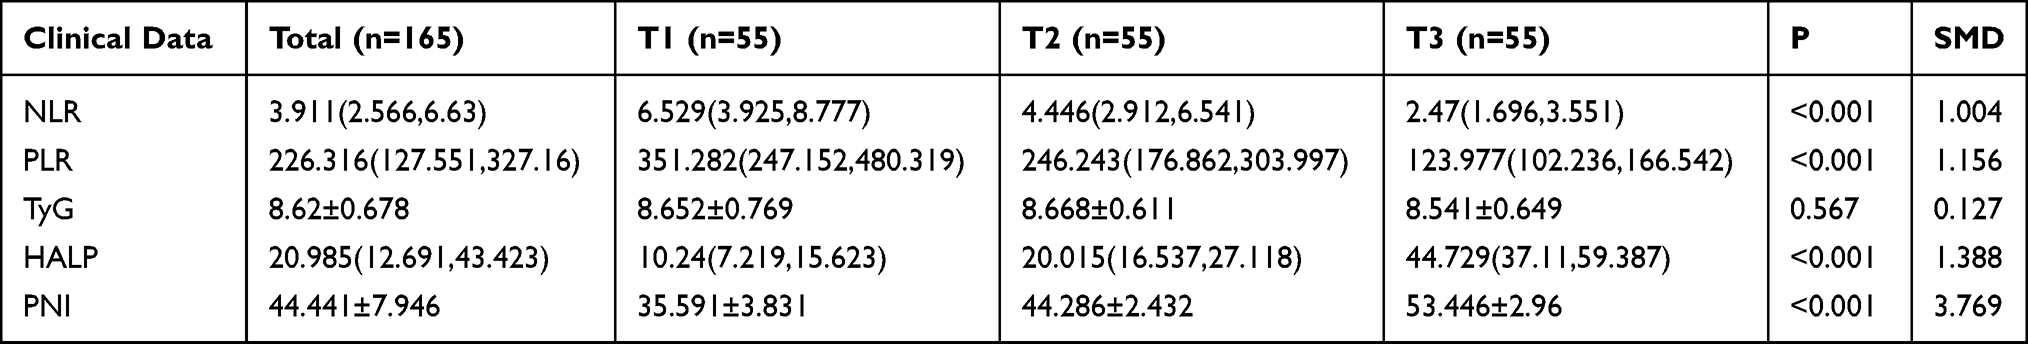 |
Table 4 Comparison of Ratios, Indexes and Scores Among the Three Groups |
In summary, the results of baseline data comparison indicated that grouping based on the tertile interval of PNI could effectively distinguish treatment-naive patients with active pulmonary tuberculosis with different clinical characteristics. The typical characteristics of the low PNI (T1) group were: advanced age, malnutrition, high bacterial load, multiple comorbidities and high inflammatory level.
Logistic Regression Analysis of PNI and Adverse Prognosis
As shown in Tables 5 and 6, to evaluate the association between PNI and adverse prognosis in treatment-naive patients with active pulmonary tuberculosis, univariate and multivariate Logistic regression analyses were performed with adverse prognosis at the end of the 2nd and 6th month of anti-tuberculosis treatment as endpoint events, respectively.
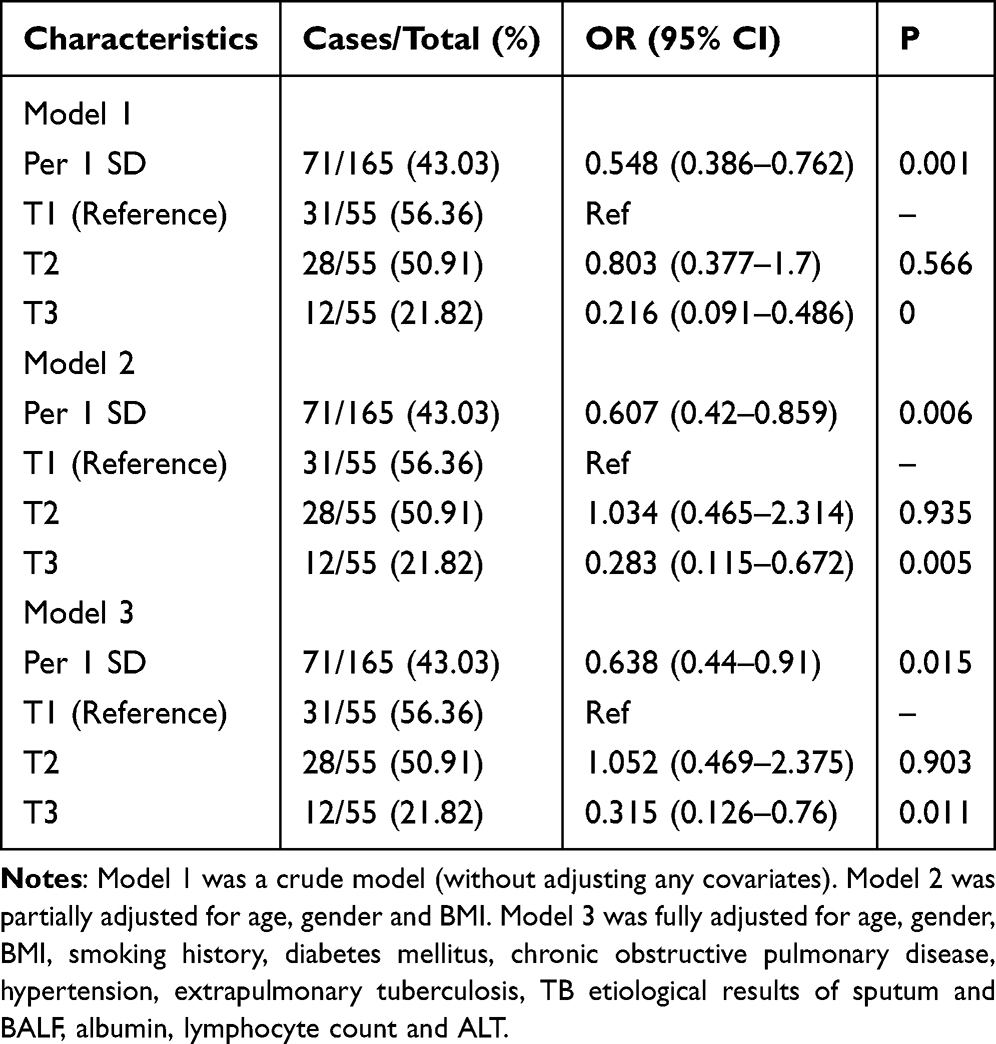 |
Table 5 Logistic Regression Analysis of Adverse Prognosis at the End of the 2nd Month of Anti-Tuberculosis Treatment |
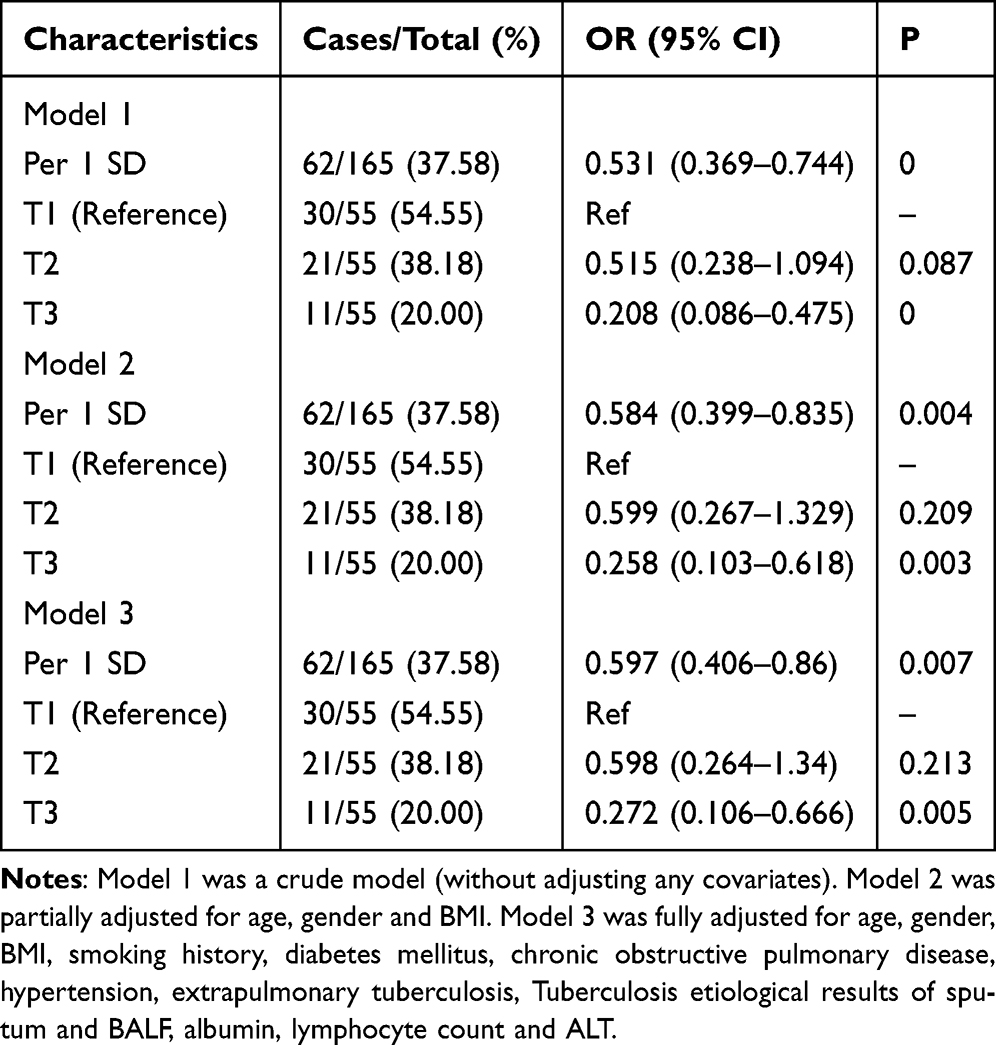 |
Table 6 Logistic Regression Analysis of Adverse Prognosis at the End of the 6th Month of Anti-Tuberculosis Treatment |
At the end of the 2nd month of anti-Tuberculosis treatment, among the 165 patients, 71 cases (43.03%) had adverse prognosis at the end of the 2nd month (Table 5). Adverse prognosis occurred in 31 out of 55 patients (56.4%) in the T1 group, 28 out of 55 (50.9%) in the T2 group, and 12 out of 55 (21.8%) in the T3 group.PNI as a continuous variable (per 1 standard deviation increase) was a significant protective factor against adverse prognosis in all models. In the unadjusted Model 1, each 1 standard deviation increase in PNI reduced the risk of adverse prognosis at the end of the 2nd month of anti-tuberculosis treatment by 45.2% (OR=0.548, 95% CI: 0.386–0.762). When fully adjusted for confounding factors (Model 3), each 1 standard deviation increase in PNI still reduced the risk of adverse prognosis by 36.2% (OR=0.638, 95% CI: 0.440–0.910, P=0.015). When PNI was analyzed as a categorical variable, with T1 group as the reference, T3 group was a protective factor against adverse prognosis in all models.
At the end of the 6th month of anti-Tuberculosis treatment, a total of 62 cases (37.58%) had adverse prognosis at the end of the 6th month (Table 6). Adverse prognosis occurred in 30 out of 55 patients (54.5%) in the T1 group, 21/55 (38.2%) in the T2 group, and 11/55 (20.0%) in the T3 group. When PNI was analyzed as a continuous variable, in the fully adjusted Model 3, each 1 standard deviation increase in PNI significantly reduced the risk of adverse prognosis at the end of the 6th month by 40.3% (OR=0.597, 95% CI: 0.406–0.860, P=0.007). In Model 3, the risk of T3 group was only 27.2% of that of T1 group (OR=0.272, 95% CI: 0.106–0.666, P=0.005).
In conclusion, whether PNI was regarded as a continuous variable or a categorical variable, and whether at the end of the 2nd month or the 6th month of anti-tuberculosis treatment, a high PNI level was always an independent protective factor against adverse prognosis. However, it is worth noting that a statistically significant protective effect was only observed in T3 group with the highest PNI, indicating that there may be a “protective threshold” of PNI, and only reaching a relatively high nutritional and immune level can significantly improve the treatment outcome.
Analysis of Nonlinear Relationship Between PNI and Adverse Prognosis
Restricted Cubic Spline (RCS) analysis revealed a negative linear dose-response relationship between PNI and the risk of adverse prognosis at the end of the 2nd and 6th month follow-ups (P overall=0.025; P overall=0.015), with no evidence of a nonlinear relationship (P for nonlinear=0.64; P for nonlinear=0.06)(Figure 1).
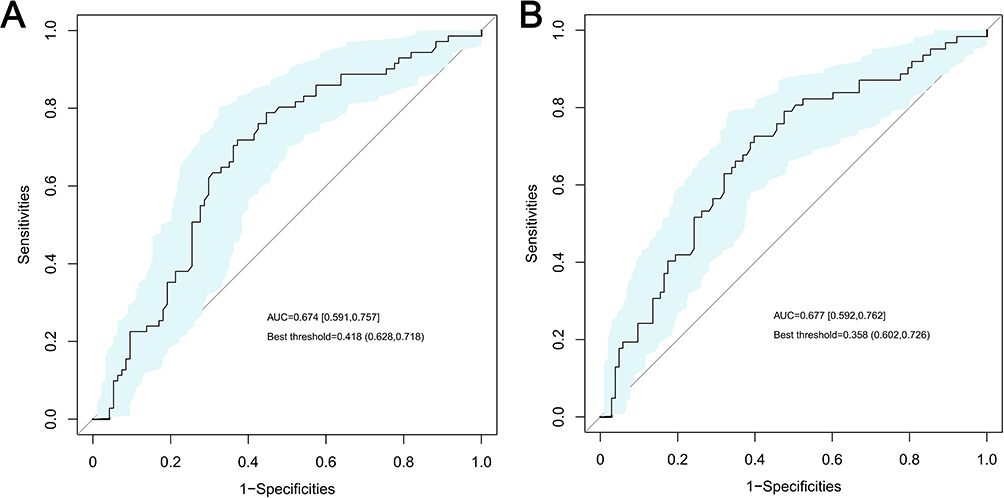 |
Figure 1 ROC curve of baseline PNI for predicting adverse prognosis in patients with newly diagnosed active pulmonary tuberculosis. Notes: The AUC and its 95% confidence interval were calculated using 1000 bootstrap resamples. The optimal cutoff value of the ROC curve is labeled in the figure, with corresponding optimal cutoff values of the original PNI being 44.85 and 42.6, respectively. (A) End of the 2nd month; (B) End of the 6th month. |
Screening of Significant Characteristics Related to Adverse Prognosis
With adverse prognosis as the dependent variable (assigned value: good prognosis=0, adverse prognosis=1), variables other than PNI were included in Lasso regression analysis to screen significant characteristics related to the risk of adverse prognosis at the end of the 2nd and 6th month, respectively (Figure 2). Ten-fold cross-validation was used to draw more robust conclusions, and the number of variables corresponding to Lambda.min was selected as the optimal result of this study.
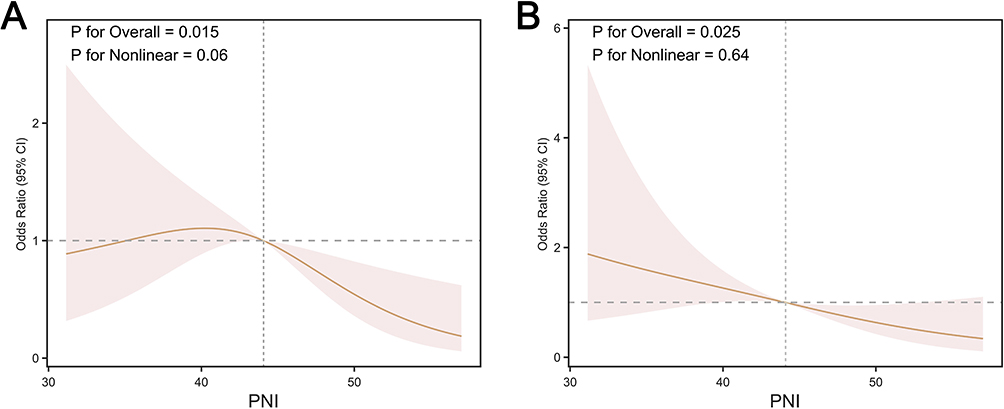 |
Figure 2 Restricted cubic spline (RCS) analysis of the association between PNI and adverse prognosis. Notes: (A) End of the 2nd month; (B) End of the 6th month. |
The results showed that 5 significant characteristics were screened out at the end of the 2nd month of anti-tuberculosis treatment (Lambda.min=−2.827), namely age, complicated with chronic obstructive pulmonary disease, CD4⁺T lymphocyte count, pulmonary cavity and PLR, and their corresponding β coefficients were: age: 0.004496; chronic obstructive pulmonary disease: 0.006830; CD4⁺T lymphocyte count: −0.000751; pulmonary cavity: 0.444538; PLR: 0.000193. Three significant characteristics were screened out at the end of the 6th month of anti-tuberculosis treatment (Lambda.min=−2.6), namely sputum culture, albumin and PLR, and their corresponding β coefficients were: sputum culture: 0.227337, albumin: −0.03434, PLR: 0.000242.
Two Logistic regression models were established based on the above screened significant characteristics. Subsequently, PNI was incorporated into the basic model to form a comprehensive model.
Impact of PNI on the Discrimination of the Basic Model
For the outcome of adverse prognosis at the end of the 2nd month, the AUC of the basic model was 0.743. The inclusion of PNI could significantly improve the discrimination of the basic model (AUC=0.789). The improvement of the discrimination of the basic model after including PNI (ΔAUC=0.046) was significant (NRI=0.396, 95% CI: 0.095–0.697, P=0.01; IDI=0.054, 95% CI: 0.019–0.089, P=0.003). For the outcome of adverse prognosis at the end of the 6th month, the AUC of the basic model was 0.748. The inclusion of PNI could slightly improve the discrimination of the basic model (AUC=0.763),after including PNI (ΔAUC=0.015) was not statistically significant (NRI=0.017, 95% CI: −0.197–0.411, P=0.49; IDI=0.001, 95% CI: −0.005–0.06, P=0.806) (Figure 3).
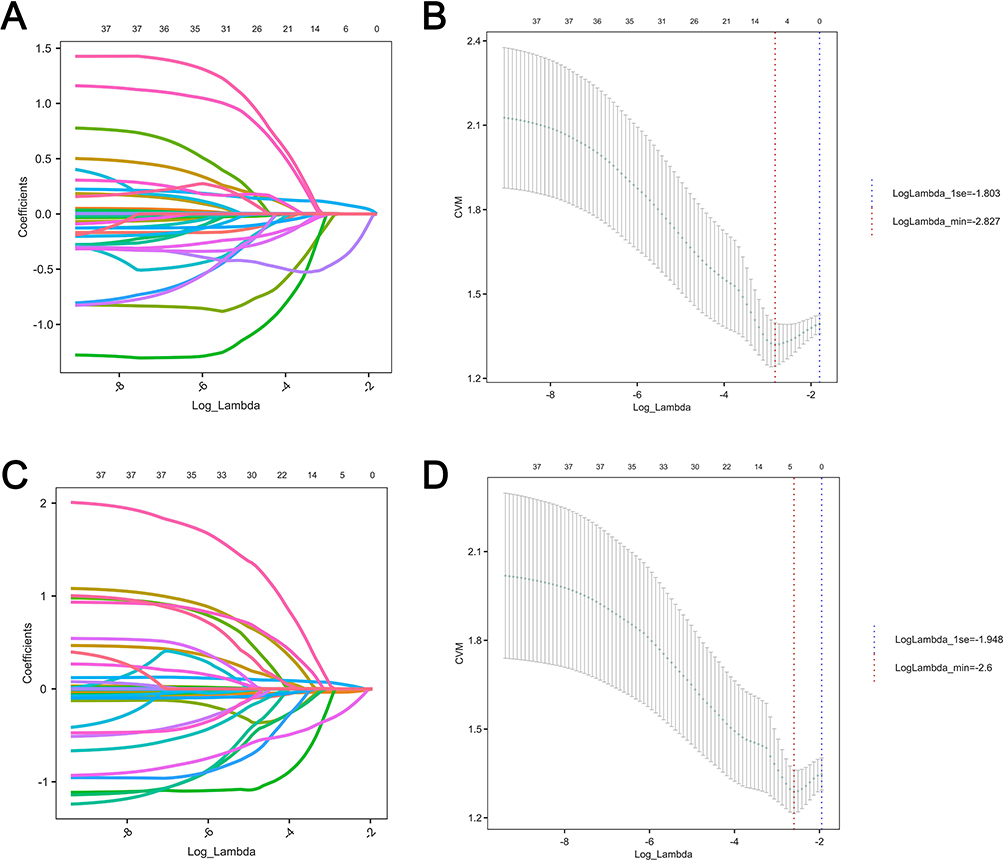 |
Figure 3 Variable selection for adverse prognosis using LASSO regression analysis. Notes: (A) shows variable selection at the end of the 2nd month; (C) shows variable selection at the end of the 6th month; (B) shows the model at the 2nd month (λ.min = −2.827, 5 variables); (D) shows the model at the 6th month (λ.min = −2.6, 3 variables). |
However, ROC analysis showed that PNI as a single continuous variable had good predictive performance for adverse prognosis at both the end of the 2nd month and the 6th month of anti-tuberculosis treatment (AUC > 0.75).
Impact of PNI on the Calibration of the Basic Model
For adverse prognosis of anti-tuberculosis treatment at the end of the 2nd month, the calibration of the new model incorporating PNI (Brier score=0.181) was improved compared with the basic model (Brier score=0.19). For adverse prognosis of anti-tuberculosis treatment at the end of the 6th month, the calibration of the new model was slightly improved compared with the basic model (ΔBrier score=0.001).The model at both time points still had good calibration (both Brier scores < 0.25) (Figure 4).
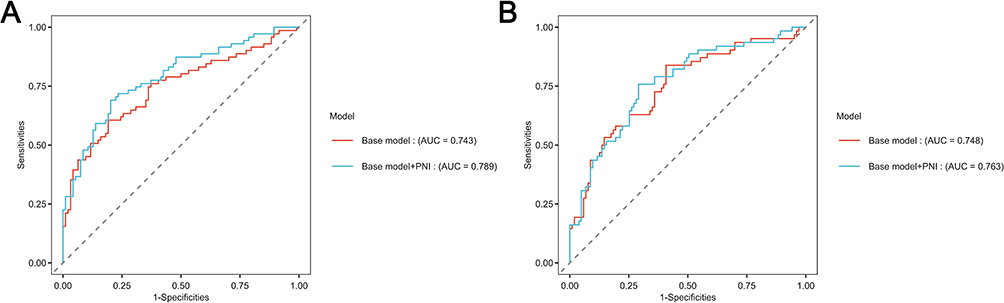 |
Figure 4 ROC curves of the prediction model for adverse prognosis based on PNI. Notes: (A) End of the 2nd month; (B) End of the 6th month. |
Impact of PNI on the Clinical Utility of the Basic Model
Decision curve analysis showed that at the end of the 2nd month of anti-tuberculosis treatment, the new model incorporating PNI had higher clinical net benefit than the basic model under a certain threshold probability;at the end of the 6th month, the improvement by including PNI was not obvious (Figure 5).
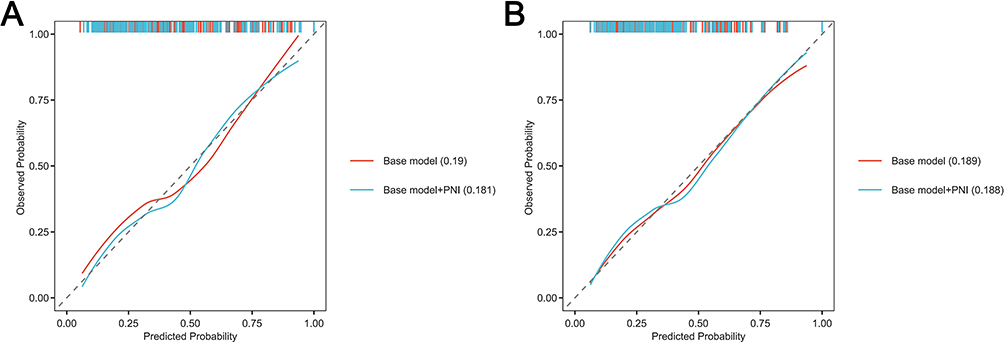 |
Figure 5 Calibration curves of the prediction model for adverse prognosis based on PNI. Notes: (A) End of the 2nd month; (B) End of the 6th month. |
Model Performance Evaluation and Summary
To assess the stability and generalizability of the established model, internal validation was performed via 1000 bootstrap resamplings, and the model performance indicators were summarized. As shown in Table 7, for predicting adverse prognosis at 2 months, the combined model incorporating PNI yielded an AUC of 0.789 (95% CI: 0.718–0.860), an accuracy of 0.752, and a positive predictive value (PPV) of 0.721 (95% CI: 0.628–0.859), all of which were superior to those of the basic model (AUC = 0.743, accuracy = 0.727, PPV = 0.610). When predicting adverse prognosis at 6 months, the combined model achieved an AUC of 0.763 (95% CI: 0.687–0.839), an accuracy of 0.727 and a PPV of 0.610, with only a slight improvement. These findings indicated that PNI exhibited more prominent incremental predictive value for short-term prognosis.
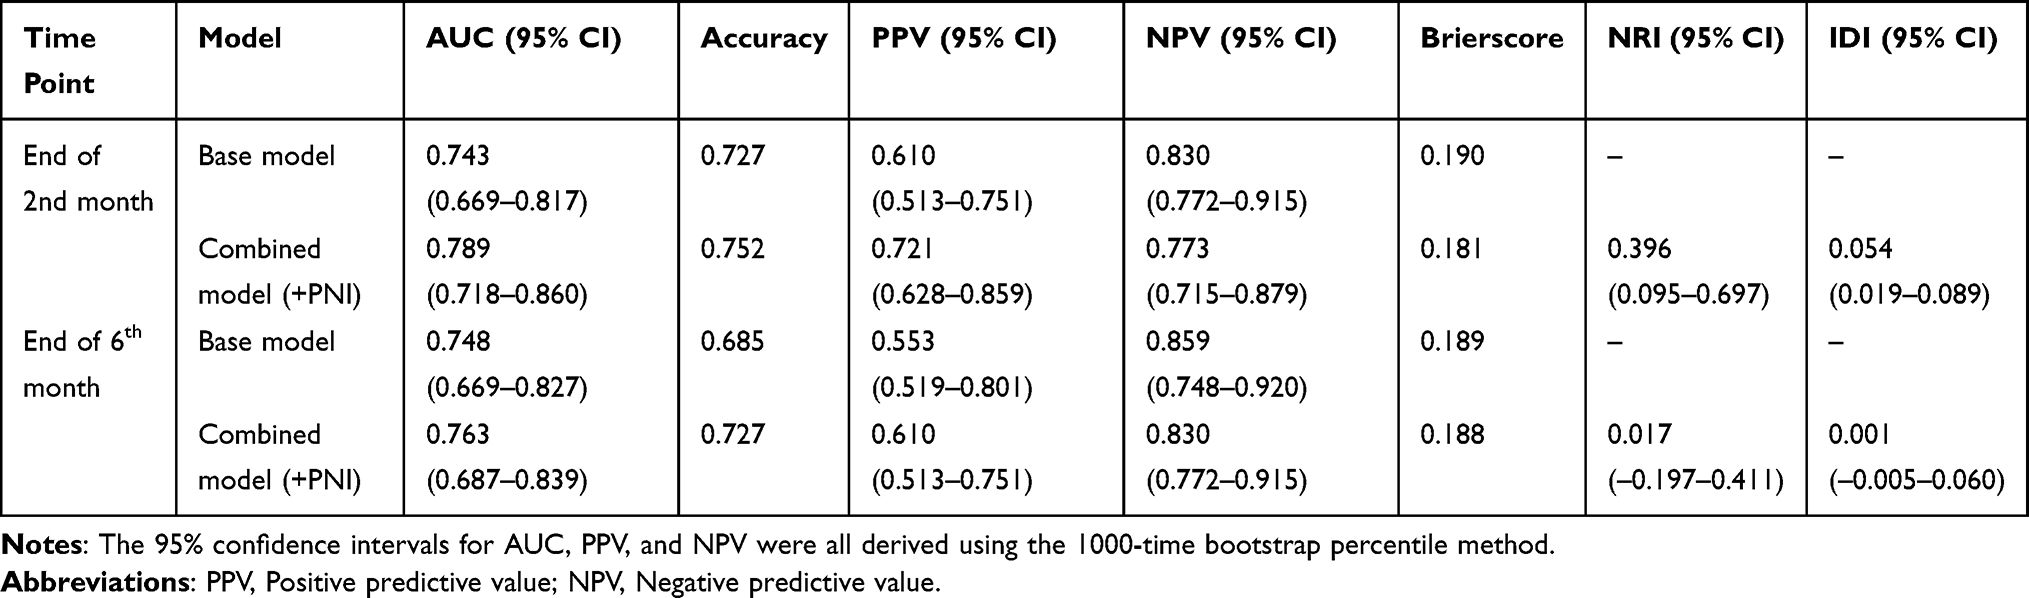 |
Table 7 Model Performance Metrics and Summary Table Based on 1000-Time Bootstrap Internal Validation |
Nomogram of the Prediction Model
A nomogram was established based on the variables of the new model at the end of the 2nd month:COPD, Age, pulmonary cavity, CD4⁺T lymphocyte count and PLR. Taking Figure 6 as an example, the total score of a tuberculosis patient summed up from each predictive variable was 2.11, and the risk probability of adverse prognosis of anti-tuberculosis treatment at the end of the 2nd month was inferred to be 39.8% according to the model calculation. A nomogram was plotted based on the variables of the new model at the end of the 6th month: sputum culture, PLR and ALB.Similarly, as shown in Figure 7, for a randomly selected tuberculosis patient, the total score summed from the above 3 independent variables and PNI was −1.52, and the risk probability of adverse prognosis of anti-tuberculosis treatment at the end of the 6th month was inferred to be 48.7% (Figure 8).
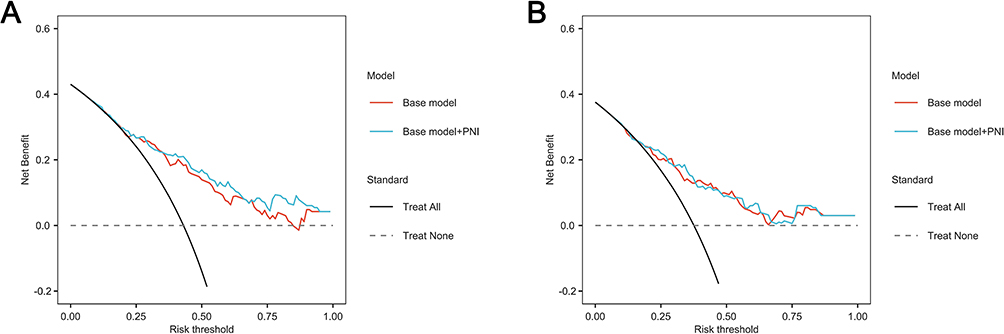 |
Figure 6 Decision curve analysis (DCA) of the prediction model for adverse prognosis based on PNI. Notes: (A) End of the 2nd month; (B) End of the 6th month. |
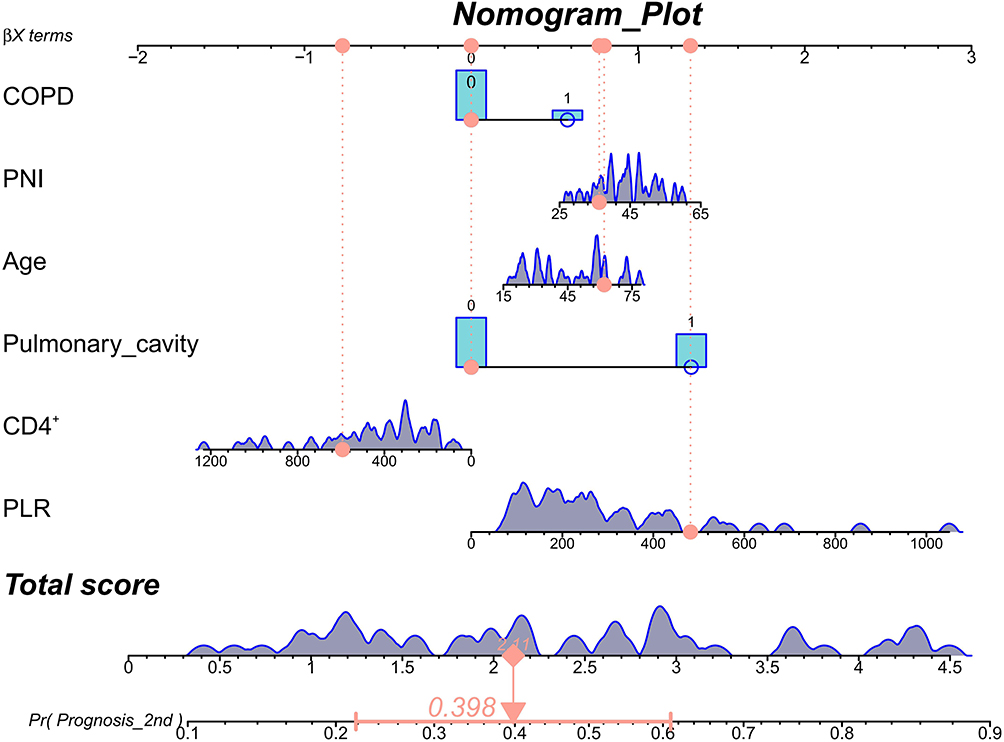 |
Figure 7 Nomogram for predicting adverse prognosis at the end of the 2nd month. |
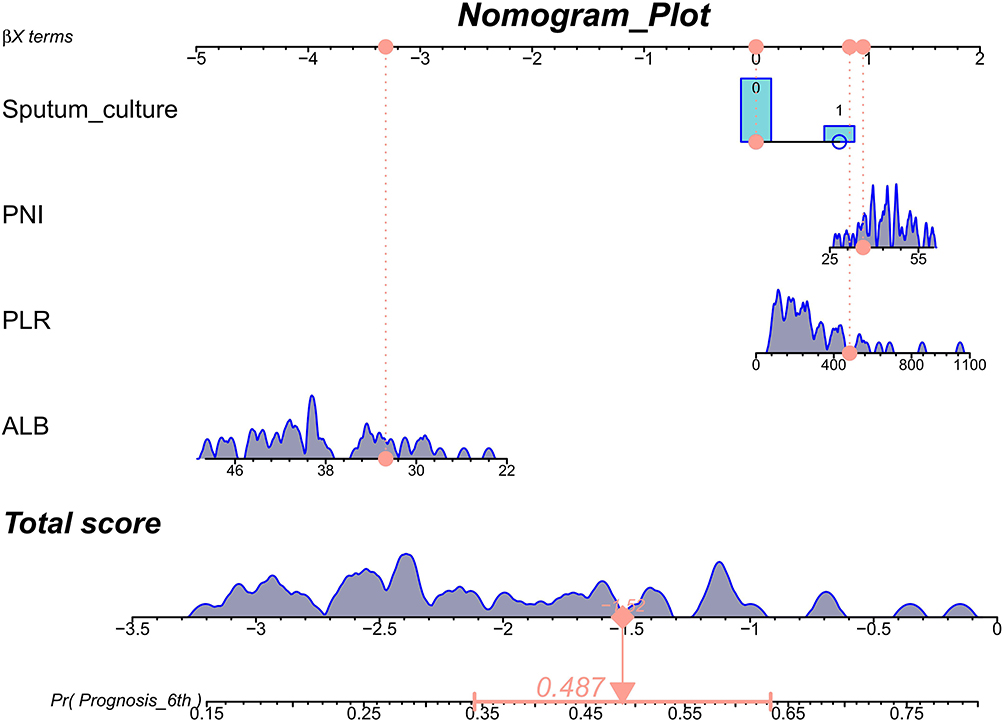 |
Figure 8 Nomogram for predicting adverse prognosis at the end of the 6th month. |
In conclusion, it was found from the nomogram model that at the end of the 2nd month of anti-tuberculosis treatment, the lower the PNI level, the older the age, the complicated with chronic obstructive pulmonary disease, pulmonary cavity, the lower the CD4⁺T lymphocyte count and the higher the PLR, the higher the probability of adverse prognosis in tuberculosis patients at the end of the 2nd month. At the end of the 6th month of anti-tuberculosis treatment, patients with positive sputum culture, higher PLR and lower albumin had a higher probability of adverse prognosis.
Discussion
Pulmonary tuberculosis remains a major global public health priority. At present, China has achieved overall tuberculosis control and yielded remarkable results through strategies such as full-course directly observed chemotherapy, as well as case reporting and referral systems.19 Nevertheless, patients with active pulmonary tuberculosis present substantial heterogeneity in clinical manifestations and disease progression, and their prognosis is affected by multiple factors. Therefore, it is necessary to identify high-risk populations at the early stage of treatment to enable timely clinical intervention.Based on a single-center retrospective cohort analysis, this study explored the correlation between PNI and adverse prognosis in patients with newly diagnosed active pulmonary tuberculosis undergoing anti-tuberculosis treatment, and constructed and validated a risk prediction model for adverse prognosis. The aim is to provide a practical and convenient clinical tool that enables clinicians to promptly identify, manage and treat pulmonary tuberculosis patients with high nutritional risk, especially under the condition of limited nutritional risk screening resources. We adopted a nomogram to visualize the risk prediction model.
Previous studies have confirmed that age, complicated chronic obstructive pulmonary disease (COPD), and pulmonary cavity are independent risk factors for adverse prognosis.19,20 In terms of immunological indicators, the decrease in CD4⁺T lymphocyte count is negatively correlated with poor prognosis in pulmonary tuberculosis patients, suggesting that impaired cellular immune function is an important biological basis for adverse outcomes.21 Hematological inflammatory indicators, such as the platelet-to-lymphocyte ratio (PLR), have also been verified to be associated with the formation of pulmonary tuberculosis cavities22 and affect the prognosis of tuberculosis patients. In the late stage of treatment, positive sputum culture and decreased serum albumin level also indicate poor treatment efficacy and predict adverse outcomes.23,24 In the baseline data comparison of this study, it was also found that patients in the low PNI group were characterized by older age, lower albumin level, higher bacterial load, more comorbidities, and higher inflammatory level, which were consistent with the results of the above studies.
As an indicator comprehensively evaluating the nutritional status and immune function of patients, the Prognostic Nutritional Index (PNI) has important clinical significance in the application of pulmonary tuberculosis patients. Ma et al11 conducted a prospective cohort study involving 1075 treatment-naive hospitalized pulmonary tuberculosis patients. The nutritional status of tuberculosis patients at admission was evaluated using indicators such as PNI, followed by a one-year follow-up observation. The study found that severe malnutrition assessed by PNI was an independent risk factor for all-cause mortality within one year in tuberculosis patients (HR: 2.94, 95% CI: 1.76–4.88, P<0.001). Tan et al13 pointed out that PNI has good discriminative ability for predicting adverse prognosis in newly diagnosed pulmonary tuberculosis patients, with the area under the receiver operating characteristic curve (AUC) reaching 0.862 (95% CI: 0.805–0.920, P<0.001). Tsukahara et al25 discovered that for each 1-unit decrease in PNI, the mortality risk of non-HIV pulmonary tuberculosis patients increased by 14% (HR=0.86, 95% CI: 0.82–0.91, P<0.001). Our findings are consistent with the above view: low PNI serves as an independent risk factor for adverse outcomes in patients with newly diagnosed active pulmonary tuberculosis during anti-tuberculosis treatment, and is linearly and negatively correlated with poor prognosis.Nevertheless, previous studies have adopted the overall therapeutic efficacy as a single endpoint without distinguishing differences between the intensive phase and maintenance phase of treatment. In the present study, we further extended the predictive value of PNI to the specific population of patients with newly diagnosed active pulmonary tuberculosis. Moreover, we established prediction models at two key time points—the intensive phase (end of month 2) and the maintenance phase (end of month 6)—for the first time in the same cohort.
In recent years, the application of the Prognostic Nutritional Index (PNI) in the field of tuberculosis has expanded from patients with ordinary pulmonary tuberculosis to special populations such as drug-resistant tuberculosis, comorbid patients, and critically ill cases. Hu et al26 conducted a large-sample retrospective study involving 524 patients with multidrug-resistant/rifampicin-resistant tuberculosis (MDR/RR-TB), and identified low PNI as an independent risk factor for all-cause mortality (AUC = 0.783). The combined use of the HALP score, PNI, and CONUT score further increased the predictive AUC to 0.811. Unlike the study by Hu et al, which focused on drug-resistant tuberculosis populations, the present study targeted drug-naïve patients with newly diagnosed active pulmonary tuberculosis, filling the research gap of comprehensive predictive models based on PNI in this specific population. Liu et al27 developed and internally validated a nomogram for predicting adverse treatment outcomes in patients with pulmonary tuberculosis complicated by diabetes mellitus (PTB-DM, AUC = 0.885). The model incorporated four predictors: age, BMI, pulmonary cavity, and glucose-to-lymphocyte ratio, and was confirmed to yield significant net clinical benefit. Rather than focusing on a single comorbidity as reported by Liu et al, the model established in our study included multi-dimensional predictive variables such as age, comorbid COPD, CD4⁺ T lymphocyte count, pulmonary cavity, and PLR, which can more comprehensively reflect the integrated risk profile of patients with newly diagnosed active pulmonary tuberculosis.Yuan et al12 demonstrated that the combination of PNI and the Day 3 APACHE II score upon ICU admission could effectively predict the 30-day mortality of critically ill tuberculosis patients (AUC = 0.952), and they further established a quantitative predictive formula: PA3 = APACHE II score × 0.421 − PNI × 0.204. Different from Yuan’s study focusing on short-term mortality as the primary endpoint, our research concentrated on therapeutic outcomes during anti-tuberculosis treatment.Notably, our results revealed that the incremental predictive value of PNI for short-term prognosis (at the end of the 2nd month, ΔAUC = 0.046, NRI = 0.396) was markedly superior to that for long-term prognosis (at the end of the 6th month, ΔAUC = 0.015, NRI = 0.017). This discrepancy may reflect the distinct pathophysiological characteristics across different stages of anti-tuberculosis therapy.The intensive phase represents the critical period of confrontation between the host immune system and Mycobacterium tuberculosis. As PNI integrates serum albumin and lymphocyte count, it directly mirrors the host’s nutritional status and cellular immune function. Accordingly, the baseline PNI level at the early stage of anti-tuberculosis treatment can reflect the efficacy of the immune system in eliminating Mycobacterium tuberculosis and the degree of inflammatory injury. In contrast, treatment outcomes in the maintenance phase are more influenced by medication adherence, management of adverse drug reactions, long-term control of comorbidities, and socioeconomic factors.This finding also suggests that the optimal window for nutritional and immunological intervention may lie within the first two months of anti-tuberculosis treatment.
In this study, ROC curve analysis was used to evaluate the predictive value of PNI, and the optimal cut-off value was determined according to the maximum Youden index. The optimal cut-off value of PNI for predicting adverse prognosis at the end of the second month was approximately 40.5, with a sensitivity of 0.78 and a specificity of 0.72.Accordingly, clinicians may categorize patients with PNI < 40 as a high-risk group. For these individuals, systematic nutritional risk assessment (eg, NRS 2002) should be performed upon admission, and individualized nutritional support should be initiated, including a high-protein and high-energy diet, oral nutritional supplements, and parenteral nutrition when necessary. Meanwhile, follow-up frequency should be intensified within the first two months of anti-tuberculosis treatment, with sputum smear, sputum culture and chest imaging examinations reviewed every two weeks. For patients complicated with hypoalbuminemia (ALB < 30 g/L), short-term human albumin supplementation may be considered.Nevertheless, these recommendations are based on single-center retrospective data and have not been validated by prospective intervention trials; therefore, clinical application should be individualized according to each patient’s condition.
As a single-center retrospective cohort study, the present research has several limitations.(1) First, the retrospective design cannot completely eliminate the influence of residual confounding. Unmeasured variables, such as socioeconomic status, family support system, actual medication adherence, serum concentrations of anti-tuberculosis drugs, and detailed dietary intake, may affect both PNI levels and treatment outcomes simultaneously, thereby causing bias in effect size estimation.(2) Second, all enrolled participants were inpatients from the Department of Infectious Diseases of Suining Central Hospital, which may lead to selection bias toward critically ill patients. Accordingly, the findings may not be directly applicable to the following populations: ① mild or asymptomatic pulmonary tuberculosis patients treated in outpatient or primary healthcare settings; ② home-based patients enrolled in community tuberculosis management programs; ③ patients in rural or remote areas with poor medical accessibility and a higher prevalence of malnutrition. In addition, patients with retreated tuberculosis, drug-resistant tuberculosis, HIV co-infection, malignant tumors, and autoimmune diseases were excluded from this study; hence, the established model is not suitable for these special populations.(3) Finally, the sample size of this study was relatively limited. The model exhibited good performance only in internal validation, without external validation. Therefore, further prospective external validation is required in multicenter cohorts, medical institutions at different levels, and populations from diverse regions, to evaluate the generalizability and calibration stability of the model.
Conclusions and Prospects
In conclusion, based on single-center retrospective data,this study conducted and validated a PNI-based nomogram model for predicting adverse prognosis of anti-tuberculosis treatment in treatment-naive patients with active pulmonary tuberculosis. The results showed that PNI acts as an independent protective factor against adverse outcomes during anti-tuberculosis treatment in this patient population, with a superior incremental predictive value for short-term prognosis (at the end of the 2nd month) compared with long-term prognosis (at the end of the 6th month).The nomogram established using PNI together with age, chronic obstructive pulmonary disease, CD4⁺ T cell count, pulmonary cavity and PLR exhibited good discriminative ability and calibration in internal validation. This model is expected to assist clinicians in identifying high-risk patients early and initiating individualized nutritional and immunological interventions.Nevertheless, external validation is still required before its widespread clinical application.
Funding
Sichuan Provincial Youth Innovation Project in Medical Research: Clinical Application of Nutritional Risk Screening in Tuberculosis Patients (Q17077).
Disclosure
The authors report no conflicts of interest in this work.
References
1. Global tuberculosis report 2024. World Health Organization; 2024. Available from: https://www.who.int/teams/global-tuberculosis-programme/tb-reports/global-tuberculosis-report-2024.
2. Liu K, Zhang M, Luo D, et al. Influencing factors of treatment outcomes among patients with pulmonary tuberculosis: a structural equation model approach. Psychol Res Beha Manage. 2023;16:2989–16. doi:10.2147/PRBM.S419906
3. Liu QX, Tang DY, Xiang X, et al. Associations between nutritional and immune status and clinicopathologic factors in patients with tuberculosis: a comprehensive analysis. Front Cell Infect Microbiol. 2022;12:1013751. doi:10.3389/fcimb.2022.1013751
4. Onodera T, Goseki N, Kosaki G. Prognostic nutritional index in gastrointestinal surgery of malnourished cancer patients. Nihon Geka Gakkai Zasshi. 1984;85(9):1001–1005.
5. Li J, Zhu N, Wang C, et al. Preoperative albumin-to-globulin ratio and prognostic nutritional index predict the prognosis of colorectal cancer: a retrospective study. Sci Rep. 2023;13:17272. doi:10.1038/s41598-023-43391-5
6. Niu Z, Yan B. Prognostic and clinicopathological effect of the prognostic nutritional index (PNI) in patients with cervical cancer: a meta-analysis. Ann Med. 2023;55(2):2288705. doi:10.1080/07853890.2023.2288705
7. Ellez HI, Keskinkilic M, Semiz HS, et al. The prognostic nutritional index (PNI): a new biomarker for determining prognosis in metastatic castration-sensitive prostate carcinoma. J Clin Med. 2023;12(17):5434. doi:10.3390/jcm12175434
8. Zhang X, Zhang J, Liu F, et al. Prognostic nutritional index (PNI) as a predictor in patients with metabolic syndrome and heart failure. Diabetes Metabolic Syndrome Obesity. 2023;16:2503–2514. doi:10.2147/DMSO.S420924
9. Akkuzu MZ, Altıntaş E, Yaraş S, et al. Controlling nutritional status (CONUT) score and prognostic nutritional index (PNI) are good candidates for prognostic markers for acute pancreatitis. Medicina. 2022;59(1):70. doi:10.3390/medicina59010070
10. Wang XL, Li GZ, Xu H, et al. Study on the relationship between prognostic nutritional index and disease activity in patients with systemic lupus erythematosus. J Xinjiang Med Univ. 2020;43(1):58–62. doi:10.3969/j.issn.1009-5551.2019.01.015
11. Ma JJ, Guo YJ, Li Z, et al. Prevalence and prognostic significance of malnutrition risk in patients with pulmonary tuberculosis: a hospital-based cohort study. Front Public Health. 2022;10:1039661. doi:10.3389/fpubh.2022.1039661
12. Yuan Q, Li W, Yang K, Guo J, Zheng Y. Predictive mortality of the prognostic nutritional index combined with APACHE II score for critically ill tuberculosis patients. Am J Trop Med Hyg. 2024;111(5):1027–1033. doi:10.4269/ajtmh.23-0661
13. Tan J, Shi X, Pi Y, et al. Nutritional scores predict the prognosis of patients with pulmonary tuberculosis. Front Nutr. 2024;11:1454207. doi:10.3389/fnut.2024.1454207
14. Wang LX, Cheng SM, Zhou L. Health industry standard of the People’s Republic of China: Diagnosis of pulmonary tuberculosis: WS 288-2017. Chin J Infect Control. 2018;17(7):642–652. doi:10.3969/j.issn.1671-9638.2018.07.019.
15. Deng GF, Lu XW. Expert consensus on the standard and clinical application of activity judgment of pulmonary tuberculosis. Chin J Antituberculosis. 2020;42(4):301–307. doi:10.3969/j.issn.1000-6621.2020.04.001
16. Sun Y, Ji H, Sun W, et al. Triglyceride glucose (TyG) index: a promising biomarker for diagnosis and treatment of different diseases. Eur J Internal Med. 2025;131:3–14. doi:10.1016/j.ejim.2024.08.026
17. Tu HZ, Lai TJ, Chen YS, et al. Hematological parameters as potential markers for distinguishing pulmonary tuberculosis from genitourinary tuberculosis. Pathogens. 2023;12(1):84. doi:10.3390/pathogens12010084
18. Chen XL, Xue L, Wang W, et al. Prognostic significance of the combination of preoperative hemoglobin, albumin, lymphocyte and platelet in patients with gastric carcinoma: a retrospective cohort study. Oncotarget. 2015;6(38):41370–41382. doi:10.18632/oncotarget.5629
19. Li SL, Tao Y, He RH, et al. Retrospective cohort study on influencing factors of adverse prognosis in young and middle-aged patients with pulmonary tuberculosis. J Public Health Prevent Med. 2024;35(2):137–140. doi:10.3969/j.issn.1006-2483.2024.02.031
20. Li YL, Ren ZY, Xie SS, et al. Analysis of related risk factors for adverse treatment outcomes in patients with pulmonary tuberculosis. Chin J Infect Dis. 2022;40(10):620–624. doi:10.3760/cma.j.cn311365-20211208-00432
21. Han YF, Zhang CZ, Lu XN, et al. Detection significance of T lymphocyte subsets and serum CRP, TNF-α, INF-γ in patients with pulmonary tuberculosis. J Med Pest Control. 2024;40(11):1132–1135,1140.
22. Nakao M, Muramatsu H, Arakawa S, et al. Immunonutritional status and pulmonary cavitation in patients with tuberculosis: a revisit with an assessment of neutrophil/lymphocyte ratio. Respir Investig. 2019;57(1):60–66. doi:10.1016/j.resinv.2018.08.007
23. Zeng QQ, Wang WH, Tong ZW, et al. Correlation analysis between pulmonary cavity formation and immune and nutritional status in patients with pulmonary tuberculosis. Chin J Clin Infect Dis. 2021;14(5):358–363. doi:10.3760/cma.j.issn.1674-2397.2021.05.004
24. Peng YZ, Li HY. Analysis of risk factors affecting prognosis of elderly patients with pulmonary tuberculosis and nursing countermeasures. Nurs Pract Res. 2019;16(22):66–67. doi:10.3969/j.issn.1672-9676.2019.22.027
25. Tsukahara T, Horita N, Tashiro K, et al. Factors for predicting outcomes among non-HIV patients with pulmonary tuberculosis. Internal Med. 2017;56(24):3277–3282. doi:10.2169/internalmedicine.9120-17
26. Hu S, Guo J, Chen Z, Gong F, Yu Q. Nutritional indices predict all cause mortality in patients with multi-/rifampicin-drug resistant tuberculosis. Infect Drug Resist. 2024;17:3253–3263. doi:10.2147/IDR.S457146
27. Liu M, Li T, Liu H, Song F, Zhou L, Zhang W. Development and validation of a nomogram for predicting unfavorable treatment outcomes in patients with pulmonary tuberculosis and diabetes mellitus. Front Med. 2026;13:1722736. doi:10.3389/fmed.2026.1722736
 © 2026 The Author(s). This work is published and licensed by Dove Medical Press Limited. The
full terms of this license are available at https://www.dovepress.com/terms
and incorporate the Creative Commons Attribution
- Non Commercial (unported, 4.0) License.
By accessing the work you hereby accept the Terms. Non-commercial uses of the work are permitted
without any further permission from Dove Medical Press Limited, provided the work is properly
attributed. For permission for commercial use of this work, please see paragraphs 4.2 and 5 of our Terms.
© 2026 The Author(s). This work is published and licensed by Dove Medical Press Limited. The
full terms of this license are available at https://www.dovepress.com/terms
and incorporate the Creative Commons Attribution
- Non Commercial (unported, 4.0) License.
By accessing the work you hereby accept the Terms. Non-commercial uses of the work are permitted
without any further permission from Dove Medical Press Limited, provided the work is properly
attributed. For permission for commercial use of this work, please see paragraphs 4.2 and 5 of our Terms.