Back to Journals » International Journal of General Medicine » Volume 16
No Association Between Ct Value and COVID-19 Severity and Mortality in Qatar
Authors Jemmieh K, Tawengi M ![]() , Alyaarabi T
, Alyaarabi T ![]() , Hassona A, Ghoul I, Al Abdulla S, Elzawawi KE
, Hassona A, Ghoul I, Al Abdulla S, Elzawawi KE ![]() , Karen O, Doi SA, Chivese T
, Karen O, Doi SA, Chivese T ![]()
Received 23 January 2023
Accepted for publication 13 July 2023
Published 16 November 2023 Volume 2023:16 Pages 5323—5331
DOI https://doi.org/10.2147/IJGM.S404696
Checked for plagiarism Yes
Review by Single anonymous peer review
Peer reviewer comments 4
Editor who approved publication: Dr Scott Fraser
Khaleed Jemmieh,* Mohamed Tawengi,* Tamader Alyaarabi,* Aseel Hassona,* Ikhlas Ghoul,* Sara Al Abdulla,* Khaled E Elzawawi,* Omar Karen,* Suhail A Doi, Tawanda Chivese
Department of Population Medicine, College of Medicine, QU Health, Qatar University, Doha, Qatar
*These authors contributed equally to this work
Correspondence: Tawanda Chivese, Department of Population Medicine, College of Medicine, QU Health, Qatar University, PO Box 2713, Doha, Qatar, Email [email protected]
Background: The association between the cycle threshold (Ct) which reflects the SARS-CoV-2 viral load and the severity of COVID-19 is still not clear. We investigated the association between Ct values, symptoms and the risk of ICU admission and mortality from COVID-19 in Qatar.
Methods: This case–control study used data of hospitalized individuals with confirmed COVID-19 during the period March to September 2020. Cases were defined as individuals with confirmed COVID-19 who were admitted to the intensive care unit (ICU) or died and controls as those who were not admitted to the ICU. The association between Ct value, symptoms, ICU admission and mortality was investigated using Ct value as a categorical variable (below and above 25) in multivariable regression models and adjusted for relevant confounders.
Results: A total of 622 participants with median age 53 (IQR: 53– 63), of which 69% were males, were included. There were 236 ICU admissions and 111 deaths. When categorized, Ct value (< 25 vs ≥ 25) had no association with the odds of ICU admission (OR 0.85, 95% CI 0.56 to 1.29) or odds of mortality (OR 1.21, 95% CI 0.71 to 2.08). Respiratory (OR 2.95, 95% CI 1.57 to 5.56) and gastrointestinal symptoms (OR 1.99, 95% CI 1.18 to 3.35) were associated with higher odds of ICU admission. Similarly, respiratory (OR 4.96, 95% CI 1.10 to 22.43) and gastrointestinal symptoms (OR 3.17, 95% CI 1.29 to 7.84) were associated with higher odds of mortality.
Conclusion: Although RT-PCR Ct has good diagnostic value, its prognostic value appears to be unreliable. Respiratory and gastrointestinal symptoms are associated with COVID-19 criticality and mortality in this setting.
Keywords: COVID-19, Ct-value, RT-PCR, symptoms, Qatar Biobank, QBB
Introduction
Despite the widespread implementation of vaccines and increasing population immunity from previous infection,1 there are groups who are still vulnerable to severe COVID-19. These groups include the unvaccinated, the elderly, the immunosuppressed and individuals with pre-existing chronic diseases.2,3 It remains imperative to identify individuals at risk of severe outcomes, and this may be done by using appropriate prognostic clinical tools.4
One of the prognostic tools that has been suggested is the viral load at the diagnosis of COVID-19, which can be inferred from the cycle threshold (Ct value) results of the reverse transcriptase-polymerase chain reaction (RT PCR).5 The RT-PCR is a standard tool to detect SARS-CoV-2 RNA6 and cycle threshold (Ct) values indicate the number of amplification cycles of viral RNA required for the fluorescent signal to cross the threshold. Ct values are inversely correlated with the amount of viral load (RNA). Thus, the higher the Ct value, the lower the amount of viral RNA i.e., low viral load.7
Although the Ct value in RT-PCR SARS-CoV-2 has shown some potential as a marker for severe disease in patients with COVID-19 illness,8,9 the data are not conclusive.10 One systematic review of 14 studies found an association between Ct value and COVID-19 severity in 8 studies while the remaining 6 studies did not find this association.5 Other studies, not included in the above review have also reported no association.11–14
An alternative prognostic variable that has been suggested by many researchers are symptoms at presentation, although, again, there is no consensus. One meta-analysis found that cough, dyspnoea, fatigue, fever, and gastrointestinal symptoms were prognostic for severe COVID-19 disease severity, but not with headache, muscle ache, and sore throat.15 Another meta-analysis found an association between dyspnoea and COVID-19 severity.16 However, other studies have reported differing results17,18 and more research is still needed to understand the prognostic value of symptoms in relation to COVID-19 severity.
Although there is reduced use of the RT-PCR for testing for SARS-CoV-2 due to the introduction and widespread use of lateral flow tests,19 the PCR is still used as the main confirmatory test in clinical settings.6 It is still unclear whether, apart from its diagnostic value, the Ct value is useful in predicting the severity of COVID-19, and thus, aiding in triaging patients.10 The situation is similar for symptoms, since COVID-19 is characterized by heterogenous symptomatic presentation of patients and clinicians would benefit from knowing which symptoms indicate a higher possibility of severe COVID-19 when a patient presents.20 Further, research on these topics is scarce in the Middle East and North Africa region, where determinants of COVID-19 severity may be different to those reported in the other regions. The main aim of this study was to investigate the association of both RT-PCR Ct values and symptoms with ICU admission and mortality in individuals hospitalized with COVID-19.
Methods
Study Design and Participants
We conducted a case–control study with data obtained from Qatar Biobank (QBB). The inclusion criteria were testing positive for COVID-19 based on RT-PCR and age ≥50, since older age is associated with higher risk of severe COVID-19. We excluded individuals with missing Ct values data on ICU-admissions. In the primary analysis, the cases were all adults diagnosed with COVID-19 who were ICU-admitted due to severe COVID-19 infection, whereas the controls were non-ICU-admitted adult patients diagnosed with COVID-19. In the secondary analysis, the cases were patients diagnosed with COVID-19 who died inside the hospital, whereas the controls were all COVID-19 patients who did not die.
Sample Size and Sampling Methods
The sample available for this study was limited to the data that were available to the QBB in their cohort of COVID-19 participants at the time the study was conducted. At the time this study was conducted, the QBB only had 622 participants, out of which 236 were admitted to the ICU and the remaining 386 were not admitted into the ICU. A total sampling approach was therefore used, as the study sought to evaluate multiple associations. Retrospective power calculations suggested that a sample size of 2822 would have been required to detect a statistically significant association between Ct value ≤25 and ICU or mortality. Notably, the effect sizes observed in this study did not suggest meaningful associations between Ct value ≤25 and ICU or mortality and any increase in sample size was unlikely to change this as it could only impact the p-values. However, there was no need for retrospective power calculation for the associations between symptoms and both ICU admission and mortality as the current sample size was enough to detect significant associations.
Data Collection
Data were collected by using two methods: first, through a face-to-face questionnaire in an electronic format using the in-house developed clinical information system (Onyx) by trained QBB staff.2 Second, by accessing QBB participants’ medical records from MoPH and HMC. All participants were Qatar residents, diagnosed with COVID-19 and able to communicate in Arabic, English, Hindi, and Urdu; recruited at the main COVID-19 hospitals and isolation centers in Doha, Qatar, from March until September 2020. Consented participants were followed up on a weekly basis until recovery, and then on a monthly basis for a year.
Ct Values
Ct values were measured from the RT PCR using the thermocycler machine. The Ct value was calculated using a computer and was defined as the number of nucleic acid replication cycles required for the fluorescent signal to cross the threshold. All samples used in the assay were obtained from the nasopharynx. One single sample was taken from each individual at the time of admission to the healthcare. We categorized the Ct values into two groups: low viral load (Ct ≥ 25) and high viral load (Ct < 25).
RT-PCR Platforms and Thermal Cycling Ct Kinetics
All assays were validated in line with College of American Pathologists (CAP) accreditation standards and analyzed for comparative amplification kinetics of each gene target. Both automated and manual platforms were used to quantify Ct values. Two automated platforms were used, which are Roche cobas 6800 using the cobas SARS-CoV-2 Test amplifying E and orf1a/b genes (Roche) and the Xpert Xpress SARS-CoV-2 amplifying the E and N genes (Cepheid). The manual platforms used the EZ1 (Qiagen) and QIAsymphony (Qiagen) extraction processes with thermal cycling provided by the TaqPath PCR COVID-19 Combo Kit, amplifying the N, S and orf1a/b genes (Thermo Fisher Scientific), on ABI 7500 thermal cyclers (Thermo Fisher Scientific). SARS-CoV-2 results were reported by use of pre-determined gene cut-offs of the respective kit.21
Symptoms
Symptoms were documented by the QBB staff and extracted from the patient charts. We grouped the different sets of symptoms by system, ie, respiratory, gastrointestinal (GI), and systemic. Upper Respiratory symptoms were cough, sore throat, and runny nose. Lower respiratory symptoms were dyspnoea, wheezing, and chest pain. Systemic symptoms were fever, chills, fatigue, muscle ache, headache, and anosmia. GI symptoms were nausea and/or vomiting. It was not clear how many symptoms were present before admission.
Statistical Analysis
Descriptive statistics were presented as means and standard deviations (SD) for normally distributed data or medians and IQRs for data with skewed distribution. Categorical variables were presented as frequencies and percentages and were compared using Chi-squared and Fisher's exact tests as appropriate. Mean values were compared using unpaired t-test and ANOVA as needed. Mann–Whitney U-test was used to compare continuous variables for independent groups. A two-tailed p-value less than 0.05 was considered statistically significant.
To investigate the association of categorical Ct value with ICU admission, we conducted a multivariable logistic regression model and adjusted for age, sex, CVD, chronic lung disease, CKD, and diabetes mellitus as prognostic factors. Likewise, we conducted a similar logistic regression model adjusted for the same variables to study the association of Ct value and mortality. Additionally, we carried out 3 logistic regression models adjusted for the same variables to investigate if respiratory, gastrointestinal, and systemic symptoms are associated with ICU admission. All the statistical analysis was carried out using STATA 16.0.
Results
Figure 1 shows the flow chart of the study. After the exclusion of 5 ineligible subjects due to incomplete data, 622 patients were available for analysis. Of these patients, 236 (37.9%) were ICU-admitted and 386 (62.1%) were not ICU-admitted. Table 1 shows the baseline characteristics of both groups. The median age for all participants was 57 years (53–63); 430 (69.1%) were males, and 192 (30.9%) were females. Most subjects were from MENA (49.2%), followed by South Asia (35.1%). Systemic symptoms were the most common (n = 500, 87.9%), followed by respiratory symptoms (n = 433, 81.2%), whereas 143 (27.4%) had GI symptoms. The most common underlying diseases were diabetes (n = 372, 59.8%), hypertension (n = 368, 59.2%), and cardiovascular disease (n = 343, 55.1%). ICU-admitted patients were more likely to be older and males. In addition, they had a higher frequency of comorbidities (Table 1).
 |
Table 1 Baseline Characteristics of the Patients |
 |
Figure 1 Study Timeline. |
Association of Ct Value with ICU Admission and Mortality
The median Ct values were slightly higher in cases (admitted to ICU) (median 22.9, IQR 19.0–22.9) than in controls (median 21.6, IQR 18.3–21.6), with weak evidence against the null hypothesis (p=0.102). The proportion of individuals with Ct value ≤25 was slightly lower in cases than in controls (67.0% vs 71.5%, respectively), again with little evidence against the null hypothesis (p=0.230). When categorized, Ct value ≤25 showed no association with the odds of ICU admission (OR 0.85, 95% CI 0.56 to 1.29, P=0.442).
The median Ct values were slightly lower in individuals who died (median 21.4, IQR 17.5–21.4) than in those who were alive (median 22.1, IQR 18.6–21.1), with weak evidence against the null hypothesis (p=0.176). The proportion of individuals with Ct value ≤25 was slightly higher in individuals who died than and controls (73.0% vs 69.0%, respectively, p=0.418). Similar to ICU, Ct value ≤25 had no association with the odds of mortality (OR 1.21, 95% CI 0.71 to 2.08, P=0.477).
Association of Presenting Symptoms with ICU Admission and Mortality
After multivariable logistic regression, respiratory symptoms (OR 2.95, 95% CI 1.57 to 5.56, P=0.001), and gastrointestinal symptoms (OR 1.99, 95% CI 1.18 to 3.35, P=0.010) were both strongly associated with severe COVID-19. However, systemic symptoms had no association with ICU admission as shown in Table 2. Specific symptoms that were associated with severe COVID-19 were all lower respiratory symptoms in addition to cough, as illustrated in Table 2. Likewise, respiratory symptoms (OR 4.96, 95% CI 1.10 to 22.43, P=0.038), and gastrointestinal symptoms (OR 3.17, 95% CI 1.29 to 7.84, P=0.012) were both strongly associated with mortality. However, systemic symptoms had no association with mortality. Individual symptoms that were associated with mortality were cough, dyspnoea, runny nose, chest pain, and chills as shown in Table 3.
 |
Table 2 Association Between Ct Values, Symptoms and ICU-Admission – Multivariable Logistic Regression Models |
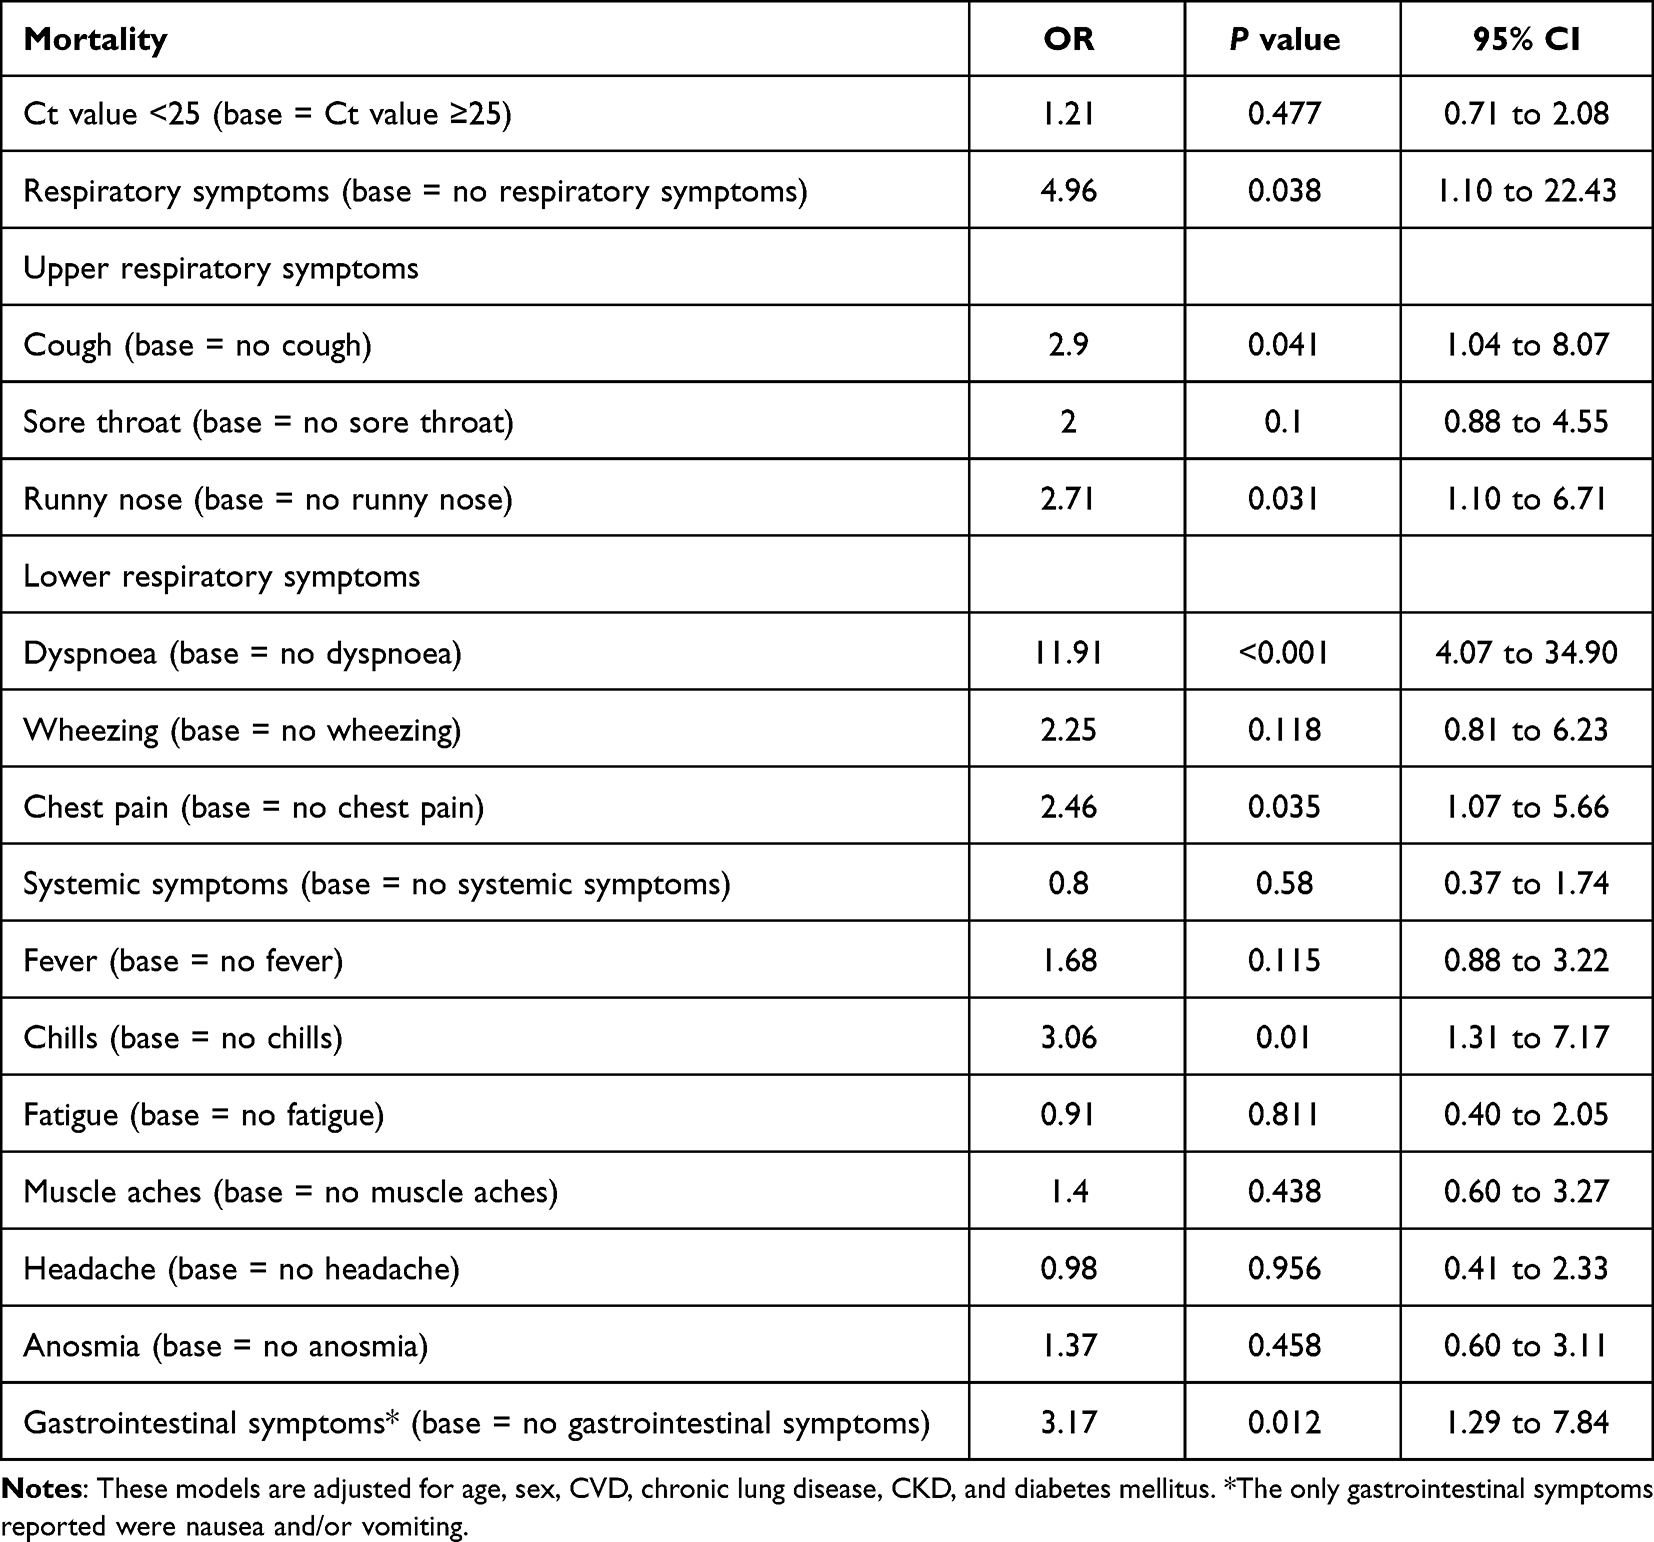 |
Table 3 Association Between Ct Values, Symptoms and Mortality – Multivariable Logistic Regression Models |
Discussion
Our study showed that Ct value had no association with either ICU admission or mortality. On the other hand, we found that respiratory and GI symptoms were collectively strongly associated with higher odds of ICU admission and mortality. On individual basis, cough, dyspnoea, wheezing and chest pain were associated with increased ICU admission odds. Besides, cough, dyspnoea, runny nose and chills were associated with increased odds of mortality.
Although our study did not find an association between Ct value and COVID-19 criticality and mortality, findings from the literature are not conclusive. While some studies found no association between Ct value and disease severity,11–14 others reported a positive association between Ct values and severe COVID-19.5,10,22,23 These differences could be explained by differences in the sampling technique, sampling time, sampling site, disease stage at which the sample is obtained, and duration from sampling to analysis, which all affect the Ct value of an individual.24 In many studies, similar to our case, the time of sampling does not coincide with the time of infection, which is usually unknown, and this may influence the viral load at the time the Ct value is measured.
We found that dyspnoea was strongly associated with both ICU admission and mortality. These results are similar to those reported by one meta-analysis and two other studies not included in that analysis.25–27 Furthermore, we found an association between GI symptoms and ICU admission, which was supported by one study published in 2019.28 However, several articles in the literature prove otherwise. In a systematic review that investigated the associations between GI and hepatic manifestations with COVID-19 disease severity found no association.29 We found no association between systemic symptoms and COVID-19 disease severity, which matches the literature findings.25 This might have been attributed to the fact that symptoms such as fever, myalgia and fatigue seem to be not only the most common manifestations of COVID-19 but they are also present in all stages of the disease.16
Our study had some limitations. First, the power of the study was low. However, the significance of statistical power is more relevant in clinical trials. Additionally, the confidence intervals in our results are narrow, which challenges the significance of calculating the power in our study. We also were unable to control for time of testing, which is an important confounder as we did not have information about the time interval between clinical onset of the disease and testing. This factor is important because Ct value changes with time and disease progression. In addition, the analysis of GI symptoms might have been limited by not including diarrhoea, which was a variable our dataset lacked. Moreover, our study does not account for variant type because variant classification was not relevant in that time period. Also, at the time our study was conducted no variant was labelled as variant of concern (VOC) or variant of interest (VOI). However, due to lack of studies that address SARS-CoV-2 variants in Qatar at that time, we assume that the circulating strain was the original Wuhan strain.
In summary, this study found no association between Ct value and severity of COVID-19 disease. However, strong associations between respiratory and GI symptoms with ICU admission and mortality were found. The prognostic value of RT-PCR in COVID-19 patients seems insignificant and other prognostic tools need to be explored to aid in the management of COVID-19 patients and predict disease outcomes, including the symptoms of the disease.
Conclusion
Although RT-PCR Ct value is diagnostic, its prognostic value appears to be insufficient. Respiratory and GI symptoms have a strong association with COVID-19 severity but more accurate parameters need to be explored. Finding an accurate prognostic tool would help physicians prioritize urgent cases and prevent undesired outcomes.
Abbreviations
CKD, Chronic Kidney Disease; COVID-19, Coronavirus Disease of 2019; Ct, Cycle Threshold; CVD, Cardiovascular Disease; ICU, Intensive Care Unit; GI, Gastrointestinal; IQR, Interquartile Range; MENA, Middle East and North Africa; OR, Odds Ratio; RT-PCR, Reverse-transcriptase Polymerase Chain Reaction; SARS-COV-2 Severe Acute Respiratory Syndrome Coronavirus 2; SD, Standard Deviation.
Ethics
All the data obtained for this study was provided by the Qatar Biobank (QBB), and informed written consent was obtained from all participants in the study. The study received ethical approval from the QBB (Ref - QF-QBB-COV-A-RES-ACC-00014) and from the Qatar University Institutional Review Board (Ref - QU-IRB 1549-E/21). The design, conduct and reporting of the study complies with the ethical principles of the Declaration of Helsinki.
Funding
Open access funding provided by the Qatar National Library.
Disclosure
The authors report no conflicts of interest in this work.
References
1. Chivese T, Matizanadzo J, Musa O, et al. The prevalence of adaptive immunity to COVID-19 and reinfection after recovery – a comprehensive systematic review and meta-analysis. Pathog Glob Health. 2022:1–13. doi:10.1080/20477724.2022.2029301
2. Goldman J, Robinson P, Uldrick T, Ljungman P. COVID-19 in immunocompromised populations: implications for prognosis and repurposing of immunotherapies. J Immunother Cancer. 2021;9(6):e002630. doi:10.1136/jitc-2021-002630
3. Kahn F, Bonander C, Moghaddassi M, et al. Risk of severe COVID-19 from the Delta and Omicron variants in relation to vaccination status, sex, age and comorbidities – surveillance results from southern Sweden, July 2021 to January 2022. Eurosurveillance. 2022;27(9). doi:10.2807/1560-7917.es.2022.27.9.2200121
4. Incerti D, Rizzo S, Li X, et al. Prognostic model to identify and quantify risk factors for mortality among hospitalised patients with COVID-19 in the USA. BMJ Open. 2021;11(4):e047121. doi:10.1136/bmjopen-2020-047121
5. Rao S, Manissero D, Steele V, Pareja J. A narrative systematic review of the clinical utility of cycle Threshold values in the context of COVID-19. Infect Dis Ther. 2020;9(3):573–586. doi:10.1007/s40121-020-00324-3
6. Carter L, Garner L, Smoot J, et al. Assay techniques and test development for COVID-19 diagnosis. ACS Cent Sci. 2020;6(5):591–605. doi:10.1021/acscentsci.0c00501
7. Magleby R, Westblade L, Trzebucki A, et al. Impact of severe acute respiratory syndrome coronavirus 2 viral load on risk of intubation and Mortality among hospitalized patients with coronavirus disease 2019. Clin Infect Dis. 2021;73(11):e4197–205.
8. Ramirez‐Hinojosa JP, Rodriguez‐Sanchez Y, Romero‐Gonzalez AK, et al. Association between cycle threshold (C t) values and clinical and laboratory data in inpatients with COVID‐19 and asymptomatic health workers. J Med Virol. 2021;93(10):5969–5976. doi:10.1002/jmv.27170
9. Waudby-West R, Parcell BJ, Palmer CN, Bell S, Chalmers JD, Siddiqui MK. The association between SARS-CoV-2 RT-PCR cycle threshold and mortality in a community cohort. Eur Respir J. 2021;58(1):2100360. doi:10.1183/13993003.00360-2021
10. Shah VP, Farah WH, Hill JC, et al. Association between SARS-CoV-2 cycle threshold values and clinical outcomes in patients with COVID-19: a systematic review and meta-analysis. Open Forum Infect Dis. 2021;8(9). doi:10.1093/ofid/ofab453
11. Ade C, Pum J, Abele I, Raggub L, Bockmühl D, Zöllner B. Analysis of cycle threshold values in SARS-CoV-2-PCR in a long-term study. J Clin Virol. 2021;138:104791. doi:10.1016/j.jcv.2021.104791
12. Aykac K, Cura Yayla BC, Ozsurekci Y, et al. The association of viral load and disease severity in children with COVID‐19. J Med Virol. 2021;93(5):3077–3083. doi:10.1002/jmv.26853
13. Karahasan Yagci A, Sarinoglu R, Bilgin H, et al. Relationship of the cycle threshold values of SARS-CoV-2 polymerase chain reaction and total severity score of computerized tomography in patients with COVID 19. Int J Infect Dis. 2020;101:160–166. doi:10.1016/j.ijid.2020.09.1449
14. Shah S, Singhal T, Davar N, Thakkar P. No correlation between Ct values and severity of disease or mortality in patients with COVID 19 disease. Indian J Med Microbiol. 2021;39(1):116–117. doi:10.1016/j.ijmmb.2020.10.021
15. Zhang N, Xie T, Ning W, He R, Zhu B, Mao Y. The severity of COVID-19 and its determinants: a systematic review and meta-analysis in China. Sustainability. 2021;13(9):5305. doi:10.3390/su13095305
16. Talukder A, Razu S, Alif S, Rahman M, Islam S. Association between symptoms and severity of disease in hospitalised novel coronavirus (COVID-19) patients: a systemic review and meta-analysis. J Multidiscip Healthc. 2020;15:1101–10.
17. Efeoglu Sacak M, Karacabey S, Sanri E, et al. Variables affecting mortality among COVID-19 patients with lung involvement admitted to the emergency department. Cureus. 2021. doi:10.7759/cureus.12559
18. Shi L, Wang Y, Wang Y, Duan G, Yang H. Dyspnoea rather than fever is a risk factor for predicting mortality in patients with COVID-19. J Infect. 2020;81(4):647–679. doi:10.1016/j.jinf.2020.05.013
19. Tré‐Hardy M, Wilmet A, Beukinga I, et al. Analytical and clinical validation of an ELISA for specific SARS‐CoV‐2 IgG, IgA, and IgM antibodies. J Med Virol. 2020;93(2):803–811. doi:10.1002/jmv.26303
20. Hayes L, Ingram J, Sculthorpe N. more than 100 persistent symptoms of SARS-CoV-2 (Long COVID): a scoping review. Front Med. 2021;8. doi:10.3389/fmed.2021.750378
21. Coyle PV, Al Molawi NH, Kacem MABH, et al. Reporting of RT-PCR cycle threshold (Ct) values during the first wave of COVID-19 in Qatar improved result interpretation in clinical and public health settings. J Med Microbiol. 2022;71(5). doi:10.1099/jmm.0.001499
22. Faíco-Filho K, Passarelli V, Bellei N. Is higher viral load in SARS-CoV-2 associated with death? Am J Trop Med Hyg. 2020;103(5):2019–2021. doi:10.4269/ajtmh.20-0954
23. Rajyalakshmi B, Reddy P, Reddy PR. Prognostic value of “cycle threshold” in confirmed COVID-19 patients. Indian J Crit Care Med. 2021;25(3):322–326. doi:10.5005/jp-journals-10071-23765
24. Rabaan A, Tirupathi R, Sule A, et al. Viral dynamics and real-time RT-PCR Ct values correlation with disease severity in COVID-19. Diagnostics. 2021;11(6):1091. doi:10.3390/diagnostics11061091
25. Jain V, Yuan J. Predictive symptoms and comorbidities for severe COVID-19 and intensive care unit admission: a systematic review and meta-analysis. Int J Public Health. 2020;65(5):533–546. doi:10.1007/s00038-020-01390-7
26. Li K, Wu J, Wu F, et al. The clinical and chest CT features associated with severe and critical COVID-19 pneumonia. Invest Radiol. 2020;55(6):327–331. doi:10.1097/RLI.0000000000000672
27. Sürmeli A, Beyaz Ö, Sitre Koç E, Gündogdu Y, Çuhadaroglu Ç, Kocagöz S. Presenting characteristics and ICU admission among patients hospitalized with COVID-19. Infect Dis Clin Microbiol. 2021;3(1):14–21. doi:10.36519/idcm.2021.20
28. Zeng W, Qi K, Ye M, et al. Gastrointestinal symptoms are associated with severity of coronavirus disease 2019. Eur J Gastroenterol Hepatol. 2022;34(2):168–76.
29. Shehab M, Alrashed F, Shuaibi S, Alajmi D, Barkun A. Gastroenterological and hepatic manifestations of patients with COVID-19, prevalence, mortality by country, and intensive care admission rate: systematic review and meta-analysis. BMJ Open Gastroenterol. 2021;8(1):e000571. doi:10.1136/bmjgast-2020-000571
 © 2023 The Author(s). This work is published and licensed by Dove Medical Press Limited. The
full terms of this license are available at https://www.dovepress.com/terms
and incorporate the Creative Commons Attribution
- Non Commercial (unported, 3.0) License.
By accessing the work you hereby accept the Terms. Non-commercial uses of the work are permitted
without any further permission from Dove Medical Press Limited, provided the work is properly
attributed. For permission for commercial use of this work, please see paragraphs 4.2 and 5 of our Terms.
© 2023 The Author(s). This work is published and licensed by Dove Medical Press Limited. The
full terms of this license are available at https://www.dovepress.com/terms
and incorporate the Creative Commons Attribution
- Non Commercial (unported, 3.0) License.
By accessing the work you hereby accept the Terms. Non-commercial uses of the work are permitted
without any further permission from Dove Medical Press Limited, provided the work is properly
attributed. For permission for commercial use of this work, please see paragraphs 4.2 and 5 of our Terms.
Recommended articles
COVID-19 Vaccination Breakthrough Infections in a Real-World Setting: Using Community Reporters to Evaluate Vaccine Effectiveness
Reynolds MW, Xie Y, Knuth KB, Mack CD, Brinkley E, Toovey S, Dreyer NA
Infection and Drug Resistance 2022, 15:5167-5182
Published Date: 3 September 2022
Evaluation of the Most Visible Symptoms Associated with COVID-19 Vaccines Among the Residents of Makkah, Saudi Arabia: An Observational, Cross-Sectional Study
Qashqari FS, Alfelali M, Barasheed O, Almaimani R, Alghamdi A, Alharbi SS, Balahmar E, S Alhothali A, Alsharif RH, Jalal NA, Makhdoom H
Infection and Drug Resistance 2023, 16:5107-5119
Published Date: 8 August 2023
Pre-Existing Allergies Patients with Higher Viral Load and Longer Recovery Days Infected by SARS-CoV-2 Omicron BA.2 in Shanghai, China, 2022
Wen R, Li J, Wang X, Xu P, Li G, Wang J, Zeng X, Liu C
Journal of Asthma and Allergy 2023, 16:903-913
Published Date: 1 September 2023
Benefit of Nasal Douche in COVID-19 Patients with Recurrence of Positive SARS-CoV-2 Viral RNA
Liao X, Guan Y, Lin Z, Tang Q, Ma Z, Wu S, Wang X, Dong J, Zhang L, Deng J, Liao Z, Yang S, Wang C, Song S, Yi H, Wu S, Asakawa T, Lu H
Infection and Drug Resistance 2023, 16:6269-6276
Published Date: 21 September 2023
The Impact of COVID-19 on Dental Clinic Transmission: Leveraging Internet of Things Technology
Uygun-Can B, Durmazpınar PM, Hatipoğlu Ş, Acar-Bolat B, Özen Ç, Sazak-Öveçoğlu H, Kadir T
Journal of Multidisciplinary Healthcare 2025, 18:1319-1334
Published Date: 4 March 2025