Back to Journals » Nature and Science of Sleep » Volume 18

Night-to-Night Sleep Variability Modulates Subjective Sleep Perception in Chronic Insomnia: A Multilevel Analysis
Authors Xiao X, Liu S, Jiang W ![]() , Xu Z, Meng F
, Xu Z, Meng F ![]() , Huang F, Bi X
, Huang F, Bi X ![]() , Guo Z, Li Y
, Guo Z, Li Y
Received 22 March 2026
Accepted for publication 12 June 2026
Published 19 June 2026 Volume 2026:18 602062
DOI https://doi.org/10.2147/NSS.S602062
Checked for plagiarism Yes
Review by Single anonymous peer review
Peer reviewer comments 2
Editor who approved publication: Professor Valentina Alfonsi
Xiaoyu Xiao,* Shuo Liu,* Wenjing Jiang, Zhuqing Xu, Fanzun Meng, Fangchun Huang, Xiaochan Bi, Zixiang Guo, Yuqi Li
Department of Geriatric Medicine & Laboratory of Gerontology and Anti-Aging Research, Qilu Hospital of Shandong University, Jinan, Shandong Province, People’s Republic of China
*These authors contributed equally to this work
Correspondence: Wenjing Jiang, Qilu Hospital, Shandong University, No. 107, West Culture Road, Jinan, Shandong, People’s Republic of China, Tel +86 185 6008 2210, Email [email protected]
Introduction: Subjective sleep perception often differs from objective sleep measures in chronic insomnia, but the role of night-to-night sleep variability remains insufficiently understood. This study examined the effects of daily within-individual sleep fluctuations and between-individual sleep variability on subjective sleep perception in patients with chronic insomnia.
Methods: Fifty patients with chronic insomnia completed home-based sleep monitoring and sleep diaries for five to seven consecutive nights, yielding 312 valid nights. Sleep perception bias was defined as the difference between objective sleep parameters and subjective estimates. Sleep variability was quantified using the coefficient of variation. Linear mixed-effects models examined within-individual associations, between-individual variability effects, and cross-level interactions.
Results: Nightly objective changes in total sleep time, sleep efficiency, wake after sleep onset, and sleep onset latency were significantly associated with corresponding subjective-objective discrepancies. Subjective perception changed less than objective sleep parameters, suggesting reduced subjective responsiveness to nightly sleep changes. Between individuals, lower total sleep time variability was associated with greater bias in perceived sleep duration and sleep efficiency. Higher N2 percentage variability was associated with greater wake after sleep onset perception bias and moderated the association between objective wake time and subjective perception.
Discussion: These findings suggest that subjective sleep perception in chronic insomnia is influenced by nightly objective sleep changes and longer-term sleep variability. N2-related findings should be interpreted cautiously given the exploratory sleep-stage-specific analyses and portable EEG monitoring.
Keywords: night-to-night variability, intraindividual variability, subjective sleep perception, sleep perception bias, sleep state misperception
Introduction
Chronic insomnia disorder is a common sleep condition characterized by persistent difficulties in falling asleep, staying asleep, or early morning awakenings, accompanied by significant daytime impairment.1 At present, its diagnosis is mainly based on patient complaints with no consensus on objective diagnostic criteria.2 However, objective sleep measures in patients with insomnia often differ substantially from their subjective sleep reports, a phenomenon referred to as “sleep-state misperception” or “sleep perception bias”.1 Patients commonly underestimate total sleep time and overestimate both sleep onset latency and wake after sleep onset.3 A better understanding of this subjective–objective discrepancy may help clarify mechanisms that maintain insomnia and inform more accurate assessment and treatment strategies.4 Some studies have examined factors associated with sleep perception bias, including slow-wave sleep proportion, self-reported sleep latency, subjective sleep quality, and morning mood.2 Sleep perception bias may also vary by age: older adults with insomnia have been reported to underestimate sleep efficiency and overestimate sleep onset latency more than younger adults.5,6 Age-related increases in sleep onset latency have been reported using both subjective and objective measures, highlighting the need to further examine the relationship between aging and sleep misperception.7 Sleep misperception is also associated with sleep-related mood, stress, quality of life, pain perception, and anxiety-related symptoms.8 However, most previous studies have used cross-sectional designs or examined average sleep measures over only a small number of nights, limiting their ability to capture the dynamic aspects of sleep perception over time.9
Sleep variability refers to night-to-night changes in sleep characteristics such as bedtime, sleep duration, and sleep efficiency, and represents an important dimension of sleep quality.10 Phillips’s studies have supported a relationship between excessive sleep variability and worse subjective sleep quality as well as circadian disruption.11 Studies examining intra-individual variability in insomnia patients demonstrate that they overestimate and underestimate sleep time as well as have wide night-to-night fluctuations with respect to their overestimation of sleep latency.12 Furthermore, increased sleep variability is associated with various physical and mental health conditions. For example, variations in measures of sleep duration—total sleep time and bedtime—are associated with BMI, weight gain, and negative health factors, such as physical inactivity.13 Increased variability in sleep efficiency may also be associated with higher depression severity among young adults.14 Further, greater variability in sleep duration is independently related to several physical health problems, such as cardiovascular disease, diabetes, and self-reported poor health.15 Specifically, those with insomnia frequently describe high variability in the severity of their sleep problems between the best and worst nights. This day-to-night variation in sleep difficulty may exacerbate their distress due to insomnia.16 Independent studies also demonstrate that, in contrast to good sleepers, insomnia patients have more variability in various sleep measures.17 This raises the possibility that sleep instability is in itself a pivotal abnormality in insomnia pathophysiology, which could exacerbate distress and daytime impairment by modulating subjective perception of sleep. However, previous research has focused on the direct relationship between sleep variability and psychosomatic health consequences, without adequately exploring its role in subjective perception of sleep.
Sleep perception bias and sleep variability are both important dynamic dimensions in understanding chronic insomnia; however, studies that combine both aspects remain scarce.18 There has been limited literature suggesting that sleep variability in insomnia patients impacts their subjective perception of sleep, although the processes by which this occurs are not well understood.17 However, few studies have systematically examined how within-individual nightly fluctuations and between-individual sleep variability jointly influence subjective sleep perception. Although evidence to date does not elucidate the extent to which immediate nightly variations in objective sleep parameters translate into subjective perception within the same night versus how long-term sleep variability contributes to a person’s general level of subjective perception, these results support both as variables that contribute independently. Furthermore, the combined regulatory potential of these factors between and within individuals is unclear. The majority of previous research investigates these dimensions separately, which hinders our ability to comprehend the fundamental process of why insomnia patients have particular “good nights” and “bad nights”. As such, they also do not explain clinical interventions that may simultaneously target sleep instability and enhance perceptual accuracy.
In this study, sleep perception bias refers to the subjective–objective discrepancy in sleep parameters, calculated as objective values minus subjective estimates. In contrast, reduced subjective responsiveness, or perceptual blunting, refers to the attenuated change in subjective perception relative to nightly changes in objective sleep parameters. Distinguishing these two concepts allows us to examine both the average level of misperception and the dynamic sensitivity of subjective perception to objective sleep fluctuations.
As such, the present study used a dense longitudinal sampling design that employs continuous home sleep monitoring and daily sleep diaries to capture both objective and subjective sleep information from individuals with chronic insomnia. This strategy serves to fill the gaps in previous research and tests the following hypotheses directly: (1) At an intra-individual level, day-to-day variations of objective sleep parameters affect subjective sleep perception on that night. (2) On the inter-individual level, sleep variability contributes to setting the baseline level of how individuals perceive their sleep. (3) Between-individual sleep variability may moderate the association between nightly objective sleep fluctuations and subjective sleep perception.
Materials and Methods
Participants
The study was conducted between September 2024 and November 2025 at the Department of Neurology Outpatient Clinic of Qilu Hospital, Shandong University. Patients were screened by two neurologists (each with >15 years of experience) using a semi-structured interview that included mental and sleep health based on the Diagnostic and Statistical Manual of Mental Disorders, Fifth Edition (DSM-5). Participants were required to meet the following inclusion criteria: self-reported difficulty initiating sleep, maintaining sleep, or early morning awakening; symptoms occurring at least three nights per week for at least three consecutive months; associated daytime impairment; and absence of other sleep disorders, severe organic diseases, or major psychiatric conditions. A total of 50 patients with insomnia were finally included in our study.
Study Design
At baseline, all 50 participants completed assessments of sleep quality, anxiety and depressive symptoms, and cognitive function. They then underwent home sleep monitoring with concurrent sleep diary recording for five to seven consecutive nights, including both regular and non-regular workdays.
Measurement
Sleep Diary
The CSD (Consensus Sleep Diary), an insomnia-specific, standardized sleep log, was completed by the participants.19 The CSD includes 11 items (eg, “How long did it take you to fall asleep?”) to capture subjective sleep patterns. Variables derived from the diary comprised wake time (RT), lights-out time (LO), total sleep time (TST), time in bed (TIB), sleep onset latency (SOL), wake after sleep onset (WASO), subjectively rated sleep quality, and the use of sleep medication during the baseline assessment (yes/no). Sleep medication use was assessed with the question: “Did you take any over-the-counter or prescription medication to help you sleep?” Subjective sleep quality was calculated as the mean of participants’ daily ratings on a 5-point scale (1 = well rested to 5 = very restless). Studies have demonstrated that the CSD shows good clinical utility and validity, making it a reliable tool for sleep assessment in both clinical and research contexts.20 Daily SOL, TST, WASO, and sleep efficiency (SE) were primary outcomes, with SE being determined as the ratio of TST to TIB. TST was calculated by subtracting total wake time (SOL + WASO + time awake before final rising) from TIB.21
Sleep Assessment
Insomnia Severity Index (ISI): The ISI includes 7 items with a 5-point response scale, and has the potential for a total score ranging between 0 and 28. The total scores are interpreted as follows: 0–7, no clinically significant insomnia; 8–14, subthreshold insomnia; 15–21, moderate insomnia; and 22–28, severe insomnia. Higher scores represent more severe insomnia.22
Pittsburgh Sleep Quality Index (PSQI): This scale is composed of 19 self-reported items for which there are seven component scores (indicating subjective sleep quality, sleep onset latency, sleep duration, habitual sleep efficiency, sleep disturbances, hypnotic medication use, and daytime dysfunction). Each component is rated on a 0–3 scale. The sum of the seven component scores is measured as the PSQI total score, which ranges from 0 to 21 points. Higher scores correspond to worse quality of sleep. A total score greater than 7 is generally considered the clinical cutoff value for discriminating sleep quality problems.23
Mental and Physical Health Assessment
The Hamilton Anxiety Rating Scale (HAMA-14): The 14-item scale measures anxiety symptoms such as anxious mood, tension, fears, insomnia, cognitive function, and somatic anxiety. The following scoring is used: 0–7 no anxiety, 8–13 possible anxiety, 14–20 probable anxiety, 21 or more indicates severe anxiety.
Hamilton Depression Rating Scale (HAMD−17): The 17-item Hamilton Depression Rating Scale was used to assess depressive symptoms, including depressed mood, guilt, suicidal ideation, insomnia, work and activities, psychomotor changes, anxiety, and somatic symptoms. Scores of 0–7 indicate no depression, 8–17 mild depression, 18–24 moderate depression, and ≥25 severe depression.24
Cognitive Scales
Montreal Cognitive Assessment (MoCA): It tests attention, memory, language, abstract reasoning, and visuospatial abilities and is good at detecting mild cognitive impairment. The overall score has a maximum of 30 points. A score of ≥26 generally reflects normal cognitive function, while a score <26 indicates cognitive impairment.
Objective Sleep Monitoring
Objective sleep monitoring was performed using a wireless head-mounted portable EEG recorder with adhesive electrodes (Somno Medic GmbH, HomeSleep Test). EEG signals were recorded from three frontal derivations (Fz, Fp1, and Fp2 referenced to M1) at a sampling rate of 256 Hz.25 Integrated light sensors and a triaxial accelerometer were used to assess ambient light exposure and head movements. Participants wore the device continuously for 5–7 days and completed a sleep diary each morning.26 Sleep stages were manually scored by certified raters according to AASM criteria. Home-based multi-night recordings were used to enhance ecological validity and to characterize habitual sleep patterns in individuals with insomnia, while minimizing laboratory-related arousal effects. Analyses focused primarily on conventional sleep macro-architecture and frontal EEG spectral measures. Given the limitations of wearable EEG for detailed microstructural characterization, N2-related sleep-stage measures were treated as exploratory indices reflecting relative longitudinal changes.
Demographic Information
Demographic characteristics, such as age, sex, relationship status (married/cohabiting with a partner or living alone), cohabitation children (<18 years old), years of education, employment status, self-reported health, and objective height and weight, were collected for the calculation of the body mass index.
Statistics
Sleep Perception Discrepancy
For each sleep parameter (SOL, WASO, TST, SE), a “discrepancy score” was computed by subtracting the self-reported degree of the particular nocturnal disturbance in the sleep diary from its actual measurement by the portable EEG recorder (ie, objective value – subjective value). Positive values indicate that the objective value was greater than the subjective estimate, whereas negative values indicate that the subjective estimate exceeded the objective value.27
Sleep Variability
Sleep variability was calculated by the coefficient of variation (CV), which is considered to measure how much an individual’s sleep tends to deviate from its mean and has been frequently used as a method of assessing within-person night-to-night variability in sleep characteristics.13 Variability of every sleep parameter was evaluated in this study by obtaining its coefficient of variation (CV), as presented in Table 1. Variability was categorized according to predefined criteria: CV 0–20% under low variability, CV 20–40% moderate variability, and CV >40% high variability.28
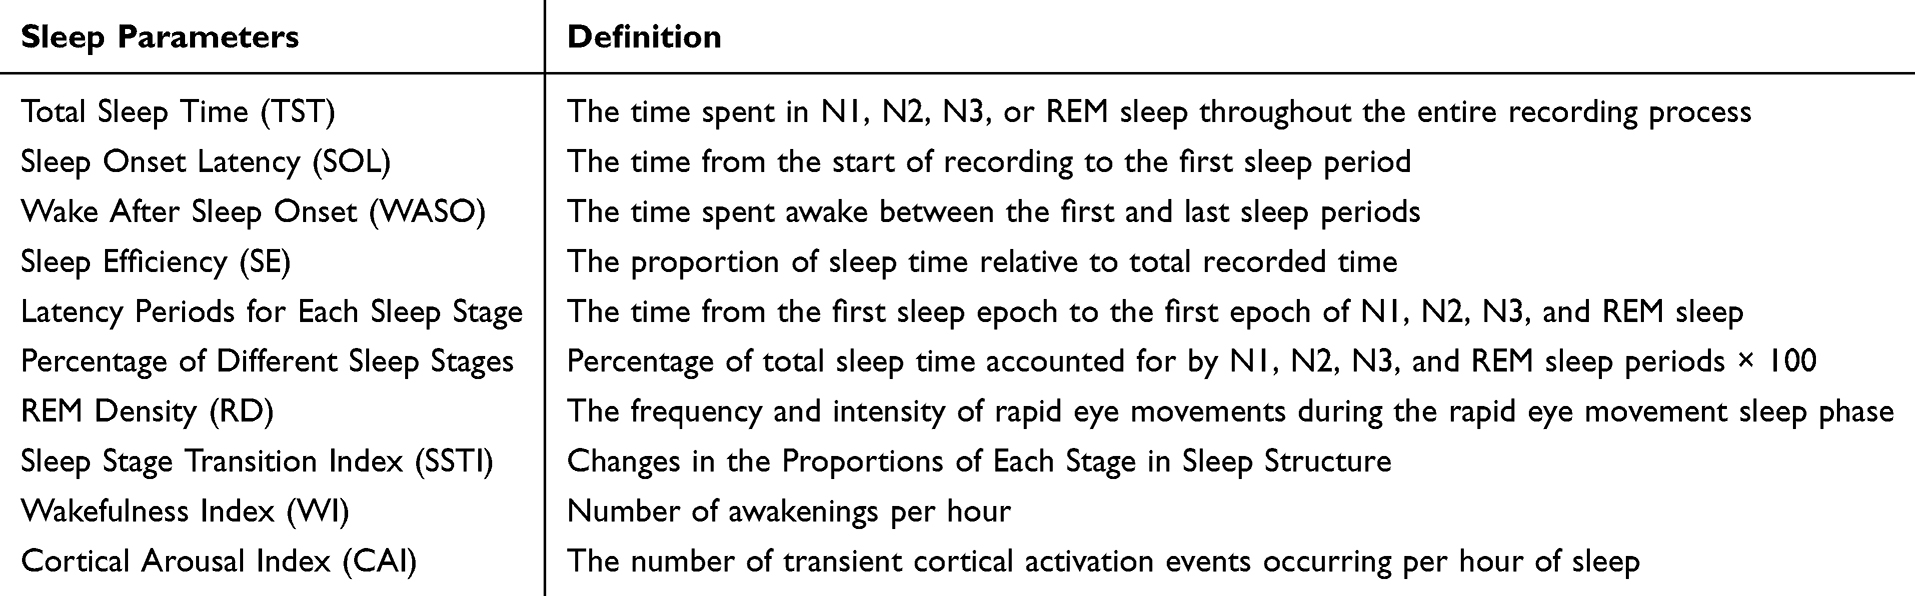 |
Table 1 Definitions of Sleep Parameters |
CV was selected as the primary variability metric because it provides a dimensionless, scale-normalized index of night-to-night variability, allowing comparison across sleep parameters with different units and magnitudes. Because CV may be influenced by small mean values or skewed distributions, additional sensitivity analyses using SD- and log-SD-based variability metrics were conducted for the final retained variability predictors.
Statistical Analysis
Statistical analyses were performed using SPSS software version 27.0.1 and R software version 4.5.1. Baseline demographic and clinical characteristics were summarized using descriptive statistics. Continuous variables are presented as mean ± standard deviation or median with interquartile range, as appropriate, and categorical variables are presented as frequency and percentage. For each participant, the mean, standard deviation, and coefficient of variation of each sleep parameter were calculated across the 5–7 consecutive recording nights.
Sleep perception bias was analyzed using four dependent variables: dTST, dSE, dWASO, and dSOL. These variables represented the differences between objective sleep parameters and corresponding subjective sleep diary estimates. To separate within-individual nightly fluctuations from between-individual differences, objective sleep parameters were person-mean centered. Specifically, TST_c, SE_c, WASO_c, and SOL_c represented the deviation of each night’s objective sleep parameter from that participant’s own mean value. In this framework, discrepancy outcomes represented sleep perception bias, whereas slopes for person-mean centered objective sleep parameters reflected subjective responsiveness to nightly objective sleep changes.
Before constructing the multilevel models, Spearman correlation analyses were conducted to explore associations between sleep variability indicators and sleep perception bias measures. Candidate variability indicators were selected based on statistical relevance, clinical interpretability, and multicollinearity assessment. Highly correlated predictors were not entered simultaneously into the same model to reduce model instability and the risk of overfitting.
Linear mixed-effects models were fitted using the lmer() function in the lme4 package. For each sleep perception outcome, a separate linear mixed-effects model was fitted with participant ID as a random intercept. Person-mean-centered objective sleep parameters were entered as within-individual predictors, while sleep variability indicators were entered as between-individual predictors. Cross-level interaction terms were considered when theoretically relevant and were retained in the final model only when they improved model fit and contributed meaningfully to interpretation. For the dWASO interaction model, N2 sleep percentage variability was grand-mean centered to improve the interpretability of the lower-order effect of centered objective WASO. Model selection was guided by the Akaike information criterion and Bayesian information criterion, together with clinical interpretability.
The final model specifications for each outcome are provided in Supplementary Table S1. Fixed-effect estimates are reported as regression coefficients with standard errors, degrees of freedom, t values, and p values. To examine the robustness of the findings, sensitivity analyses were conducted by additionally adjusting the final models for individual-level covariates, including sex, age, body mass index, MoCA, PSQI, HAMA, HAMD, and ISI scores. To address the potential dependence of CV on mean values, additional sensitivity analyses were conducted by replacing the retained CV-based variability predictors with SD- and log-SD-based variability metrics. These analyses were used to evaluate whether the main findings were robust to alternative operationalizations of sleep variability.
Results
Demographic and Clinical Characteristics
This analysis included 50 participants with chronic insomnia who completed home sleep monitoring for five to seven consecutive nights (Table 2). The mean age was 46.32 years, and 31 participants were female. Each participant contributed an average of 6.24 nights of data, resulting in 312 analyzable nights. Participants had a mean nightly sleep duration of 5 hours and 43 minutes. The mean MoCA score was 24.14, suggesting relatively preserved global cognitive function. The mean PSQI and ISI scores indicated clinically relevant sleep disturbance and insomnia severity, while the mean HAMA and HAMD scores suggested mild-to-moderate anxiety and depressive symptoms.
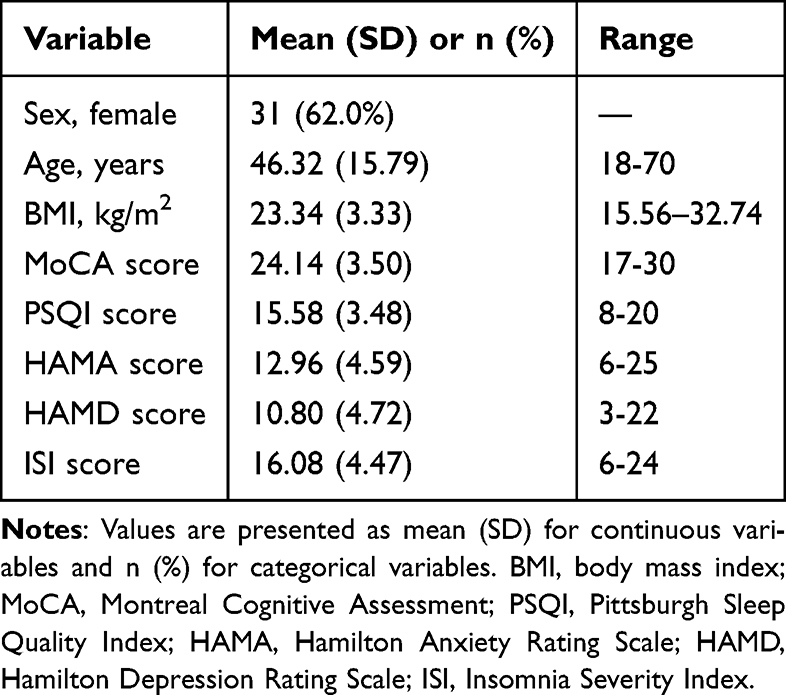 |
Table 2 Participants’ Demographics and Relevant Clinical Scales (N = 50) |
Sleep Parameter Variability and Perceived Sleep Bias
The coefficients of variation for each sleep variable are presented in Table 3. According to the coefficient of variation, sleep efficiency and the cortical arousal index were considered low-variability variables. N1%, N2%, the wakefulness index, the sleep stage transition index, and total sleep time showed moderate variability. In contrast, sleep onset latency, wake after sleep onset, latencies of each stage (N1, N2, N3, REM), N3%, REM%, and REM density were all found to be high-variability measures. These quantitative patterns were consistent with the visual inspection of night-to-night trajectories shown in Supplementary Figures S1–S4. Results related to sleep perception bias are also shown in Table 3. The subjective-objective discrepancies were small for total sleep time and sleep efficiency, with patients slightly overestimating both sleep duration (dTST = −6.30 min) and efficiency (dSE = −1.48%). By contrast, larger discrepancies were observed for SOL and WASO. For dSOL, the mean discrepancy was −31.19 minutes, indicating that patients overestimated sleep onset latency. For dWASO, the mean discrepancy was 102.06 minutes, indicating that patients underestimated wake time after sleep onset. These quantitative results suggest that there was indeed a noticeable disconnection between subjective impression and objective measurement, especially in terms of sleep onset and maintenance.
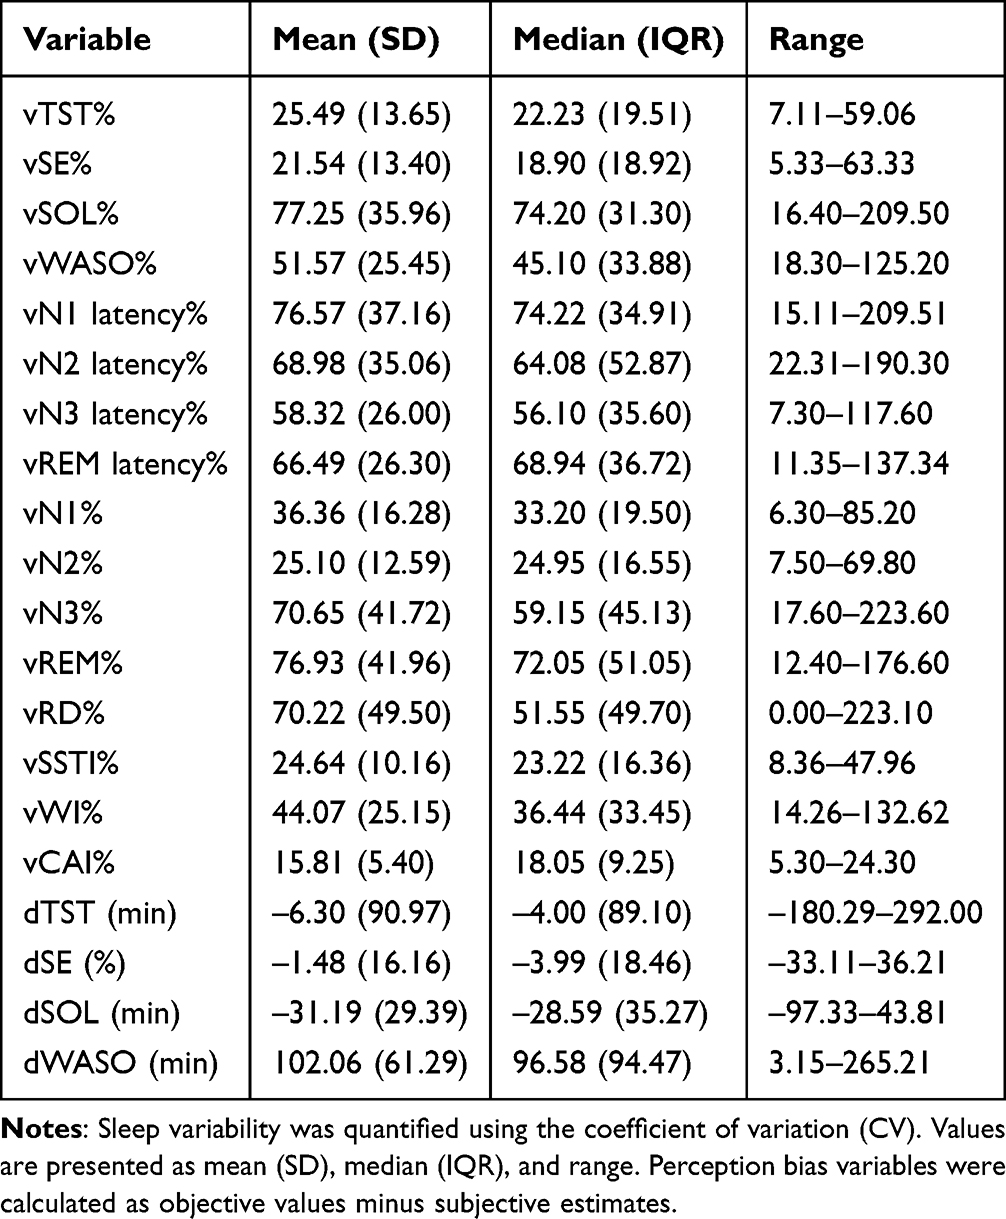 |
Table 3 Sleep Variability and Perception Bias |
Multilevel Analysis of Sleep Variability and Sleep Perception Bias
Spearman Correlation Analysis and Predictor Variable Screening
First, we computed Spearman correlation coefficients between 16 sleep variability metrics and four indicators of daily sleep perception bias (dTST, dSE, dWASO, dSOL), and visualized the results in the heatmap shown in Figure 1. In this univariate analysis, we preliminarily screened variability indicators significantly associated with at least one sleep perception metric (p < 0.20), yielding 12 candidate variables. To prevent multicollinearity from compromising model stability, we conducted correlation tests on these candidates. Results indicated a high correlation between vTST and vSE (correlation coefficient >0.7), leading to the retention of vTST and exclusion of vSE. Additionally, vN1 latency showed a strong correlation with vSOL (correlation coefficient >0.9), resulting in the retention of vSOL and exclusion of vN1 latency. Following this screening, ten candidate sleep variability indicators were considered for outcome-specific model selection: vTST, vSOL, vSSTI, vWI, vRD, vWASO, vN1%, vN2%, vN3%, and vREM%. These variables were not entered simultaneously into a single model; instead, outcome-specific candidate models were constructed based on clinical interpretability, multicollinearity assessment, and model fit. Candidate predictors were specified as follows: dTST model: vTST, vSSTI, vWASO, and vN1%; dSE model: vTST; dWASO model: vTST, vSSTI, vN2%, vN3%, vREM%, and vRD; dSOL model: vSOL, vWI, vREM%, and vRD.
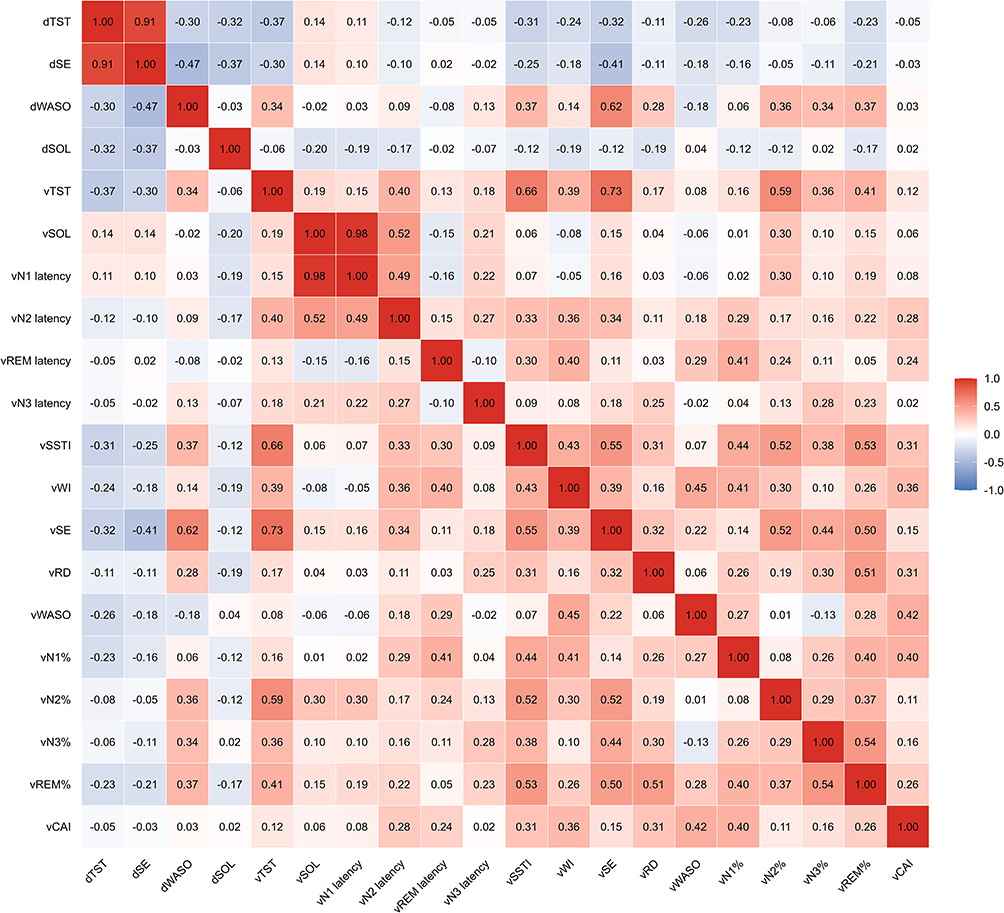 |
Figure 1 Correlation between sleep parameter variability and sleep perception bias. Spearman correlation coefficients were calculated between sleep variability indicators and sleep perception bias measures. Warmer colors indicate positive correlations, whereas cooler colors indicate negative correlations. |
Prediction Model Results
Perceived Total Sleep Time Bias Model (dTST)
An empty model with the objective–subjective total sleep time discrepancy as the dependent variable showed an intraclass correlation coefficient of 0.405, indicating that 40.5% of the variance in dTST was attributable to between-individual differences, whereas 59.5% was attributable to within-individual nightly fluctuations. The final model specification is summarized in Supplementary Table S1. Model comparison identified the model incorporating person-mean centered objective total sleep time, total sleep time variability, and sleep stage transition index variability as the optimal model (AIC = 3665.2, AIC weight = 0.989; Supplementary Table S2). Fixed-effect estimates are presented in Table 4.
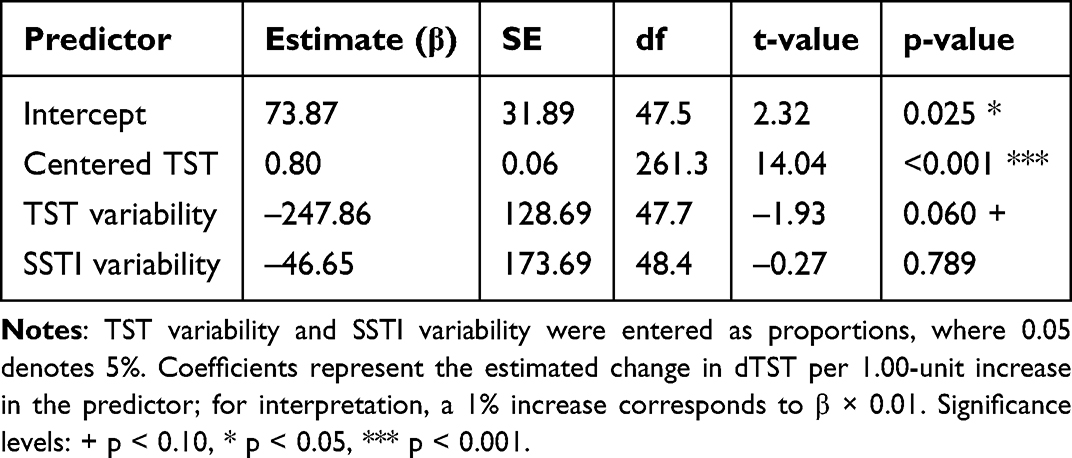 |
Table 4 Fixed-Effect Parameters of the dTST Multilevel Model |
At the within-individual level, person-mean-centered objective total sleep time was a significant positive predictor of dTST (β = 0.80, p < 0.001; Table 4). Specifically, for every one-minute increase in objective total sleep time above an individual’s own average, dTST increased by 0.80 minutes. This finding suggests reduced subjective responsiveness to nightly increases in objective sleep duration.
At the between-individual level, vTST showed a marginally significant negative association with dTST (β = −247.86, p = 0.060; Table 4), suggesting that individuals with lower total sleep time variability tended to show greater sleep perception bias. The main effect of vSSTI was not significant (β = −46.65, p = 0.789; Table 4).
Perceived Sleep Efficiency Bias Model (dSE)
The empty model, with the objective–subjective sleep efficiency discrepancy as the dependent variable, yielded an intraclass correlation coefficient of 0.38, indicating that 38% of the variance in dSE was attributable to between-individual differences, with the remaining 62% arising from within-individual nightly fluctuations. The final model specification is summarized in Supplementary Table S1. Model comparison identified the model incorporating person-mean centered objective sleep efficiency and total sleep time variability as the optimal model (AIC = 2617.1, AIC weight = 0.727; Supplementary Table S3). Fixed-effect estimates are presented in Table 5.
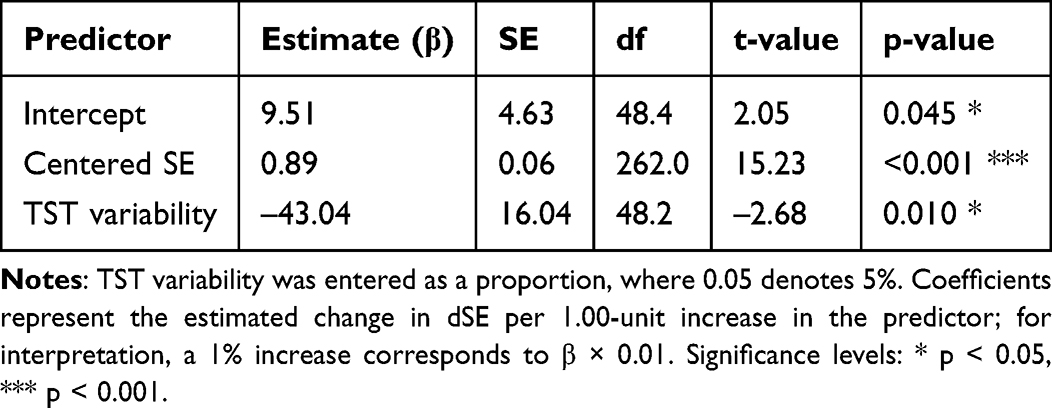 |
Table 5 Fixed-Effect Parameters of the dSE Multilevel Model |
At the within-individual level, person-mean-centered objective sleep efficiency was a significant positive predictor of dSE (β = 0.89, p < 0.001; Table 5). Specifically, for every 1% increase in a patient’s objective sleep efficiency above their personal average, dSE increased by 0.89%. This pattern suggests that improvements in objective sleep efficiency were associated with smaller corresponding changes in subjective perception, indicating reduced subjective responsiveness.
At the between-individual level, vTST demonstrated a significant negative association with dSE (β = −43.04, p = 0.010; Table 5). Given the observed range of vTST, this coefficient implies that a 10% increase in total sleep time variability corresponded to an average reduction in dSE of approximately 4.3%. This result suggests that individuals with lower sleep time variability tended to exhibit greater bias in perceived sleep efficiency.
Perceived Wake After Sleep Onset Bias Model (dWASO)
The empty model, using the objective–subjective WASO discrepancy as the dependent variable, yielded an intraclass correlation coefficient of 0.266, indicating that 26.6% of the variance in dWASO was attributable to between-individual differences, while 73.4% originated from within-individual nightly fluctuations. The final model specification is summarized in Supplementary Table S1. Model comparison identified the model including person-mean centered objective WASO, N2 sleep percentage variability, sleep stage transition index variability, and the WASO_c × vN2% interaction as the optimal model (AIC = 3157.1, AIC weight = 0.952; Supplementary Table S4). For this interaction model, N2 sleep percentage variability was grand-mean centered to improve the interpretability of the lower-order WASO_c effect. Fixed-effect estimates are presented in Table 6.
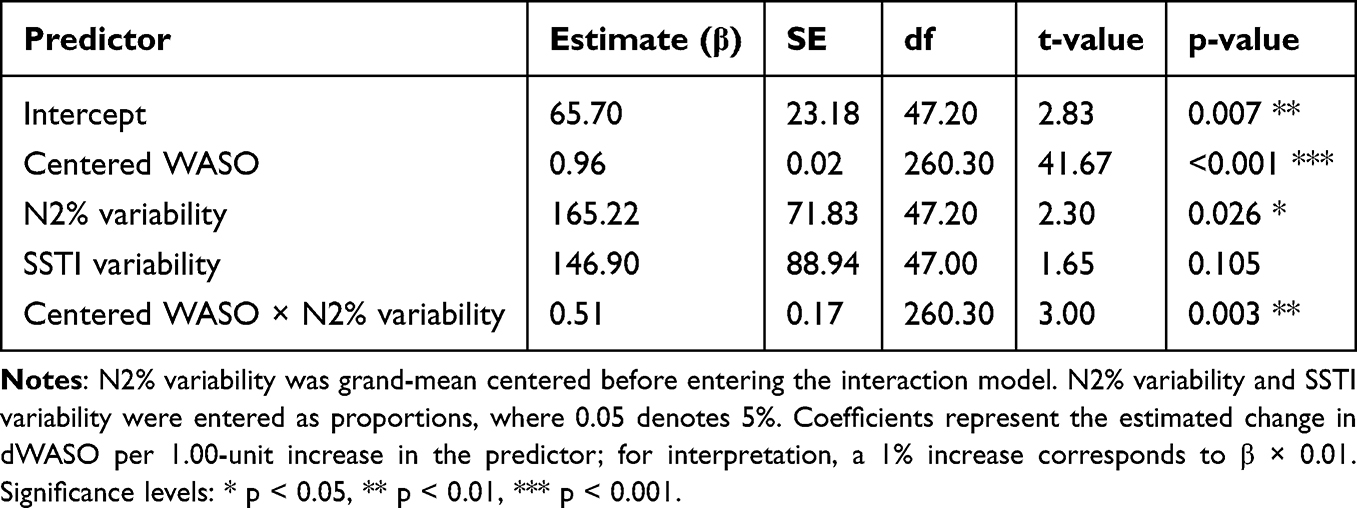 |
Table 6 Fixed-Effect Parameters of the dWASO Multilevel Model |
At the within-individual level, person-mean-centered objective WASO was a significant positive predictor of dWASO (β = 0.96, p < 0.001; Table 6). Specifically, for every one-minute increase in objective WASO above an individual’s own average, dWASO increased by 0.96 minutes. This finding suggests that increases in objective wake time were associated with smaller corresponding changes in subjective perception, consistent with reduced subjective responsiveness.
At the between-individual level, vN2% was a significant positive predictor of dWASO (β = 165.22, p = 0.026; Table 6), suggesting that individuals with higher N2 sleep percentage variability tended to show greater WASO perception bias. The cross-level interaction between vN2% and WASO_c was also significant (β = 0.51, p = 0.003; Table 6), indicating that N2 sleep percentage variability moderated the association between nightly objective WASO changes and subjective WASO perception (Figure 2).
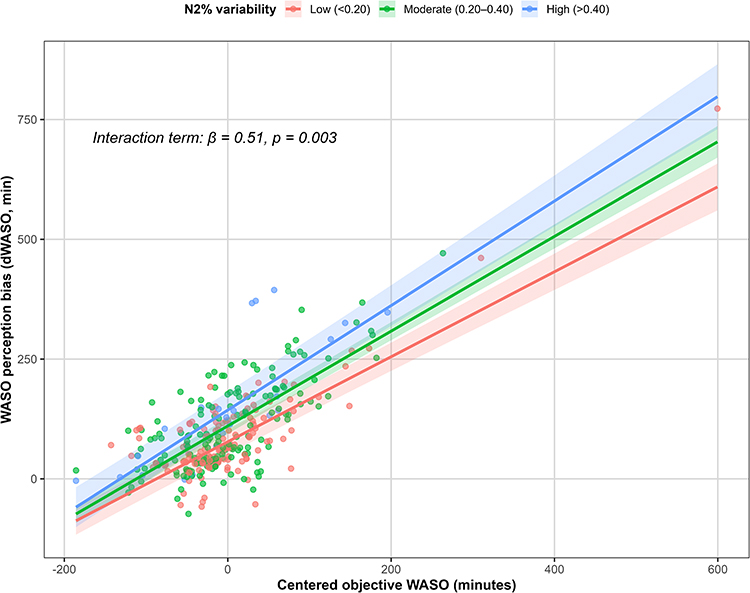 |
Figure 2 Moderating effect of N2 sleep percentage variability on WASO perception bias. Scatter points represent nightly observations. Lines show model-fitted associations between centered objective WASO and dWASO at low, moderate, and high N2% variability levels; shaded areas indicate 95% confidence intervals. N2% variability was modeled continuously and grouped only for visualization. The interaction was significant (β = 0.51, p = 0.003). |
Perceived Sleep Onset Latency Bias Model (dSOL)
An empty model with the objective–subjective sleep onset latency discrepancy as the dependent variable produced an intraclass correlation coefficient of 0.279, indicating that 27.9% of the variance in dSOL was attributable to between-individual differences, while 72.1% arose from within-individual nightly fluctuations. The final model specification is summarized in Supplementary Table S1. Model comparison identified the model containing only person-mean centered objective sleep onset latency as the optimal model (AIC = 3110.5, AIC weight = 1.000; Supplementary Table S5). Fixed-effect estimates are presented in Table 7.
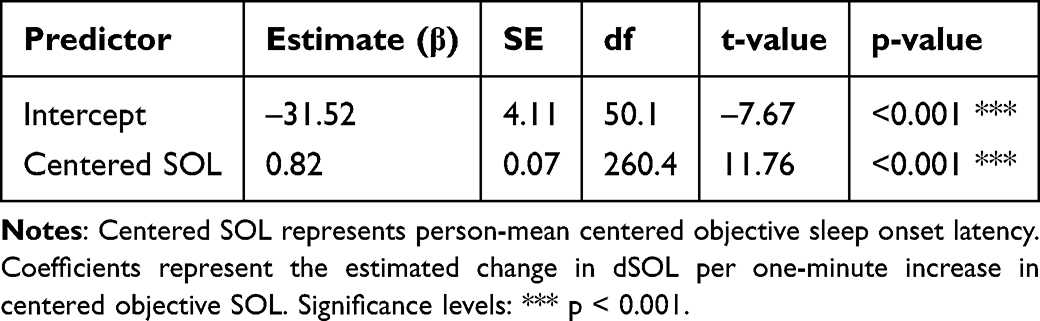 |
Table 7 Fixed-Effect Parameters of the dSOL Multilevel Model |
At the within-individual level, person-mean centered objective sleep onset latency was a significant positive predictor of dSOL (β = 0.82, p < 0.001; Table 7). Specifically, for every one-minute increase in objective sleep onset latency above an individual’s own average, dSOL increased by 0.82 minutes. This finding suggests that increases in objective sleep latency were associated with smaller corresponding changes in subjective perception, consistent with reduced subjective responsiveness.
At the between-individual level, preliminary screening of potential variability predictors, including vSOL, vWI, vREM latency, and vRD, revealed no significant main effects on dSOL (all p >0.10). Therefore, no between-individual variability predictors were retained in the final dSOL model.
Sensitivity Analysis
Sensitivity analyses were conducted by additionally adjusting the final models for individual-level covariates, including sex, age, BMI, MoCA, PSQI, HAMA, HAMD, and ISI. The main within-individual effects of centered objective sleep parameters remained robust across all four models after covariate adjustment (Figure 3). Specifically, centered objective TST, SE, WASO, and SOL remained significant predictors of their corresponding subjective–objective discrepancy outcomes.
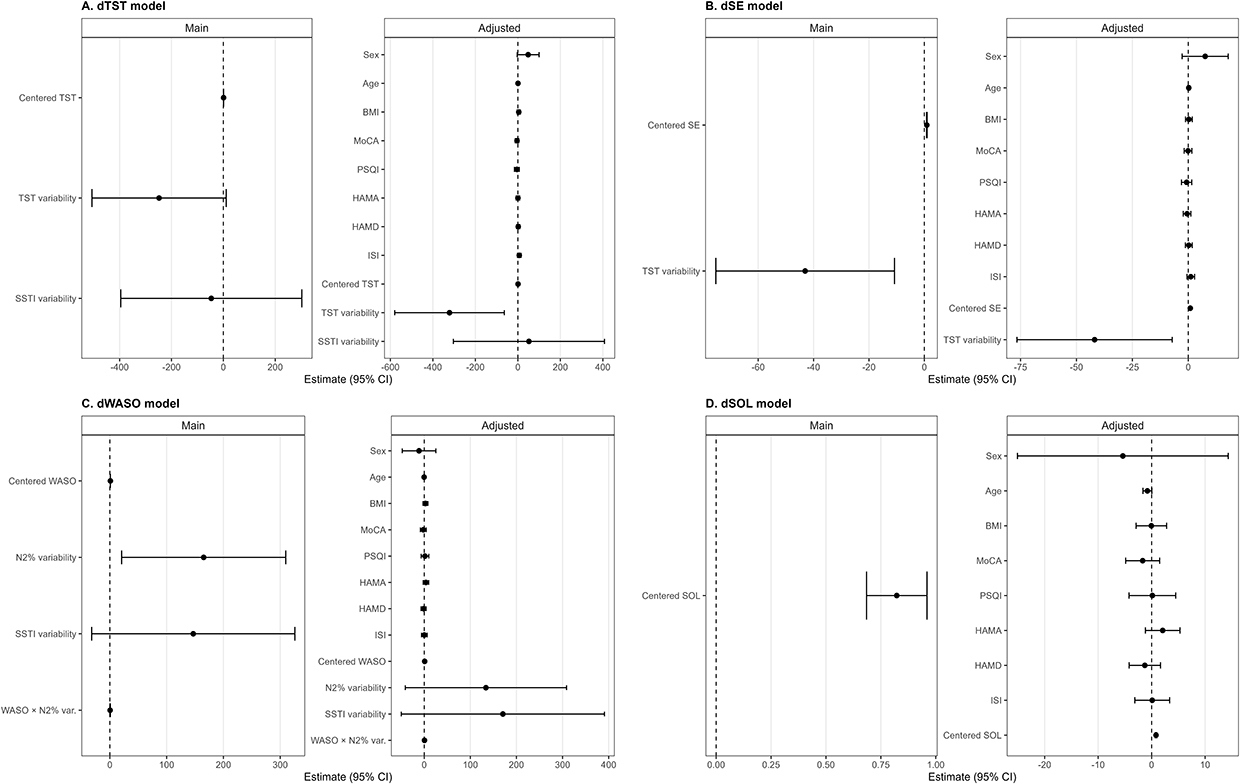 |
Figure 3 Sensitivity analyses of the final multilevel models. (A) dTST, (B) dSE, (C) dWASO, and (D) dSOL. Points represent fixed-effect estimates from the main and covariate-adjusted models, with horizontal lines indicating 95% confidence intervals. Adjusted models included sex, age, body mass index, MoCA, PSQI, HAMA, HAMD, and ISI. The dashed vertical line indicates zero. |
The association between total sleep time variability and dSE also remained significant after adjustment. In the dWASO model, the cross-level interaction between centered objective WASO and N2% variability remained significant, indicating that the moderating effect of N2 sleep percentage variability was not fully explained by demographic or clinical covariates. However, some between-individual main effects were attenuated after adjustment and should therefore be interpreted cautiously. Overall, these sensitivity analyses suggest that the core within-individual associations and the dWASO interaction effect were generally robust, while exploratory between-individual variability effects require cautious interpretation. Additional sensitivity analyses replacing CV-based variability predictors with SD- and log-SD-based metrics showed generally consistent results (Supplementary Table S6). The within-individual effects of centered objective sleep parameters remained robust across all alternative models. The negative association between TST variability and dSE remained significant using both SD- and log-SD-based metrics. In the dWASO model, the interaction between centered objective WASO and N2 variability remained significant under both alternative variability definitions, although some between-individual main effects were attenuated.
Discussion
Sleep Variability Characteristics in Insomnia Patients
Using intensive multi-night home-based monitoring, this study characterized real-world sleep variability profiles in patients with chronic insomnia. Marked variability (CV >40%) was observed in wake after sleep onset, sleep stage latency, N3 and REM percentages, and REM density, whereas total sleep time, wakefulness index, sleep stage transition index, N1%, and N2% showed moderate variability (20% ≤ CV ≤ 40%). Sleep efficiency and cortical arousal index exhibited relatively low variability (CV < 20%). This pattern differs from the stability of core sleep parameters typically reported in healthy individuals,28 highlighting nocturnal sleep instability as a clinically relevant feature of insomnia.17,29 Such variability likely reflects interactions between physiological and psychological instability. Persistent cortical hyperarousal may disrupt sleep–wake transitions, while day-to-day fluctuations in cognitive–emotional factors, including stress and sleep-related preoccupations, may further amplify nightly instability.30,31 Sensitivity analyses further suggested that the main within-individual associations between nightly objective sleep changes and perception-bias outcomes remained robust after adjustment for demographic and clinical covariates, whereas some between-individual variability effects should be interpreted cautiously. These findings support the clinical relevance of sleep instability while avoiding overextension of the between-individual variability results.32
Perceptual Blunting: Intra-Individual and Inter-Individual Mechanisms
In this study, sleep perception bias was operationalized as the subjective–objective discrepancy in each sleep parameter, whereas perceptual blunting refers to reduced subjective responsiveness to nightly objective sleep changes. The multilevel models allowed us to examine both aspects: the level of perception bias and the extent to which subjective perception changed in response to within-individual objective sleep fluctuations.
At the within-individual level, subjective changes were consistently smaller than corresponding objective improvements or deteriorations in sleep parameters, suggesting reduced subjective responsiveness to nightly sleep changes. This pattern is consistent with established models of subjective sleep experience and sleep-state misperception.33,34 Prior research has suggested that persistent activation of the default mode network during sleep may contribute to perceived wakefulness despite objectively defined sleep,35 while impaired sensory gating and altered sleep spindle activity may reduce sensitivity to nocturnal micro-arousals.36 This dissociation between subjective perception and physiological sleep represents a core feature of sleep-state misperception in insomnia.37
At the between-individual level, lower total sleep time variability was associated with greater perceived TST and SE bias. This finding appears counterintuitive and should be interpreted cautiously. One possible explanation is that individuals with relatively stable but persistently poor sleep may have fewer opportunities for recalibrating subjective perception across nights, whereas greater variability may provide more salient contrast between better and worse nights. However, this interpretation remains exploratory and requires replication in larger samples.
In the dWASO model, higher N2 sleep percentage variability was associated with greater WASO perception bias and also moderated the association between centered objective WASO and dWASO, suggesting altered subjective responsiveness to nightly changes in objective wake time. Higher N2 sleep percentage variability may reflect broader instability in sleep architecture. However, because the portable EEG system does not provide direct microstructural validation comparable to laboratory polysomnography, this finding should not be interpreted as direct evidence of spindle instability or disrupted neural rhythms.34,38,39
Neurocognitive Mechanisms and Clinical Implications
Neurocognitive Considerations
The findings are compatible with existing neurocognitive models of insomnia, which implicate altered default mode network activity, reduced dopaminergic reward responsivity, and persistent high-frequency cortical oscillations in shaping subjective sleep experience.40,41 Although these mechanisms were not directly measured, they provide conceptual frameworks for interpreting the observed perceptual patterns. Dysfunction in temporal perception networks involving the prefrontal cortex and insula may further contribute to overestimation of sleep latency and wake duration.42 Future studies integrating ambulatory sleep monitoring with neuroimaging or neurochemical measures are required to directly test these hypotheses.
Clinical Implications
Rather than proposing a novel intervention paradigm, the present findings extend existing cognitive–behavioral models of insomnia by identifying sleep variability and perceptual calibration as quantifiable treatment targets. While traditional approaches focus on improving average sleep parameters, the current results emphasize the importance of reducing night-to-night instability and addressing distorted sleep perception. Interventions such as circadian regulation and cognitive restructuring may help stabilize sleep patterns, while objective sleep monitoring feedback may support perceptual recalibration and reduce discrepancies between subjective and objective sleep assessment.43 Multi-night home-based monitoring further captures fluctuations not detectable with single-night polysomnography, offering a practical approach for longitudinal evaluation.
Limitations and Future Directions
Study Limitations
This study has several limitations. First, the sample was drawn from a single center and consisted primarily of patients with moderate-to-severe chronic insomnia, which may limit generalizability. Second, the relatively wide age range and the absence of age-matched healthy controls limit our ability to determine whether the observed perceptual patterns are specific to chronic insomnia or partly related to aging. Although age was adjusted for in sensitivity analyses, future studies with larger samples and age-stratified control groups are needed. Third, although ambulatory EEG monitoring improves ecological validity, the portable device was not concurrently validated against laboratory polysomnography in the present sample. Therefore, sleep-stage-specific findings, particularly those involving N2 sleep, should be interpreted as exploratory. Fourth, although CV was used as the primary variability metric and SD/log-SD sensitivity analyses supported the main conclusions, variability-related between-individual effects may still be sensitive to the operationalization of sleep variability. Finally, sleep-related cognitive factors were not directly assessed.
Future Directions
Future research should adopt multi-center designs, integrate neurobiological measures, and evaluate combined sleep stabilization and perceptual recalibration interventions in randomized trials. Wearable technologies may further support personalized longitudinal monitoring and precision-oriented insomnia management.
Conclusion
Using a multilevel analytical approach, this study shows that nocturnal sleep variability is associated with subjective sleep perception in chronic insomnia. By characterizing reduced subjective responsiveness to nightly objective sleep changes, the findings refine existing models of sleep-state misperception and highlight sleep stability as a clinically meaningful dimension. Rather than introducing a new therapeutic framework, this work provides quantitative support for enhancing existing insomnia treatments through longitudinal monitoring and perceptual recalibration. N2-related findings should be interpreted as exploratory, given the use of portable EEG monitoring and the absence of concurrent polysomnographic validation.
Data Sharing Statement
The data and analysis code that support the findings of this study are available from the corresponding author upon request.
Ethics and Participant Consent
This study was conducted in accordance with the Declaration of Helsinki and approved by the Ethics Review Committee of Qilu Hospital of Shandong University (KYLL-202408-063-1). Written informed consent was obtained from all participants. A total of 50 patients with insomnia were recruited.
Acknowledgments
This research received no specific grant from any funding agency in the public, commercial, or not-for-profit sectors.
Author Contributions
Xiaoyu Xiao: Writing – original draft, Investigation, Formal analysis, Data curation. Shuo Liu: Writing – review & editing, Methodology. Zhuqing Xu: Data curation, Methodology. Fanzun Meng: Visualization. Fangchun Huang: Data curation, Writing – review & editing. Xiaochan Bi: Data curation, Writing – review & editing. Zixiang Guo: Data curation, Writing – review & editing. Yuqi Li: Data curation, Writing – review & editing. Wenjing Jiang: Writing – review & editing, Project administration, Conceptualization.
All authors took part in drafting, revising, or critically reviewing the article; gave final approval of the version to be published; have agreed on the journal to which the article has been submitted; and agree to be accountable for all aspects of the work.
Funding
This research received no external funding.
Disclosure
The authors report no conflicts of interest in this work.
References
1. Sateia MJ. International Classification of Sleep Disorders-Third Edition. Chest. 2014;146(5):1387–16. doi:10.1378/chest.14-0970
2. Yoon G, Lee MH, Oh SM, Choi JW, Yoon SY, Lee YJ. Negative and positive sleep state misperception in patients with insomnia: factors associated with sleep perception. J Clin Sleep Med JCSM Off Publ Am Acad Sleep Med. 2022;18(7):1789–1795. doi:10.5664/jcsm.9974
3. Rezaie L, Fobian AD, McCall WV, Khazaie H. Paradoxical insomnia and subjective–objective sleep discrepancy: A review. Sleep Med Rev. 2018;40:196–202. doi:10.1016/j.smrv.2018.01.002
4. Harvey AG, Tang NKY. (Mis)perception of sleep in insomnia: a puzzle and a resolution. Psychol Bull. 2012;138(1):77–101. doi:10.1037/a0025730
5. Hughes JM, Song Y, Fung CH, et al. Measuring Sleep in Vulnerable Older Adults: A Comparison of Subjective and Objective Sleep Measures. Clin Gerontol. 2018;41(2):145–157. doi:10.1080/07317115.2017.1408734
6. Williams JM, Kay DB, Rowe M, McCrae CS. Sleep Discrepancy, Sleep Complaint, and Poor Sleep Among Older Adults. J Gerontol Ser B. 2013;68(5):712–720. doi:10.1093/geronb/gbt030
7. Park JE, Lee YJ, Byun MS, et al. Differential associations of age and Alzheimer’s disease with sleep and rest-activity rhythms across the adult lifespan. Neurobiol Aging. 2021;101:141–149. doi:10.1016/j.neurobiolaging.2021.01.006
8. Liang Y, Zhao X, Zhang C, et al. Sleep Misperception and Associated Factors in Patients With Anxiety-Related Disorders and Complaint of Insomnia: A Retrospective Study. Front Neurol. 2022;13:836949. doi:10.3389/fneur.2022.836949
9. Buysse DJ, Cheng Y, Germain A, et al. Night-to-night sleep variability in older adults with and without chronic insomnia. Sleep Med. 2010;11(1):56–64. doi:10.1016/j.sleep.2009.02.010
10. Lunsford-Avery JR, Engelhard MM, Navar AM, Kollins SH. Validation of the Sleep Regularity Index in Older Adults and Associations with Cardiometabolic Risk. Sci Rep. 2018;8:14158. doi:10.1038/s41598-018-32402-5
11. Phillips AJK, Clerx WM, O’Brien CS, et al. Irregular sleep/wake patterns are associated with poorer academic performance and delayed circadian and sleep/wake timing. Sci Rep. 2017;7:3216. doi:10.1038/s41598-017-03171-4
12. Herbert V, Pratt D, Emsley R, Kyle SD. Predictors of Nightly Subjective-Objective Sleep Discrepancy in Poor Sleepers over a Seven-Day Period. Brain Sci. 2017;7(3):29. doi:10.3390/brainsci7030029
13. Bei B, Wiley JF, Trinder J, Manber R. Beyond the mean: A systematic review on the correlates of daily intraindividual variability of sleep/wake patterns. Sleep Med Rev. 2016;28:108–124. doi:10.1016/j.smrv.2015.06.003
14. Lim JA, Yun JY, Choi SH, Park S, Suk HW, Jang JH. Greater variability in daily sleep efficiency predicts depression and anxiety in young adults: Estimation of depression severity using the two-week sleep quality records of wearable devices. Front Psychiatry. 2022;13:1041747. doi:10.3389/fpsyt.2022.1041747
15. Patel SR, Hayes AL, Blackwell T, et al. The association between sleep patterns and obesity in older adults. Int J Obes. 2014;38(9):1159–1164. doi:10.1038/ijo.2014.13
16. Millar A, Espie CA, Scott J. The sleep of remitted bipolar outpatients: a controlled naturalistic study using actigraphy. J Affect Disord. 2004;80(2):145–153. doi:10.1016/S0165-0327(03)00055-7
17. Molzof HE, Emert SE, Tutek J, et al. Intraindividual sleep variability and its association with insomnia identity and poor sleep. Sleep Med. 2018;52:58–66. doi:10.1016/j.sleep.2018.08.014
18. Harvey AG. A cognitive model of insomnia. Behav Res Ther. 2002;40(8):869–893. doi:10.1016/S0005-7967(01)00061-4
19. Carney CE, Buysse DJ, Ancoli-Israel S, et al. The Consensus Sleep Diary: Standardizing Prospective Sleep Self-Monitoring. Sleep. 2012;35(2):287–302. doi:10.5665/sleep.1642
20. Maich KHG, Lachowski AM, Carney CE. Psychometric Properties of the Consensus Sleep Diary in Those With Insomnia Disorder. Behav Sleep Med. 2018;16(2):117–134. doi:10.1080/15402002.2016.1173556
21. Musich M, Beversdorf DQ, McCrae CS, Curtis AF. Subjective–Objective Sleep Discrepancy in a Predominantly White and Educated Older Adult Population: Examining the Associations With Cognition and Insomnia. J Gerontol Ser B. 2024;79(7):gbae074. doi:10.1093/geronb/gbae074
22. Bastien CH, Vallières A, Morin CM. Validation of the Insomnia Severity Index as an outcome measure for insomnia research. Sleep Med. 2001;2(4):297–307. doi:10.1016/S1389-9457(00)00065-4
23. Buysse DJ, Reynolds CF, Monk TH, Berman SR, Kupfer DJ. The Pittsburgh sleep quality index: A new instrument for psychiatric practice and research. Psychiatry Res. 1989;28(2):193–213. doi:10.1016/0165-1781(89)90047-4
24. Xu Y, Wen H, Li J, Yang J, Luo K, Chang L. The relationship between sleep disorders, anxiety, depression, and cognitive function with restless legs syndrome (RLS) in the elderly. Sleep Breath Schlaf Atm. 2022;26(3):1309–1318. doi:10.1007/s11325-021-02477-y
25. Fietze I, Penzel T, Partinen M, et al. Actigraphy combined with EEG compared to polysomnography in sleep apnea patients. Physiol Meas. 2015;36(3):385–396. doi:10.1088/0967-3334/36/3/385
26. Kwon S, Kim HS, Kwon K, et al. At-home wireless sleep monitoring patches for the clinical assessment of sleep quality and sleep apnea. Sci Adv. 2023;9(21):eadg9671. doi:10.1126/sciadv.adg9671
27. Lovato N, Micic G, Lack L. Sleep misestimation among older adults suffering from insomnia with short and normal objective sleep duration and the effects of cognitive behavior therapy. Sleep. 2021;44(5):zsaa250. doi:10.1093/sleep/zsaa250
28. Chouraki A, Tournant J, Arnal P, Pépin JL, Bailly S. Objective multi-night sleep monitoring at home: variability of sleep parameters between nights and implications for the reliability of sleep assessment in clinical trials. Sleep. 2023;46(5):zsac319. doi:10.1093/sleep/zsac319
29. Feige B, Benz F, Dressle RJ, Riemann D. Insomnia and REM sleep instability. J Sleep Res. 2023;32(6):e14032. doi:10.1111/jsr.14032
30. Dai Y, Ma J, Vgontzas AN, et al. Insomnia disorder is associated with 24-hour cortical hyperarousal. Sleep Med. 2024;124:681–687. doi:10.1016/j.sleep.2024.11.002
31. Lecci S, Cataldi J, Betta M, Bernardi G, Heinzer R, Siclari F. Electroencephalographic changes associated with subjective under- and overestimation of sleep duration. Sleep. 2020;43(11):zsaa094. doi:10.1093/sleep/zsaa094
32. Arora T, Vaquerizo-Villar F, Hornero R, Gozal D. Sleep irregularity is associated with night-time technology, dysfunctional sleep beliefs and subjective sleep parameters amongst female university students. Sci Rep. 2025;15(1):6374. doi:10.1038/s41598-025-90720-x
33. Masaki M, Tsumoto S, Tani A, et al. Discrepancies between subjective and objective sleep assessments revealed by in-home electroencephalography during real-world sleep. Proc Natl Acad Sci U S A. 2025;122(3):e2412895121. doi:10.1073/pnas.2412895121
34. Joo EH, Altier HR, Selai C, et al. Neurobiological mechanisms of sleep state misperception in insomnia disorder: A theoretical review. Sleep Med Rev. 2025;81:102096. doi:10.1016/j.smrv.2025.102096
35. Andrews-Hanna JR. The brain’s default network and its adaptive role in internal mentation. Neurosci Rev J Bringing Neurobiol Neurol Psychiatry. 2012;18(3):251–270. doi:10.1177/1073858411403316
36. Muzet A. Alteration of sleep microstructure in psychiatric disorders. Dialogues Clin Neurosci. 2005;7(4):315–321. doi:10.31887/DCNS.2005.7.4/amuzet
37. Galbiati A, Sforza M, Scarpellino A, et al. “Thinking About Thinking” in Insomnia Disorder: The Effect of Cognitive-Behavioral Therapy for Insomnia on Sleep-Related Metacognition. Front Psychol. 2021;12:705112. doi:10.3389/fpsyg.2021.705112
38. Normand MP, St-Hilaire P, Bastien CH. Sleep Spindles Characteristics in Insomnia Sufferers and Their Relationship with Sleep Misperception. Neural Plast. 2016;2016:6413473. doi:10.1155/2016/6413473
39. Li J, Ilina A, Peach R, et al. Falling asleep follows a predictable bifurcation dynamic. Nat Neurosci. 2025;28:2515–2525. doi:10.1038/s41593-025-02091-1
40. Stoffers D, Altena E, van der Werf YD, et al. The caudate: a key node in the neuronal network imbalance of insomnia? Brain J Neurol. 2014;137(Pt 2):610–620. doi:10.1093/brain/awt329
41. Stephan AM, Lecci S, Cataldi J, Siclari F. Conscious experiences and high-density EEG patterns predicting subjective sleep depth. Curr Biol CB. 2021;31(24):5487–5500.e3. doi:10.1016/j.cub.2021.10.012
42. Li Y, Zou G, Shao Y, et al. Sleep discrepancy is associated with alterations in the salience network in patients with insomnia disorder: An EEG-fMRI study. NeuroImage Clin. 2022;35:103111. doi:10.1016/j.nicl.2022.103111
43. Cudney LE, Green SM, McCabe RE, Frey BN. Cognitive behavioural therapy for insomnia decreases the discrepancy between objective and subjective measures of sleep. Trends Psychiatry Psychother. 2025;47:e20240819. doi:10.47626/2237-6089-2024-0819
 © 2026 The Author(s). This work is published and licensed by Dove Medical Press Limited. The
full terms of this license are available at https://www.dovepress.com/terms
and incorporate the Creative Commons Attribution
- Non Commercial (unported, 4.0) License.
By accessing the work you hereby accept the Terms. Non-commercial uses of the work are permitted
without any further permission from Dove Medical Press Limited, provided the work is properly
attributed. For permission for commercial use of this work, please see paragraphs 4.2 and 5 of our Terms.
© 2026 The Author(s). This work is published and licensed by Dove Medical Press Limited. The
full terms of this license are available at https://www.dovepress.com/terms
and incorporate the Creative Commons Attribution
- Non Commercial (unported, 4.0) License.
By accessing the work you hereby accept the Terms. Non-commercial uses of the work are permitted
without any further permission from Dove Medical Press Limited, provided the work is properly
attributed. For permission for commercial use of this work, please see paragraphs 4.2 and 5 of our Terms.