")
Back to Journals » International Journal of General Medicine » Volume 16
Nicotinamide N-Methyl Transferase as a Predictive Marker of Tubular Fibrosis in CKD
Authors Ye Q, Xu G , Huang H, Pang S , Xie B, Feng B , Liang P , Qin Y, Li S, Luo Y, Xue C, Li W
Received 19 May 2023
Accepted for publication 12 July 2023
Published 7 August 2023 Volume 2023:16 Pages 3331—3344
DOI https://doi.org/10.2147/IJGM.S420706
Checked for plagiarism Yes
Review by Single anonymous peer review
Peer reviewer comments 3
Editor who approved publication: Dr Scott Fraser
Qinglin Ye,* Guiling Xu,* Haizhen Huang,* Shuting Pang, Boji Xie, Bingmei Feng, Peng Liang, Yijie Qin, Siji Li, Yin Luo, Chao Xue, Wei Li
Department of Nephrology, The Second Affiliated Hospital of Guangxi Medical University, Nanning, People’s Republic of China
*These authors contributed equally to this work
Correspondence: Wei Li; Chao Xue, Department of Nephrology, The Second Affiliated Hospital of Guangxi Medical University, Nanning, Guangxi, 530021, People’s Republic of China, Email [email protected]; [email protected]
Purpose: Chronic kidney disease (CKD) progression is complex. There are not standardized methods for predicting the prognosis of CKD. Nicotinamide N-methyltransferase (NNMT) has been shown to be associated with renal fibrosis. This study aimed to validate NNMT as a prognostic biomarker of progressive CKD.
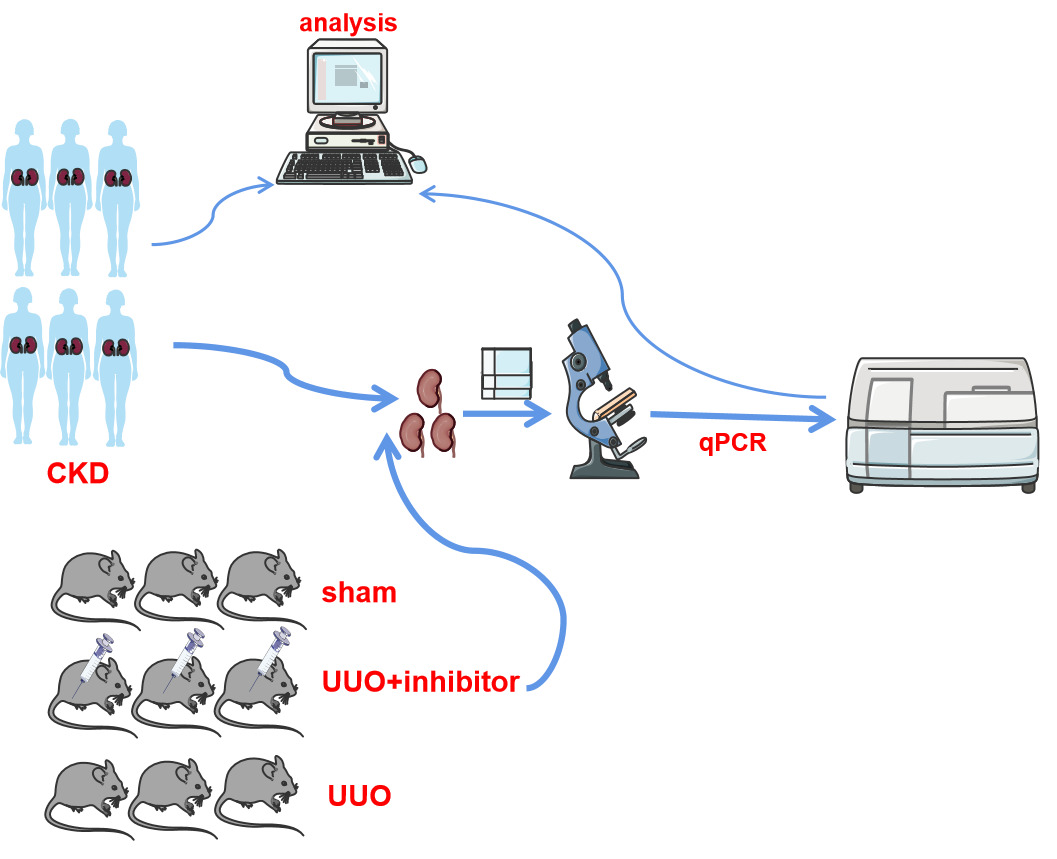
Patients and Methods: We explored the relationship between NNMT expression and CKD-related outcome variables using the NephroseqV5 and GEO databases. Additionally, a validation set of 37 CKD patients was enrolled to measure the correlation between NNMT expression levels and CKD outcomes. Furthermore, single-cell RNA sequencing data and the Human Protein Atlas were reanalyzed to investigate the expression specificity of NNMT in the kidney. Finally, to detect the status of NNMT expression with tubular fibrosis in vivo, we constructed a unilateral ureteral obstruction (UUO) mouse treated with an NNMT inhibitor.
Results: Analyzing the datasets showed that NNMT was expressed mainly in proximal tubule compartments. And patients with high NNMT expression levels had a significantly lower overall survival rate compared to those with low NNMT expression levels (P = 0.013). NNMT was independent of prognosis factors in the multivariate Cox regression model, and the AUCs for CKD progression at 1, 3, and 5 years were 0.849, 0.775, and 0.877, respectively. Pathway enrichment analysis indicated that NNMT regulates the biological processes of tubulointerstitial fibrosis (TIF). In the validation group, NNMT levels were significantly higher in the CKD group combined with interstitial fibrosis. In vivo, NNMT was a high expression in the UUO group, peaking at postoperative day 21. Treatment with an NNMT inhibitor improved renal tubular interstitial fibrosis, and expression levels of FN, α-SMA, VIM, and TGF-β 1 were decreased compared with UUO (P < 0.05).
Conclusion: NNMT was expressed mainly in tubular renal compartments, and associated with CKD prognosis. It holds potential as a diagnostic biomarker for tubular fibrosis in CKD.
Keywords: nicotinamide N-methyl transferase, tubular fibrosis, chronic kidney disease, biomarker diagnosis
Graphical Abstract:
Introduction
Chronic kidney disease (CKD) inevitably progresses to end-stage renal disease (ESRD), regardless of the initial cause or level of renal impairment. Early detection of progressive CKD is crucial for implementing early interventions to mitigate severity and prevent complications. Kidney fibrosis is the primary characteristic of CKD progression, and currently, there is no effective treatment for fibrosis.1,2 Estimated Glomerular filtration rate (eGFR) and proteinuria are widely utilized for clinical diagnosis and treatment monitoring; however, there is ongoing controversy surrounding their use.1,3 The degree of eGFR variation in these measures represents the renal functional reserve, which only increases once patients have developed renal insufficiency.4 Proteinuria is a significant risk factor for CKD progression.5 While proteinuria may regress, remain stable, or progress in renal disorders, early eGFR loss leads to CKD and ESRD.6 These biomarkers are inadequate for predicting and monitoring disease progression in CKD.7,8 Consequently, novel biomarkers are needed to enhance the prediction of CKD progression, enabling the identification of high-risk patients who may benefit from precision management and intensified treatment.9,10
Nicotinamide N-methyltransferase (NNMT), a Phase II metabolizing enzyme, catalyzes the methylation of nicotinamide and other pyridines into pyridinium ions.11,12 It plays an important role in regulating lipid and glucose metabolism, inflammation, and energy homeostasis.13–15 NNMT, mainly expressed in the liver and some organs (including kidney), is a potential biomarker for predicting oncological outcomes in urological cancers.16,17 On one hand, some studies have indicated that knockdown of NNMT leads to the death of renal tubular epithelial cells, while overexpression of NNMT inhibits apoptosis of renal tubular epithelial cells. Additionally, NNMT was upregulated in unilateral ureteral obstruction (UUO) mouse and TGF-β1-induced renal tubular epithelial cells, suggesting it may serve as a protective compensatory response to Tubulointerstitial fibrosis (TIF).18,19 Increased expression of NNMT may be an adaptive immune response and play an active role in muscle fiber repair.20 On the other hand, some researchers have found that NNMT deficiency improves renal fibrosis.21 The role of NNMT in kidney disease progression is controversial, and the biological mechanisms by which NNMT contributes to CKD and its progression remain incompletely understood.17 In this study, NNMT was validated as a potential prognostic biomarker for tubular fibrosis in progressive CKD, and inhibition of NNMT using small molecule inhibitors was found to improve the degree of tubulointerstitial fibrosis. These findings suggest that NNMT could potentially serve as a therapeutic target for renal fibrosis in progressive CKD.
Materials and Methods
NNMT Gene Expression Analysis on NephroseqV5 Database
NNMT expression analysis was conducted using the NephroseqV5 database.22 The Ju CKD and Ju CKD2 datasets were utilized to extract NNMT expression. A comparison was made between NNMT expression in CKD tissue and healthy living donor tissue. Co-expressed genes associated with NNMT were extracted from the datasets, and genes with a Pearson’s correlation coefficient |r| > 0.5 were screened. For pathway and tissue enrichment analysis of co-expressed genes, the Kyoto Encyclopedia of Genes and Genomes (KEGG) pathway and Gene Ontology (GO) term enrichment were performed.
Accessing NNMT Association with CKD Progression
Gene expression data from the discovered cohort of 68 patients were obtained from NCBI’s Gene Expression Omnibus (GSE60861).23 Analysis of the data was performed using the limma package in the R statistical software framework.24 CKD progression was defined as the development of ESRD or a doubling of serum creatinine during a minimum follow-up period of six months. The stable group consisted of patients who did not develop ESRD or double serum creatinine.25 Nineteen of the sixty-eight CKD patients who developed ESRD were therefore categorized as the progressive group. Preprocessing of the data included background correction, quantile normalization, and summarization of probes with identical sequences on the array. Differentially expressed transcripts between stable and progressive patients were identified using the SAM (significant analysis of microarrays (SAM) method, with a false discovery rate (FDR) set as <5%.
On the other hand, based on the median value of NNMT, the dataset was divided into low-expression and high-expression groups to explore the relationship between NNMT expression level and clinical features.
Validation of Evaluated NNMT Expression in Patients with CKD
A total of 37 patients, with histopathologically confirmed various glomerular diseases, were enrolled as a validation set. Inclusion criteria were abnormality in kidney structure or function present for more than 3 months, with health implications.23 Exclusion criteria were acute tubular injury, malignancies, severely impaired hepatic function, and other rheumatic diseases. Renal biopsy tissues were obtained and immediately frozen in liquid nitrogen for Real-time Quantitative PCR (qRT-PCR) to explore the relationship between NNMT expression and progressive CKD. Progressive chronic kidney disease (CKD) is an increased degree of tubulointerstitial atrophy and fibrosis.26 Therefore, patients that chronic kidney disease with tubulointerstitial fibrosis were defined as TIF/CKD group, and patients with basically normal renal tubules were defined as a control group. All biopsies were assessed by pathologists blinded to patient outcomes. A renal tubulointerstitial lesion is defined as tubulointerstitial fibrosis. Semiquantitative analysis was scored as follows: 0 = no lesion; 1 = lesion of ≤1% of areas; 2 = lesion of 1–25% of areas; 3 = lesion of 26–50% of areas; and 4 = lesion of >50% of areas.27 This study was approved by the ethics commission of Guangxi Medical University Ethics Committee and was performed under the ethical principles of the Declaration of Helsinki (approval number:2019-KY (0108)). Written informed consent was obtained from all study participants prior to sample collection.
Single-Cell RNA Sequencing Data Download and Processing
To understand the localization of NNMT in the kidney, the Single-nucleus sequencing data (GSE131685)28 was downloaded from the GEO database. The data included single-cell RNA sequencing of three normal human kidney samples. Downstream analysis was performed in the R statistical software.
Dimensionality Reduction Analysis of Single-Cell Data and Identification of Cell Subpopulations
The MergeSeurat function was used to merge the three kidney data sets. Cells with <500 and >4000 genes and cells with 15% mitochondrial RNA reads were excluded based on the median number of genes, percentage of mitochondrial genes, and mRNA reads. The relationship between the percentage of mitochondrial genes and mRNA reads was detected and visualized, as well as the relationship between the number of mRNAs and mRNA reads (Supplementary Figure 1A and B). To mitigate the batch effect in downstream analysis, the R package Harmony was employed to integrate the scRNA-seq data. The data were then normalized through log-normalization, and the FindVariableFeatures function was utilized to identify highly variable genes. Principle component analysis was performed on these highly variable genes using the RunPCA function (Supplementary Figure 1C and D). Finally, cell clustering was carried out using the FindNeighbors and FindClusters functions (set Resolution = 0.1) to identify seven different cell types (Supplementary Figure 2A and B). Cluster annotation was performed using SingleR and the Human Protein Atlas.29
NNMT Expression Analysis in Renal Compartments
The expression of NNMT mRNA was analyzed using data from GSE21785, which included 6 samples from kidney biopsies of transplant Living Donors. Additionally, the expression distribution of NNMT in renal compartments was observed using data from the Human Protein Atlas.29
Animal Model
The ethical approval of the project was obtained from the Animal Ethics Committee of Guangxi Medical University (No.202101019). All experimental animal procedures were performed following standard ethical rules and the experiments conformed to the Guide for the Care. Male C57BL/6 mice were obtained from Guangxi Medical University Animal Center and housed under standard conditions with a regular light/dark cycle, free access to water, and chow. The mice were randomly assigned to three groups: sham, UUO, or UUO+JBSNF-00008830 (n=4-6 mice per group). The UUO procedure was performed on all mice, except those in the sham group. The UUO+JBSNF-000088 group received daily oral administration of JBSNF-000088 at a dosage of 50 mg/kg body weight, starting one day after the UUO operation. The sham and UUO-only groups were treated with saline. On days 3, 7, 14, and 21 after the UUO operation, the bilateral kidneys were rapidly harvested under obstruction and washed with saline. The experiments followed the Guide for the Care and Use of Laboratory Animals, and approval was obtained from Guangxi Medical University. Kidneys were obtained and immediately frozen in liquid nitrogen for qRT-PCR, and biochemical assays or fixed in neutral buffered formalin for histochemical examination.
Histology
Renal tissue was fixed overnight in 4% paraformaldehyde, embedded in paraffin, and sectioned into 4 μm slices. Serial sections were prepared for hematoxylin and eosin (HE) staining and Masson trichrome staining. Renal tubulointerstitial lesions, including tubular dilation, tubular atrophy, cast formation, and tubulointerstitial fibrosis, were evaluated. Collagen deposition areas in each mouse kidney tissue were quantified using Masson trichrome staining and analyzed with NIH Image J software.
Quantitative Real-Time PCR (qRT-PCR)
Total mRNA was isolated from mouse kidney tissue and 37 kidney biopsies using Trizol (Invitrogen, Thermo Fisher Scientific). 1 μg of RNA was used to synthesize cDNA with the PrimeScript RTreage-nt kit (Takara, DRR037A) according to the manufacturer’s protocol. qRT-PCR was performed with SYBR Green (Takara, Dalian, China) using an Applied Biosystems 7500 Real-Time PCR System (Thermo Fisher Scientific) as instructed. The relative expression levels of the indicated genes were compared with those of GAPDH, and expression fold changes were calculated using the 2-ΔΔCT method. Each qRT-PCR reaction was performed in triplicate.
Statistical Analysis
Statistical analyses were conducted using SPSS version 23.0 and R version 3.6.3. The data are presented as the mean ± SD. For normally distributed data, a two-tailed unpaired Student’s t-test was used for pairwise comparisons, and one-way ANOVA was used for multi-group comparisons. The nonparametric Kruskal–Wallis test and Mann–Whitney U-test were used when the data did not exhibit a normal distribution. Single-factor ANOVA was used for comparison among multiple groups, and pairwise comparison in multiple groups was conducted with an LSD t-test. The log‐rank test was used to assess survival, and the Cox proportional hazards model was constructed for univariable and multivariable Cox regression analysis of prognostic factors. TimeROC curve analysis was employed to assess diagnostic value. All tests were two-sided, and a p-value less than 0.05 was considered statistically significant.
Results
NNMT Increases with CKD Progression and is Associated with Renal Function Decline
The Ju CKD Tublnt and Ju CKD Tublnt2 sets were extracted from Nephroseqv5, which includes arterial hypertension, diabetic nephropathy, focal segmental glomerulosclerosis, IgA nephropathy, lupus nephritis, membranous glomerulonephropathy, minimal change disease, vasculitis, and thin basement membrane disease. Compared to healthy living donors, NNMT showed elevated expression in CKD (Figure 1A). The results demonstrate a gradual increase in NNMT mRNA levels with CKD stage (Figure 1B). The NNMT expression progressively rises with CKD stage and shows a negative correlation with eGFR (Figure 1C). Among various types of histopathological nephropathy, NNMT is highly expressed in focal segmental glomerulosclerosis, diabetic nephropathy, and vasculitis (Figure 1D).
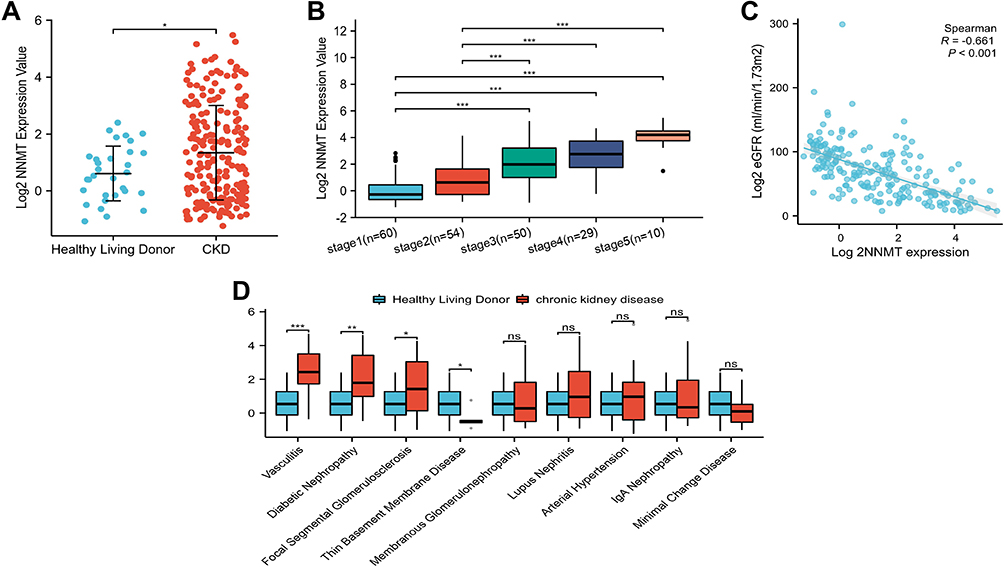 |
Figure 1 Correlation Analysis between NNMT and CKD clinical variables. (A) The expression level of NNMT between healthy living donors and CKD; (B) NNMT mRNA levels in different CKD stages; (C) Correlation analysis between NNMT mRNA level and eGFR. (D) NNMT mRNA levels in different types of chronic kidney disease. *P < 0.05; **P < 0.01; ***P < 0.001. Abbreviations: CKD, Chronic Kidney Disease; eGFR, estimated Glomerular Filtration Rate. |
Functional Annotation and Pathway Enrichment Analysis of NNMT-Correlated Genes in CKD Patients
We screened the intersection of candidate gene sets containing 57 genes for co-expressed genes using Pearson’s correlation coefficient (|r| > 0.5) from the Juvenile CKD and Juvenile CKD2 datasets in the NephroseqV5 database (Figure 2A). We extracted the co-expressed genes associated with NNMT expression from the datasets, which are involved in cell-cell adhesion and extracellular matrix structural constituents. According to KEGG pathway predictions, the correlated genes can be grouped into significant pathways, including the PI3K-Akt signaling pathway and Electronic countermeasures (EMC) receptor interaction (Figure 2B and C). The analyses reveal the involvement of complex biological processes or metabolic pathways in renal tubular fibrosis.
 |
Figure 2 Analysis of GO and KEGG. (A) The intersection of candidate gene sets contains 57 genes for the co-expressed genes that were screened at Pearson’s correlation coefficient |r|>0.5 from JU CKD and JU CKD2 data sets in the NephroseqV5 database; (B) Description of KEGG pathway enrichment analysis of 57 genes pathway (C) Description of GO pathway enrichment analysis of 57 genes pathway. Abbreviations: CKD, Chronic Kidney Disease; GO, Gene Ontology; BP, biological process; CC, cellular component; MF, molecular function; KEGG, Kyoto Encyclopedia of Genes and Genomes. |
Association of NNMT with CKD Progression in the Discovery Cohort
We used a retrospective cohort of 68 patients with various CKD diagnoses as the discovery cohort to evaluate the association of NNMT with CKD progression. Based on the median value of NNMT, the dataset was divided into low-expression and high-expression groups. Compared to the low-expression group, the high-expression group showed increased creatinine levels, declined eGFR, and higher comorbidity rates. (Table 1). The survival curves (Figure 3) demonstrated that the median survival time of patients with high NNMT expression was 66 months, and that of patients with low NNMT expression was 88 months. There was a significant difference in overall survival between NNMT mRNA high and low expression groups.
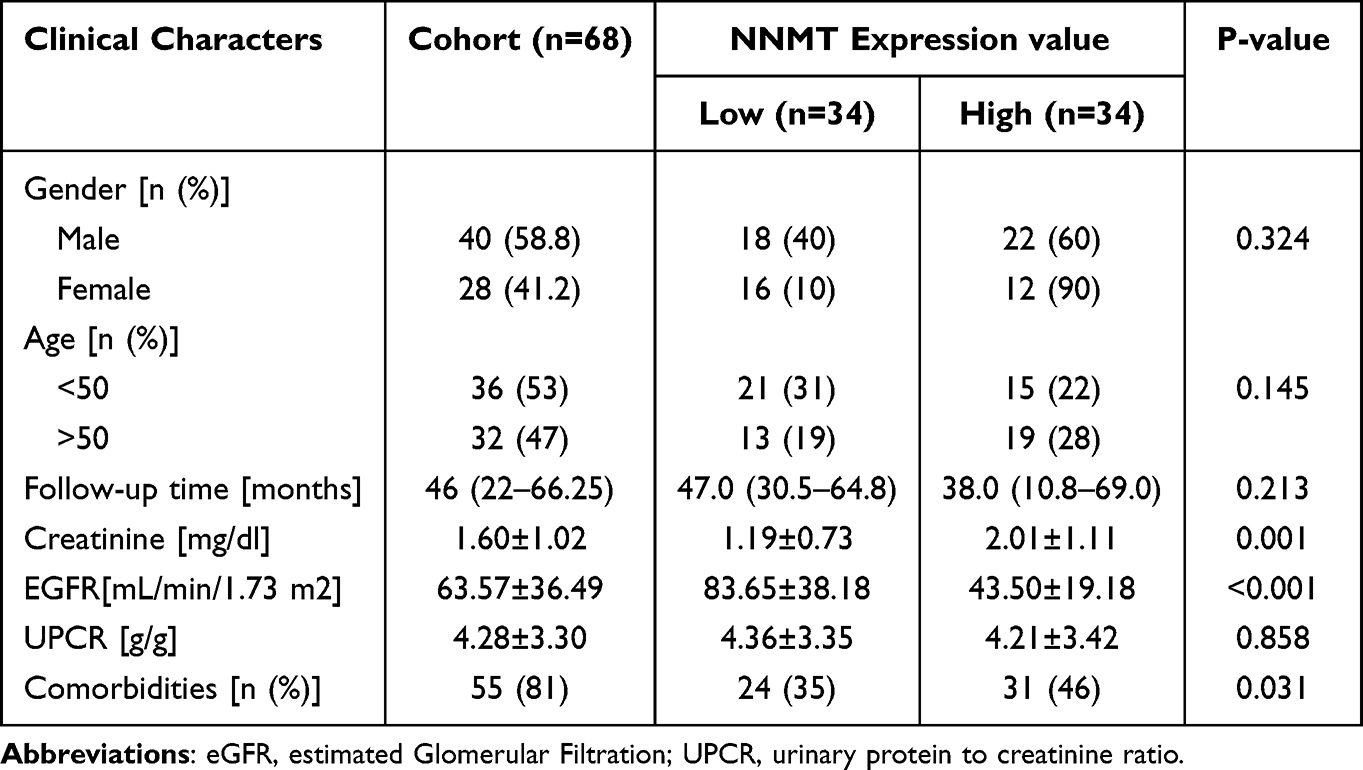 |
Table 1 Association Between Clinical Characteristics and NNMT Expression in CKD Cohort |
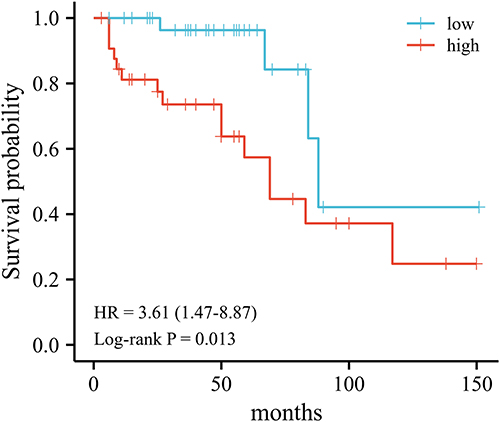 |
Figure 3 Survival curves of high and low expression of NNMT. |
Another, NNMT levels were significantly higher in the progressive group by comparing the CKD progression group with the CKD stable group (Figure 4A). Univariate Cox regression analysis identified gender (male), serum creatinine, and NNMT as prognostic factors for worsening CKD progression. Theses variables that were significant in the univariate Cox regression analysis (Figure 4B) were included in the multivariate Cox regression analysis. Elevated NNMT expression was identified as an independent prognostic risk factor for CKD progression (Figure 4C). The area under the ROC curve (AUC value) at 1 year, 3 years, and 5 years was 0.849, 0.775, and 0.877, respectively, indicating a better prediction of CKD progression (Figure 4D).
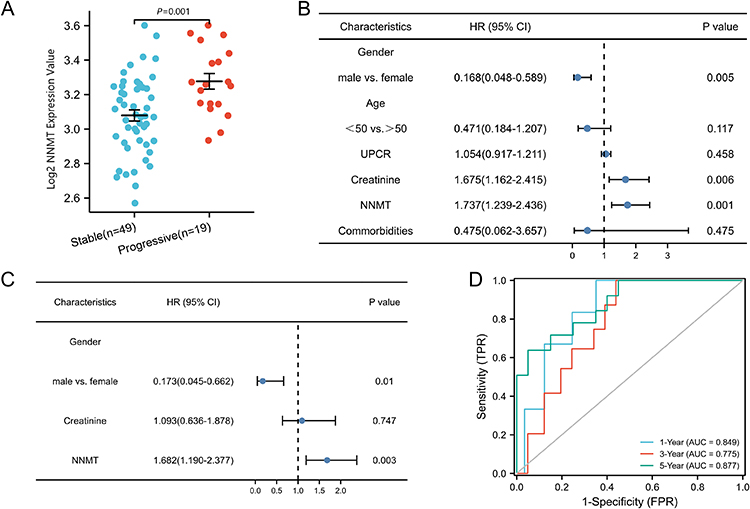 |
Figure 4 Correlation between NNMT and CKD progression. (A) NNMT mRNA levels in CKD kidney tissue; (B) One-way COX regression analysis; (C) multi-way COX regression analysis model; (D) time-dependent ROC curves. Abbreviations: CKD, Chronic Kidney Disease; ROC: Receiver Operating Characteristic. TPR, True Positive Rate; FPR, False positive rate. CI: confidence interval; HR, hazard ratio. UPCR, Urinary Protein to Creatinine Ratio. |
NNMT Increases in Renal Tubular Fibrosis Tissue and is Associated with the Degree of Fibrosis
To assess the clinical relevance of NNMT in CKD, we performed qRT-PCR on kidney biopsy specimens from 37 CKD patients with various nephropathies (Table 2). Compared with the control group, the expression of NNMT was strikingly increased in CKD/TIF group (Figure 5A). The semiquantitative analysis scoring of renal tubulointerstitial fibrosis (TIF score) demonstrated a positive correlation between the NNMT expression and the TIF score (Figure 5B). Furthermore, NNMT expression showed a negative correlation with eGFR (Figure 5C).
 |
Table 2 NNMT Expression and Clinicopathological Parameters in the Validation Set |
 |
Figure 5 Correlation analysis between NNMT and the degree of renal fibrosis. (A) NNMT expression levels in CKD kidney tissues; (B) NNMT correlation analysis with fibrosis index; (C) Correlation analysis between NNMT and eGFR. *P < 0.05; **P < 0.01; ***P < 0.00. Abbreviations: TIF/CKD, CKD with tubulointerstitial Fibrosis; CKD, Chronic Kidney Disease; TIF, Tubulointerstitial fibrosis; eGFR, estimated Glomerular Filtration. |
Validation of Increased NNMT Levels in a Single-Cell RNA Sequencing Reanalysis
We found that NNMT expression was mainly significantly upregulated in the proximal tubule cells (Figure 6A–D). In addition, by exploring the Human Protein Atlas (HPA), we confirmed that NNMT expression was mainly significantly upregulated in proximal tubule cells (Figure 6E), which is consistent with our analysis results.
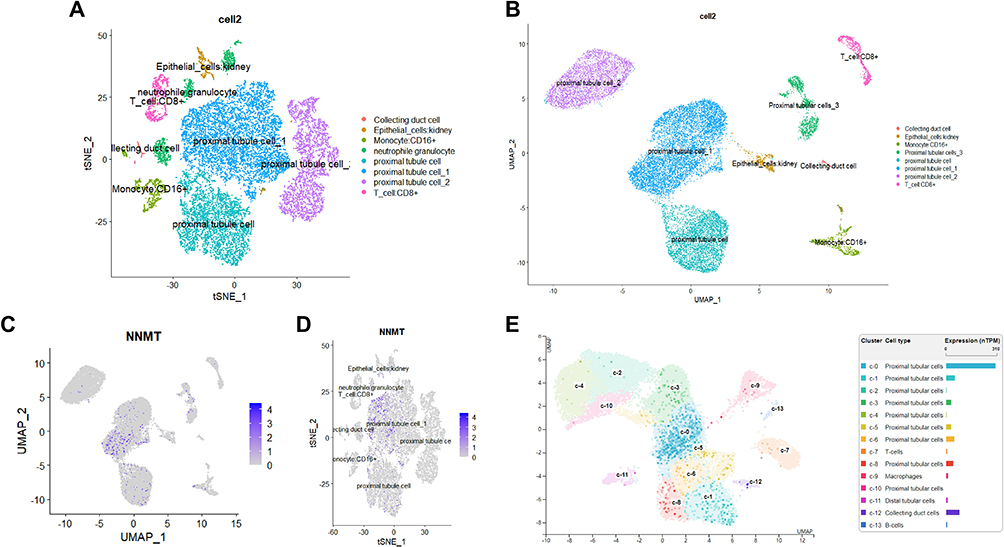 |
Figure 6 Classification of cell clusters and location of marker genes. (A) tSNE plot of cell clusters identified based on the expression of highly variable genes. (B) UMAP plot of cell clusters identified based on the expression of highly variable genes. (C) UAMP plot showing the cell clusters where NNMT is located; (D) tSNE plot showing the cell clusters where NNMT is located; (E) NNMT expression was significantly upregulated in the proximal tubule cell by exploring HPA. Abbreviations: UMAP, Uniform Manifold Approximation and Projection; t-SNE, t-distributed stochastic neighbor embedding; HPA, Human Protein Atlas. |
NMMT Expressed in Tubular Renal Compartments
NNMT was found to be predominantly distributed in proximal tubules based on the Human Protein Atlas. Immunohistochemical staining analysis of normal renal tissue from the HPA data indicated that NNMT was predominantly expressed in tubular compartments rather than glomerular compartments. Furthermore, the baseline gene expression abundances in renal tissues were calculated using dataset from GSE21785, revealing that NNMT was highly expressed in tubular renal compartments compared to glomerular compartments (Figure 7A and B).
 |
Figure 7 NNMT compartment-specific expression in the kidney. Notice. (A) Location distribution of NNMT mRNA expression levels in renal tissue; (B) Immunohistochemical map of NNMT expression in normal kidney. Abbreviation: HPA, Human Protein Atlas. |
Effect of JBSNF0000-88 Inhibition on NNMT Expression in UUO
Compared to the sham group, NNMT expression in UUO renal tissue began to increase on the third day after the UUO procedure and peaked on the twenty-first day (Figure 8A). JBSNF0000-88, a small molecule compound used as an NNMT inhibitor in vivo,31 was administered to UUO mice one day after the operation, resulting in a significant decrease in NNMT mRNA levels compared to the UUO-only group (Figure 8B). Masson staining demonstrated that compared with the sham group, the UUO group showed significantly increased renal fibrosis, and JBSNF-000088 group significantly improved the degree of fibrosis in the UUO model (Figure 8C and D). Additionally, the mRNA levels of TGFβ1, α-SMA, WIN, and FN were decreased in the JBSNF0000-88 group compared to the UUO-only group (Figure 8E). In summary, UUO mice with tubule-specific loss of NNMT exhibited lower levels of interstitial fibrosis. Severe tubulointerstitial lesions, including tubular dilation, tubular atrophy, and tubulointerstitial fibrosis, were observed in UUO mice.
 |
Figure 8 JBSNF-00008 attenuated the degree of renal fibrosis in the UUO model. (A) Detection of NNMT mRNA levels in kidney tissues of UUO model mice by qRT-PCR. (B) NNMT mRNA levels in renal tissues of drug-treated UUO mice were measured by RT-qPCR; (C) Masson staining of kidney tissues (x400); (D) Semi-quantitative statistical comparison of Masson stained blue collagen area; (E) qRT-PCR detection of mRNA levels of fibrosis indicators in kidney tissues; comparison between groups. ns, P >0.05, *P < 0.05; **P < 0.01. ***P < 0.001. Abbreviations: UUO, unilateral ureteral obstruction; TGFBβ1, transforming growth factor-β1; VIM, vimentin; α-SMA, Myofibroblasts, with their characteristicα-smooth muscle actin; FN: fibronectin. |
Discussion
The complex etiology of chronic kidney disease (CKD) and the variable rate of development during the latent phase of the disease32 impede the identification of early markers and effective therapeutics for disease progression.9,33,34 As a result, CKD has become a rapidly growing global cause of death.35 The research focus has shifted towards developing a biomarker with high sensitivity and specificity for different stages of CKD and exploring the combined evaluation of multiple biomarkers.36
Tubulointerstitial fibrosis and atrophy are common features in almost all forms of kidney disease, and their severity has consistently proven to be reliable indicators in biopsies for predicting progression to end-stage renal disease (ESRD). Tubulointerstitial fibrosis is the histopathological hallmark of CKD, and the extent of fibrosis is the best predictor of progression to ESRD.37,38 However, early detection of interstitial fibrosis and tubular atrophy is challenging and is often observed in the advanced stages of CKD.39 In this study, we identified target genes through databases and analyzed both the NephroseqV5 and GEO databases to explore the correlation between NNMT mRNA expression levels and CKD outcomes. We found that NNMT is predominantly expressed in proximal tubules based on single-cell sequencing analysis. Additionally, we verified the protective effect of NNMT in kidney tissues of mice with unilateral ureteral obstruction (UUO) and in 37 CKD patients, providing innovative evidence for the anti-fibrotic effect of NNMT from multiple perspectives. The main findings of this study are as follows: a) NNMT is highly expressed in tubular renal compartments; b) NNMT is upregulated in CKD patients and associated with a decline in renal function; c) NNMT has the potential to be a biomarker for CKD progression; and d) NNMT’s actions appear to be related to specific effects exerted in tubulointerstitial fibrosis. The degree of renal tubular fibrosis worsened with increased NNMT expression, providing new theoretical support for preventing CKD from progressing to ESRD.
NNMT is a key metabolic regulator that can induce abnormal pathophysiological changes in fibroblasts by affecting genes related to collagen production.40 Meantime, It can even serve as a biomarker for urological tumor progression.17,41 The findings of the present study indicate that NNMT was upregulated in CKD populations and associated with both a decrease in renal function and the degree of renal fibrosis, making it a potential biomarker for CKD progression. Through bioinformatics analysis, we found a significant correlation between NNMT mRNA expression and the disease stage and decline in renal function in CKD patients. Multivariate analysis revealed that high expression of NNMT mRNA was an independent prognostic factor in CKD patients. Importantly, NNMT may be stable in body fluids such as plasma, serum, and urine samples. Studies have demonstrated that NNMT expression levels are significantly higher in patients with bladder tumors, and urine NNMT expression levels serve as an accurate diagnostic criterion for early and non-invasive diagnosis of bladder cancer.42,43 Considering that renal tubular fibrosis can be assessed in CKD patients through blood and urine tests, NNMT has great potential as a biomarker for predicting, monitoring, and improving the prognosis of CKD.
Our study also revealed that NNMT significantly regulates the PI3K-Akt signaling pathways and extracellular matrix (ECM) receptor interaction in CKD. Previous studies have shown that NNMT knockdown effectively inhibits the invasive capacity of clear-cell renal cell carcinoma (ccRCC) cells and plays a key role in cell invasion by activating the PI3K/Akt/SP1/MMP-2 pathway in ccRCC.44 We hypothesize that NNMT may play a crucial role in the progression of renal fibrosis through the PI3K-Akt signaling pathway. However, the underlying mechanism still needs to be explored.
Currently, the most widely used model for studying tubulointerstitial fibrosis is UUO, in which surgical obstruction of the ureter leads to hemodynamic changes within the kidney, followed by tubular injury and cell death. We inhibited NNMT expression using inhibitors and detected the expression of related pro-fibrosis factors using qRT-PCR. The results showed that compared to the model group, the inhibitor group exhibited increased expression levels of pro-fibrosis factors and a greater degree of cell fibrosis. High expression levels of NNMT were induced in UUO mice, consistent with previous studies that found increased expression of NNMT in mouse models, indicating its involvement in oxidative stress, inflammation, and apoptosis in renal tubular cells,45 Furthermore, NNMT has been shown to play a significant role in renal interstitial fibrosis through injury, inflammation, and apoptosis of renal tubular cells,46 which is partially consistent with the results of our study.
A recent study demonstrated that upregulation of NNMT in a UUO model can mitigate the extent of renal tubular interstitial fibrosis, suggesting that NNMT is a potential molecular target for the treatment of renal fibrosis.18 The main mechanism involved the metabolites of NNMT.21 However, another study found that overexpression of NNMT in the kidney may dysregulate NAD+ and methionine metabolism, ultimately leading to renal fibrosis.21 Faced with different research outcomes, we explored the relationship between NNMT and kidney disease from a completely new angle. We confirmed that NNMT was positively correlated with tubulointerstitial fibrosis, and high expression of NNMT was a risk factor for CKD patients. Furthermore, a study found that Qian Yang Yu Yin protected hypertensive rats from hypertension-induced kidney injury by inhibiting NNMT,47 which provides further support for our conclusion. The underlying pathophysiological mechanism of NNMT in renal fibrosis still needs to be investigated. Nevertheless, the aforementioned evidence suggests that NNMT plays a crucial role in fibrosis. The complex role of NNMT in disease and physiology, along with its tissue specificity, makes it an attractive target for drug development.
This study has limitations. Retrospective studies analyzing large public databases have limitations in providing continuous follow-up data that can offer timely understanding of real-world practice advantages. Additionally, investigating the role of NNMT by using pharmacological inhibition of NNMT in vivo may provide more compelling evidence, particularly through studies involving gene-deficient mice. Finally, we did not explore the potential mechanisms of NNMT in CKD. Future studies should delve into the detailed mechanisms underlying the relationship between NNMT and CKD.
Conclusion
NNMT is predominantly expressed in tubular renal compartments, upregulated in CKD patients, and associated with the degree of renal tubular fibrosis. It has the potential to serve as a biomarker for CKD progression, with its mechanism of action specifically related to tubulointerstitial fibrosis.
Abbreviations
CKD, Chronic kidney disease; ESRD, End stage renal disease; PTC, Peritubular capillaries; eGFR, estimated Glomerular filtration rate; scRNA-seq, single-cell RNA sequencing; NNMT, Nicotinamide N-methyltransferase; FFA-albumin, Free fatty acid-bound albumin; FDR, False discovery rate; HPA, Human Protein Atlas; HE, Hematoxylin and eosin; qRT-PCR, Quantitative real-time PCR; KEGG, Encyclopedia of Genes and Genomes; GO, Gene Ontology; MN, Membranous nephropathy; IgA, IgA nephropathy; LN, Lupus nephropathy; FSGS, Glomerulosclerosis nephropathy; ANCA, Vasculitis associated nephropathy.
Data Sharing Statement
All relevant data are available from the corresponding authors upon request. Previously reported public data were used to support this study and are available at https://www.proteinatlas.org/, https://www.nephroseq.org/, https://www.ncbi.nlm.nih.gov/geo/query/acc.cgi?acc=GSE21785, https://www.ncbi.nlm.nih.gov/geo/query/acc.cgi?acc=GSE31685 and https://www.ncbi.nlm.nih.gov/geo/query/acc.cgi?acc=GSE60861.
Ethical Statement
The authors are accountable for all aspects of the work in ensuring that questions related to the accuracy or integrity of any part of the work are appropriately investigated and resolved. The study was conducted following the Declaration of Helsinki (as revised in 2013). The study was approved by the Second Affiliated Hospital of Guangxi Medical University (NO.2019-KY(0108)). Animal experiments were performed under a project license (NO.202101019) granted by the Animal Ethics Committee of Guangxi Medical University, in compliance with the Guidelines for the Ethical Review of Laboratory Animal Welfare, People’s Republic of China National Standard GB/T 35892-2018.
Acknowledgments
This work was supported by the National Natural Science Foundation of China [No.81360117]; Guangxi Natural Science Foundation of China [No.2018GXNSFAA281122]; Guangxi Medical and Health Appropriate Technology Development and Promotion Application Project[No.S2020018] and [No.S2017010].
Author Contributions
All authors made a significant contribution to the work reported, whether that is in the conception, study design, execution, acquisition of data, analysis, and interpretation, or all these areas; took part in drafting, revising, or critically reviewing the article; gave final approval of the version to be published; have agreed on the journal to which the article has been submitted; and agree to be accountable for all aspects of the work.
Disclosure
The authors report no conflicts of interest in this work.
References
1. Chen TK, Knicely DH, Grams ME. Chronic kidney disease diagnosis and management: a review. JAMA. 2019;322(13):1294. doi:10.1001/jama.2019.14745
2. Rossing P, Caramori ML, Chan JCN, et al. KDIGO 2022 clinical practice guideline for diabetes management in chronic kidney disease. Kidney Int. 2022;102(5):S1–127.
3. Benjamin O, Lappin SL. End-Stage Renal Disease. In: StatPearls. StatPearls Publishing; 2021.
4. Zsom L, Zsom M, Salim SA, Fülöp T. Estimated glomerular filtration rate in chronic kidney disease: a critical review of estimate-based predictions of individual outcomes in kidney disease. Toxins. 2022;2022:16.
5. Webster AC, Nagler EV, Morton RL, Masson P. Chronic kidney disease. Lancet. 2017;389(10075):1238–1252. doi:10.1016/S0140-6736(16)32064-5
6. Ruggenenti P, Cravedi P, Remuzzi G. Mechanisms and Treatment of CKD. JASN. 2012;23(12):1917–1928. doi:10.1681/ASN.2012040390
7. Yan Z, Wang G, Shi X. Advances in the progression and prognosis biomarkers of chronic kidney disease. Front Pharmacol. 2021;12:785375. doi:10.3389/fphar.2021.785375
8. Ntrinias T, Papasotiriou M, Balta L, et al. Biomarkers in progressive chronic kidney disease. Still a long way to go. PRILOZI. 2019;40(3):27–39. doi:10.2478/prilozi-2020-0002
9. Zhang WR, Parikh CR. Biomarkers of acute and chronic kidney disease. Annu Rev Physiol. 2019;81(1):309–333. doi:10.1146/annurev-physiol-020518-114605
10. Ix JH, Shlipak MG. The promise of tubule biomarkers in kidney disease: a review. Am J Kidney Dis. 2021;78(5):719–727. doi:10.1053/j.ajkd.2021.03.026
11. Pissios P. Nicotinamide N -methyltransferase: more than a vitamin B3 clearance enzyme. Trend Endocrinol Metabol. 2017;28(5):340–353. doi:10.1016/j.tem.2017.02.004
12. Komatsu M, Kanda T, Urai H, et al. NNMT activation can contribute to the development of fatty liver disease by modulating the NAD + metabolism. Sci Rep. 2018;8(1):8637. doi:10.1038/s41598-018-26882-8
13. Kraus D, Yang Q, Kong D, et al. Nicotinamide N-methyltransferase knockdown protects against diet-induced obesity. Nature. 2014;508(7495):258–262. doi:10.1038/nature13198
14. Song Q, Chen Y, Wang J, et al. ER stress-induced upregulation of NNMT contributes to alcohol-related fatty liver development. J Hepatol. 2020;73(4):783–793. doi:10.1016/j.jhep.2020.04.038
15. Ehebauer F, Ghavampour S, Kraus D. Glucose availability regulates nicotinamide N-methyltransferase expression in adipocytes. Life Sci. 2020;248:117474. doi:10.1016/j.lfs.2020.117474
16. Reustle A, Menig LS, Leuthold P, et al. Nicotinamide-N-methyltransferase is a promising metabolic drug target for primary and metastatic clear cell renal cell carcinoma. Clin Transl Med. 2022;12(6):e883. doi:10.1002/ctm2.883
17. Campagna R, Pozzi V, Spinelli G, et al. The Utility of Nicotinamide N-methyltransferase as a potential biomarker to predict the oncological outcomes for urological cancers: an update. Biomolecules. 2021;11(8):1214. doi:10.3390/biom11081214
18. Zhang W, Rong G, Gu J, et al. Nicotinamide N-methyltransferase ameliorates renal fibrosis by its metabolite 1-methylnicotinamide inhibiting the TGF-β1/Smad3 pathway. FASEB J. 2022;36(3):e22084. doi:10.1096/fj.202100913RRR
19. Tanaka Y, Kume S, Araki H, et al. 1-Methylnicotinamide ameliorates lipotoxicity-induced oxidative stress and cell death in kidney proximal tubular cells. Free Radic Biol Med. 2015;89:831–841. doi:10.1016/j.freeradbiomed.2015.10.414
20. Kim HC, Mofarrahi M, Vassilakopoulos T, et al. Expression and functional significance of nicotinamide N-methyl transferase in skeletal muscles of patients with chronic obstructive pulmonary disease. Am J Respir Crit Care Med. 2010;181(8):797–805. doi:10.1164/rccm.200906-0936OC
21. Takahashi R, Kanda T, Komatsu M, et al. The significance of NAD + metabolites and nicotinamide N-methyltransferase in chronic kidney disease. Sci Rep. 2022;12(1):6398. doi:10.1038/s41598-022-10476-6
22. Nephroseq Login; 2022. Available from: https://www.nephroseq.org/resource/login.html.
23. Rudnicki M, Perco P, D′haene B, et al. Renal microRNA- and RNA-profiles in progressive chronic kidney disease. Eur J Clin Invest. 2016;46(3):213–226. doi:10.1111/eci.12585
24. Wettenhall JM, Smyth GK. limmaGUI: a graphical user interface for linear modeling of microarray data. Bioinformatics. 2004;20(18):3705–3706. doi:10.1093/bioinformatics/bth449
25. Levey AS, Inker LA, Coresh J. eGFREstimation: from Physiology to Public Health. Am J Kidney Dis. 2014;63(5):820–834. doi:10.1053/j.ajkd.2013.12.006
26. Lamb EJ, Levey AS, Stevens PE, et al. Kidney Disease Improving Global Outcomes (KDIGO) - Search Results. Clin Chem. 2013;59(3):462–465. doi:10.1373/clinchem.2012.184259
27. Cattran DC, Coppo R, Cook HT, et al.; A Working Group of the International IgA Nephropathy Network and the Renal Pathology Society. The Oxford classification of IgA nephropathy: rationale, clinicopathological correlations, and classification. Kidney Int. 2009;76(5):534–545. doi:10.1038/ki.2009.243
28. Latt KZ, Heymann J, Jessee JH, et al. Urine Single-Cell RNA sequencing in focal segmental glomerulosclerosis reveals inflammatory signatures. Kidney Int Rep. 2022;7(2):289–304. doi:10.1016/j.ekir.2021.11.005
29. Noh MR, Woo CH, Park MJ, In Kim J, Park KM. Ablation of C/EBP homologous protein attenuates renal fibrosis after ureteral obstruction by reducing autophagy and microtubule disruption. Biochimica Et Biophysica Acta. 2018;1864(5):1634–1641. doi:10.1016/j.bbadis.2018.02.001
30. Kannt A, Rajagopal S, Kadnur SV, et al. A small molecule inhibitor of Nicotinamide N-methyltransferase for the treatment of metabolic disorders. Sci Rep. 2018;8(1):3660. doi:10.1038/s41598-018-22081-7
31. Iyamu ID, Huang R. Mechanisms and inhibitors of nicotinamide N-methyltransferase. RSC Med Chem. 2021;12(8):1254–1261. doi:10.1039/D1MD00016K
32. Dubin RF, Rhee EP. Proteomics and metabolomics in kidney disease, including insights into etiology, treatment, and prevention. CJASN. 2020;15(3):404–411. doi:10.2215/CJN.07420619
33. Gyurászová M, Gurecká R, Bábíčková J, Tóthová Ľ. Oxidative stress in the pathophysiology of kidney disease: implications for noninvasive monitoring and identification of biomarkers. Oxid Med Cell Longev. 2020;2020:5478708. doi:10.1155/2020/5478708
34. Rysz J, Gluba-Brzózka A, Franczyk B, Jabłonowski Z, Ciałkowska-Rysz A. Novel biomarkers in the diagnosis of chronic kidney disease and the prediction of its outcome. IJMS. 2017;18(8):1702. doi:10.3390/ijms18081702
35. Cummins TD, Powell DW, Wilkey DW, et al. Quantitative mass spectrometry normalization in urine biomarker analysis in nephrotic syndrome. Glomerular Dis. 2022;2(3):121–131. doi:10.1159/000522217
36. Priyadarshini G, Rajappa M. Predictive markers in chronic kidney disease. Clin Chim Acta. 2022;535:180–186. doi:10.1016/j.cca.2022.08.018
37. Yamanouchi M, Furuichi K, Hoshino J, et al. Nonproteinuric versus proteinuric phenotypes in diabetic kidney disease: a propensity score–matched analysis of a nationwide, biopsy-based cohort study. Diabetes Care. 2019;42(5):891–902. doi:10.2337/dc18-1320
38. Koye DN, Magliano DJ, Reid CM, et al. Risk of Progression of Nonalbuminuric CKD to end-stage kidney disease in people with diabetes: the CRIC (Chronic Renal Insufficiency Cohort) Study. Am J Kidney Dis. 2018;72(5):653–661. doi:10.1053/j.ajkd.2018.02.364
39. Gomes MF, Mardones C, Xipell M, et al. The extent of tubulointerstitial inflammation is an independent predictor of renal survival in lupus nephritis. J Nephrol. 2021;34(6):1897–1905. doi:10.1007/s40620-021-01007-z
40. Feldreich T, Nowak C, Carlsson AC, et al. The association between plasma proteomics and incident cardiovascular disease identifies MMP-12 as a promising cardiovascular risk marker in patients with chronic kidney disease. Atherosclerosis. 2020;307:11–15. doi:10.1016/j.atherosclerosis.2020.06.013
41. Zhang J, You XX, wen YS, Wang J, He C. Nicotinamide N-methyltransferase protein expression in renal cell cancer. J Zhejiang Univ Sci B. 2010;11(2):136–143. doi:10.1631/jzus.B0900249
42. Sartini D, Muzzonigro G, Milanese G, et al. Upregulation of tissue and urinary nicotinamide N-methyltransferase in bladder cancer: potential for the development of a urine-based diagnostic test. Cell Biochem Biophys. 2013;65(3):473–483. doi:10.1007/s12013-012-9451-1
43. Pozzi V, Di Ruscio G, Sartini D, et al. Clinical performance and utility of a NNMT-based urine test for bladder cancer. Int J Biol Markers. 2018;33(1):94–101. doi:10.5301/ijbm.5000311
44. Tang SW, Yang TC, Lin WC, et al. Nicotinamide N-methyltransferase induces cellular invasion through activating matrix metalloproteinase-2 expression in clear cell renal cell carcinoma cells. Carcinogenesis. 2011;32(2):138–145. doi:10.1093/carcin/bgq225
45. Critselis E, Lambers Heerspink H. Utility of the CKD273 peptide classifier in predicting chronic kidney disease progression. Nephrol Dial Transplant. 2015;gfv062. doi:10.1093/ndt/gfv062
46. Pontillo C, Jacobs L, Staessen JA, et al. A urinary proteome-based classifier for the early detection of decline in glomerular filtration. Nephrol Dial Transplant. 2016:gfw239. doi:10.1093/ndt/gfw239
47. Zhang SF, Mao XJ, Jiang WM, Fang ZY. Granule protects against hypertension-induced renal injury by epigenetic mechanism linked to Nicotinamide N-Methyltransferase (NNMT) expression. J Ethnopharmacol. 2020;255:112738. doi:10.1016/j.jep.2020.112738
 © 2023 The Author(s). This work is published and licensed by Dove Medical Press Limited. The full terms of this license are available at https://www.dovepress.com/terms.php and incorporate the Creative Commons Attribution - Non Commercial (unported, v3.0) License.
By accessing the work you hereby accept the Terms. Non-commercial uses of the work are permitted without any further permission from Dove Medical Press Limited, provided the work is properly attributed. For permission for commercial use of this work, please see paragraphs 4.2 and 5 of our Terms.
© 2023 The Author(s). This work is published and licensed by Dove Medical Press Limited. The full terms of this license are available at https://www.dovepress.com/terms.php and incorporate the Creative Commons Attribution - Non Commercial (unported, v3.0) License.
By accessing the work you hereby accept the Terms. Non-commercial uses of the work are permitted without any further permission from Dove Medical Press Limited, provided the work is properly attributed. For permission for commercial use of this work, please see paragraphs 4.2 and 5 of our Terms.