Back to Journals » Risk Management and Healthcare Policy » Volume 14
Nexus Between the COVID-19 Dynamics and Environmental Pollution Indicators in South America
Authors Bilal ![]() , Bashir MF
, Bashir MF ![]() , Komal B, Benghoul M
, Komal B, Benghoul M ![]() , Bashir MA, Tan D
, Bashir MA, Tan D
Received 9 November 2020
Accepted for publication 17 December 2020
Published 8 January 2021 Volume 2021:14 Pages 67—74
DOI https://doi.org/10.2147/RMHP.S290153
Checked for plagiarism Yes
Review by Single anonymous peer review
Peer reviewer comments 2
Editor who approved publication: Professor Marco Carotenuto
Bilal,1 Muhammad Farhan Bashir,2 Bushra Komal,3 Maroua Benghoul,4 Muhammad Adnan Bashir,5 Duojiao Tan1
1Accounting School, Hubei University of Economics, Wuhan, People’s Republic of China; 2Business School, Central South University, Changsha 410083, Hunan, People’s Republic of China; 3Business School, University of International Business and Economics, Beijing, People’s Republic of China; 4Department of Statistics, Faculty of Science, Anadolu University, Turkey; 5School of Economics, Nankai University, Tianjin, People’s Republic of China
Correspondence: Muhammad Farhan Bashir
Business School, Central South University, Changsha 410083, Hunan, People’s Republic of China
Tel +8613272487055
Email [email protected]
Introduction: In the current context of the COVID-19 pandemic, researchers are working with health professionals to inform governments to slow the virus’s spread. The extant research contribution has been dedicated to examining the impact of climate indicators such as temperature, humidity, and rainfall. However, there is a lack of evidence regarding their combined association between environmental quality and climate indicators to combat COVID-19 in the South American context.
Methods: In this study, we collected data for environmental pollution indicators for the South America region, and correlation analysis and wavelet transform coherence were used as the analytical tools.
Results: Empirical estimates conclude that PM10, NO2, CO, and O3 are significant factors in the fight against the COVID-19 pandemic in South America.
Implications: Our findings will serve as policy implications for the state, health officials, and regulators to combat the COVID-19 pandemic outbreak in South America.
Keywords: Coronavirus, COVID-19, environmental pollution, South America
Introduction
The novel coronavirus 2019 (COVID-19) is a pandemic caused by Severe Acute Respiratory Syndrome Coronavirus 2 and was first reported in Wuhan, China.1 Prior studies have reported that COVID-19 mainly transmits by respiratory droplets, as well as human-human transmission,2–4,47 and its rapid spread led to World Health Organization (WHO) declare it as a pandemic.5 Higher transmissibility of COVID-19, lack of medical facilities, and unstoppable spread have created psychological fear among the general public.6,7 Like COVID-19, other coronaviruses such as Middle East Respiratory Syndrome Coronavirus (MERS), Severe Acute Respiratory Syndrome Coronavirus (SARS), and Ebola have caused outbreaks in recent history.8 Consequently, these pandemics caused a large number of deaths, caused a shortage of medical supplies, and cost billions of dollars to businesses worldwide.9,10
Recent research shows that several climate and environmental pollution factors affect the diffusion of COVID-19.11,12 Coccia13 suggested that urban areas with higher environmental pollution had higher infection levels and deaths due to exceedingly high levels of particulate matter or Ozone levels. Researchers strongly believe that air pollution is one of the determining indicators affecting the spread of COVID-19.14 Furthermore, geographical, demographic, environmental and climatological factors, influence the spread of infectious diseases, especially in the urban areas. Zhong et al15 indicated that static meteorological conditions might explain the existence of bacterial infections in the presence of higher environmental and air pollution. Tan et al,16 suggested that the outbreak of SARS in four major cities in China was significantly correlated with temperature; the lower temperature resulted in higher reported cases. Recent studies from Triplett;17 Wang et al,18 and Wang et al,19 indicated that low temperatures are beneficial to a viral transmission. Although few recent studies contributed to the matter, however, there is still a lack of evidence in the contemporary literature on environmental indicators and the COVID-19 pandemic. Therefore, it is essential to understand how environmental conditions affect outbreaks, such as COVID-19, hence, motivating us to analyze the role of environmental and climate variables in the spread of infectious diseases such as COVID-19.
The positive diagnosis of COVID-19 ranges between 0% and 60% and maximum temperature in-between 12.2°C and 22.8°C contributes most to such diagnosis. Additionally, a 1°C increase in maximum temperature reduces the fatality rate by 7.5%.20 As the living environment is greatly affected by temperature, hence making it one of the critical determinants to control the developments of infectious diseases.21 According to the findings of recent research, the transmission of infectious diseases is higher at lower temperatures because of the human body’s vulnerability at such temperatures. Therefore, there is a consensus that transmission of COVID-19 may slowdown in the coming months due to the arrival of summer.
In South America, Brazil was the first territory to report patients with COVID-19 diagnosis on February 26, 2020,22 and lack of coordinated efforts at regional and state levels resulted in widespread outbreak with South America having the second most number of infected people and deaths.23 Brazil, Peru, Chile, Colombia, and Argentina are states with the most cases and deaths from COVID-19. Similar widespread outbreaks in other countries such as Italy, South Korea, Spain, and France led to WHO declaring COVID-19 as a pandemic.24 However, the South America region and especially Brazil are the epicentres of the COVID-19 in the world due to the higher number of cases and deaths.22
Environmental pollutants are divided into various types. Environmental agencies regulate the emission quantities of each pollutant to record their impact on human and environmental health. In comparison to other pollutants, fine particles generally cause several chronic diseases as they can penetrate deeper into the respiratory system. Furthermore, environmental pollution25,26,48 contributes to 3 million deaths each year and is ranked among ten risk factors which most contribute to the global burden of disease,27–29 this risk can only be reduced if emerging economies like the South American continent introduce environmental and institutional reforms to reduce the greenhouse gas (GHG) emissions.30,31,49
Air pollutants are a key risk factor, considered critical respiratory and cardiovascular diseases.20,32 International Agency for Research on Cancer has classified environmental pollutants such as PM10, NO2, SO2, and O3.33 Higher emissions of environmental pollutants in South America means that a significant portion of the urban population suffers from eye irritation to coryza, and in many cases even to death. It also contributes to outbreaks of infectious diseases such as COVID-19, where chronic illnesses exacerbate the existing burden on health infrastructure.20 According to recent statistics, about 64,000 die prematurely from exposure to environmental pollution and tropospheric Ozone each year in the south American region, which also is responsible for the loss of 7.4 million tonnes of crops. Prior research suggests that if no action is taken then the mortality rate from exposure to pollutants will double in the next three decades, and crop loss likely to rise to 9 million tonnes each year.34 On the other hand, environmental reforms would reduce premature deaths by at least 26% and avoid 4 million tonnes of crop losses. South America, mainly from the transportation sector, is also one of the largest emitters of methane, hydrofluorocarbons, and black carbon. Environmental protection efforts will likely reduce methane emissions by at least 40% until 2050, improving the treatment of solid waste, biodegradable materials, and recovering biogas from livestock manure. Furthermore, by ending the use of diesel, black carbon emissions can be reduced by 80% until 2050, eliminating high emitting vehicles and introducing mandatory use of clean energy sources.48
Study Design
Sample and Data
To examine the impact of COVID-19 in South America, we consider 12 South American states. The motive behind choosing South America is the urbanization, condition of health facilities, and global economic influence of the region. This study aims to highlight an analysis for the outbreak of COVID-19 in South America; we included a total number of infected, recovered, and dead people and their possible association with environmental pollutants.
Measures of Variables
Current research analyzes the impact of environmental pollutants such as PM10, PM2.5, NO2, SO2, CO, and O3 released from the transportation sector in the South American capital cities and their association with active cases, recoveries, total confirmed cases, and deaths from COVID-19 pandemic from January 22, 2020, until October 8, 2020. The primary reason to select emissions of environmental pollutants from the transportation sector is domestic economic progress in developing economies. South American countries are significantly tied with higher consumption of fossil fuel which emits the highest level of GHG emissions than any other economic sector.48 The dataset for total cases, deaths, recoveries, and active cases has been taken from the John Hopkins coronavirus reach database. While the data for environmental pollutant indicators of the transportation sector has been taken from national environmental agencies.13,35
Data Analysis
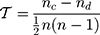
Our estimation strategy is based on Kendall’s rank correlation coefficient and Wavelet transform coherence. Kendall rank coefficient is a non-parametric test to evaluate the degree of association based on observation pairs. The application of Kendall’s rank correlation checks the similarities in ordering data when quantities rank it. Other correlation coefficients use the observations as the basis of the correlation; on the other hand, the Kendall correlation test controls the association’s strength based on discordance amongst pairs. Kendall rank correlation test is estimated through the following formula:
In equation (1),  ,
,  and n indicate the number of concordant, the number of discordant (ordered in a different way), and the total number of observations. The coefficient findings of Kenall are generally smaller than the commonly used Spearman correlation test, and the probability values are most accurate with a smaller sample size.
Our main analytical structure is based on Wavelet transform coherence, an econometric analytical tool that utilizes graphical correlation to show the association between data variables, where the small arrow indicates the direction and impact correlation from one variable to another. Strength of association between data variables is highlighted by the colour in the graphical representation, where colour movement from blue to yellow highlights strong association or vice versa. Cone of influence separates the significant region from the rest with a thick black lining drawn from top to bottom on both sides.14,36,37
Results and Discussion
Table 1 presents the descriptive statistics of the COVID-19 pandemic outbreak in 12 south American states. Brazil, Argentina, and Colombia have been the most affected countries by the COVID-19 outbreak, where lack of health facilities and state response have contributed to the most infections in these countries.
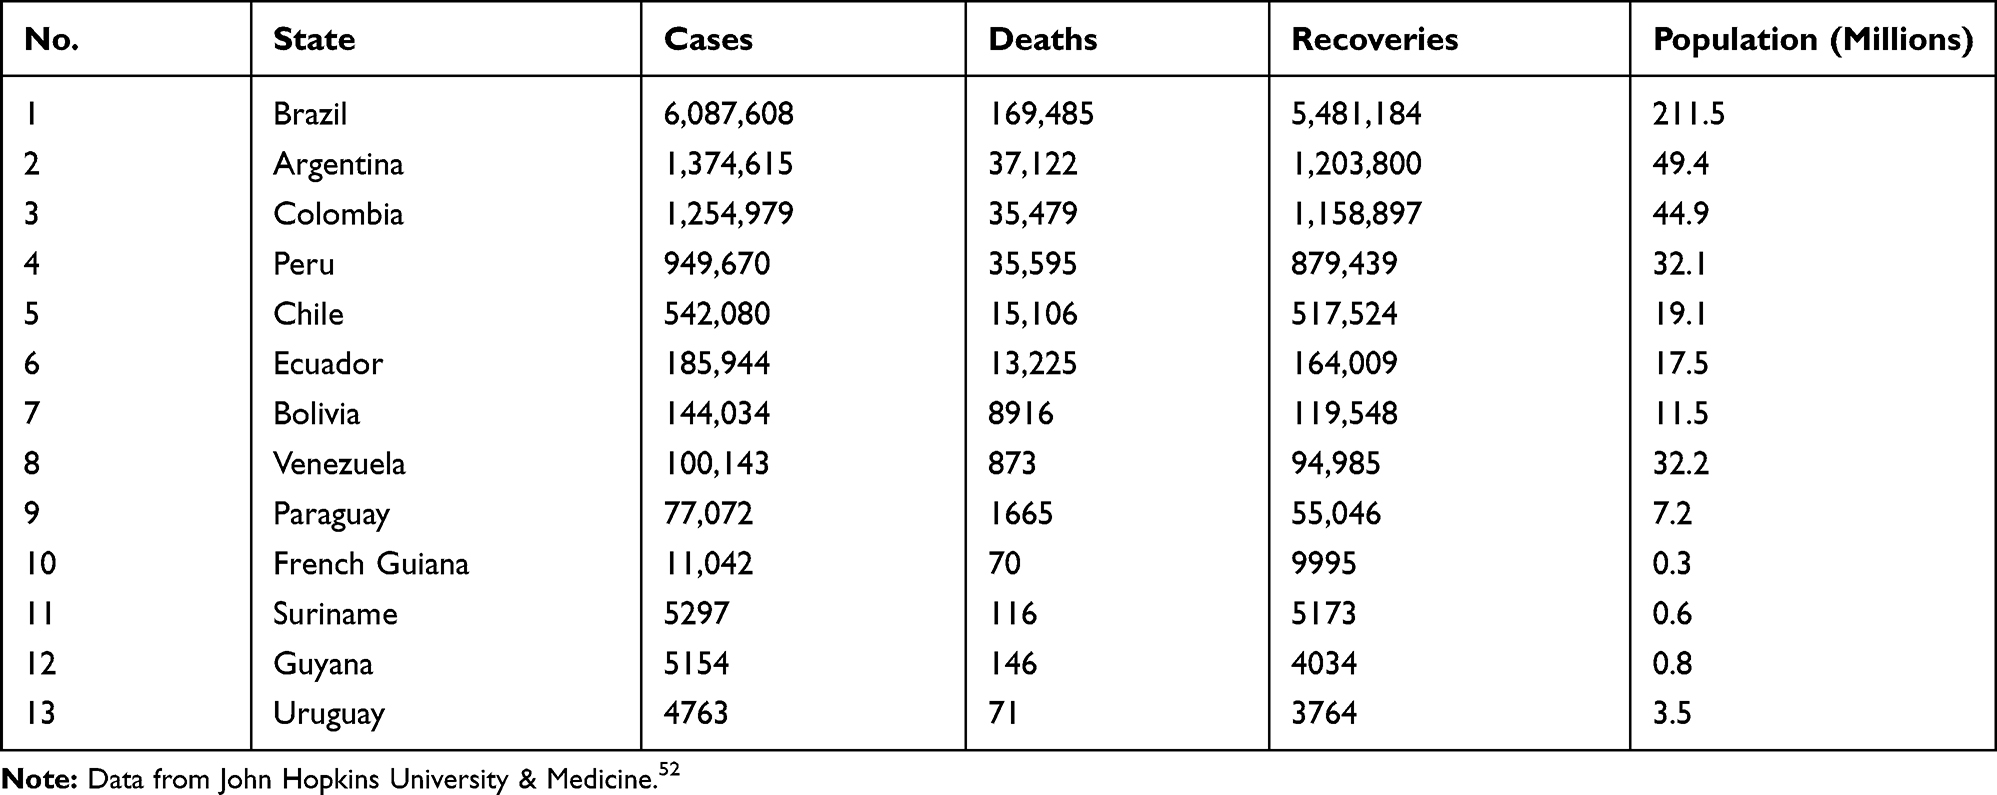 |
Table 1 How COVID-19 Affects Countries in South America |
We utilized the Kendall correlation coefficient to examine the correlation association between variables included in the study. The Kendall correlation analysis reported findings are reported in Table 2, where the coefficient values for the transportation sector, PM10, CO, and O3 are significant for total cases, deaths, recovered, and active cases. The value for NO is significant for total cases, fatalities, and active cases, PM2.5 is only significant for recovered patients, while SO2 is insignificant for total cases, deaths, recovered, and active cases.
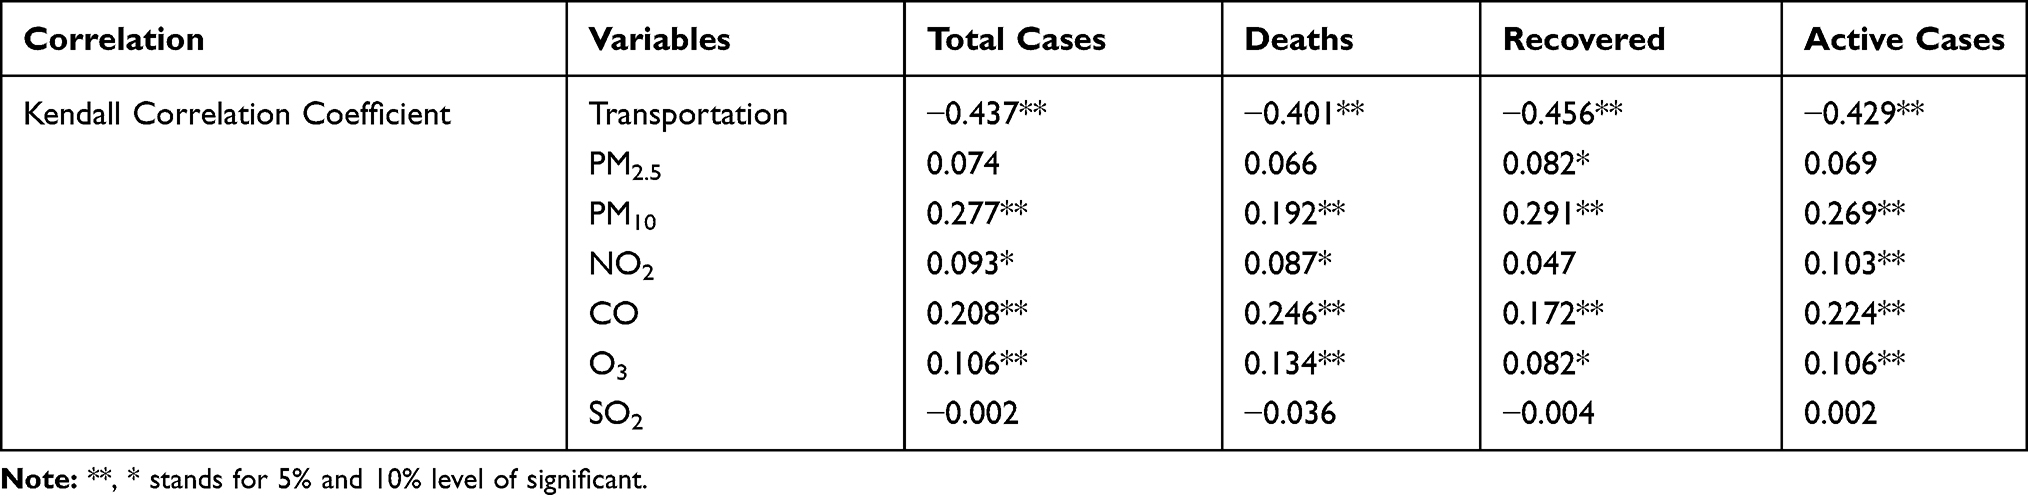 |
Table 2 Correlation Analysis |
Next, we present the findings of Wavelet transform coherence. Appendix 1 provides the results of the association of PM10 with active cases, recoveries, total confirmed cases, and deaths from the COVID-19 pandemic in South America. Figure 1a in Appendix 1 shows undecisive coherence between PM2.5 and active cases from coronavirus pandemic, though a significant impact can be observed between the scale of 4 and 32 as various yellow regions are seen scattered throughout the figure, a thorough significant impact cannot be ascertained. Similar coherence results have been reported in Figure 1b in Appendix 1 between recoveries and PM10, though the most significant impact can be observed between the left-hand scale of 8 and 32.
Figure 1c in Appendix 1 represents the coherence association between total confirmed cases and COVID-19, where the scale of 0–4 and 8–32 shows inconclusive coherence. This finding highlights that though environmental pollutants have played a significant role in chronic illnesses in the South America region, there is a need for more research to be undertaken to derive a decisive nature of the impact. Figure 1d in Appendix 1 portrays the graphical representation of coherence between total deaths and COVID-19 pandemic in South America, where the most significant area of observation lies between 8 and 64. This finding is indicative of the nature that PM10 has a weak impact on deaths from COVID-19 pandemic in South American countries.
Figure 2a in Appendix 1 reports a significant and positive coherence between NO2 emissions and their impact on the number of active cases from coronavirus pandemic. The most notable area covered from the scale of 4 to 64 on the left-hand side. Next, Figure 2b in Appendix 1 shows mixed results, where the left-hand scale shows inconclusive. The scale of 8 to 64 highlights significant and positive impact, detailing that lowered NO2 emissions can be attributed to the considerable number of recoveries in the South America continent. Additionally, we also observe similar coherence between total confirmed cases and NO2 emissions, as in recent times, a significant number of countries have reported greater recoveries from the pandemic in Figure 2c in Appendix 1. Lastly, we observe the coherence between the COVID-19 pandemic and NO2 in the region, where Figure 2d in Appendix 1 highlights inconclusive coherence between the scale of 8 and 32.
Next, we observe the coherence between the CO and total active cases, recoveries, total confirmed cases, and deaths from the COVID-19 pandemic in the region. Though insignificant coherence can be observed between the CO emissions and active vases, the left scale shows a significant and positive coherence in Figure 3a in Appendix 1. Moving forward, Figure 3b in Appendix 1 portrays the association of total recoveries and CO emissions, where the scale of 8–32 shows the positive coherence, which implies that the decline in CO emissions has contributed greatly to the recoveries from the COVID-19 pandemic. Figure 3c in Appendix 1 depicts strong positive coherence between total confirmed cases and COVID-19 pandemic in the South America region. Lastly, Figure 3d in Appendix 1 showcases the coherence between total confirmed deaths and CO emissions in the region, where the area between 0 and 16 shows inconclusive coherence, but the left-hand scale finally.
These findings show a significant coherence between total active cases, recoveries, total confirmed cases and deaths and emissions of O3 in the south America region. Figure 4a in Appendix 1 shows moderate coherence between active cases and O3 emissions in the South American countries, which highlights that O3 has no significant association with active cases. Next, Figure 4b in Appendix 1 shows similar findings between recoveries from COVID-19 and O3 emissions, though a slightly positive impact can be observed between the left-hand scale of 8 to 16. Next, Figure 4c in Appendix 1 mainly showcases inconclusive between total confirmed cases and COVID-19 pandemic in the regions, which indicates that more scientific studies should investigate the association between O3 emissions and COVID-19 pandemic. Finally, the coherence between O3 and total deaths from the COVID-19 pandemic, which portrays mostly inconclusive coherence in Figure 4d in Appendix 1.
Our study findings suggest that PM10, NO2, O3, and CO emissions are the main determinants of the COVID-19 pandemic in South American countries. Our results are in line with prior literature that suggests that air and environmental pollutants cause several chronic illnesses and are detrimental to the human immune system and environmental quality in south America.38,39 These environmental pollutants significantly contributed to the spread of COVID-19 in the region. Also, long-term exposure to various environmental pollutants is the reason for several pre-existing medical conditions, which are harmful, especially for the vulnerable section of the population, ie, children and elderly.
In one of the pioneering studies, Wu et al,40 empirically analyzed data from more than 300 USA counties that long-term exposure to fine particulate matter increases the chances of dying by up to 15% and is responsible for 20 times higher death rate from viral illnesses such as COVID-19. Bilal et al28 and Xu et al25 also supported similar findings by pointing out that PM2.5 and PM10 are key contributors to the COVID-19 pandemic in the spread of COVID-19 in high pollutant countries. Zhu et al35 extended this discussion by investigating the spread of COVID-19 in 120 major Chinese cities. The application of the Generalized Additive Model revealed that the effect of PM2.5 on daily confirmed new cases was higher than PM10.
There has been a significant shift in social demographics in recent times, as there is an upward shift in the urban population. This is why several research publications have explored the impact of environmental pollutants in urban areas. Bashir et al9 investigated the NO2 concentration and COVID-19 outbreak in California and concluded that children ad elderly citizens in industrial and residential areas are at higher risk of chronic illnesses due to large emissions of NO2 and HR values of NO2 was 22 times than safety. In similar research, Jaiswal et al33 analyzed theoretical literature regarding NO2, environmental pollution, and COVID-19. They concluded that environmental pollution indicators such as NO2 are primary indicators regarding lethality and spread of COVID-19, especially in the emerging economies. Bernardini et al41 explored the impact of Ozone on the number of patients in the emergency section of hospitals in Northern Italy. They suggested that environmental pollutants are directly correlated with the spread of respiratory illnesses. Sarkodie and Owusu,42 and Domínguez-Amarillo et al43 reported similar research results.
Sulfur dioxide (SO2) and carbon monoxide (CO) are the most common ambient air pollutants in developing economies such as South America, where environmental regulations are generally set aside to sustain economic growth policies. In recent times, a significant number of studies have investigated the association of SO2 and CO over the outbreak of COVID-19. Xu et al25 investigated the short-term exposure between environmental pollution and COVID-19 spread in 120 major Chinese cities and suggested that PM10, PM2.5, and CO were positively associated with the COVID-19 outbreak in Chinese cities. However, the researchers were unable to establish the same association between NO2 and COVID-19. Ran et al44 investigated the impact of environmental pollution over an early outbreak of COVID-19 in China from December 2019 to February 2020. The research team investigated Chinese data but were unable to establish a direct association between CO, NO2, and COVID-19 cases. Ogen45 investigated the association between long-term exposure from NO2 and the fatality rate from COVID-19 in 66 administrative regions in Germany, France, Spain, and Italy. The analytical analysis of spatial analysis revealed that downward airflow and higher NO2 concentration prevented an efficient dispersion of environmental pollution in the sampled administrative regions and indicated that long-term exposure to environmental pollutants might be the leading contributing factor in a higher fatality from COVID-19.
Conclusion
Air pollution carries a significant impact on human health, and at times the costs of economic progress far outweigh the benefits. Surely, the outbreak of COVID-19 has highlighted how environmental research is critical in improving the knowledge concerning infectious diseases and how economic and intellectual resources are to be spent to implement environmental policies to reduce the impact of air pollution over infectious diseases. The current study investigates the emission of environmental pollution such as PM2.5, PM10, NO2, CO, O3, and SO2 from the transportation sector in South American economies and their association with the COVID-19 pandemic in the region.
South America region has become the epicentre of the COVID-19 pandemic in recent months, as COVID-19 has an ever-increasing infectious rate; thus, the chance of getting infected remains significant in these countries. The case study of South America offers a unique scenario, where not only the region is facing an increasingly dangerous trend of infections, but unlike other regions, it is also reporting a significant number of deaths for coronavirus pandemic. Our analysis reveals that PM10, NO2, O3, and CO emissions are the main determinants of the COVID-19 pandemic in South American countries. Furthermore, data analysis confirms that higher environmental pollution in South America has contributed significantly to the spread of COVID-19. Slow governmental response and lack of public safety initiatives are a key part of our analysis, where increased exposure to environmental pollutants and limited public health facilities are causing a great risk of getting infected, especially among the elderly and children. We further suggest that emerging economies like south America should follow the lead of Germany and China’s successful response, where state and local officials acted simultaneously by providing medical and financial reforms to limit the exposure from the COVID-19 pandemic.46,50,51
Although we provide rather interesting results, we would also highlight some limitations in the existing research. First of all, the current study only investigates the South American region, which is also facing shortages of medical and financial resources to overcome this pandemic. Hence, we urge future research to study the exposure of global pandemics such as COVID-19 over a larger dataset to investigate environmental pollutants’ role in spreading the current pandemic. Further research is required to clarify the association between air pollution and COVID-19 outbreak, especially multi-disciplinary studies or multi-pollutants’ influence to strengthen the scientific evidence further so that new health emergencies are effectively dealt with. Additionally, although the wavelet coherence is a widely used analytical technique in recent literature, empirical findings should be carefully interpreted. Lastly, we urge researchers to investigate the inter-regional comparison of the COVID-19 pandemic as it would provide better insight in analyzing the response of governments from different regions around the world to formulate a comprehensive response to overcome the COVID-19 pandemic.
Ethical Statement
The data used in this research is freely available, and authors can also provide it upon request. The data sample is aggregate at the city level and does not involve people, medical records, and human samples. Thus, there is no need for the formal approval of an ethical review board.
Funding
We acknowledge the financial support of Hubei University of Economics to support the open-access of this article through its excellent Ph.D. program-wide grant number XJ18BS06.
Disclosure
The authors report no conflicts of interest in this work.
References
1. Shahzad F, Shahzad U, Fareed Z, Iqbal N, Hashmi SH, Ahmad F. Asymmetric nexus between temperature and COVID-19 in the top ten affected provinces of China: a current application of quantile-on-quantile approach. Sci Total Environ. 2020;736:139115. doi:10.1016/j.scitotenv.2020.139115
2. Pereira IG, Guerin JM, Junior AGS, Distante C, Garcia GS, Goncalves LM. Forecasting Covid-19 dynamics in Brazil: a data driven approach. arXiv. 2020;2005:09475.
3. Ge XY, Li JL, Yang XL, et al. Isolation and characterization of a bat SARS-like coronavirus that uses the ACE2 receptor. Nature. 2013;503(7477):535–538. doi:10.1038/nature12711
4. Huang C, Wang Y, Li X, et al. Clinical features of patients infected with 2019 novel coronavirus in Wuhan, China. Lancet. 2020;395(10223):497–506. doi:10.1016/S0140-6736(20)30183-5
5. Khan S, Nabi G, Han G, et al. Novel coronavirus: how things are in Wuhan. Clin Microbiol Infect. 2020;26(4):399. doi:10.1016/j.cmi.2020.02.005
6. Doğan B, Jebli MB, Shahzad K, Farooq TH, Shahzad U. Investigating the effects of meteorological parameters on COVID-19: case study of New Jersey, United States. Environ Res. 2020;191:110148. doi:10.1016/j.envres.2020.110148
7. Cohen J, Kupferschmidt K. Strategies shift as coronavirus pandemic looms. Amer Assoc Adv Sci.2020;367:962–963.
8. Shakoor A, Chen X, Farooq TH, et al. Fluctuations in environmental pollutants and air quality during the lockdown in the USA and China: two sides of COVID-19 pandemic. Air Qual Atmos Health. 2020;13(11):1335–1342. doi:10.1007/s11869-020-00888-6
9. Bashir MF, Ma BJ, Komal B, Bashir MA, Farooq TH, Iqbal N. Correlation between environmental pollution indicators and COVID-19 pandemic: a brief study in Californian context. Environ Res. 2020;187:109652. doi:10.1016/j.envres.2020.109652
10. Fan Y, Zhao K, Shi ZL, Zhou P. Bat coronaviruses in China. Viruses. 2019;11(3):210. doi:10.3390/v11030210
11. Haque SE, Rahman M. Association between temperature, humidity, and COVID-19 outbreaks in Bangladesh. Environ Sci Pol. 2020;114:
12. Bashir MF, Ma B, Komal B, Bashir MA, Tan D. Correlation between climate indicators and COVID-19 pandemic in New York, USA. Sci Total Environ. 2020;728:138835. doi:10.1016/j.scitotenv.2020.138835
13. Coccia M. An index to quantify environmental risk of exposure to future epidemics of the COVID-19 and similar viral agents: theory and Practice. Environ Res. 2020;191:110155. doi:10.1016/j.envres.2020.110155
14. Coccia M. Factors determining the diffusion of COVID-19 and suggested strategy to prevent future accelerated viral infectivity similar to COVID. Sci Total Environ. 2020;138474. doi:10.1016/j.scitotenv.2020.138474.
15. Zhong J, Zhang X, Dong Y, et al. Feedback effects of boundary-layer meteorological factors on cumulative explosive growth of PM 2.5 during winter heavy pollution episodes in Beijing from 2013 to 2016. Atmos Chem Phy. 2020;18(1):247. doi:10.5194/acp-18-247-2018
16. Tan J, Mu L, Huang J, Yu S, Chen B, Yin J. An initial investigation of the association between the SARS outbreak and weather: with the view of the environmental temperature and its variation. J Epidemiol Community Health. 2020;59(3):186–192. doi:10.1136/jech.2004.020180
17. Triplett M. Evidence that higher temperatures are associated with lower incidence of COVID-19 in pandemic state, cumulative cases reported up to March 27, 2020. medRxiv. 2020.
18. Wang J, Tang K, Feng K, Lv W. High temperature and high humidity reduce the transmission of covid-19. SSRN. 2020;3551767.
19. Wang M, Jiang A, Gong L, et al. Temperature significant change COVID-19 Transmission in 429 cities. medRxiv. 2020.
20. Bashir MF, Benjiang M, Shahzad L. A brief review of socio-economic and environmental impact of Covid-19. Air Qual Atmos Health. 2020;1–7. doi:10.1007/s11869-020-00894-8
21. McMichael AJ, Wilkinson P, Kovats RS, et al. International study of temperature, heat and urban mortality: the ‘ISOTHURM’project. Int J Epidemiol. 2020;37(5):1121–1131. doi:10.1093/ije/dyn086
22. Prata DN, Rodrigues W, Bermejo PH. Temperature significantly changes COVID-19 transmission in (sub) tropical cities of Brazil. Sci Total Environ. 2020;729:138862. doi:10.1016/j.scitotenv.2020.138862
23. Dong E, Du H, Gardner L. An interactive web-based dashboard to track COVID-19 in real time. Lancet Infect Dis. 2020. doi:10.1016/S1473-3099(20)30120-1
24. Cucinotta D, Vanelli M. WHO declares COVID-19 a pandemic. Acta Bio Med Atenei Parm. 2020;91(1):157–160.
25. Xu K, Cui K, Young LH, et al. Impact of the COVID-19 event on air quality in central China. Aerosol Air Qual Res. 2020;20:915–929. doi:10.4209/aaqr.2020.04.0150
26. Shen L, Zhao T, Wang H, et al. Importance of meteorology in air pollution events during the city lockdown for COVID-19 in Hubei Province, Central China. Sci Total Environ. 2021;754:142227. doi:10.1016/j.scitotenv.2020.142227
27. Fofana NK, Latif F, Sarfraz S, Bashir MF, Komal B. Fear and agony of the pandemic leading to stress and mental illness: an emerging crisis in the novel coronavirus (COVID-19) outbreak. Psychiatr Res. 2020;291:113230. doi:10.1016/j.psychres.2020.113230
28. Bilal, Bashir MF, Benghoul M, Numan U, et al. Environmental pollution and COVID-19 outbreak: insights from Germany. Air Qual Atmos Health. 2020;13(11):1385–1394. doi:10.1007/s11869-020-00893-9
29. Bilal, Latif F, Bashir MF, Komal B, Tan D. Role of electronic media in mitigating the psychological impacts of novel coronavirus (COVID-19). Psych Res. 2020;289:113041. doi:10.1016/j.psychres.2020.113041
30. Rosario Denes KA, Mutz Yhan S, Bernardes Patricia C, Conte-Junior Carlos A. Relationship between COVID-19 and weather: case study in a tropical country. Int J Hyg Environ Health. 2020;229:113587. doi:10.1016/j.ijheh.2020.113587
31. Srivastava A. COVID-19 and air pollution and meteorology-an intricate relationship: a review. Chemosphere. 2020;263:128297. doi:10.1016/j.chemosphere.2020.128297
32. Setti L, Passarini F, De Gennaro G, et al. Searching for SARS-COV-2 on Particulate Matter: A Possible Early Indicator of COVID-19 Epidemic Recurrence. Multidisciplinary Digital Publishing Institute; 2020.
33. Jaiswal NK, Ramteke S, Chakradhari S, et al. Distribution, sources, and hazards of ambient carbonaceous particulates in central India. J Hazard Toxic Radioact Waste. 2020;23(4):05019002. doi:10.1061/(ASCE)HZ.2153-5515.0000447
34. Manisalidis I, Stavropoulou E, Stavropoulos A, Bezirtzoglou E. Environmental and health impacts of air pollution: a review. Front Public Health. 2020;8:14. doi:10.3389/fpubh.2020.00014
35. Zhu Y, Xin J. Association between ambient temperature and COVID-19 infection in 122 cities from China. Sci Total Environ. 2020. doi:10.1016/j.scitotenv.2020.138201
36. Shahzad K, Shahzad U, Iqbal N, Shahzad F, Fareed Z Effects of climatological parameters on the outbreak spread of COVID-19 in highly affected regions of Spain. 2020.
37. Iqbal N, Fareed Z, Shahzad F, He X, Shahzad U, Lina M. Nexus between COVID-19, temperature and exchange rate in Wuhan City: new findings from partial and multiple wavelet coherence. Sci Total Environ. 2020;729:138916. doi:10.1016/j.scitotenv.2020.138916
38. Coccia M. How do low wind speeds and high levels of air pollution support the spread of COVID-19? Atmos Poll Res. 2020;
39. Coccia M. The effects of atmospheric stability with low wind speed and of air pollution on the accelerated transmission dynamics of COVID-19. Inter J Environ Stud. 2020;1–27. doi:10.1080/00207233.2020.1802937
40. Wu X, Nethery RC, Sabath BM, Braun D, Dominici F. Exposure to air pollution and COVID-19 mortality in the United States. medRxiv. 2020.
41. Bernardini F, Trezzi R, Quartesan R, Attademo L. Air pollutants and daily hospital admissions for psychiatric care: a review. Psychiatr Serv. 2020;201800565.
42. Sarkodie SA, Owusu PA. Impact of meteorological factors on COVID-19 pandemic: evidence from top 20 countries with confirmed cases. Environ Res. 2020;191:110101. doi:10.1016/j.envres.2020.110101
43. Domínguez-Amarillo S, Fernández-Agüera J, Cesteros-García S, González-Lezcano RA. Bad air can also kill: residential indoor air quality and pollutant exposure risk during the COVID-19 crisis. Int J Environ Res Pub Health. 2020;17(19):7183. doi:10.3390/ijerph17197183
44. Ran J, Zhao S, Han L, et al. Initial COVID-19 transmissibility and three gaseous air pollutants (NO2, SO2, and CO): a Nationwide Ecological Study in China. Front Med. 2020;7:571. doi:10.3389/fmed.2020.575839
45. Ogen Y. Assessing nitrogen dioxide (NO2) levels as a contributing factor to coronavirus (COVID-19) fatality. Sci Total Environ. 2020;726:138605. doi:10.1016/j.scitotenv.2020.138605
46. Distante C, Piscitelli P, Miani A. Covid-19 outbreak progression in Italian regions: approaching the peak by the end of March in northern Italy and first week of April in Southern Italy. Int J Environ Res Pub Health. 2020;17(9):3025. doi:10.3390/ijerph17093025
47. Sohrabi C, Alsafi Z, O’Neill N, et al. World Health Organization declares global emergency: a review of the 2019 novel coronavirus (COVID-19). Int J Surg. 2020.
48. Bashir MF, Ma B, Shahbaz M, Jiao Z. The nexus between environmental tax and carbon emissions with the roles of environmental technology and financial development. PLoS One. 2020;15(11):e0242412. doi:10.1371/journal.pone.0242412
49. Bashir MF, Ma B, Shahzad L, Liu B, Ruan Q. China’s quest for economic dominance and energy consumption: can Asian economies provide natural resources for the success of one belt one road? Manage Decis Econ. 2020. doi:10.1002/mde.3255
50. Kirby T. South America prepares for the impact of COVID-19. Lancet Respir Med. 2020;8(6):551–552. doi:10.1016/S2213-2600(20)30218-6
51. Moreno P, Moratorio GA, Iraola G, et al. An effective COVID-19 response in South America: the uruguayan conundrum. MedRxiv. 2020.
52. John Hopkins University & Medicine. COVID-19 Dashboard by the Center for Systems Science and Engineering (CSSE) at Johns Hopkins University & Medicine. Available from https://coronavirus.jhu.edu/map.html. Accessed January 6, 2021.
 © 2021 The Author(s). This work is published and licensed by Dove Medical Press Limited. The
full terms of this license are available at https://www.dovepress.com/terms
and incorporate the Creative Commons Attribution
- Non Commercial (unported, 3.0) License.
By accessing the work you hereby accept the Terms. Non-commercial uses of the work are permitted
without any further permission from Dove Medical Press Limited, provided the work is properly
attributed. For permission for commercial use of this work, please see paragraphs 4.2 and 5 of our Terms.
© 2021 The Author(s). This work is published and licensed by Dove Medical Press Limited. The
full terms of this license are available at https://www.dovepress.com/terms
and incorporate the Creative Commons Attribution
- Non Commercial (unported, 3.0) License.
By accessing the work you hereby accept the Terms. Non-commercial uses of the work are permitted
without any further permission from Dove Medical Press Limited, provided the work is properly
attributed. For permission for commercial use of this work, please see paragraphs 4.2 and 5 of our Terms.