Back to Journals » Journal of Inflammation Research » Volume 19
Neutrophil Extracellular Traps Predict Prognosis and Neoadjuvant Immunotherapy Response in Gastric Cancer
Authors Zhong W ![]() , Wang Q, Sun L, Zhu H, Cai H, Dong J, Chen G, Liu A, Du J
, Wang Q, Sun L, Zhu H, Cai H, Dong J, Chen G, Liu A, Du J
Received 11 September 2025
Accepted for publication 5 March 2026
Published 12 March 2026 Volume 2026:19 564892
DOI https://doi.org/10.2147/JIR.S564892
Checked for plagiarism Yes
Review by Single anonymous peer review
Peer reviewer comments 3
Editor who approved publication: Dr Alberto Caminero
Wentao Zhong,1,2,* Qianyu Wang,1,2,* Liang Sun,1 Hongyan Zhu,3 Huiyun Cai,1 Junhua Dong,1 Gang Chen,1 Aijun Liu,3 Junfeng Du1
1Medical Department of General Surgery, The 1st Medical Center, Chinese PLA General Hospital, Beijing, 100853, People’s Republic of China; 2Department of General Surgery, Peking Union Medical College Hospital, Chinese Academy of Medical Sciences and Peking Union Medical College, Beijing, 100730, People’s Republic of China; 3Department of Pathology, The 7th Medical Center, Chinese PLA General Hospital, Beijing, 100700, People’s Republic of China
*These authors contributed equally to this work
Correspondence: Aijun Liu, Department of Pathology, The 7 th Medical Center, Chinese PLA General Hospital, NO. 5, Nanmen Cang, Beijing, 100700, People’s Republic of China, Email [email protected] Junfeng Du, Medical Department of General Surgery, The 1 st Medical Center, Chinese PLA General Hospital, 28 Fuxing Road, Haidian District, Beijing, 100853, People’s Republic of China, Email [email protected]
Purpose: To determine whether neutrophil extracellular trap (NET) predicts prognosis and response to neoadjuvant immunotherapy in gastric cancer (GC) and explore the associated mechanisms.
Patients and Methods: Transcriptomic data from a GEO dataset (GSE62254) comprising 300 GC patients were analyzed. Patients were clustered based on 69 predefined NET-related genes (NRGs) summarized in previous studies, and clinical characteristics and immune cell infiltration between clusters were compared. An NRG signature was constructed. Retrospective clinical data and tissue samples from 243 surgically resected GC patients without neoadjuvant therapy and 49 patients receiving neoadjuvant chemotherapy combined with immunotherapy were collected. RNA sequencing, immunohistochemistry, and immunofluorescence were performed to assess NET density and its clinical relevance.
Results: Two NET-related subtypes in GC (NT1 and NT2) with distinct clinical features and survival time were identified. A risk model based on five NRGs demonstrated that NT2 had lower risk scores, correlating with favorable outcomes. High NET density was associated with advanced TNM stage and short recurrence-free survival time in the surgery cohort. In the immunotherapy cohort, low pre-treatment NET density correlated with more T cells predicted superior response rates (45.8% vs. 16.0%, P = 0.032) and pathological complete response (29.2% vs. 4.0%, P = 0.023).
Conclusion: Low NET density is linked to better prognosis and may identify patients with GC who could benefit from immunotherapy. These findings highlight the important role of NET in GC.
Keywords: gastric cancer, neutrophil extracellular trap, immunotherapy, prognosis, biomarker
Introduction
Gastric cancer (GC) remains a global health burden due to its high incidence and poor prognosis.1 Despite enhancement in surgical techniques, chemotherapy, radiotherapy, and targeted therapy, the overall survival rate remains unsatisfactory.2,3 In the past decades, immunotherapy, especially immune checkpoint inhibitors (ICIs), has significantly improved survival outcomes in GC patients refractory to conventional therapies.4 However, therapeutic response varies significantly among patients at similar disease stages, underscoring the need for biomarkers to predict prognosis and therapeutic efficacy.
Inflammation plays a pivotal role in tumor initiation, progression, and metastasis.5,6 For instance, Helicobacter pylori-induced chronic inflammation is a well-established driver of gastric carcinogenesis.7 Over the last decade, neutrophils, key mediators of innate immunity, are increasingly recognized for their dual roles in tumor biology.8,9 While neutrophils are traditionally viewed as pro-tumorigenic, recent studies suggest they have context-dependent anti-tumor functions.10 Neutrophil extracellular traps (NETs) are web-like structures composed of DNA, histones, and granular proteins, which are released in response to pathogens and inflammatory stimuli.11,12 Emerging evidence implicates NET in promoting tumor progression, metastasis, and immunosuppression across multiple cancers, including hepatocellular carcinoma,13 pancreatic cancer,14 and colorectal cancer.15 These findings suggest that NET plays an important role in tumor invasion and migration. NET is a critical component of the tumor microenvironment that influences the function of anti-tumor immune cells, including by trapping CD8+ T cells and causing immunological fatigue, thereby achieving immune evasion.16,17 Despite these advances, the role of NET in shaping tumor-immune interactions and modulating immunotherapy response in GC remains underexplored.
Our previous work demonstrated that high NET density in locally advanced rectal cancer correlated with a pro-tumor microenvironment and predicted response to neoadjuvant therapy.18 Previous studies have also investigated the significance of NET in gastric cancer.19,20 We designed this study by using integrated bioinformatics, clinical data and immunofluorescence to validate, and evaluated the significance of NET in predicting the response to immunotherapy.
Materials and Methods
Data Collection and Cluster Analyse from Public Databases
Transcriptomic profiles and clinical data of 300 GC patients were retrieved from the GEO dataset GSE62254.21 Sixty-nine NRGs were curated from previous studies22 (Table S1).
Using the 69 NRGs, we performed cluster analysis with R package “ConsensusClusterPlus”23 to identify patients from the Asian Cancer Research Group (ACRG) cohort into different NET-related subtypes. The optimal number of clusters was determined by selecting the k value that minimized the within-cluster sum of squares and then confirmed the stability of the classification by performing 1000 repetitions. Survival analysis was performed using Kaplan‒Meier curves and Log rank tests to compare differences in survival between subgroups. We also compared the clinical features between subgroups.
The differentially expressed genes (DEGs) between subgroups were screened out using the “limma” package in R with criteria of |log FC|> 1 and P value < 0.05. Then, the molecular functions of DEGs were investigated using Gene Ontology (GO) analysis.
Estimation of Immune Cell Infiltration and Immune Checkpoints
We evaluated immune cell infiltration using multiple algorithms implemented in R. The ESTIMATE package was applied to calculate tumor purity for each sample. The relative abundance of infiltrating immune cells was quantified via the single-sample gene-set enrichment analysis (ssGSEA) algorithm,24 additionally, the CIBERSORT algorithm was used to estimate the proportions of 23 immune cell subtypes. The geneset for CIBERSORT and ssGSEA can be found in the Tables S2 and S3. To explore potential immunoregulatory mechanisms, we examined the expression of immune checkpoint molecules in relation to NET density.
Identification of Prognostic NRGs
Univariate Cox regression identified prognostic NRGs (P < 0.05). Then, the Lasso-Cox regression model was applied to obtain the regression coefficients for these potential prognostic genes. The signature risk score was created using the coefficient and expression level of each gene: Risk score = expression(gene[1]) × coefficient(gene[1]) + expression(gene[2]) × coefficient(gene[2]) +. + expression(gene[n]) × coefficient(gene[n]). Kaplan‒Meier survival analysis was performed to evaluate the prognostic value of the risk model and the predictive capability of the NETs model was evaluated using time-dependent receiver operating characteristic (ROC) curves.
Patient Data and Tissue Specimens
This retrospective study included 243 GC patients receiving curative surgical resection without preoperative neoadjuvant therapy at the 7th Medical Center of Chinese PLA General Hospital from January 2016 to January 2020, and all patients underwent follow-up for 5 years, recurrence-free survival (RFS) was defined as the time between surgery and recurrence. Furthermore, we enrolled 49 GC patients who received neoadjuvant immunotherapy combined with chemotherapy from January 2022 to December 2024, and endoscopic biopsies were collected before treatment.
Clinicopathological features, including age at initial diagnosis, tumor location, histological subtype, pathological stage, tumor grade, vascular invasion, perineural invasion, neutrophil-to-lymphocyte ratio (NLR) and death, were recorded. Tumor response to therapy was evaluated using the Response Evaluation Criteria in Solid Tumors version 1.1 (RECIST 1.1). An objective response was determined by complete response (CR) or partial response (PR), and non-response was defined as stable disease (SD) and progressive disease (PD).25
This study was conducted in accordance with the guidelines for biomedical research specified in the Declaration of Helsinki. Sampling and handling of any patients’ material was performed with informed consent from all patients and approval by the ethics committee of the 7th Medical Center of Chinese PLA General Hospital (2023–38).
Immunofluorescence Staining
Tumor samples were sectioned into 4 μm slices and following deparaffinization and rehydration, antigen retrieval was performed using EDTA buffer. The sections were then incubated overnight at 4 °C with primary antibodies against citrullinated histone H3 (1:1000, Abcam, ab5103) and MPO (1:1000, Abcam, AF3667). Subsequently, fluorochrome-conjugated secondary antibodies were applied and incubated for 1 hour. The NETs images were caught by Olympus Fluoview FV3000.
Identification and Quantification of NETs
Tumor regions were first identified through hematoxylin and eosin (H&E) staining. The pathologist (HZ) initially identified the main tumor mass under low-power magnification. Subsequently, under high-power magnification, the most representative tumor region is selected based on features such as cellular atypia and infiltrative growth and is designated as the region of interest. During this process, areas showing necrosis, hemorrhage, or processing-related artifacts are deliberately excluded to ensure the accuracy and reliability of subsequent analyses. These interested regions were subsequently imaged using confocal microscopy. Images analysis was carried out using QuPath and ImageJ. NETs were identified according to previously established protocols.26,27 The quantity of NETs was assessed by measuring the average fluorescence intensity in five selected area.
Immunohistochemistry of Tissues Samples
Immunohistochemistry was performed on dewaxed and hydrated 4-μm-thick FFPE sections that were antigen retrieved in EDTA, using CD3+ T cells (ZA-0503, ZSGB-BIO), CD4+ T cells (ZA-0519, ZSGB-BIO), CD8+ T cells (ZA-0805, ZSGB-BIO), neutrophils (ZM-0037, ZSGB-BIO) and T regulatory (Treg) cells (ab20034, Abcam). After blocking with 5% bovine serum albumin (BSA) for 30 min, the sections were incubated at 37°C with primary antibody for 1 h. Then, the sections were incubated with secondary antibody for 30 min at room temperature and diaminobenzidine (DAB) for 5 min followed by hematoxylin staining. All sections were dehydrated and scanned using a Leica CS2 and analyzed by QuPath (the full immunohistochemistry images are shown in Figure S1).
RNA-Seq and Analysis
RNA-seq analysis was performed on fresh-frozen tissues from 27 patients who were randomly selected and divided into high-NET density (N=14) and low-NET density (N=13) according to the median value. Total RNA was extracted using TRIzol® (Invitrogen), treated with DNase I (TaKara), and assessed via 1% agarose gels. RNA quality (OD260/280 = 1.8 ~ 2.2, OD260/230 ≥ 2.0, RIN ≥ 8.0, 28S:18 S ≥ 1.0, >1 μg) was verified using a Bioanalyzer 2100 (Agilent) and ND-2000 spectrophotometer (NanoDrop). Libraries were constructed by Majorbio Bio-Pharm using Illumina’s TruSeqTM RNA Kit: polyA-selected mRNA was fragmented, reverse-transcribed into cDNA (SuperScript kit, Invitrogen), and processed with end-repair, adenylation, and size selection (300bp). PCR-amplified libraries were sequenced on Illumina NovaSeq 6000 (2×150bp) after TBS380 quantification. All steps followed manufacturer protocols.
Statistical Analysis
Categorical variables of the clinical characteristics in different groups were demonstrated in numbers with percentages and were compared by Fisher’s exact or chi-square test. The Wilcoxon rank-sum test was utilized to compare continuous variables. Survival curves were calculated using the Kaplan–Meier and Log rank tests. The independent risk factors for prognosis were summarized using univariate and multivariate regression Cox analyses, and logistic regression was used to analyze independent risk factors for neoadjuvant immunotherapy response. Statistical analyses were performed using a combination of GraphPad Prism 9 (version 9.0.0), R (version 4.2.1) and SPSS (version 26.0). A two-tailed P value < 0.05 was regarded as statistically significant.
Results
Identification of NET-Related Subtypes in GC
Consensus clustering revealed two subtypes in the ACRG cohort: NET type 1 (NT1) and NET type 2 (NT2) (Figure 1A–C). Principal component analysis (PCA) confirmed distinct molecular profiles between the two clusters (Figure 1D). As illustrated in Figure 1E, Kaplan-Meier analysis revealed that NT2 had a better prognosis compared to NT1. In addition, the NT2 cluster had a lower N stage in terms of clinical characteristics (Figure 1F).
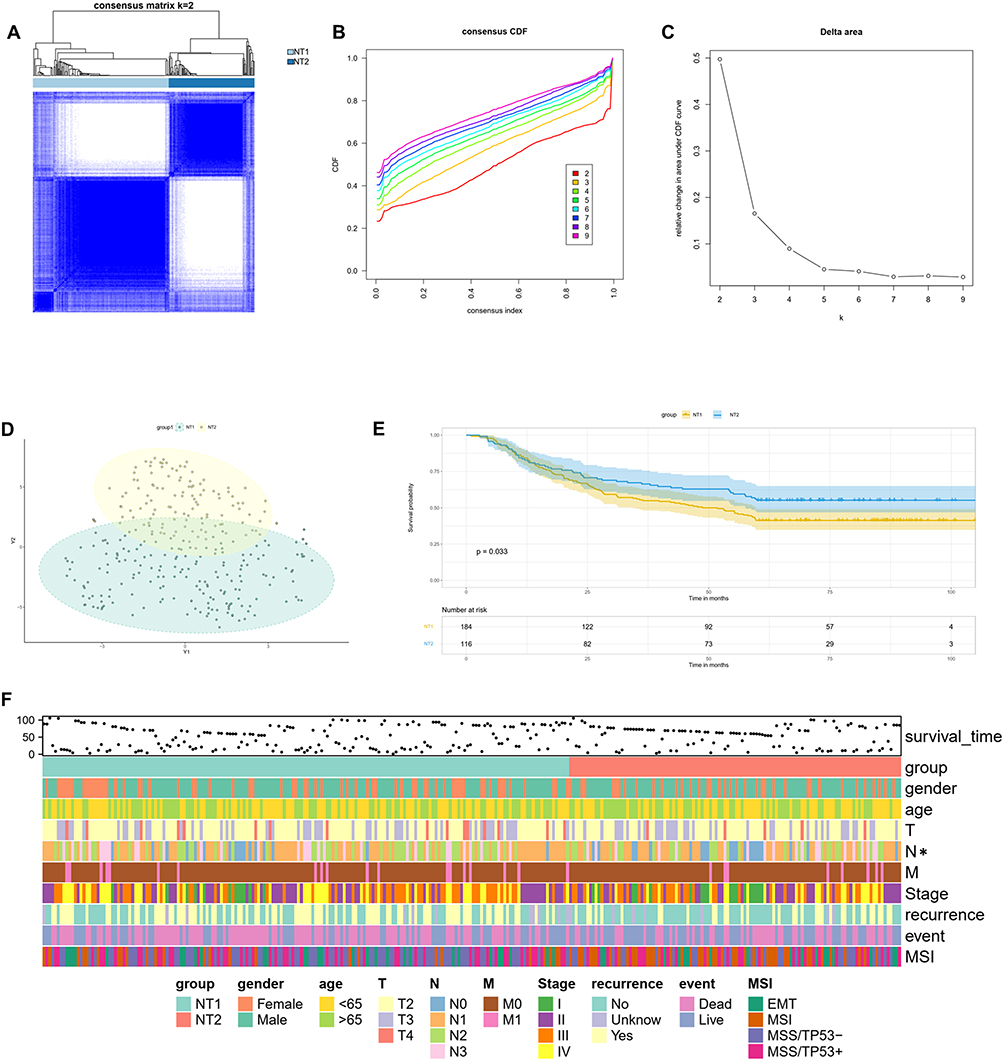 |
Figure 1 Identification of different NET related patterns in the ACRG cohort. (A) The consensus matrix’s heatmap of the two clusters (k = 2). (B and C) The consensus matrix’s CDF plot from k = 2–9. (D) Principal component analysis (PCA) of the two subtypes. (E) Survival analysis of different subtypes based on OS (Log rank test). (F) Clinicopathological parameters of different subtypes defined in the ACGR cohort (*P < 0.05). |
Immune Landscape and Checkpoint Expression Correlated with NET Density in GC
GO analysis determined the biological differences between the two GC patterns. NT1 and NT2 differed significantly in inflammation-related signaling pathways (Figure 2A); thus, we analyzed the immune cell infiltration of both. ESTIMATE analysis showed that NT2 GC had higher distributions of the Stromal score, Immune score and ESTIMATE score, whereas the tumor purity was lower (Figure 2B). Then, ssGSEA revealed that there were more immune-infiltrating cells in NT2 (Figure 2C). The results of CIBERSORT showed the proportions of different types of immune cells. Active memory CD4+ T cells, monocytes, M0 and M1-like macrophages, activated mast cells, eosinophils and neutrophils were more abundant in NT2 GC than in NT1 GC. In contrast, NT2 exhibited lower levels of infiltration of plasma cells, resting memory CD4+ T cells, follicular helper T cells, Treg cells, resting dendritic cells, and resting mast cells (Figure 2D). This indicated that active, anti-tumor immune cells accounted for the majority in the tumor microenvironment (TME) within the NT2 cluster.
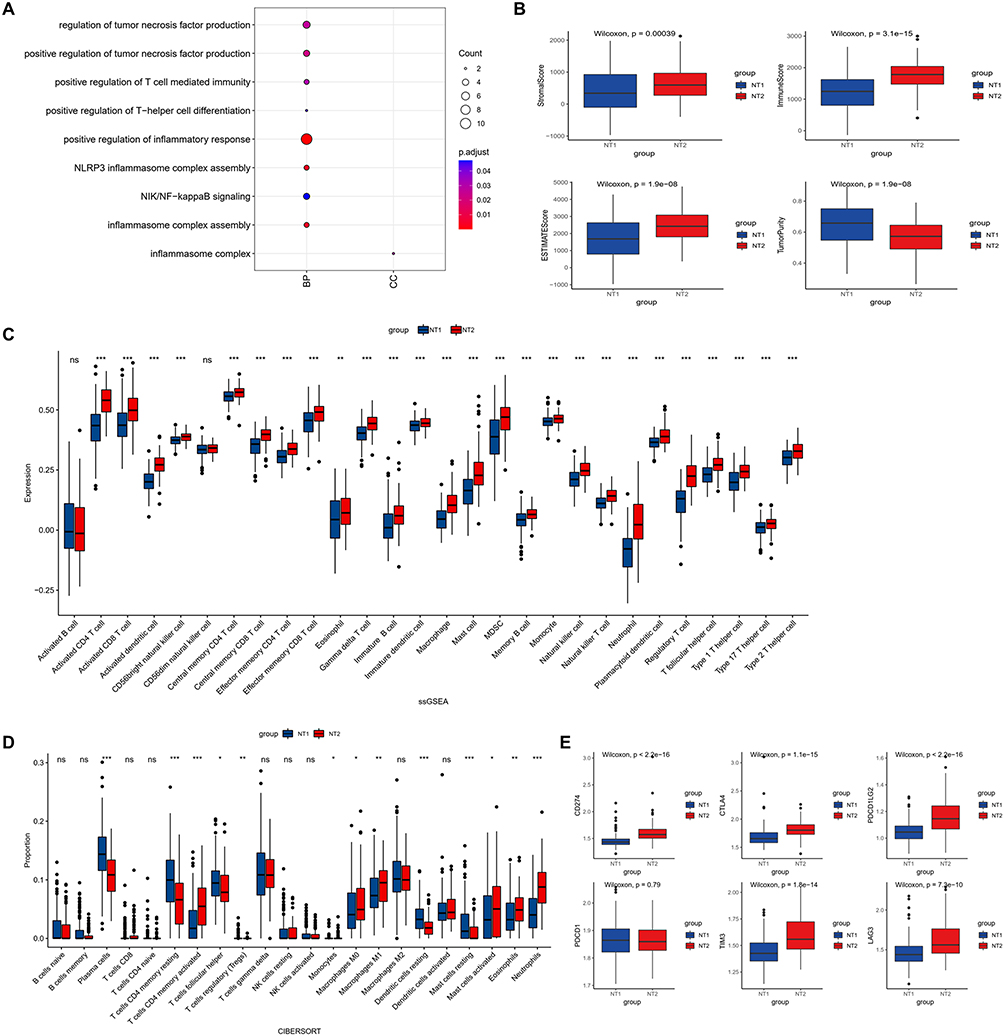 |
Figure 2 Bioenrichment, immune cell infiltration and immunotherapy efficacy prediction in the two NET subtypes. (A) GO analysis of two subtype-related pathways in the ACRG cohort. (B) Comparison of the ESTIMATE score, Immune score, Stromal score and tumor purity of the two subtypes in the ACRG cohort (Wilcoxon test). (C) Comparison of immune cell infiltration between the two subtypes in the ACRG cohort (ssGSEA, Wilcoxon test). (D) The proportions of infiltrating immune cells in the two subtypes were determined using the CIBERSORT tool. (E) Expression levels of immune checkpoint genes in the ACRG cohort (*P < 0.05, **P < 0.01, ***P < 0.001). |
Additionally, we compared immune checkpoint expression between the two types. Compared to NT1, there was no difference in the expression of programmed death 1 (PD-1); however, NT2 had a higher expression of CTLA4, PD-L1, LAG3, TIM3 and TIGIT. These results suggested that patients in the NT2 cluster might be more sensitive to immunotherapy (Figure 2E).
Identification of Prognostic NRGs and Construction of the Risk Model
Univariate COX, LASSO regression analysis screened 11 NRGs which were significantly associated with prognosis in GC patients (Figure 3A–C). Finally, prognostic signature genes were identified by stepwise regression, and five NRGs (ALPL, RIPK1, PIK3CA, SLC25A37, ITGAM) were used to construct a predictive model based on the risk score (Figure 3D). The risk score was calculated using the following formula: Risk score = (−3.11077x ALPL) + (−1.98572x RIPK1) + (1.32795x PIK3CA) + (−1.06982x SLC25A37) + (−2.71385x ITGAM), and the ROC curve results showed good stability of the predictive effect of the model (Figure 3E). According to the risk score, these patients were divided into Low-risk and High-risk groups. The expression of PIK3CA was significantly higher in the High-risk group than in the Low-risk group, and the other four genes were more highly expressed in the Low-risk group (Figure 3F). The Kaplan‒Meier survival analysis showed that the Low-risk group had a longer survival time (Figure 3G). The risk scores of NT1 and NT2 were calculated using the above model, and it was found that NT1 had a higher score compared with NT2 (Figure 3H), indicating that NT1 had a higher NET density, which was consistent with the survival analysis results of the previous Consensus cluster.
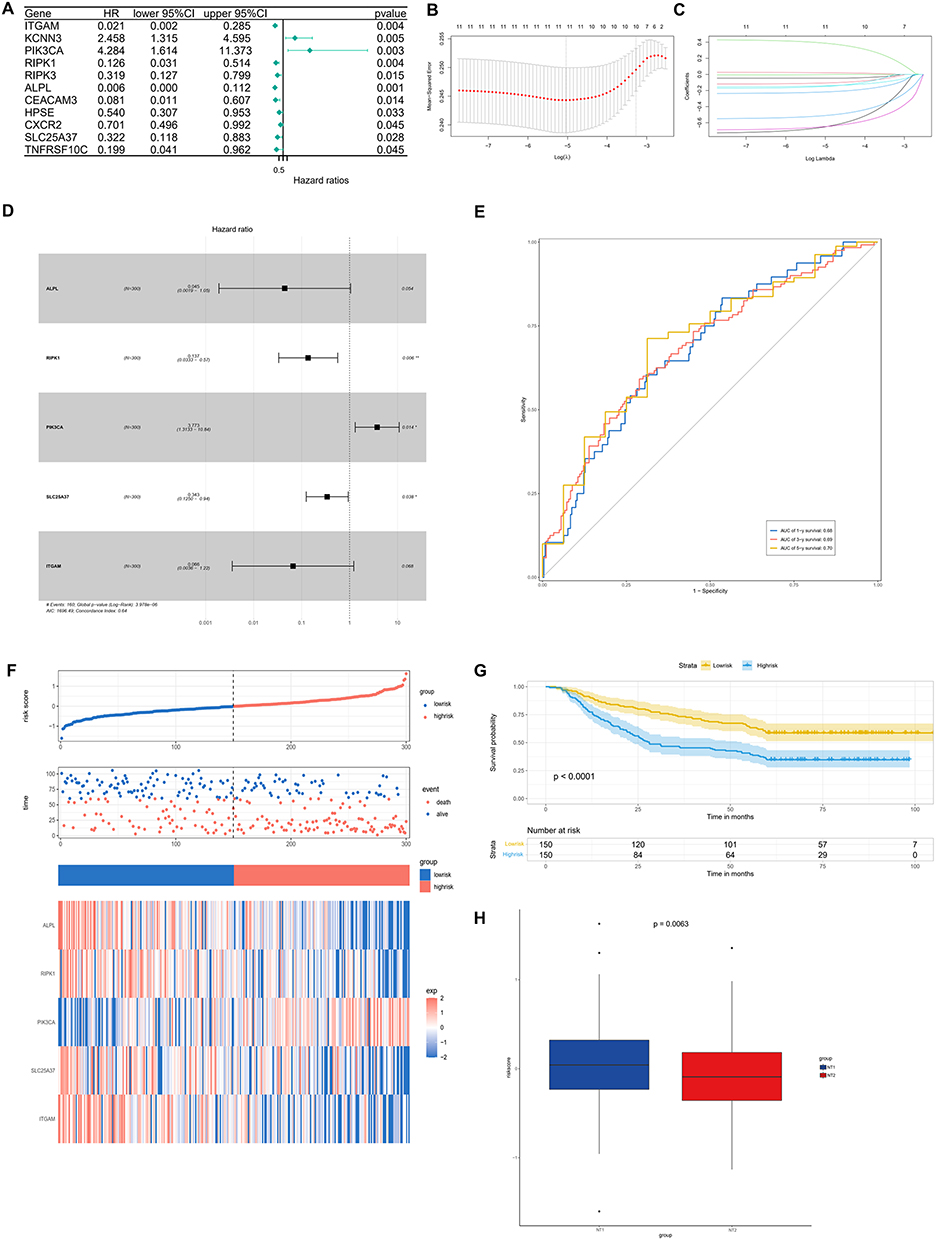 |
Figure 3 Construction of a gene risk score model in the ACRG cohort. (A) Prognostic analyses of 69 NET-related genes using univariate Cox regression model. (B) Screening of prognostic model genes using LASSO regression. (C) Cross-validation of LASSO regression parameter selection. (D) Stepwise regression to further screen prognosis-related genes and construct the model. (E). ROC curve to verify the validity and stability of the model. (F) Distribution of the risk score, prognostic model genes and survival status of 300 patients in the ACRG cohort. (G) Survival analysis of High-risk and Low-risk patients based on OS (Log rank test). (H) Risk scores of NT1 and NT2 (Wilcoxon test) (*P < 0.05, **P < 0.01). |
NET Density is Associated with Distinct Clinical Characteristics in GC
To validate these results, 243 patients diagnosed with GC who underwent surgery directly were evaluated for NET density. To identify the presence of NETs in GC, double immunofluorescence analysis of CitH3 and MPO was performed in FFPE tumor tissue samples. Representative images of NETs are shown in Figure 4A.
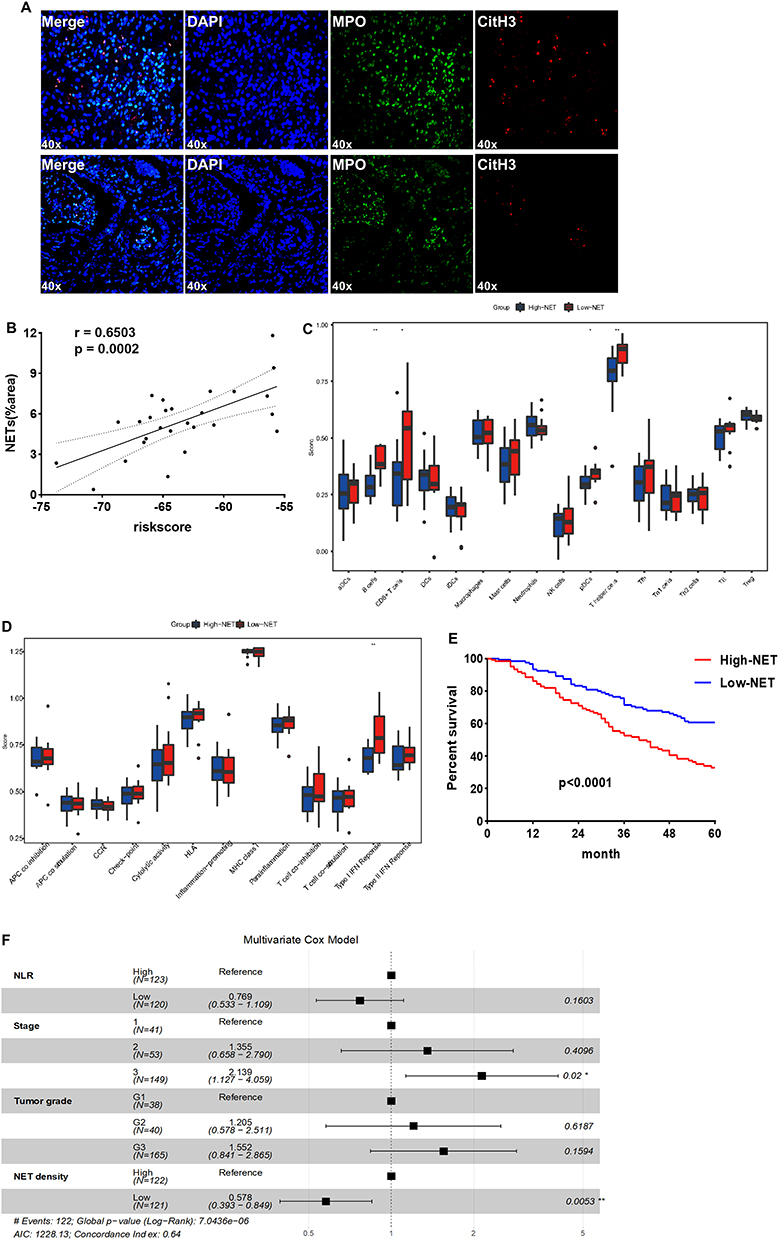 |
Figure 4 Validation of the prognostic value of NET density in the surgery group. (A) Representative images of different NET density. (B) The correlation analysis between NET density and risk score of 27 patients with GC. (C and D) Immune cell infiltration and immune function analysis in 27 patients (ssGSEA, Wilcoxon test). (E) Kaplan‒Meier survival curve of patients with High- and Low-NET in the surgery cohort (Log rank test). (F) Selection of independent prognostic factors using the Multivariate Cox model (*P < 0.05, **P < 0.01). |
To substantiate the above results, postoperative specimen RNA sequencing results from 27 patients in the surgery cohort were analyzed, and it was found that the risk score results were significantly correlated with the NET density confirmed by immunofluorescence (Figure 4B). These were divided into High-NET and Low-NET groups, with the median NET density as the cutoff value. The ssGSEA found that the Low-NET group had more B cells, CD8+ T cells, plasmacytoid dendritic cells (pDCs) and T helper cells (Figure 4C), and, there were higher levels of interferon I in these patients, which has anti-tumor capacity (Figure 4D).
The clinical features of all patients in the surgical cohort are listed in Table 1. The majority of patients were men (72.43%), and the range of age at initial diagnosis was 24‒80 years. Histological subtype was well-differentiated or moderately differentiated adenocarcinoma in 78 (32.1%) patients and poorly differentiated adenocarcinoma or signet ring cell carcinoma (SRCC) in 165 (67.9%) patients.
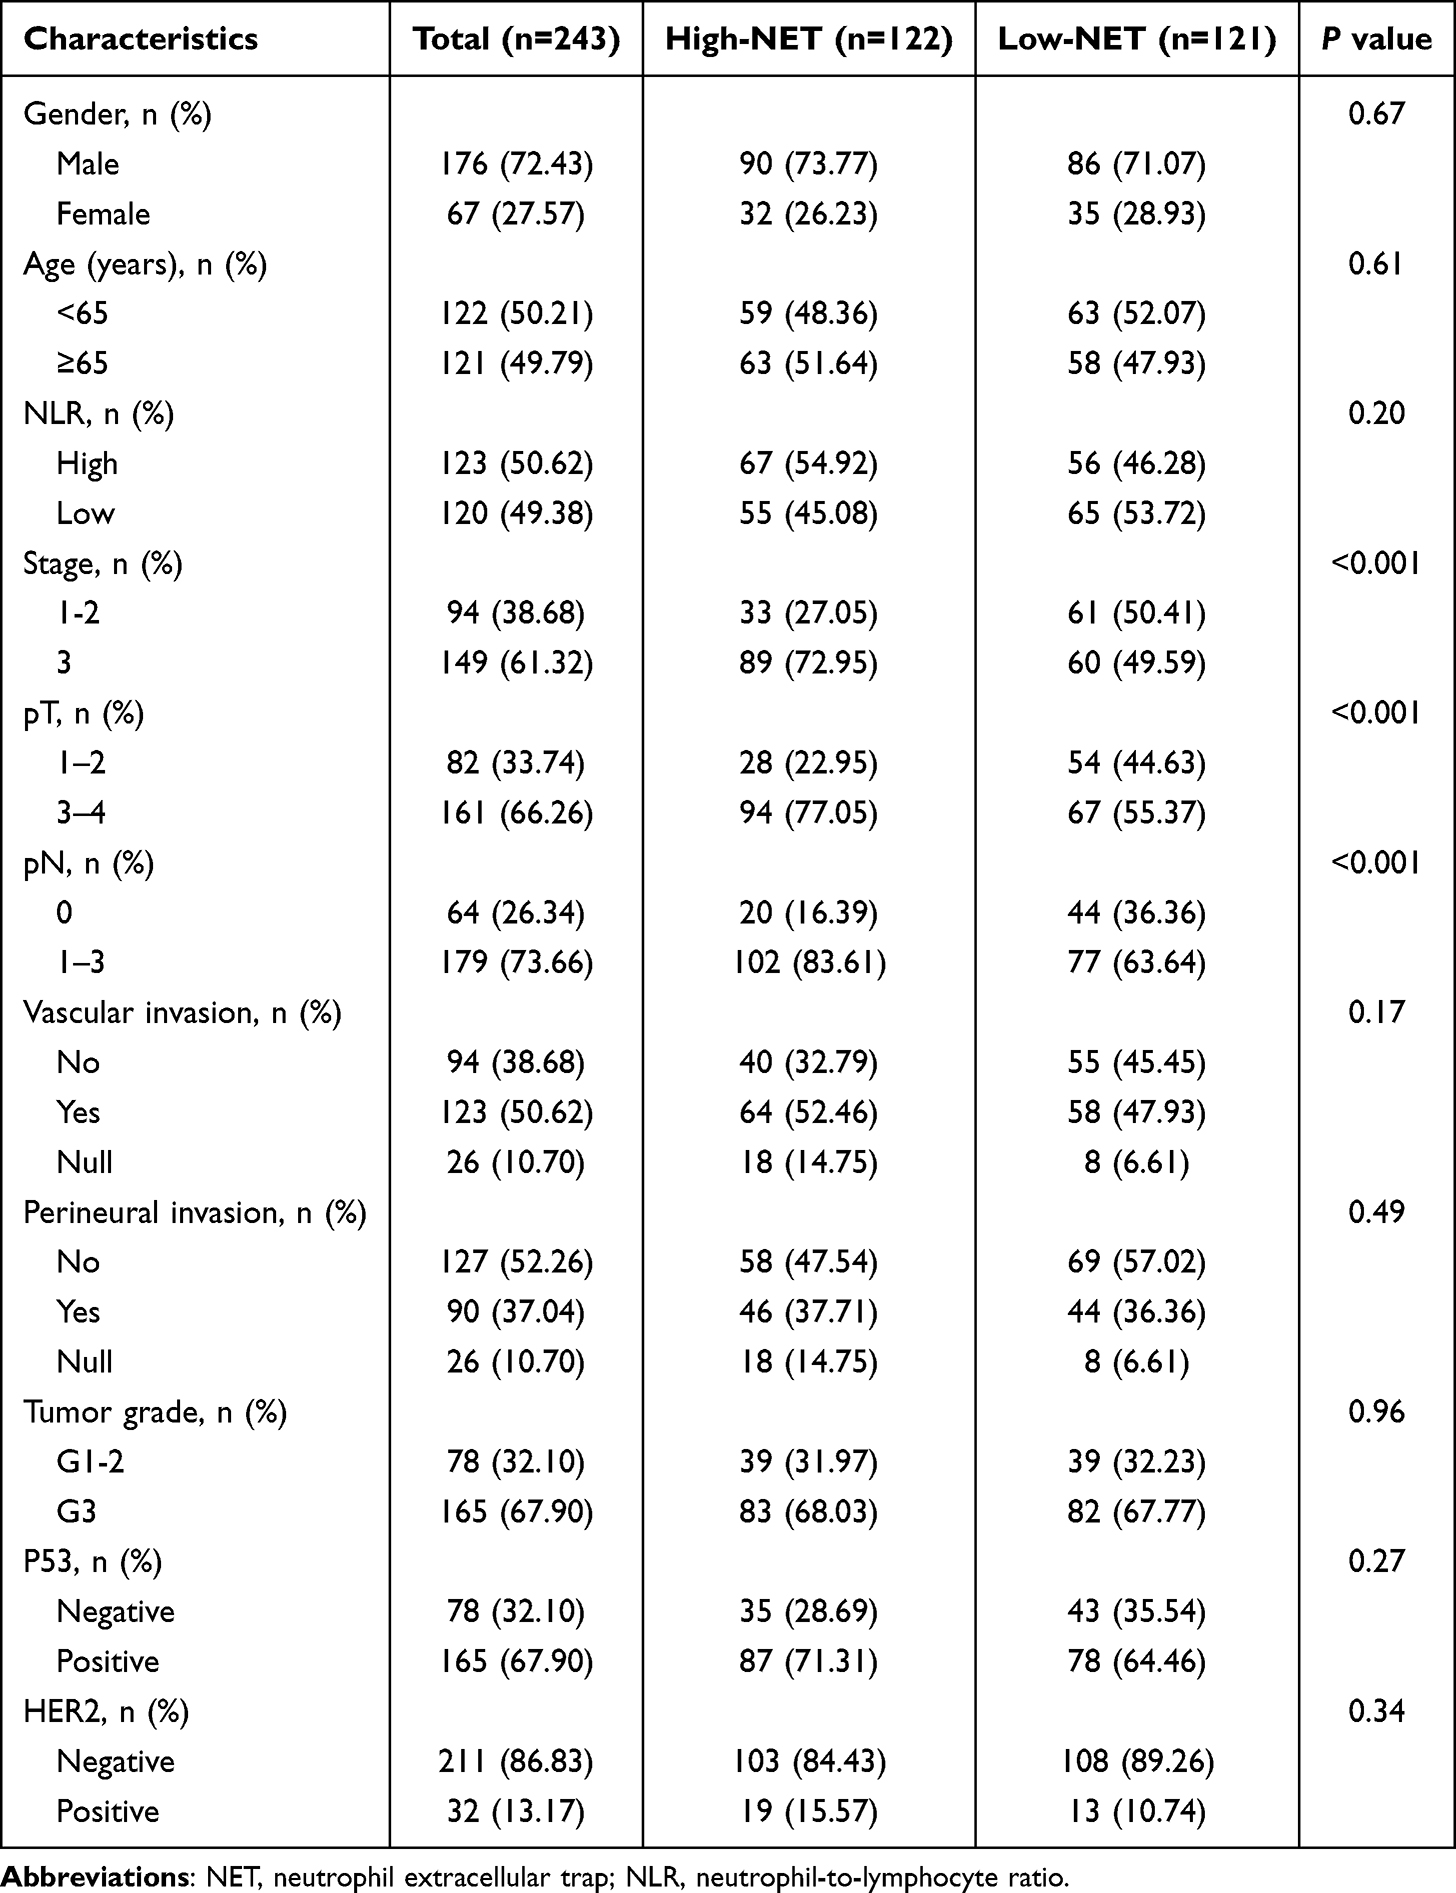 |
Table 1 Baseline Clinical Characteristics of the High-NET and Low-NET Group in the Surgery Cohort |
Patients were classified into Low-NET (n=121) and High-NET (n=122) tumor groups. The clinicopathological parameters were compared between the two groups (Table 1). High NET density was mostly observed in the patients with higher TNM stage (compared with stage III, P<0.001), tumors with serosal and sub-serosal exposure (pT3-4) (compared with pT1-2, P<0.001), and tumors with nodal metastasis (pN1-3) (compared with pN0, P<0.001).
NET Density Predicted the Prognosis of GC Patients
To investigate the prognostic value of NET density in patients with GC, we evaluated the significance of NET density in the surgical cohort. Kaplan–Meier analysis showed that the Low-NET group exhibited better RFS compared to the High-NET group (hazard ratio [HR] 0.47, 95% CI 0.32–0.68, P < 0.0001, Figure 4E). Moreover, univariate Cox regression analysis revealed that RFS was significantly associated with the NLR, pTNM stage, tumor grade, and NET density (Table 2). Multivariate Cox regression analysis showed that pTNM stage and NET density were independent predictors of RFS (Figure 4F). These findings suggested that NETs may play a significant role in promoting tumor progression.
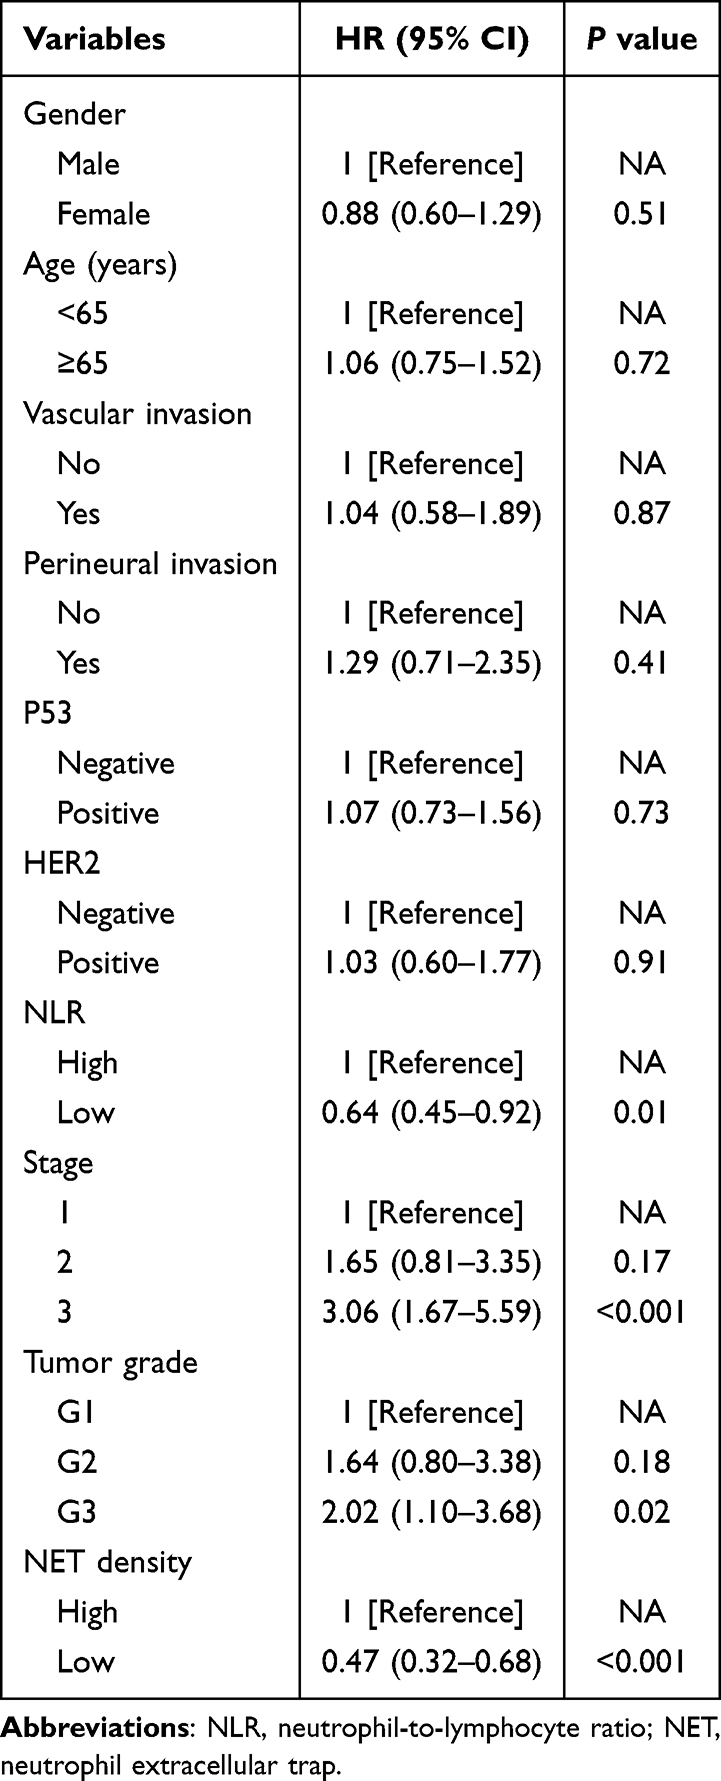 |
Table 2 Univariate Cox Analysis in the Surgery Cohort |
Association Between NET Density and Sensitivity to Immunotherapy in GC Patients
In order to verify the role of NET density in predicting the response to immunotherapy, we evaluated the NET density in the ICI cohort which included 49 patients with advanced GC without distant metastasis and treated with anti-PD-1 antibody. The baseline characteristics of these patients are summarized in Table 3. This cohort included 28 clinical stage 3 patients and 21 clinical stage 4A patients, and most of these patients had poorly differentiated tumors (37/49, 75.51%). Forty-seven patients (95.92%) received basal chemotherapy with SOX (S-1 plus oxaliplatin), and 2 patients received paclitaxel. The response rate was 30.61% (15/49), with 8 patients achieving pathological complete response (pCR).
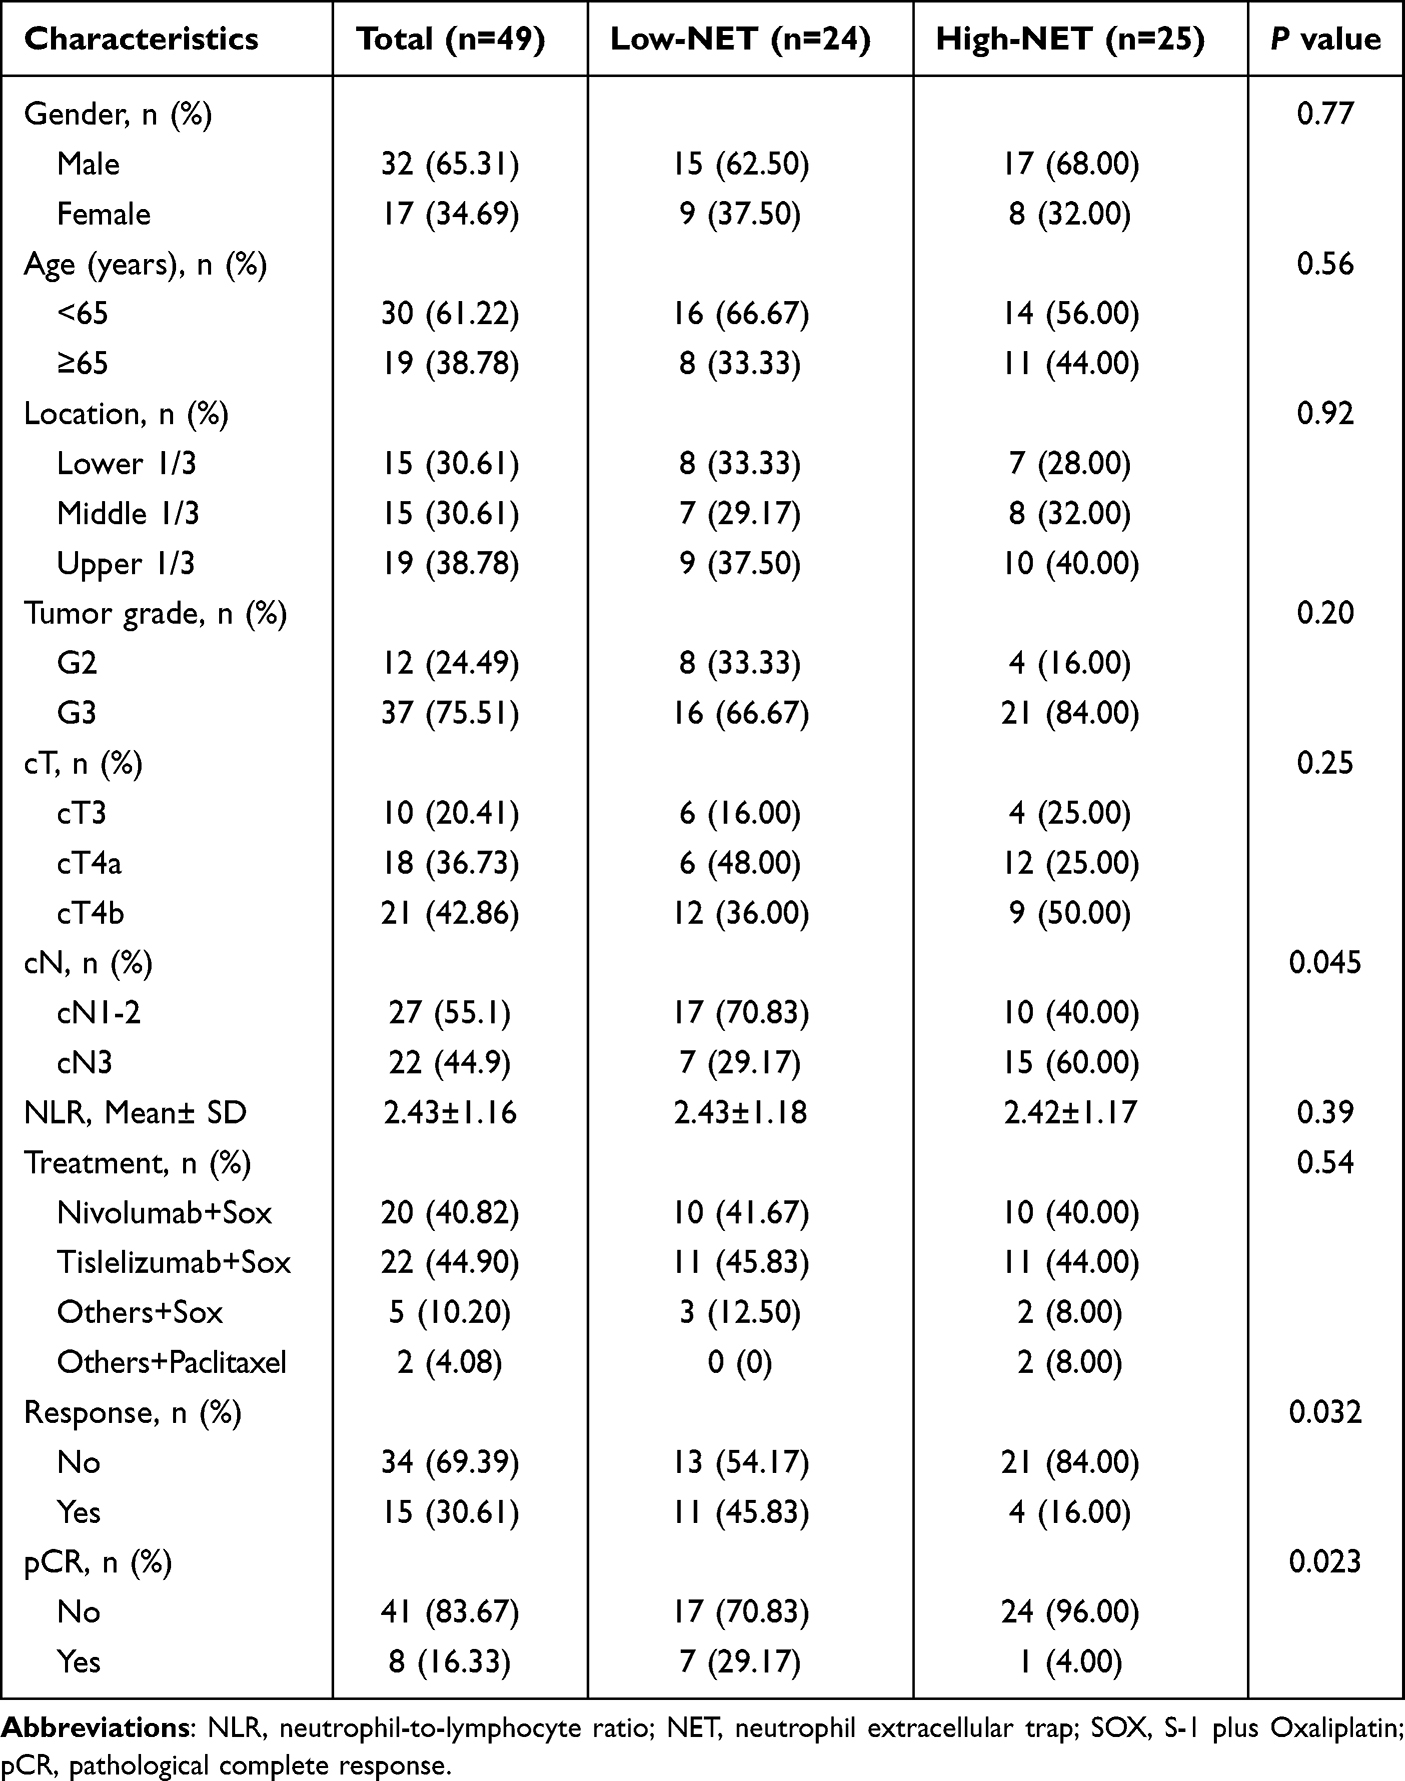 |
Table 3 Baseline Clinical Characteristics of the High-NET and Low-NET Group in the ICI Cohort |
Similarly, these patients were categorized into Low-NET and High-NET groups based on NET density in pre-ICI biopsy tissues. In the Low-NET group, the percentage of responders was significantly higher than that in the High-NET group (45.8% vs. 16.0%, P = 0.032, Figure 5A). Furthermore, more patients also achieved pCR in the Low-NET group compared with the High-NET group (29.2% vs. 4.0%, P = 0.023, Figure 5B).
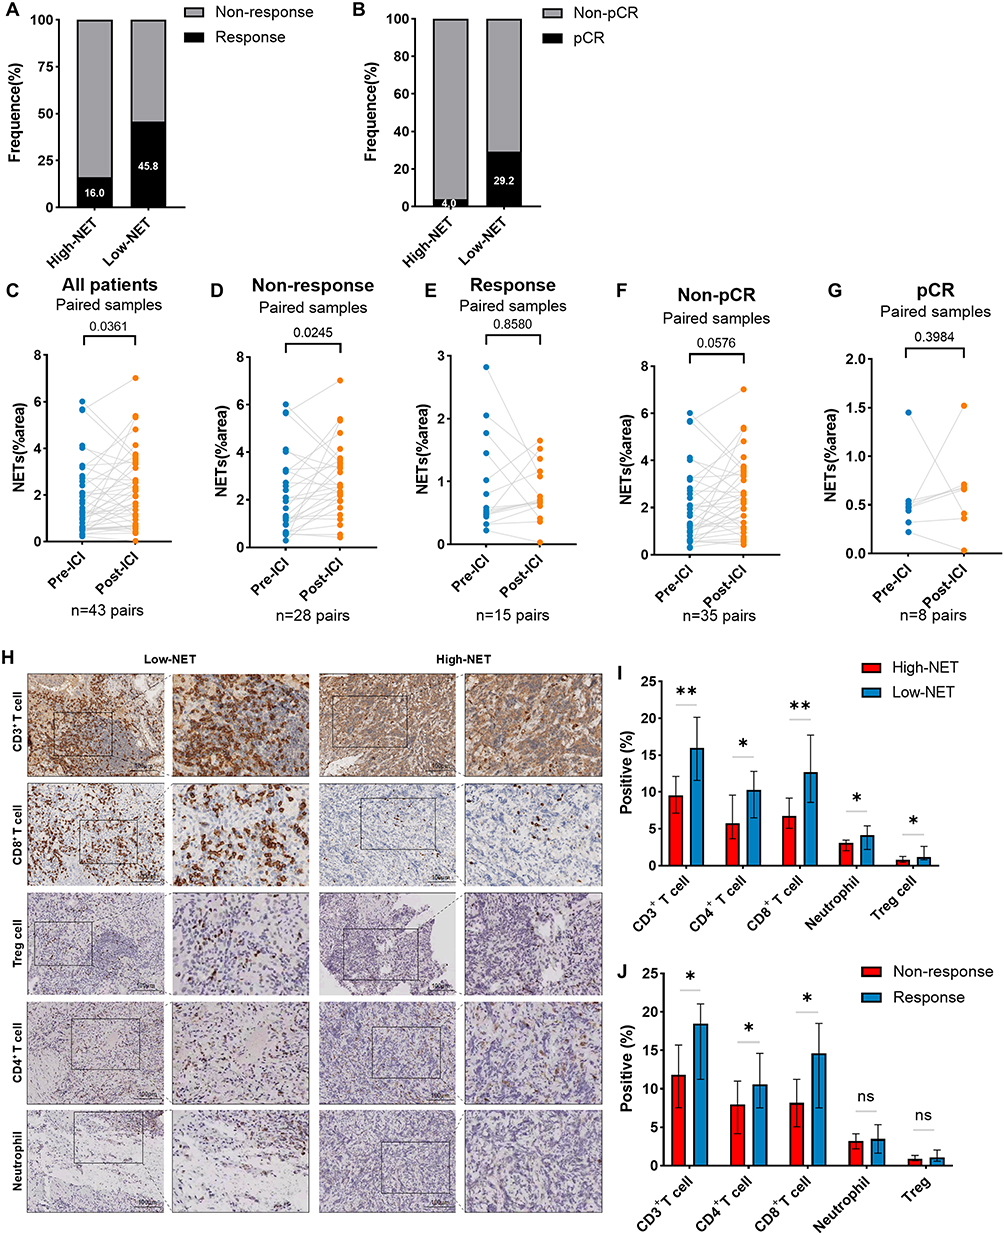 |
Figure 5 The association between NET density and immunotherapy response. (A and B) The level of NET in pre-ICI specimens was compared in responders and non-responders, pCR and non-pCR. (C). Change in NET density between pre-ICI and post-ICI in all ICI-treated (C), non-responder (D), responder (E), non-pCR (F) and pCR (G) groups (paired t-test). H. CD3+ T cells, CD4+ B cells, CD8+ T cells, Treg cells and neutrophils were compared in the response and non-response groups (independent t-test). I-J. Comparison of immune cell infiltration in High-NET and Low-NET groups and the response and non-response groups (*P < 0.05, **P < 0.01). |
We further investigated the patterns of ICI-induced changes in NET density. An increased NET density after treatment was found in all patients (P = 0.0361, Figure 5C), and in the non-response groups (P = 0.0245, Figure 5D). No significant difference was observed between pre- and post-ICI NET density in terms of response (P = 0.8580, Figure 5E), non-pCR (P = 0.0576, Figure 5F), and pCR groups (P = 0.3984, Figure 5G).
We also evaluated immune cell infiltration in the two NET groups of patients (Figure 5H). It was found that immune cell infiltration was correlated with NET density (Figure 5I). In addition, compared with the non-response group, the response group had significantly more CD3+, CD4+, and CD8+ T cells (Figure 5J), which may explain the difference in response between the two groups.
Discussion
Our data demonstrate that elevated NET density correlates with aggressive clinicopathological features, including advanced TNM stage and nodal metastasis, suggesting its role in promoting tumor progression. In addition, high NET density in the biopsy before treatment may indicate a poor response to immunotherapy in GC. Our findings demonstrated that NET density is a candidate predictive biomarker for prognosis and sensitive to immunotherapy of GC.
The TME has a complicated composition, which contains a variety of immune cells, tumor stroma, and a series of cytokines.28 The TME plays an important role in tumorigenesis, tumor progression, metastasis and drug resistance, and is not invariable.29,30 The components in the TME interact with each other to influence tumor biological behavior, and recent studies have found that TME not only influences the prognosis of patients with cancer, but also has an impact on the efficacy of neoadjuvant therapy in tumors, including chemotherapy, radiotherapy, and immunotherapy.31,32 We found that compared to tumors with low NET density, tumors with high levels of NET always had immune cell depletion which shows overexpression of inhibitory receptors and decreased effector cytokine production leading to failure of tumor elimination.
Tumor-associated neutrophils (TANs) are important components in the TME.33 A few studies have shown that TANs have some anti-tumor effects, for example, a new population of TANs was found in lung cancer patients, which can communicate with antigen-presenting cells and promote the anti-tumor effect of CD8+ T cells.34 However, most of the current findings support that the main role of TANs is the promotion of tumor cell proliferation and metastasis.35–37 This discrepancy may be due to the fact that our current understanding of the phenotypes, mechanisms of infiltration and the functions of TANs is still deficient. NETs were first discovered in 2004 and are important products of neutrophils. In previous studies, it was also found that NETs play an important role in innate immunity, and their unique structure has led to the capture of pathogens and various cells.38 Recent studies have identified the accumulation of NETs in tumors and peripheral blood, which is a new mechanism contributing to the progression and metastasis of multiple cancer types, including lung cancer,39 breast cancer40 and colorectal cancer,41 and is associated with the dismal prognosis of patients with cancer.42 NETs can shield tumor cells from aggressive immune cells; thus, protecting these tumor cells.16 In addition, NETs are closely associated with other components of the TME.43 T helper 17 (Th17) cells in pancreatic cancer were found to promote the development and progression of tumors, and were able to induce NET production, thereby inhibiting the anti-tumor effects of CD8+ T cells.44 Additionally, NETs also accelerated the formation of cancer-associated fibroblasts (CAFs) and promoted liver metastasis in pancreatic cancer.45 Our previous findings also showed that the increased level of NETs in locally advanced rectal cancer was associated with epithelial mesenchymal transition and immunosuppressive TME formation, which led to a poor outcome.18 Consistently, we also found that immune cell infiltration was different in GC with different levels of NET density.
Immunotherapy has been extensively investigated and its effectiveness proven in diverse tumor types. Initially, it was mainly used to treat melanoma and lung cancer, and clinical trials have proved that it can significantly improve survival rates.46,47 Following further investigation, immunotherapy has also been used in the treatment of liver cancer,48 head and neck squamous cell cancer,49 and colorectal cancer.50 In past decades, studies of immunotherapy for GC have also shown promising results. According to previous studies, tumor-infiltrating lymphocytes (TILs) have an important contribution to the efficacy of immunotherapy.51 On the one hand, the higher level of TILs in the tumor the more likely it is to respond to immunotherapy as compared with tumors with low TILs. On the other hand, immunotherapy drugs may transform “cold” tumors into “hot” tumors, characterized by restoring CD8+ T cells feature and increasing TILs.52,53 Previous studies using public data also found that NETs are associated with cancer stem cell indices and chemotherapy sensitivity in gastric cancer.20 Our findings further clarified the relationship between NETs and the efficacy of immunotherapy in gastric cancer and implied that tumors with a high NET density had fewer TILs in the TME, which may explain why patients with high NET density did not respond to immunotherapy.
While our study has provided valuable insights, it still has some limitations. First, the crosstalk between NETs and immune cells in the TME warrants further investigation, with the specific mechanisms of NET inhibition needing elucidation through future in vitro co-culture and mouse model studies. Second, our retrospective study may have selection bias and thus limited the clinical and pathological investigation results. Furthermore, the number of patients included in this study was limited, the sample size of RNA-seq and patients received immunotherapy was relatively small, and no formal prior efficacy analysis was conducted. This is because the study was exploratory in nature and constrained by the availability of sequencing data. Finally, we are not able to provide survival data on the immunotherapy cohort, as they have not yet been followed up for more than 3 years. Further study is warranted to explore the mechanisms and verify our findings.
Conclusion
We demonstrated that the density of NETs serves as a crucial marker for predicting RFS in patients with GC after surgical resection. Higher NET density is associated with more aggressive tumor characteristics and worse survival outcomes. Additionally, lower NET density correlates with improved responses to immunotherapy, emphasizing that NET density would help identify individuals with GC who could benefit from immunotherapy.
Abbreviations
NET, Neutrophil extracellular trap; GC, gastric cancer; NRGs, NET-related genes; PD-1, programmed death 1; ICIs, immune checkpoint inhibitors; ACRG, Asian Cancer Research Group; DEGs, differentially expressed genes; GO, Gene Ontology; ssGSEA, single-sample gene-set enrichment analysis; NLR, neutrophil-to-lymphocyte ratio; CR, complete response; PR, partial response; SD, stable disease; PD, progressive disease; CitH3, citrullinated histone H3; SRCC, signet ring cell carcinoma; SOX, S-1 plus oxaliplatin; pCR, pathological complete response; TANs, Tumor-associated neutrophils; Th17, T helper cell 17; TILs, tumor-infiltrating lymphocytes; TME, tumor microenvironment.
Data Sharing Statement
The datasets used and/or analyzed during the current study are available from the corresponding author on reasonable request. The public data used in our study can be obtained from the NCBI Gene Expression Omnibus (GEO) database (https://www.ncbi.nlm.nih.gov/geo/).
Ethics Approval and Consent to Publication
The study involving human participants were conducted in accordance with the Declaration of Helsinki and approved by the Institute Research Ethics Committees of the 7th Medical Center of Chinese PLA General Hospital (Approval No: S2025-062-01).
Acknowledgments
We thank Majorbio Company for offering the gene expression sequencing.
Author Contributions
Wentao Zhong: Conception, Study design, Investigation, Data curation, Formal analysis and interpretation, Writing – original draft. Writing – review & editing. Qianyu Wang: Data curation, Formal analysis, Investigation, Writing – original draft. Liang Sun: Methodology, Data curation, Writing – original draft. Hongyan Zhu: Formal analysis, Methodology, Software, Writing – original draft. Huiyun Cai: Data curation, Writing – review & editing. Junhua Dong: Methodology, Resources, Writing – review & editing. Gang Chen: Data curation, Methodology, Writing – review & editing. Aijun Liu: Project administration, Software, Validation, Supervision, Writing – review & editing. Junfeng Du: Study design, Investigation, Data curation, Visualization, Supervision, Writing – review & editing. All authors gave final approval of the version to be published; have agreed on the journal to which the article has been submitted; and agree to be accountable for all aspects of the work.
Funding
This work was supported, in part, by grants from the Natural Science Foundation of Beijing (No.7242034) and New Technologies and Businesses of the PLAGH (5156ZE1Q).
Disclosure
The authors declare that the research was conducted in the absence of any commercial or financial relationships that could be construed as a potential conflict of interest.
References
1. Bray F, Laversanne M, Sung H, et al. Global cancer statistics 2022: GLOBOCAN estimates of incidence and mortality worldwide for 36 cancers in 185 countries. CA Cancer J Clin. 2024;74(3):229–16. doi:10.3322/caac.21834
2. Alsina M, Arrazubi V, Diez M, Tabernero J. Current developments in gastric cancer: from molecular profiling to treatment strategy. Nat Rev Gastroenterol Hepatol. 2023;20(3):155–170. doi:10.1038/s41575-022-00703-w
3. Ajani JA, D’Amico TA, Bentrem DJ, et al. Gastric cancer, version 2.2022, NCCN clinical practice guidelines in oncology. J Natl Compr Canc Netw. 2022;20(2):167–192. doi:10.6004/jnccn.2022.0008
4. Shah MA, Kennedy EB, Alarcon-Rozas AE, et al. Immunotherapy and targeted therapy for advanced gastroesophageal cancer: ASCO guideline. J Clin Oncol. 2023;41(7):1470–1491. doi:10.1200/jco.22.02331
5. Greten FR, Grivennikov SI. Inflammation and cancer: triggers, mechanisms, and consequences. Immunity. 2019;51(1):27–41. doi:10.1016/j.immuni.2019.06.025
6. Zhang S, Xiao X, Yi Y, et al. Tumor initiation and early tumorigenesis: molecular mechanisms and interventional targets. Signal Transduct Target Ther. 2024;9(1):149. doi:10.1038/s41392-024-01848-7
7. Amieva M, Peek RM Jr. Pathobiology of Helicobacter Pylori-Induced Gastric Cancer. Gastroenterology. 2016;150(1):64–78. doi:10.1053/j.gastro.2015.09.004
8. Hedrick CC, Malanchi I. Neutrophils in cancer: heterogeneous and multifaceted. Nat Rev Immunol. 2022;22(3):173–187. doi:10.1038/s41577-021-00571-6
9. Herro R, Grimes HL. The diverse roles of neutrophils from protection to pathogenesis. Nat Immunol. 2024;25(12):2209–2219. doi:10.1038/s41590-024-02006-5
10. Gungabeesoon J, Gort-Freitas NA, Kiss M, et al. A neutrophil response linked to tumor control in immunotherapy. Cell. 2023;186(7):1448–1464.e20. doi:10.1016/j.cell.2023.02.032
11. Brinkmann V, Reichard U, Goosmann C, et al. Neutrophil extracellular traps kill bacteria. Science. 2004;303(5663):1532–1535. doi:10.1126/science.1092385
12. Zhong W, Wang Q, Shen X, Du J. The emerging role of neutrophil extracellular traps in cancer: from lab to ward. Front Oncol. 2023;13:1163802. doi:10.3389/fonc.2023.1163802
13. van der Windt DJ, Sud V, Zhang H, et al. Neutrophil extracellular traps promote inflammation and development of hepatocellular carcinoma in nonalcoholic steatohepatitis. Hepatology. 2018;68(4):1347–1360. doi:10.1002/hep.29914
14. Wang G, Gao H, Dai S, et al. Metformin inhibits neutrophil extracellular traps-promoted pancreatic carcinogenesis in obese mice. Cancer Lett. 2023;562:216155. doi:10.1016/j.canlet.2023.216155
15. Xia X, Zhang Z, Zhu C, et al. Neutrophil extracellular traps promote metastasis in gastric cancer patients with postoperative abdominal infectious complications. Nat Commun. 2022;13(1):1017. doi:10.1038/s41467-022-28492-5
16. Teijeira Á, Garasa S, Gato M, et al. CXCR1 and CXCR2 chemokine receptor agonists produced by tumors induce neutrophil extracellular traps that interfere with immune cytotoxicity. Immunity. 2020;52(5):856–871.e8. doi:10.1016/j.immuni.2020.03.001
17. Demkow U. Neutrophil Extracellular Traps (NETs) in cancer invasion, evasion and metastasis. Cancers. 2021;13(17):4495. doi:10.3390/cancers13174495
18. Zhong W, Wang Q, Shen X, et al. Neutrophil extracellular trap is surrogate biomarker for prognosis and response to neoadjuvant therapy in locally advanced rectal cancer. J Inflamm Res. 2023;16:6443–6455. doi:10.2147/jir.S441981
19. Sun N, Jiang J, Chen B, et al. Neutrophil extracellular trap genes predict immunotherapy response in gastric cancer. Heliyon. 2024;10(17):e37357. doi:10.1016/j.heliyon.2024.e37357
20. Li M, Zhao Z, Mak TK, et al. Neutrophil extracellular traps-related signature predicts the prognosis and immune infiltration in gastric cancer. Front Med. 2023;10:1174764. doi:10.3389/fmed.2023.1174764
21. Cristescu R, Lee J, Nebozhyn M, et al. Molecular analysis of gastric cancer identifies subtypes associated with distinct clinical outcomes. Nat Med. 2015;21(5):449–456. doi:10.1038/nm.3850
22. Li Q, Chen W, Li Q, Mao J, Chen X. A novel neutrophil extracellular trap signature to predict prognosis and immunotherapy response in head and neck squamous cell carcinoma. Front Immunol. 2022;13:1019967. doi:10.3389/fimmu.2022.1019967
23. Wilkerson MD, Hayes DN. ConsensusClusterPlus: a class discovery tool with confidence assessments and item tracking. Bioinformatics. 2010;26(12):1572–1573. doi:10.1093/bioinformatics/btq170
24. He Y, Jiang Z, Chen C, Wang X. Classification of triple-negative breast cancers based on Immunogenomic profiling. J Exp Clin Cancer Res. 2018;37(1):327. doi:10.1186/s13046-018-1002-1
25. Eisenhauer EA, Therasse P, Bogaerts J, et al. New response evaluation criteria in solid tumours: revised RECIST guideline (version 1.1). Eur J Cancer. 2009;45(2):228–247. doi:10.1016/j.ejca.2008.10.026
26. Yang L, Liu Q, Zhang X, et al. DNA of neutrophil extracellular traps promotes cancer metastasis via CCDC25. Nature. 2020;583(7814):133–138. doi:10.1038/s41586-020-2394-6
27. Nie M, Yang L, Bi X, et al. Neutrophil extracellular traps induced by IL8 promote diffuse large b-cell lymphoma progression via the TLR9 signaling. Clin Cancer Res. 2019;25(6):1867–1879. doi:10.1158/1078-0432.Ccr-18-1226
28. Pitt JM, Marabelle A, Eggermont A, Soria JC, Kroemer G, Zitvogel L. Targeting the tumor microenvironment: removing obstruction to anticancer immune responses and immunotherapy. Ann Oncol. 2016;27(8):1482–1492. doi:10.1093/annonc/mdw168
29. Quail DF, Joyce JA. Microenvironmental regulation of tumor progression and metastasis. Nat Med. 2013;19(11):1423–1437. doi:10.1038/nm.3394
30. Kundu M, Butti R, Panda VK, et al. Modulation of the tumor microenvironment and mechanism of immunotherapy-based drug resistance in breast cancer. Mol Cancer. 2024;23(1):92. doi:10.1186/s12943-024-01990-4
31. Zhang H, Ye L, Yu X, Jin K, Wu W. Neoadjuvant therapy alters the immune microenvironment in pancreatic cancer. Front Immunol. 2022;13:956984. doi:10.3389/fimmu.2022.956984
32. Wang J, Yang J, Narang A, et al. Consensus, debate, and prospective on pancreatic cancer treatments. J Hematol Oncol. 2024;17(1):92. doi:10.1186/s13045-024-01613-x
33. Zhang M, Qin H, Wu Y, Gao Q. Complex role of neutrophils in the tumor microenvironment: an avenue for novel immunotherapies. Cancer Biol Med. 2024;21(10):849–863. doi:10.20892/j.issn.2095-3941.2024.0192
34. Singhal S, Bhojnagarwala PS, O’Brien S, et al. Origin and role of a subset of tumor-associated neutrophils with antigen-presenting cell features in early-stage human lung cancer. Cancer Cell. 2016;30(1):120–135. doi:10.1016/j.ccell.2016.06.001
35. Gentles AJ, Newman AM, Liu CL, et al. The prognostic landscape of genes and infiltrating immune cells across human cancers. Nat Med. 2015;21(8):938–945. doi:10.1038/nm.3909
36. Coffelt SB, Kersten K, Doornebal CW, et al. IL-17-producing γδ T cells and neutrophils conspire to promote breast cancer metastasis. Nature. 2015;522(7556):345–348. doi:10.1038/nature14282
37. Shaul ME, Fridlender ZG. Tumour-associated neutrophils in patients with cancer. Nat Rev Clin Oncol. 2019;16(10):601–620. doi:10.1038/s41571-019-0222-4
38. Papayannopoulos V. Neutrophil extracellular traps in immunity and disease. Nat Rev Immunol. 2018;18(2):134–147. doi:10.1038/nri.2017.105
39. Demers M, Wong SL, Martinod K, et al. Priming of neutrophils toward NETosis promotes tumor growth. Oncoimmunology. 2016;5(5):e1134073. doi:10.1080/2162402x.2015.1134073
40. Taifour T, Attalla SS, Zuo D, et al. The tumor-derived cytokine Chi3l1 induces neutrophil extracellular traps that promote T cell exclusion in triple-negative breast cancer. Immunity. 2023;56(12):2755–2772.e8. doi:10.1016/j.immuni.2023.11.002
41. Li C, Chen T, Liu J, et al. FGF19-induced inflammatory CAF promoted neutrophil extracellular trap formation in the liver metastasis of colorectal cancer. Adv Sci. 2023;10(24):e2302613. doi:10.1002/advs.202302613
42. He XY, Gao Y, Ng D, et al. Chronic stress increases metastasis via neutrophil-mediated changes to the microenvironment. Cancer Cell. 2024;42(3):474–486.e12. doi:10.1016/j.ccell.2024.01.013
43. Zhai R, Gong Z, Wang M, et al. Neutrophil extracellular traps promote invasion and metastasis via NLRP3-mediated oral squamous cell carcinoma pyroptosis inhibition. Cell Death Discov. 2024;10(1):214. doi:10.1038/s41420-024-01982-9
44. Zhang Y, Chandra V, Riquelme Sanchez E, et al. Interleukin-17-induced neutrophil extracellular traps mediate resistance to checkpoint blockade in pancreatic cancer. J Exp Med. 2020;217(12). doi:10.1084/jem.20190354
45. Takesue S, Ohuchida K, Shinkawa T, et al. Neutrophil extracellular traps promote liver micrometastasis in pancreatic ductal adenocarcinoma via the activation of cancer‑associated fibroblasts. Int J Oncol. 2020;56(2):596–605. doi:10.3892/ijo.2019.4951
46. Huang AC, Zappasodi R. A decade of checkpoint blockade immunotherapy in melanoma: understanding the molecular basis for immune sensitivity and resistance. Nat Immunol. 2022;23(5):660–670. doi:10.1038/s41590-022-01141-1
47. Lahiri A, Maji A, Potdar PD, et al. Lung cancer immunotherapy: progress, pitfalls, and promises. Mol Cancer. 2023;22(1):40. doi:10.1186/s12943-023-01740-y
48. Ruf B, Heinrich B, Greten TF. Immunobiology and immunotherapy of HCC: spotlight on innate and innate-like immune cells. Cell Mol Immunol. 2021;18(1):112–127. doi:10.1038/s41423-020-00572-w
49. Ruffin AT, Li H, Vujanovic L, Zandberg DP, Ferris RL, Bruno TC. Improving head and neck cancer therapies by immunomodulation of the tumour microenvironment. Nat Rev Cancer. 2023;23(3):173–188. doi:10.1038/s41568-022-00531-9
50. Ganesh K, Stadler ZK, Cercek A, et al. Immunotherapy in colorectal cancer: rationale, challenges and potential. Nat Rev Gastroenterol Hepatol. 2019;16(6):361–375. doi:10.1038/s41575-019-0126-x
51. Paijens ST, Vledder A, de Bruyn M, Nijman HW. Tumor-infiltrating lymphocytes in the immunotherapy era. Cell Mol Immunol. 2021;18(4):842–859. doi:10.1038/s41423-020-00565-9
52. Liu YT, Sun ZJ. Turning cold tumors into hot tumors by improving T-cell infiltration. Theranostics. 2021;11(11):5365–5386. doi:10.7150/thno.58390
53. Wang Q, Shen X, Chen G, Du J. How to overcome resistance to immune checkpoint inhibitors in colorectal cancer: from mechanisms to translation. Int J Cancer. 2023;153(4):709–722. doi:10.1002/ijc.34464
 © 2026 The Author(s). This work is published and licensed by Dove Medical Press Limited. The
full terms of this license are available at https://www.dovepress.com/terms
and incorporate the Creative Commons Attribution
- Non Commercial (unported, 4.0) License.
By accessing the work you hereby accept the Terms. Non-commercial uses of the work are permitted
without any further permission from Dove Medical Press Limited, provided the work is properly
attributed. For permission for commercial use of this work, please see paragraphs 4.2 and 5 of our Terms.
© 2026 The Author(s). This work is published and licensed by Dove Medical Press Limited. The
full terms of this license are available at https://www.dovepress.com/terms
and incorporate the Creative Commons Attribution
- Non Commercial (unported, 4.0) License.
By accessing the work you hereby accept the Terms. Non-commercial uses of the work are permitted
without any further permission from Dove Medical Press Limited, provided the work is properly
attributed. For permission for commercial use of this work, please see paragraphs 4.2 and 5 of our Terms.