Back to Journals » OncoTargets and Therapy » Volume 14
Neutral Desorption Extractive Electrospray Ionization Mass Spectrometry Analysis Sputum for Non-Invasive Lung Adenocarcinoma Detection
Authors Zheng Q, Zhang J, Wang X, Zhang W ![]() , Xiao Y, Hu S, Xu J
, Xiao Y, Hu S, Xu J
Received 29 July 2020
Accepted for publication 2 December 2020
Published 15 January 2021 Volume 2021:14 Pages 469—479
DOI https://doi.org/10.2147/OTT.S269300
Checked for plagiarism Yes
Review by Single anonymous peer review
Peer reviewer comments 2
Editor who approved publication: Dr Arseniy Yuzhalin
Qiaoling Zheng,1,2 Jianyong Zhang,1,3 Xinchen Wang,4 Wenxiong Zhang,1 Yipo Xiao,4 Sheng Hu,1 Jianjun Xu1
1Department of Cardiothoracic Surgery, The Second Affiliated Hospital of Nanchang University, Nanchang, Jiangxi Province 330006, People’s Republic of China; 2Jiangxi Health Vocational College, Nanchang, Jiangxi 330000, People’s Republic of China; 3The Affiliated Hospital of Guizhou Medical University, Guiyang, Guizhou Province 550000, People’s Republic of China; 4Jiangxi Key Laboratory for Mass Spectrometry and Instrumentation, East China University of Technology, Nanchang, Jiangxi Province 330013, People’s Republic of China
Correspondence: Jianjun Xu Tel + 8613907913526
Email [email protected]
Purpose: Increased use of low-dose spiral computed tomography (LDCT: low-dose computed tomography) screening has contributed to more frequent incidental detection of peripheral lung nodules, part of them were adenocarcinoma, which need to be further evaluated to establish a definitive diagnosis. Here, our primary objective was to evaluate the ambient mass spectrometry (AMS) sputum analysis as a non-invasive lung adenocarcinoma (LAC) diagnosis solution.
Patients and Methods: Neutral desorption extractive electrospray ionization mass spectrometry (ND-EESI-MS) and collision induced dissociation (CID) were used to detect sputum metabolites from 143 spontaneous sputum samples. Partial least squares-discriminant analysis (PLS-DA) was used to refine the biomarker panel, whereas orthogonal PLS-DA (OPLS-DA) was used to operationalize the enhanced biomarker panel for diagnosis.
Results: In this approach, 19 altered metabolites were detected by ND-EESI-MS from 76 cases of LAC and 67 cases of control. Significance testing and receiver operating characteristic (ROC) analysis identified 5 metabolites [hydroxyphenyllactic acid, phytosphingosine, N-nonanoylglycine, sphinganine, S-carboxymethyl-L-cysteine] with p < 0.05 and AUC > 0.75, respectively. Evaluation of model performance for prediction of LAC resulted in a cross-validation classification accuracy of 87.9%. Metabolic pathway analysis showed that sphingolipid metabolism, fatty acid metabolism, carnitine synthesis and Warburg effect were most impacted in response to disease.
Conclusion: This study indicates that the application of ND-EESI-MS to sputum analysis can be used as a non-invasive detection of peripheral lung nodules. The use of sputum metabolite biomarkers may aid in the development of a further evaluation program for lung adenocarcinoma.
Keywords: lung cancer, metabolomics, ND-EESI-MS, diagnosis, non-invasive detection
Introduction
Last decade, the proportion of lung adenocarcinoma increased from 20% to almost 80%.1–4 The 5-year survival rate for early lung adenocarcinoma was significantly better than that for advanced lung adenocarcinoma.5,6 Due to the lack of ideal detection methods, some patients with lung adenocarcinoma did not receive timely treatment and turned into advanced lung adenocarcinoma. The increased use of LDCT has contributed to more frequent incidental detection of peripheral lung nodules, and the most common malignant finding was primary lung adenocarcinoma.3,6,7 However, LDCT screening results from independent randomized controlled trials (RCTs) in Europe showed no contribution to mortality reduction, although more early-stage cancers were detected.8,9 In addition, challenges including high false-positive rates, over diagnosis, enormous costs, and radiation risk, emerged with the progress of LDCT screening.7 Complementary biomarkers and technical improvements are expected in the lung adenocarcinoma screening field.10,11
An alternative screening methodology to radiography, which offers non-invasive and cost-effective methods to assist disease detection, is the utilization of metabolomic markers in sputum.12 Sputum is completely noninvasive to collect, a simple and cost-effective method to obtain samples.13 The best specimen for lung environment is the sputum and bronchoalveolar lavage fluid (BALF).14 With sputum specimens it is possible to isolate cells with the same peculiarities of the lung environment and to analyze their molecular characteristics.15 The number of normal alveolar epithelial cells in sputum was significantly higher than that of lung cancer cells. This is crucial especially for small tumors, or for tumors in early stage. Sputum contains thousands of compounds including fatty acid amide, cytoglobin,16 palmitoleic acid, putrescine, phosphatidylcholines,17,18 and diethyl glutamate cysteamine,12 etc. Developments in ambient mass spectrometry (AMS)19–22 examinations are now able to identify extremely small metabolites alterations from sputum, typical highly viscous bio-sample, using neutral desorption extractive electrospray ionization mass spectrometry (ND-EESI-MS) without multi-step sample pretreatment.18 In our previous study of ND-EESI-MS, an AMS metabolic profiling approach was used for the identification of candidate NSCLC metabolic markers. Altered phosphatidylcholines in sputum were shown to be effective for the detection of NSCLC.17 Changes in cellular metabolism in cancerous tissues are important features of cancer development.23 It is expected that a deeper understanding of the different metabolite pattern between lung adenocarcinoma patients and normal control might be helpful to unravel the complex molecular interactions in sputum analysis and lung adenocarcinoma early diagnosis. The present work explores a combination of ND-EESI-MS and plasma samples. Partial least squares-discriminant analysis (PLS-DA) for the detection of sputum metabolites from lung adenocarcinoma and healthy samples, resulting in the detection of 19 altered metabolites that are reflective of 20 metabolic pathways of potential biological relevance.
Patients and Methods
Reagents
Methanol (analytical reagent grade) and acetic acid (AcOH) were purchased from Tedia Company Inc. (Fairfield, OH, USA). The deionized water was homemade.
Clinical Samples
This study was approved by the Medical Ethics Committee of the Institutional Review Board of the Second Affiliated Hospital to Nanchang University, Nanchang, P. R. China. Written informed consent was obtained from all the patients in this study. All clinical investigations were conducted according to the principles expressed in the Declaration of Helsinki. After overnight fasting, spontaneous sputum samples were collected in one canister at the thoracic department of the Second Affiliated Hospital of Nanchang University from Jan. 2016 to Dec. 2018. Under the sample collection criteria, a total 143 sputum samples were included in the study (Supplemental Scheme S1). Lung adenocarcinoma (LAC) sputum samples (n=76) were collected form patients who were diagnosed with LAC by pathology. Control group (Con) sputum sample consisted of benign disease (Ben) and healthy people (Hea). Benign disease (Ben, n=28) sputum samples were collected form patients who were diagnosed with lung benign tumor or disease by pathology after surgery, normal people (Nor, n=39) sputum samples were collected from people with no evidence of disease. The controls were age-matched with LAC patients (see Table 1 for full clinical and demographic characteristics of study participants). Patients in stages I and II were regarded as early-stage LAC (ELAC) and those in stages III to IV regarded as late-stage LAC (LLAC) 5. The benign disease control (Ben) group consisted of 12 bronchiectasis, 9 lung hamartoma and 7 inflammatory myofibroblastic tumor (IMT). None of these patients had any type of previous cancer. All sputum samples were frozen and stored at −80°C until sample processing.
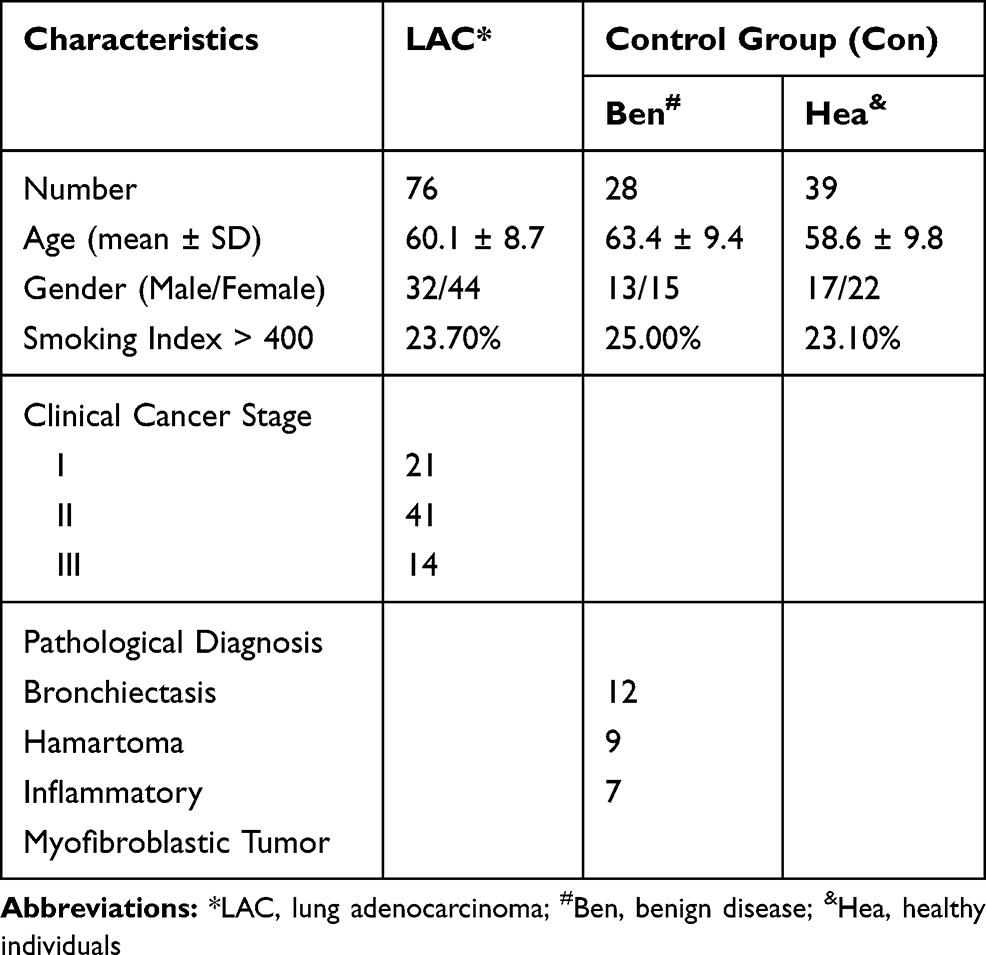 |
Table 1 Characteristics of Study Participants |
Sample Preparation
The sample preparation protocol was modeled after previous studies.17,18 Sputum samples, stored at −80°C, were first thawed at 4°C overnight prior to MS analysis. After samples were vortexed for 5 s, a 1 mL aliquot of sputum was set to a sealed glass vial (Figure S1) without any other pretreatment.17 A pooled sample, which was a mixture of sputum from all lung adenocarcinoma (LAC) patients, benign disease (Ben) patients and healthy controls (Con), was extracted using the same procedure as previously described. This sample was used for quality control (QC) purposes and was analyzed once every 10 study samples for NS-EESI-MS analysis.18
ND-EESI and Mass Spectrometry Conditions
The ND apparatus and the EESI ion source (Figure S1) were developed by Jiangxi Key Laboratory for Mass Spectrometry and Instrumentation as we published before.17,18,24 The ionizing solvent (mixture of methanol/water/acetic acid, 50:48:2, v/v/v) was pumped at a speed of 5 μL·min−1, ionized by a high voltage of +3.5 kV, and subsequently atomized by a N2 gas flow at the pressure of 1.2–1.6 MPa. The N2/methanol/acetic acid gas flow, as a neutral desorption airflow, was made by a N2 gas flow (pressure: 0.4–0.6 MPa) driven into the desorption liquid (methanol and acetic acid, 99:1, v/v). Next, the neutral desorption airflow was used to bring the analytes in the sputum into the ionization region, which were charged when it mixed with the high voltage ionizing solvent.
Non-targeted metabolomics experiments were performed using ND-EESI ion source coupled with LTQ-XL mass spectrometer (Thermo Fisher Scientific, San Jose, CA, USA), which was set to work in both positive ion detection mode (Figure S1). Briefly, capillary temperature was set to 150°C, capillary voltage was 35 V, and the tube lens voltage was 100 V. The m/z scan range was 50–500. Mass spectra were recorded by measuring each sample for 60 seconds at a time and repeated five times. For collision induced dissociation (CID) conditions, a maximum injection time of 100ms was used to the MS/MS spectrum for ion detection, the ion selection operation width was 1 Da and the normalized collision energy was 13%–21%. Other parameters were set as the default values of the instrument without any further artificial optimization.24,25
Data Processing and Statistical Analysis
The relative abundance data of the mass spectrometry fingerprints of the sputum samples recorded by ND-EESI-MS were derived, and the data was organized into one sample per row, and each column represents a mass-to-charge ratio (m/z) value. The student’s t-tests were used to compare the relative abundance levels between LAC patients and healthy controls with α set to 0.05. SIMCA-13.0 software (Umetrics, Umeå, Sweden) was used to construct diagnostic model. Before partial least squares-discriminant analysis (PLS-DA) and orthogonal PLS-DA (OPLS-DA) was performed, ND-EESI-MS data was log10-transformed and Pareto scaled. Both a 200-iteration permutation test for internal validation and a 50% testing set for external validation were performed to model validation. R2 and Q2 were used to indicate the explanatory and predictive capacity of the model, respectively. The differential metabolites were obtained based on variable importance in projection values (VIP > 1) taken from the PLS-DA model and significant q-values (q < 0.05). Area under the receiver-operating characteristic curve (AUROC) was then calculated to evaluate the classification performance of the PLS-DA model.26 These statistical analyses were performed using SPSS 20 (IBM Corporation, Armonk, NY, USA). Biomarker and pathway analyses were performed and visualized using the MetaboAnalyst 4.0 software package.26,27 Features were identified by matching the experimental accurate mass and tandem mass spectrum (MS/MS) with those shown in metabolomic databases (HMDB and METLIN), and then confirmed with commercial standards when available.18,25
Results
Metabolic Profiles of Lung Adenocarcinoma Patients versus Controls
A total of 76 LAC patients and 67 controls were included in the study. Sputum samples were analyzed by ND-EESI-MS directly with the mass range from m/z 50 to 500. There were more than 200 spectra relative abundance information shown in Figure 1, the MS fingerprint of lung adenocarcinoma (LAC) sputum were characterized by m/z 116.93, m/z 131.07, m/z 321.29, etc., whereas in control (Con) sputum the MS fingerprint were characterized by m/z 145.18, m/z 318.29, m/z 394.29 etc. According to Student’s t-test, 19 peaks were shown to have statistically significant difference between lung adenocarcinoma (LAC) and control group (Con), (p < 0.05). Upon collision-induced dissociation (CID) experiment,18,25 19 metabolites, such as hydroxyphenyllactic acid (m/z 181.07), phytosphingosine (m/z 318.29) and n-nonanoylglycine (m/z 214.15), were selected as potential sputum lung adenocarcinoma biomarker candidates. Since the control group (Con) sputum samples were obtained from two distinct group, benign disease (Ben) and healthy people (Hea), we compared the relative abundance levels between the two sets of control samples via t-tests and PLS-DA analysis. There was no statistically significant difference in ND-EESI-MS signal between benign disease (Ben) and healthy people (Hea) sputum samples (Supplemental Table S1, Figure S2). As can be seen in supplemental Figure S3 A–C, no separation trend was observed in the initial PLS-DA score plot of LAC versus Ben and Hea, where as no separation trend could be observed in the score plot of Ben and Hea. To validate the reliability of the PLS-DA model, a permutation test (n = 200) was conducted (Supplemental Figure S3 D–F). It is easy to note that the benign disease (Ben) and healthy people (Hea) have the same efficiency in distinguishing LAC from Control. Therefore, sputum from benign disease (Ben) and healthy people (Hea) were defined as one group, control group (Con) for following analysis. AUC, FDR q-values, fold changes (BC/Con) and VIP values for each metabolite were calculated, shown in Figure 2 and full differential details are given in Table 1. As AUC values show in Table 2 and supplemental Figure S5, no single metabolite proved to be sufficiently powerful to distinguish LAC patients from Con (AUC = 0.63–0.80). Out of these 19 metabolites, 8 had VIP > 1 (0.52–1.74, average = 0.97). Compared to controls, alternatively, 11 metabolites in LAC patients were significantly higher than in controls (FC = 1.20–2.07), 8 metabolites were decreased in LAC patients (FC = 0.55–0.79). As shown in Supplemental Table S2, when comparing staged cancer patients and controls, 17 metabolites were observed to be statistically significant (p < 0.05) between stage I and control samples, while 18 metabolites/features showed significance (p < 0.05) between stage II and controls. Of the 19 metabolites found to have a statistically significant difference (p < 0.05) between EBC and Con, 16 metabolites were found to be mutually significant in both stage I/control and stage II/control comparisons. Additionally, 9 metabolites were observed to be significantly different between stage III and controls (Supplemental Table S2). When comparing smoking index of patients and controls (Supplemental Table S3), 14 metabolites were observed to be statistically significant (p < 0.05) between smoking index > 400 LAC patients and smoking index > 400 control samples, it is easy to find these metabolites contribute very well with different smoking stage (Supplemental Table S3).
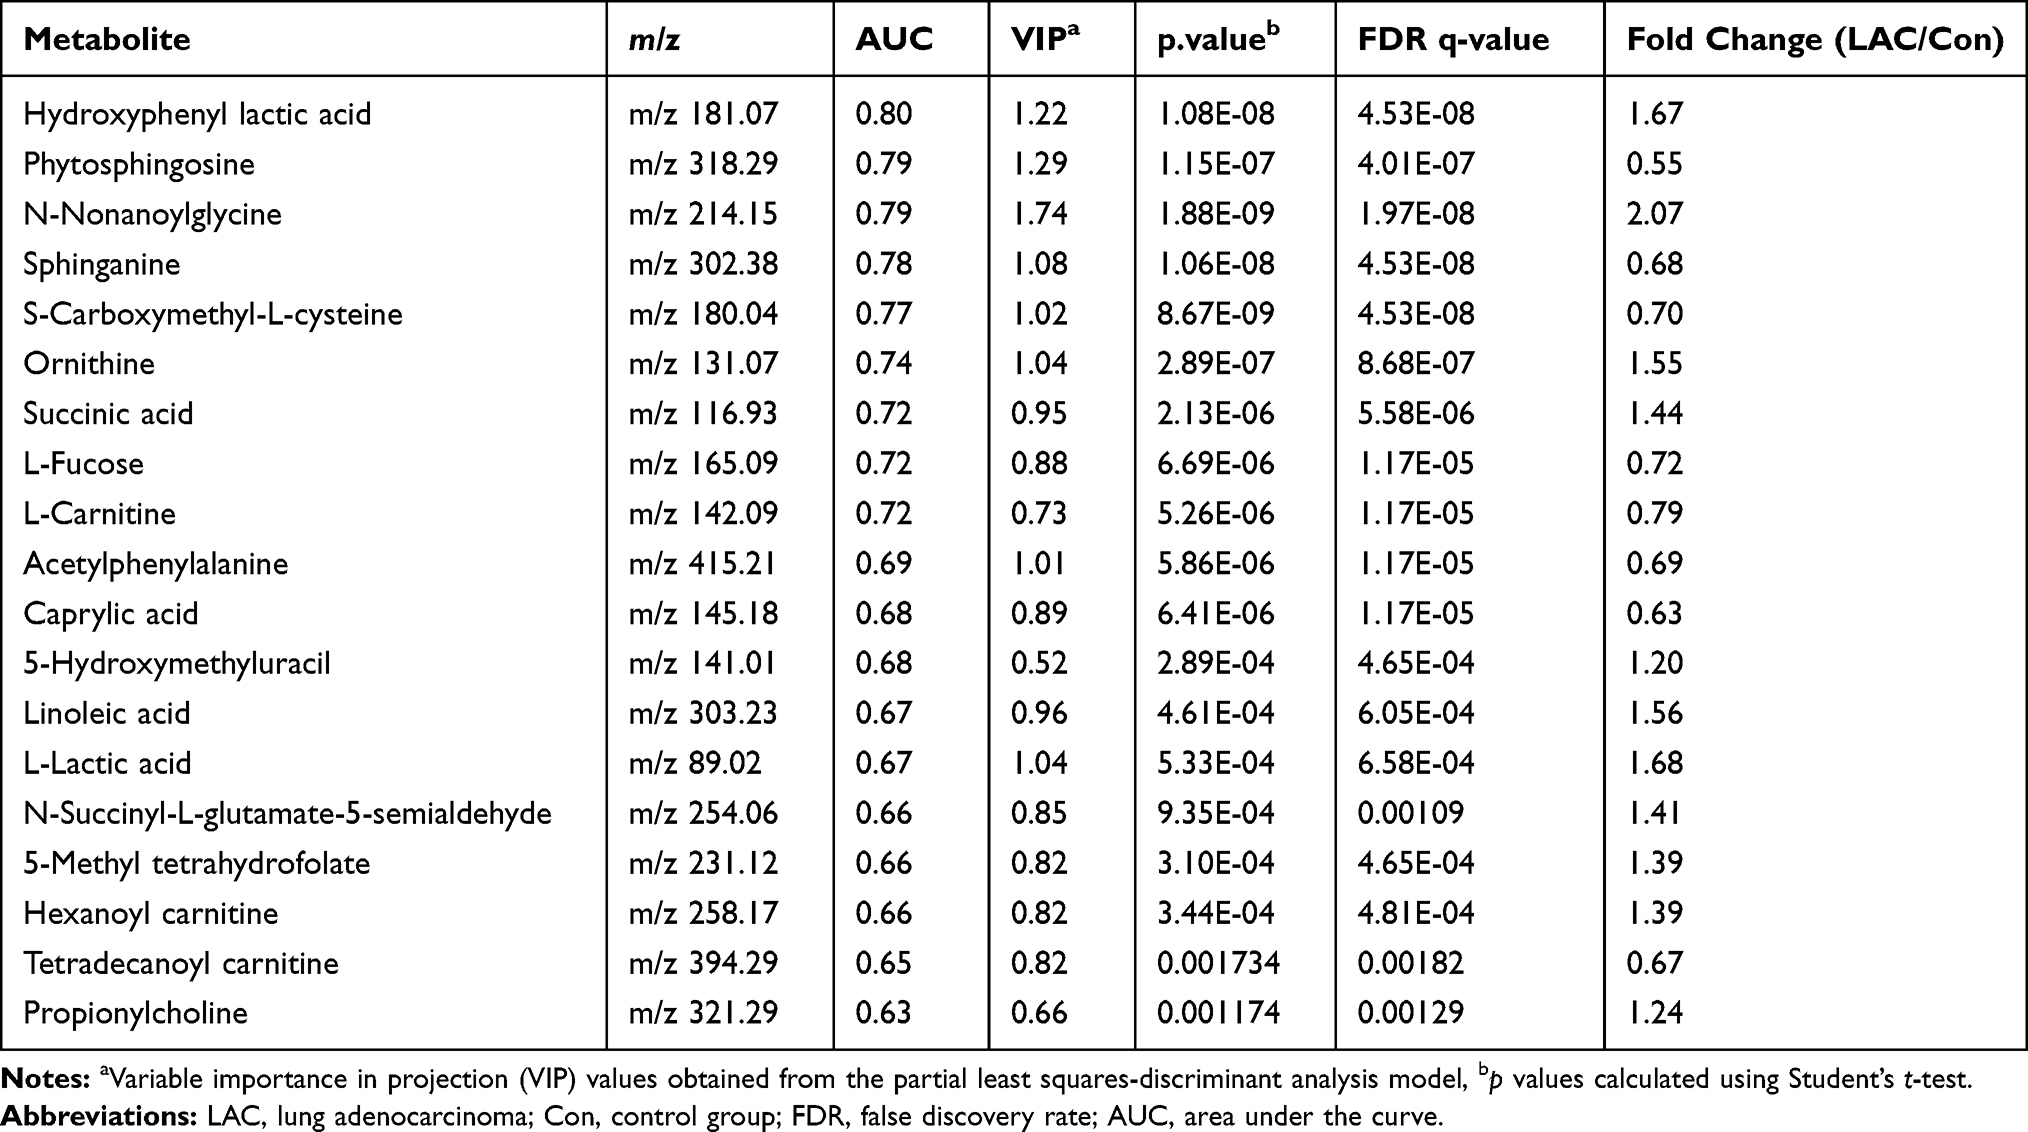 |
Table 2 Significant Metabolites Detected by ND-EESI-MS |
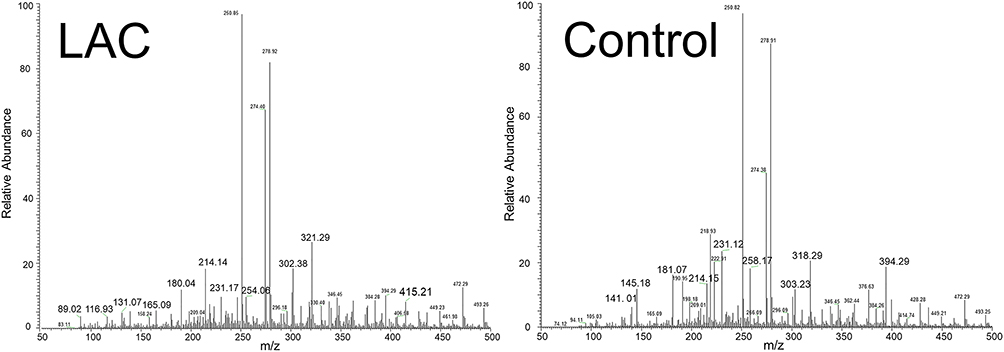 |
Figure 1 Typical ND-EESI-MS spectra in positive mode of human sputum samples of a lung adenocarcinoma (LAC) patient and a control group. |
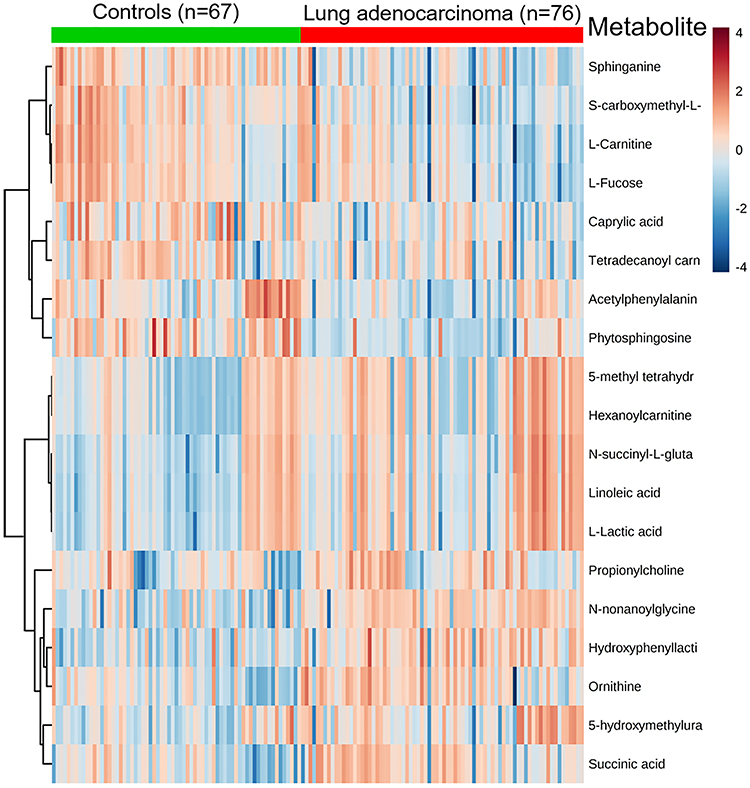 |
Figure 2 Heat map of significantly changed metabolites detected by ND-EESI-MS for comparison of LAC/Con. |
Biomarker Selection and Evaluation of Classification Performance of Lung Adenocarcinoma
An initial PLS-DA model was established using relative abundance levels of the 19 comparative metabolites to further reduce the number of candidate biomarkers for discrimination between LAC patients and controls. As PLS-DA score plot (Supplemental Figure S4 A, B) and permutation test (n = 200, Supplemental Figure S4 D, E) show, in the initial PLS-DA score plot, a separation trend was observed of controls versus early and late stages of LAC, in which goodness of fit and predictability was assessed via cumulative R2 and Q2 values. It is easy to see that the 19-metabolite biomarker panel have same efficiency in distinguishing ELAC and LLAC from Con. However, these metabolites have no contribution in distinguishing ELAC from LLAC (Supplemental Figure S4 C, F, Table S2).
According to AUC values obtained from univariate ROC analysis (Table 2, Supplemental Figure S5) of the 19 comparative metabolites, 5 highly predictive metabolites [Hydroxyphenyllactic acid, Phytosphingosine, N-nonanoylglycine, Sphinganine, S-carboxymethyl-L-cysteine, Figure 3A] were retained for further analysis of LAC diagnosis (AUC > 0.75 and VIP >1). An OPLS-DA model was established using levels of these 5 metabolites. As can be seen, the resulting OPLS-DA model (Figure 3B) proved to be powerful in distinguishing LAC patients from controls, with an AUROC of 0.917 (95% CI: 0.861–0.965, sensitivity: 0.9, specificity: 0.8, Figure 3C). With 50% sample holdout, ROC curve-based model evaluation showed a cross-validation classification accuracy of 87.9% using a PLS-DA classifier (Figure 3D).
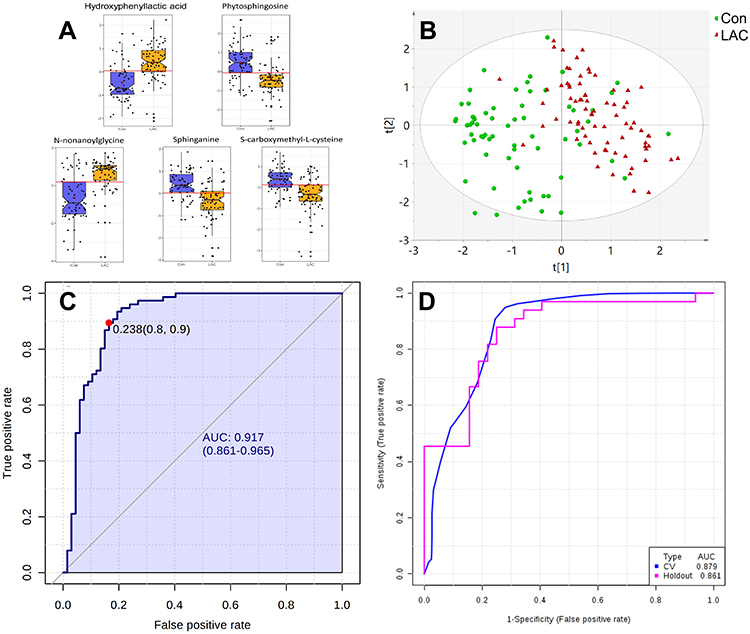 |
Figure 3 Differential characteristics of enhanced biomarker panel with 5 differential metabolites (AUC > 0.75 and VIP > 1) detected by ND-EESI-MS for distinguishing between lung adenocarcinoma patients (LAC, n = 76) and controls (Con, n = 67). (A) Log10- transformed relative abundance of 5 differential metabolites for comparison between LAC and Con. (B) QC normalized relative abundance data were log10-transformed and Pareto scaled. Score plot of the OPLS-DA model for discrimination between LAC and Con. [R2X (cum)= 0.301, R2Y (cum)= 0.228, Q2 (cum)= 0.494]. (C) QC normalized relative abundance data were log10-transformed and Pareto scaled. ROC curve illustrating the classification performance of the 5-metabolite OPLS-DA model for distinguishing between LAC and Con. [AUROC = 0.917, 95% CI: 0.861–0.965, sensitivity: 0.9, specificity: 0.8]. (D) QC normalized relative abundance data were log10-transformed and Pareto scaled. External validation of OPLS-DA model with 50% sample holdout: cross-validation classification accuracy of 87.9% using a PLS-DA classifier. |
Altered Metabolites in LAC and Their Associated Metabolic Pathways
Enrichment and pathway analyses were performed to understand the possible interconnection among detected sputum metabolites (Figure 4, Supplemental Figure S6). Based on the data of 19 metabolites detected by ND-EESI-MS in sputum, 20 metabolic routes were altered in LAC, which are shown in Figure 4A and listed in Supplemental Table S4. Perturbations including sphingolipid metabolism, fatty acid metabolism, carnitine synthesis and Warburg effect were the most significant as indicated by the corresponding p and impact values. A summary characters of the metabolic pathways interconnection related to altered metabolites in sputum of LAC patients detected by ND-EESI-MS is shown in Figure 4B. Based on results of our pathway analyses, it was not difficult to find that metabolic changes of LAC are mainly related to sphingolipid metabolism, fatty acid metabolism, carnitine synthesis and Warburg effect, etc. Altered levels of metabolites associated with metabolic pathways involved in BC pathogenesis are given in Table 2 and supplemental Table S4. In regard to sphingolipid metabolism, changes in sphinganine (down), phytosphingosine (down) were shown LAC sputum samples. Changes in tyrosine metabolism, arginine and proline metabolism were related to changes in hydroxyphenyl lactic acid (up), succinic acid (up), and ornithine (up).
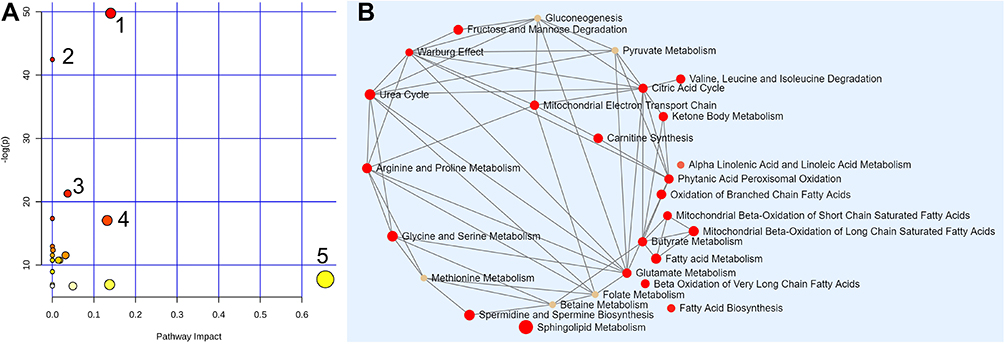 |
Figure 4 The metabolome view of pathway enrichment analysis comparing LAC patients and controls. (A) Overview of the most important metabolomic changes observed by ND-EESI-MS in sputum of lung adenocarcinoma patients, 1: Sphingolipid metabolism, 2: Tyrosine metabolism, 3: Ubiquinone and other terpenoid-quinone biosynthesis, 4: Arginine and proline metabolism, 5: Linoleic acid metabolism. (B) Metabolic network showing significant differences in sphingolipid metabolism, fatty acid metabolism, carnitine synthesis and Warburg effect, etc. |
Discussion
Over the course of the past 20 years, the increased use of low-dose spiral computed tomography (LDCT) screening has contributed to more frequent incidental detection of peripheral lung nodules.6,7 Nodules that are between 8 and 20 mm have an intermediate risk (6–64%) of pulmonary malignant tumor, while with nodules over 20 mm the risk of malignancy is significantly increased (64–82%).28 This result in a large number of screens detected pulmonary nodules need to be further evaluated to establish a definitive diagnosis.29,30 During the follow-up of patients with pulmonary nodules, people begin to put more attention to the overdiagnosis, enormous costs, and radiation risk of regular thoracic LDCT scans.6,7,30 Finding non-invasive adjuncts that improve the efficiency of lung cancer screening would be desirable.13,31–33
In many pulmonary diseases, sputum is a valuable sample material for use in disease characterization and diagnostics.34 Sputum analysis represents a promising area of research in early lung cancer diagnosis.35,36 Since sputum and the exhaled breath represent the most easily accessible biological samples characterized by a non-invasive collection, they are ideal early detection samples for the diagnosis of pulmonary diseases, because they can directly reflect metabolism variations of the bronchial tree.29,37 Compare with the volatile organic compounds (VOCs) in the exhaled breath,38,39 sputum containing exfoliated cells from the bronchial tree, can intuitively reflect the changes of lung metabolites,12,40 is an more effective noninvasive diagnostic sample.13 The standard sputum cytology has the best specificity, a low sensitivity for limitation of its application in lung cancer diagnosis.37,41,42 Newer sophisticated methods have been applied, such as metabolite analysis,16 fluorescence in situ hybridization (FISH),29 DNA promoter hypermethylation,40 small non-coding RNA (snoRNA) biomarkers43 and automated 3-dimensional cell scanners,36 in order to increase the sensitivity. However, due to sputum’s high viscosity and uneven consistency (lumpiness), it is difficult to obtain reproducible/repeatable results during compound extraction and analysis. To solve the problem of high viscosity of sputum, these emerging sputum analysis methods often require complex sample pretreatment processes and long analysis periods, those time costing shortages limited the application of these methods in the early diagnosis of lung cancer.10,11
Mass-spectrometry-based metabolomics has gained great momentum for the detection of metabolic biomarkers of various pathologies in most malignant tumors23,44,45 including lung cancer.14,46,47 Ambient ionization mass spectrometry was developed as a sample preparation-free alternative to traditional MS-based workflows.48 Ambient ionization mass spectrometry is a collective term describing all mass spectrometric ionization methods that can ionize constituents of natural samples under ambient conditions.19 The characteristics without any chemical modification before sample analysis giving outstanding significance to AMS methods in various fields such as pharmaceuticals,49 food, environment, public safety, clinic diagnosis and cancer research.50 In addition, hundreds of ionization techniques have been developed in the world for different analytical objects and purposes. Furthermore, through years of research, domestic ambient ionization techniques have proved to be theoretically mature and practically valuable.19,51 To date, domestic ambient ionization techniques, represented by DESI,52 EESI,24,25 and ND-EESI,18 have implemented the advantages of AMS based methods for the detection of various samples used for different cancer research purposes. With the competence of withstanding different complex matrix and ambient ionization under atmospheric pressure, ND-EESI-MS have been employed in various high viscosity samples, such as toothpaste products,53 sunscreen agents,54 honey,22 and biological specimens including human skin20,55 and plants.21 ND-EESI-MS allows real-time, online chemical profiling of highly viscous samples under ambient conditions.56
Based on the above characteristics, MS has remarkable value in lung cancer screening and early diagnosis research. In a report of Schoeman,34 four sputum pre-extraction preparation methods were applied, human Mycobacterium tuberculosis sputum was identified by characters of gas chromatography time of flight mass spectrometry (GCxGC-TOFMS) metabolomics. Flow infusion electrospray ion mass spectrometry (FIE-MS) paired with gas-chromatography mass spectrometry (GC-MS) have been used in the detection of metabolites in 23 lung cancer patients and 33 healthy controls sputum was reported by Cameron.12 The conclusion of Cameron further demonstrated that sputum, as a non-invasive source of metabolite biomarkers, may aid in the development of a high-risk population screening programme for lung cancer. As to the lung cancer sputum samples came from 16 NSCLC patients with 6 SCLC patients of different clinical stages, and the shortage of intricate pre-extraction preparation process limited this result applicate to the diagnosis of lung cancer. In our previous studies, a non-targeted ND-EESI-MS metabolic profiling approach was used for the identification of candidate NSCLC metabolic markers in human sputum.17,18 Altered metabolites, such as glucose, amino acids and phosphoric lipids were shown to be effective for the detection of NSCLC.18 These results showed that phosphatidylglycerol and phosphatidylglycerol phosphate were potential metabolite biomarkers for NSCLC diagnosis.17 Our previous studies suggest that ND–EESI-MS application has a good prospect of sputum analysis for non-invasive lung cancer detection efficiency.
To further comprehensive metabolomic understanding about the diagnosis of lung adenocarcinoma and sputum analysis. In the current study, the application of ND-EESI-MS was implemented in sputum samples from lung adenocarcinoma (76 cases) and control (67 cases), allowing for the detection of 19 altered metabolite.57,58 The reason of no statistically significant difference was found between benign disease and healthy people sputum samples in this study may be the desorption principle of sputum samples by ND-EESI is different from previous sputum pretreatment methods. According to the area under the receiver operator characteristic (ROC) curves, we assessed the biomarker specificity and sensitivity, suggesting that hydroxyphenyllactic acid, phytosphingosine, n-nonanoylglycine, etc. were potential sensitive and specific biomarkers for BC diagnosis with a maximum AUC of about 0.8. When the top 5 (AUC > 0.75) significant metabolic biomarkers were combined, the AUC value can reach 0.917, the predictive accuracy for EBC is 0.879. These potential metabolite biomarkers were identified for LAC in human sputum, verifying the good application prospect of ND-EESI-MS analysis-based method for non-invasive lung cancer detection.
The efficacy of metabolic biomarker studies strongly depends on the reliability and number of differential metabolites detected. Unlike normal differentiated cells, which primarily rely on mitochondrial oxidative phosphorylation to generate the energy for cellular processes, most cancer cells instead rely on aerobic glycolysis,59,60 this phenomenon was termed as “the Warburg effect.” Recent advances have shown an increasing attention to changes in metabolic pathways related to the development of malignant tumors.23 By joining the results of ND-EESI-MS and pathway analyses, this study was able to discover altered metabolic pathways associated with LAC, including sphingolipid metabolism, fatty acid metabolism, carnitine synthesis and Warburg effect. The fatty acids and amino acids metabolomics changes were not only detected in the lung cancer patients, but also found in a variety of different cancer cells from previous studies.59,61 A strong relationship between glutamine metabolism and drug-resistance has been reported in lung cancer cells.62 This may be a consequence of both malnutrition in patients suffering from cancer as well as a result of their tumor-bearing state and the increase of amino acid demand caused by tumor growth.63 However, the detection of altered metabolites, metabolic pathways with different methods is not identical.12 In a study by Callejón,14 the dysregulation of 42 altered metabolites were found in the bronchoalveolar lavage fluid (BALF) of lung cancer patients by mass spectrometry. Their results showed that glycerol and phosphoric acid were potential sensitive and specific biomarkers for lung cancer diagnosis and prognosis. According to both of the BALF and sputum coming from bronchial mucous membrane, these findings suggest that samples from bronchial tree has a good prospect of lung cancer detection. Previous studies have indicated that altered metabolomics, such as putrescine ganglioside, diethyl glutarate in sputum detected by gas-chromatography mass spectrometry (GC–MS), can be used as non-invasive source of metabolite biomarkers of lung cancer screening.12 Our study not only contributes to the biomarker finding of lung cancer, in addition, given the results of our pathway analyses, we can be reasonably confident that sputum metabolic changes were a local manifestation of the Warburg effect in lung adenocarcinoma.
Conclusion
Our investigation reinforces the significance of sputum metabolic signatures for non-invasive lung adenocarcinoma detection. The ND-EESI-MS identified metabolites that could be recommended as a multi-metabolite biomarker model for lung adenocarcinoma diagnosis. Combination of ambient mass spectrometry (AMS) metabolic profiling techniques and pathway analyses provides a more efficient strategy for establishing a disease biomarker panel for lung adenocarcinoma.
Acknowledgments
We thank Dr Wang Yiming, Peng Jinhua, Jiang Han, Zhang Xiaoqiang (Department of Cardiothoracic Surgery, Second Affiliated Hospital of Nanchang University) for providing patient data. We also thank Dr Wu Liqing (Department of Pathology, Second Affiliated Hospital of Nanchang University) for providing pathological data. We also thank the patients. Grants from the National Natural Science Foundation of China (81560345 and 81860379), Preeminence Youth Fund of Jiangxi Province (20162BCB23058), China Postdoctoral Science Foundation Grant (2017M 610401), and Science and Technology Planning Project at the Department of Science and Technology of Jiangxi Province, China (20151BBG70165 and 20171BAB205075) supported this work.
Disclosure
The authors report no conflicts of interest in this work.
References
1. Siegel RL, Miller KD, Jemal A. Cancer statistics. CA Cancer J Clin. 2019;69(1):7–34. doi:10.3322/caac.21551
2. Ferlay J, Soerjomataram I, Dikshit R, et al. Cancer incidence and mortality worldwide: sources, methods and major patterns in GLOBOCAN 2012. Int J Cancer. 2015;136(5):E359–386. doi:10.1002/ijc.29210
3. Chen W, Zheng R, Baade PD, et al. Cancer statistics in China, 2015. CA Cancer J Clin. 2016;66(2):115–132. doi:10.3322/caac.21338
4. Goldstraw P, Chansky K, Crowley J, et al. The IASLC lung cancer staging project: proposals for revision of the tnm stage groupings in the forthcoming (eighth) edition of the tnm classification for lung cancer. J Thoracic Oncol. 2016;11(1):39–51. doi:10.1016/j.jtho.2015.09.009
5. Detterbeck FC, Boffa DJ, Kim AW, Tanoue LT. The eighth edition lung cancer stage classification. Chest. 2017;151(1):193–203. doi:10.1016/j.chest.2016.10.010
6. Martinez Perez E, de Aguiar Quevedo K, Arraras Martinez M, et al. Lung cancer screening: use of low-dose computed tomography. Arch Bronconeumol. 2019;55:526–531. doi:10.1016/j.arbr.2019.08.001
7. Shen H. Low-dose CT for lung cancer screening: opportunities and challenges. Front Med. 2018;12(1):116–121. doi:10.1007/s11684-017-0600-1
8. Infante M, Cavuto S, Lutman FR, et al. Long-term follow-up results of the dante trial, a randomized study of lung cancer screening with spiral computed tomography. Am J Respir Crit Care Med. 2015;191(10):1166–1175.
9. Wille MM, Dirksen A, Ashraf H, et al. Results of the randomized danish lung cancer screening trial with focus on high-risk profiling. Am J Respir Crit Care Med. 2016;193(5):542–551. doi:10.1164/rccm.201505-1040OC
10. Copeland A, Criswell A, Ciupek A, King JC. Effectiveness of lung cancer screening implementation in the community setting in the United States. J Oncol Practice. 2019;Jop1800788.
11. Chalian H, Khoshpouri P, Iranmanesh AM, Mammarappallil JG, Assari S. Lung cancer screening patient-provider discussion: where do we stand and what are the associated factors? SAGE Open Med. 2019;7:2050312119854265. doi:10.1177/2050312119854265
12. Cameron SJ, Lewis KE, Beckmann M, et al. The metabolomic detection of lung cancer biomarkers in sputum. Lung Cancer. 2016;94:88–95. doi:10.1016/j.lungcan.2016.02.006
13. D’Urso V, Doneddu V, Marchesi I, et al. Sputum analysis: non-invasive early lung cancer detection. J Cell Physiol. 2013;228(5):945–951. doi:10.1002/jcp.24263
14. Callejon-Leblic B, Garcia-Barrera T, Gravalos-Guzman J, Pereira-Vega A, Gomez-Ariza JL. Metabolic profiling of potential lung cancer biomarkers using bronchoalveolar lavage fluid and the integrated direct infusion/gas chromatography mass spectrometry platform. J Proteomics. 2016;145:197–206. doi:10.1016/j.jprot.2016.05.030
15. Endo C, Nakashima R, Taguchi A, et al. Inter-rater agreement of sputum cytology for lung cancer screening in Japan. Diagn Cytopathol. 2015;43(7):545–550. doi:10.1002/dc.23253
16. Hubers AJ, van der Drift MA, Prinsen CF, et al. Methylation analysis in spontaneous sputum for lung cancer diagnosis. Lung Cancer. 2014;84(2):127–133. doi:10.1016/j.lungcan.2014.01.019
17. Zhang J, Xu J, Lu H, et al. Altered phosphatidylcholines expression in sputum for diagnosis of non-small cell lung cancer. Oncotarget. 2016;7(39):63158–63165. doi:10.18632/oncotarget.11283
18. Gao XF, Xiao Y, Dai Y. Direct analysis of human sputum for differentiating non-small cell lung cancer by neutral desorption extractive electrospray ionization mass spectrometry. Analytical Sci. 2018;34(9):1067–1071. doi:10.2116/analsci.18P008
19. Cooks RG, Ouyang Z, Takats Z, Wiseman JM. Detection Technologies. Ambient mass spectrometry. Science. 2006;311(5767):1566–1570. doi:10.1126/science.1119426
20. Chen H, Yang S, Wortmann A, Zenobi R. Neutral desorption sampling of living objects for rapid analysis by extractive electrospray ionization mass spectrometry. Angewandte Chemie. 2007;46(40):7591–7594. doi:10.1002/anie.200702200
21. Chen H, Zenobi R. Neutral desorption sampling of biological surfaces for rapid chemical characterization by extractive electrospray ionization mass spectrometry. Nat Protoc. 2008;3(9):1467–1475. doi:10.1038/nprot.2008.109
22. Huang XY, Fang XW, Zhang X, et al. Direct detection of chloramphenicol in honey by neutral desorption-extractive electrospray ionization mass spectrometry. Anal Bioanal Chem. 2014;406(29):7705–7714. doi:10.1007/s00216-014-8176-y
23. Kaushik AK, DeBerardinis RJ. Applications of metabolomics to study cancer metabolism. Biochim Biophys Acta. 2018;1870(1):2–14.
24. Zhang H, Gu H, Yan F, et al. Direct characterization of bulk samples by internal extractive electrospray ionization mass spectrometry. Sci Rep. 2013;3:2495. doi:10.1038/srep02495
25. Wei Y, Chen L, Zhou W, et al. Tissue spray ionization mass spectrometry for rapid recognition of human lung squamous cell carcinoma. Sci Rep. 2015;5:10077. doi:10.1038/srep10077
26. Chong J, Soufan O, Li C, et al. MetaboAnalyst 4.0: towards more transparent and integrative metabolomics analysis. Nucleic Acids Res. 2018;46(W1):W486–w494. doi:10.1093/nar/gky310
27. Jasbi P, Wang D, Cheng SL, et al. Breast cancer detection using targeted plasma metabolomics. J Chromatogr B Analyt Technol Biomed Life Sci. 2019;1105:26–37. doi:10.1016/j.jchromb.2018.11.029
28. Wahidi MM, Govert JA, Goudar RK, Gould MK, McCrory DC. Evidence for the treatment of patients with pulmonary nodules: when is it lung cancer?: ACCP evidence-based clinical practice guidelines. Chest. 2007;132(3 Suppl):94s–107s. doi:10.1378/chest.07-1352
29. Shlomi D, Peled N, Schwarz YA, et al. Non-invasive early detection of malignant pulmonary nodules by FISH-based sputum test. Cancer Genet. 2018;226–227:1–10. doi:10.1016/j.cancergen.2018.04.118
30. MacMahon H, Naidich DP, Goo JM, et al. Guidelines for management of incidental pulmonary nodules detected on ct images: from the fleischner society 2017. Radiology. 2017;284(1):228–243. doi:10.1148/radiol.2017161659
31. Saalberg Y, Wolff M. VOC breath biomarkers in lung cancer. Clinica Chimica Acta. 2016;459:5–9. doi:10.1016/j.cca.2016.05.013
32. Prabhakar B, Shende P, Augustine S. Current trends and emerging diagnostic techniques for lung cancer. Biomed Pharmacother. 2018;106:1586–1599. doi:10.1016/j.biopha.2018.07.145
33. Behera B, Joshi R, Anil Vishnu GK, Bhalerao S, Pandya HJ. Electronic nose: a non-invasive technology for breath analysis of diabetes and lung cancer patients. J Breath Res. 2019;13(2):024001. doi:10.1088/1752-7163/aafc77
34. Schoeman JC, Du Preez I, Loots Du T. A comparison of four sputum pre-extraction preparation methods for identifying and characterising Mycobacterium tuberculosis using GCxGC-TOFMS metabolomics. J Microbiol Methods. 2012;91(2):301–311. doi:10.1016/j.mimet.2012.09.002
35. Hubers AJ, Heideman DA, Duin S, et al. DNA hypermethylation analysis in sputum of asymptomatic subjects at risk for lung cancer participating in the NELSON trial: argument for maximum screening interval of 2 years. J Clin Pathol. 2017;70(3):250–254. doi:10.1136/jclinpath-2016-203734
36. Wilbur DC, Meyer MG, Presley C, et al. Automated 3-dimensional morphologic analysis of sputum specimens for lung cancer detection: performance characteristics support use in lung cancer screening. Cancer Cytopathol. 2015;123(9):548–556. doi:10.1002/cncy.21565
37. Hubers AJ, Prinsen CF, Sozzi G, Witte BI, Thunnissen E. Molecular sputum analysis for the diagnosis of lung cancer. Br J Cancer. 2013;109(3):530–537. doi:10.1038/bjc.2013.393
38. Sethi S, Nanda R, Chakraborty T. Clinical application of volatile organic compound analysis for detecting infectious diseases. Clin Microbiol Rev. 2013;26(3):462–475. doi:10.1128/CMR.00020-13
39. Chan HP, Lewis C, Thomas PS. Exhaled breath analysis: novel approach for early detection of lung cancer. Lung Cancer. 2009;63(2):164–168. doi:10.1016/j.lungcan.2008.05.020
40. Hulbert A, Jusue-Torres I, Stark A, et al. Early detection of lung cancer using DNA promoter hypermethylation in plasma and sputum. Clin Cancer Res. 2017;23(8):1998–2005. doi:10.1158/1078-0432.CCR-16-1371
41. Gledhill A, Bates C, Henderson D, DaCosta P, Thomas G. Sputum cytology: a limited role. J Clin Pathol. 1997;50(7):566–568. doi:10.1136/jcp.50.7.566
42. Thunnissen FB. Sputum examination for early detection of lung cancer. J Clin Pathol. 2003;56(11):805–810. doi:10.1136/jcp.56.11.805
43. Su Y, Guarnera MA, Fang H, Jiang F. Small non-coding RNA biomarkers in sputum for lung cancer diagnosis. Mol Cancer. 2016;15(1):36. doi:10.1186/s12943-016-0520-8
44. Bandu R, Mok HJ, Kim KP. Phospholipids as cancer biomarkers: mass spectrometry-based analysis. Mass Spectrom Rev. 2018;37(2):107–138.
45. Chan EC, Koh PK, Mal M, et al. Metabolic profiling of human colorectal cancer using high-resolution magic angle spinning nuclear magnetic resonance (HR-MAS NMR) spectroscopy and gas chromatography mass spectrometry (GC/MS). J Proteome Res. 2009;8(1):352–361. doi:10.1021/pr8006232
46. Wu M, Xu Y, Fitch WL, et al. Liquid chromatography/mass spectrometry methods for measuring dipeptide abundance in non-small-cell lung cancer. Rapid Communications Mass Spectrometry. 2013;27(18):2091–2098. doi:10.1002/rcm.6656
47. Ying H, Kimmelman AC, Lyssiotis CA, et al. Oncogenic Kras maintains pancreatic tumors through regulation of anabolic glucose metabolism. Cell. 2012;149(3):656–670. doi:10.1016/j.cell.2012.01.058
48. Zhang X-L, Zhang H, Wang X-C, Huang -K-K, Wang D, Chen H-W. Advances in ambient ionization for mass spectrometry. Chinese J Analytical Chem. 2018;46(11):1703–1713. doi:10.1016/S1872-2040(18)61122-3
49. Clendinen CS, Monge ME, Fernandez FM. Ambient mass spectrometry in metabolomics. Analyst (Lond). 2017;142(17):3101–3117.
50. Takats Z, Strittmatter N, McKenzie JS. Ambient mass spectrometry in cancer research. Adv Cancer Res. 2017;134:231–256.
51. Weston DJ. Ambient ionization mass spectrometry: current understanding of mechanistic theory; analytical performance and application areas. Analyst. 2010;135(4):661–668.
52. Calligaris D, Caragacianu D, Liu X, et al. Application of desorption electrospray ionization mass spectrometry imaging in breast cancer margin analysis. Proc Natl Acad Sci U S A. 2014;111(42):15184–15189. doi:10.1073/pnas.1408129111
53. Ding J, Gu H, Yang S, Li M, Li J, Chen H. Selective detection of diethylene glycol in toothpaste products using neutral desorption reactive extractive electrospray ionization tandem mass spectrometry. Anal Chem. 2009;81(20):8632–8638. doi:10.1021/ac9013594
54. Zhang X, Liu Y, Zhang J, et al. Neutral desorption extractive electrospray ionization mass spectrometry for fast screening sunscreen agents in cream cosmetic products. Talanta. 2011;85(3):1665–1671. doi:10.1016/j.talanta.2011.06.070
55. Chen H, Hu B, Hu Y, Huan Y, Zhou Z, Qiao X. Neutral desorption using a sealed enclosure to sample explosives on human skin for rapid detection by EESI-MS. J Am Soc Mass Spectrom. 2009;20(4):719–722. doi:10.1016/j.jasms.2008.12.011
56. Li X, Hu B, Ding J, Chen H. Rapid characterization of complex viscous samples at molecular levels by neutral desorption extractive electrospray ionization mass spectrometry. Nat Protoc. 2011;6(7):1010–1025. doi:10.1038/nprot.2011.337
57. Baraniuk JN, Casado B, Pannell LK, et al. Protein networks in induced sputum from smokers and COPD patients. Int J Chron Obstruct Pulmon Dis. 2015;10:1957–1975. doi:10.2147/COPD.S75978
58. Casado B, Iadarola P, Pannell LK, et al. Protein expression in sputum of smokers and chronic obstructive pulmonary disease patients: a pilot study by CapLC-ESI-Q-TOF. J Proteome Res. 2007;6(12):4615–4623. doi:10.1021/pr070440q
59. Vander Heiden MG, Cantley LC, Thompson CB. Understanding the Warburg effect: the metabolic requirements of cell proliferation. Science. 2009;324(5930):1029–1033.
60. Liberti MV, Locasale JW. The Warburg Effect: how Does it Benefit Cancer Cells? Trends Biochem Sci. 2016;41(3):211–218. doi:10.1016/j.tibs.2015.12.001
61. Benjamin DI, Louie SM, Mulvihill MM, et al. Inositol phosphate recycling regulates glycolytic and lipid metabolism that drives cancer aggressiveness. ACS Chem Biol. 2014;9(6):1340–1350. doi:10.1021/cb5001907
62. Jiang ZF, Wang M, Xu JL, Ning YJ. Hypoxia promotes mitochondrial glutamine metabolism through HIF1alpha-GDH pathway in human lung cancer cells. Biochem Biophys Res Commun. 2017;483(1):32–38. doi:10.1016/j.bbrc.2017.01.015
63. Pavlova NN, Thompson CB. The emerging hallmarks of cancer metabolism. Cell Metab. 2016;23(1):27–47. doi:10.1016/j.cmet.2015.12.006
 © 2021 The Author(s). This work is published and licensed by Dove Medical Press Limited. The
full terms of this license are available at https://www.dovepress.com/terms
and incorporate the Creative Commons Attribution
- Non Commercial (unported, 3.0) License.
By accessing the work you hereby accept the Terms. Non-commercial uses of the work are permitted
without any further permission from Dove Medical Press Limited, provided the work is properly
attributed. For permission for commercial use of this work, please see paragraphs 4.2 and 5 of our Terms.
© 2021 The Author(s). This work is published and licensed by Dove Medical Press Limited. The
full terms of this license are available at https://www.dovepress.com/terms
and incorporate the Creative Commons Attribution
- Non Commercial (unported, 3.0) License.
By accessing the work you hereby accept the Terms. Non-commercial uses of the work are permitted
without any further permission from Dove Medical Press Limited, provided the work is properly
attributed. For permission for commercial use of this work, please see paragraphs 4.2 and 5 of our Terms.