Back to Journals » Diabetes, Metabolic Syndrome and Obesity » Volume 15
Neck Circumference is Associated with Metabolic Syndrome Components in Chinese Subjects with Type 2 Diabetes
Authors He Y, Chen J, Cao J, Hu Y, Li H, Lu J ![]()
Received 22 June 2022
Accepted for publication 29 August 2022
Published 8 September 2022 Volume 2022:15 Pages 2781—2787
DOI https://doi.org/10.2147/DMSO.S379221
Checked for plagiarism Yes
Review by Single anonymous peer review
Peer reviewer comments 3
Editor who approved publication: Prof. Dr. Jing Sun
Yifei He, Jin Chen, Jingzhu Cao, Yanyan Hu, Hui Li, Jin Lu
Department of Endocrinology, Changhai Hospital, Naval Medical University, Shanghai, 200433, People’s Republic of China
Correspondence: Jin Lu; Hui Li, Email [email protected]; [email protected]
Introduction: We aimed to investigate the correlation between neck circumference (NC) and metabolic syndrome (MetS) components in type 2 diabetes (T2DM) patients.
Methods: This cross-section study included 610 patients with T2DM, including 312 males and 298 females. Height, weight, body mass index (BMI), NC, waist circumference (WC), hip circumference, and blood pressure were measured. Serum glucose, lipid, and uric acid levels were examined. The correlation between NC and anthropometric parameters and metabolic disorders was analyzed. Receiver operating characteristic curve analysis was performed to determine the best NC cutoff value for predicting MetS.
Results: Either in male or female subjects, NC was positively correlated with BMI, WC, waist-to-hip ratio, systolic blood pressure, diastolic blood pressure, and serum triglyceride and uric acid levels and negatively correlated with serum HDL-C levels. NC is an independent influencing factor of female serum uric acid levels (standardized coefficient β = 0.141, t = 2.088, P = 0.038). NC of the MetS group was significantly larger than that of the non-MetS group (male 38.42± 3.05 cm vs 36.20± 2.90 cm, female 36.14± 2.75 cm vs 34.01± 2.94 cm, P < 0.001). The NC cutoff value for predicting MetS is 37.3 cm for males and 35.8cm for females. There was no difference between using cutoff points of NC and WC to recognize all MetS components in males and hyperuricemia in females (P> 0.05).
Conclusion: NC is closely related to BMI, WC, and MetS components in T2DM. The cutoff points of NC can identify all MetS components in males and hyperuricemia in females with the same efficiency as WC.
Keywords: type 2 diabetes, neck circumference, metabolic syndrome
Introduction
Metabolic syndrome (MetS) is a complex metabolic disorder syndrome, mainly manifested by central obesity, dyslipidemia, hypertension, hyperglycemia, and hyperuricemia. These are important risk factors for cardiovascular diseases in diabetic patients.1,2
Anthropometric indicators such as body mass index (BMI), waist circumference (WC), and waist-to-hip ratio (WHR) can be used for the diagnosis of MetS. BMI is a useful index of whole-body adiposity. WC is usually used to indicate the presence of central obesity and visceral fat,3 which is considered as a key component of MetS. However, the measurement of WC may be inconvenient and not accurate with heavy clothing. The measurement of WC may also be influenced by satiety and patient posture.
Neck circumference (NC) was first reported by Sjostrom et al in 19954 and seems more convenient for measuring than WC. As an index for upper-body fat distribution, NC is a reliable tool to screen obesity,5 and it has been reported to be positively associated with central obesity and overweight in a range of populations.6–8 Studies have shown that NC is correlated with other anthropometric parameters (eg, WC and BMI), and NC performed well as a tool to identify MetS.9,10 NC was also found to be related to MetS in diabetes.11 In a multicenter prospective study of Chinese type 2 diabetes (T2DM) patients, larger NC was associated with the occurrence of cardiovascular events after 8-year follow-up.12 However, whether NC is associated with single cardiometabolic risk factors correlated with MetS needs to be further studied. The aim of this study was to investigate the correlation between NC and components of MetS in patients with T2DM.
Research Design and Methods
Study Setting and Participants
This cross-section study comprised 610 patients with T2DM who were hospitalized in the Endocrinology Department of Shanghai Changhai Hospital, including 312 males and 298 females. Patients with definite diagnosis of T2DM (following WHO 1999 criteria) were included. Patients were excluded if they were in a stress state such as infection, surgery, malignant tumor, if they were pregnant or breastfeeding, or if they had a history of neck thyroid nodules or neck surgery. The study’s protocol was approved by the ethics committee of Shanghai Changhai Hospital.
The following criteria for diagnosing MetS were used.13 Patients who met at least three of the following five items were considered as MetS patients: ① abdominal obesity (WC ≥ 90 cm for males, ≥ 85 cm for females); ② hypertriglyceridemia (triglycerides [TG] ≥ 1.7 mM or having received treatment); ③ low high-density lipoprotein–cholesterol (HDL-C) (HDL-C < 1.04 mM or having received therapy); ④ high blood pressure (Bp) (systolic Bp [SBP] ≥ 130 mmHg, diastolic Bp [DBP] ≥ 85 mmHg, or having received corresponding treatment); and ⑤ hyperglycemia (fasting plasma glucose [FPG] ≥ 6.1 mM, PG ≥ 7.8 mM 2 h after glucose load, or having a history of T2DM).
Data Collection
The medical history of participants was collected. Physical examinations including body weight, height, NC, WC, hip circumference (HC), and Bp were conducted as described below. The patients stood upright and faced the researchers with their shoulders relaxed. NC was measured at the horizontal circumference of the neck through the lower border of the Adam’s apple, WC was measured at the midpoint of the line connecting the coastal border and the iliac spine after the patient exhaled calmly, and HC was measured at the greater trochanter. Bp was measured three times continuously after 10 min of rest, and the average value was taken. BMI was calculated as (weight [kg]/height2 [m2]) and WHR was calculated as (WC/HC).
Laboratory Assessments
Laboratory data were measured from blood, which was taken in the morning after an overnight fast of at least 10 h. Serum glucose and uric acid levels and the lipid profile, including total cholesterol (TC), TG, HDL-C, and LDL-C, were determined on a HITACHI 7600–120 automatic biochemical analyzer (Hitachi Co., Japan).
Statistical Analyses
All analyses were performed using SPSS 22.0 statistical software. Continuous variables are expressed as mean ± standard deviation (X±S), and the independent-samples t-test was used for comparison. Categorical variables are expressed as percentages, and χ2 analysis was used to compare differences between groups. Pearson’s correlation coefficient was used to evaluate the relationship between NC and MetS risks. Multiple linear regression was used to analyze the factors independently affected by NC. The best NC cutoff value to predict MetS was estimated by using Youden’s index and receiver operating characteristic (ROC) analyses. P<0.05 was used for statistical significance.
Results
This study included 610 participants: 312 males with a mean age of 58.45±13.23 years, a mean BMI of 23.84±3.23 kg/m2, and a mean WC of 90.14±11.19 cm and 298 females with a mean age of 62.66±12.06 years, a mean BMI of 24.79±4.13 kg/m2, and a mean WC of 90.96±12.88 cm, as shown in Table S1
Correlation Between NC and Anthropometric Parameters and MetS Components
As shown in Table 1, in both male and female subjects, NC was positively correlated with BMI, WC, and WHR. And NC is linearly related to WC in both male and female subjects, as shown in Figure S1. As shown in Table 2, NC was positively correlated with SBP, DBP, serum TG, and uric acid levels in both males and females and negatively correlated with serum HDL-C levels in both males and females.
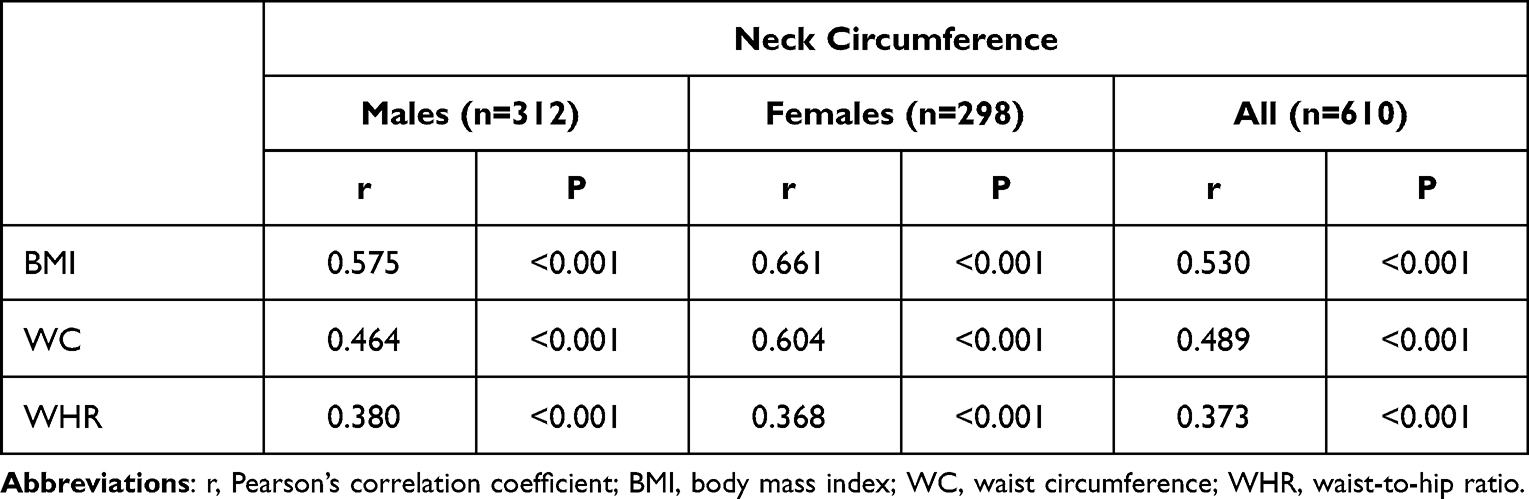 |
Table 1 Correlation of Neck Circumference with Anthropometric Parameters |
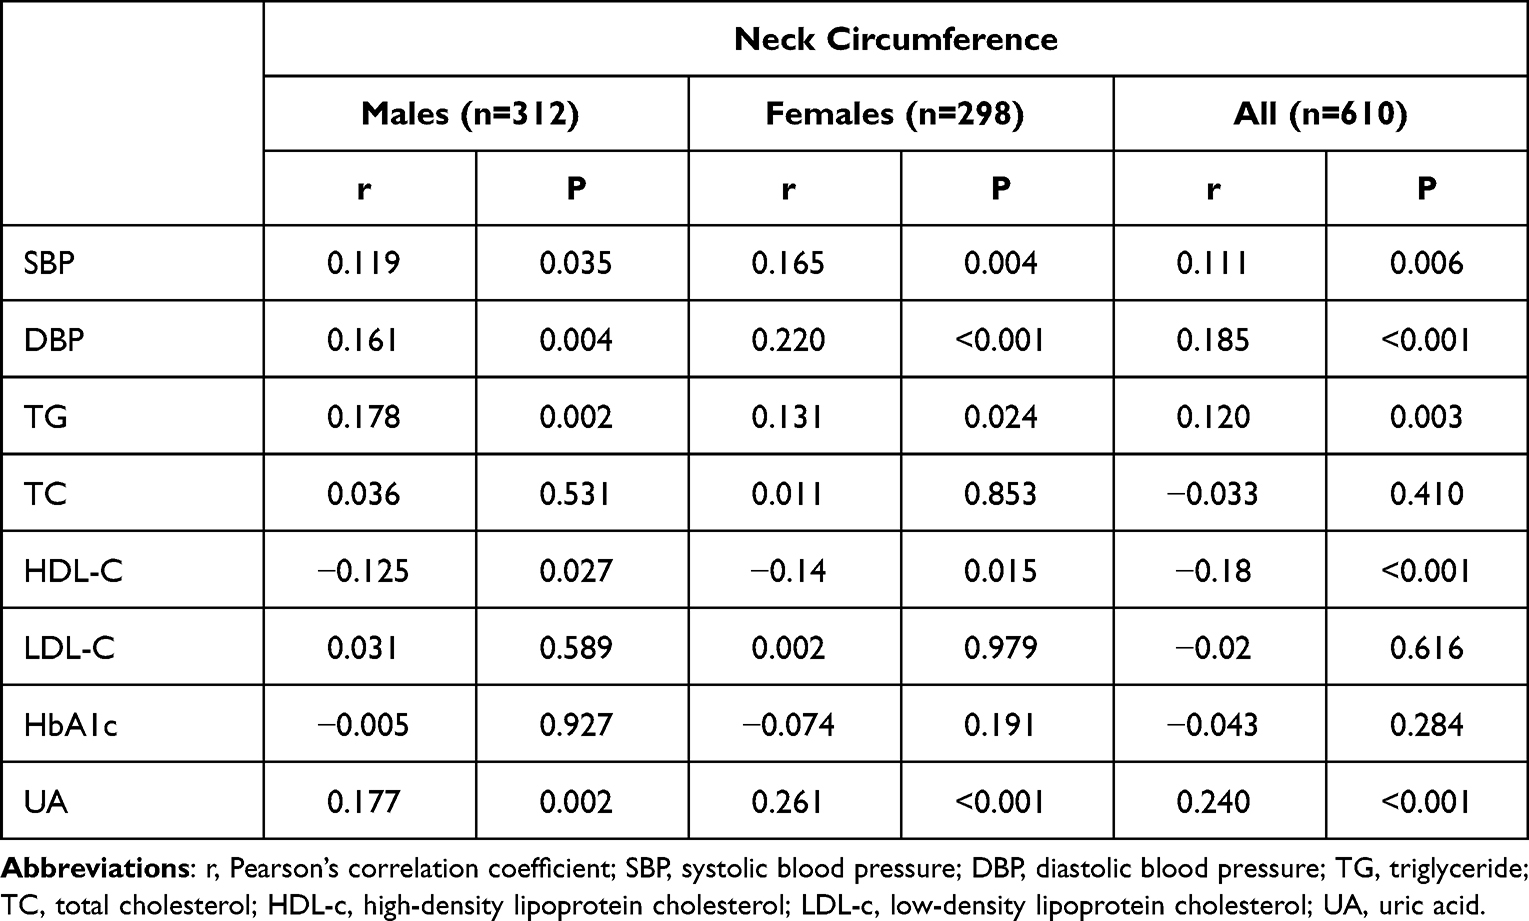 |
Table 2 Correlation of Neck Circumference with Metabolic Variables |
Multiple linear regression analysis showed that after adjusting for age, duration of diabetes, serum glucose, Bp, serum lipids, and other factors, NC had an independent effect on female serum uric acid levels (standardized coefficient β = 0.141, t = 2.088, P = 0.038); however, there was no independent correlation between WC and female serum uric acid levels (standardized coefficient β = 0.096, t = 1.430, P = 0.154).
Comparison of Neck Circumference in MetS and Non-MetS Groups
Subjects were divided into MetS (n=397) and non-MetS (n=213) groups. As shown in Table S2, there was no difference of gender, diabetic duration and HbA1c level between the MetS and non-MetS groups. As shown in Table 3, in both male and female subjects, NC was significantly larger in in MetS group than in the non-MetS group (male 38.42±3.05 cm vs 36.20±2.90 cm, female 36.14±2.75 cm vs 34.01±2.94 cm, P < 0.001).
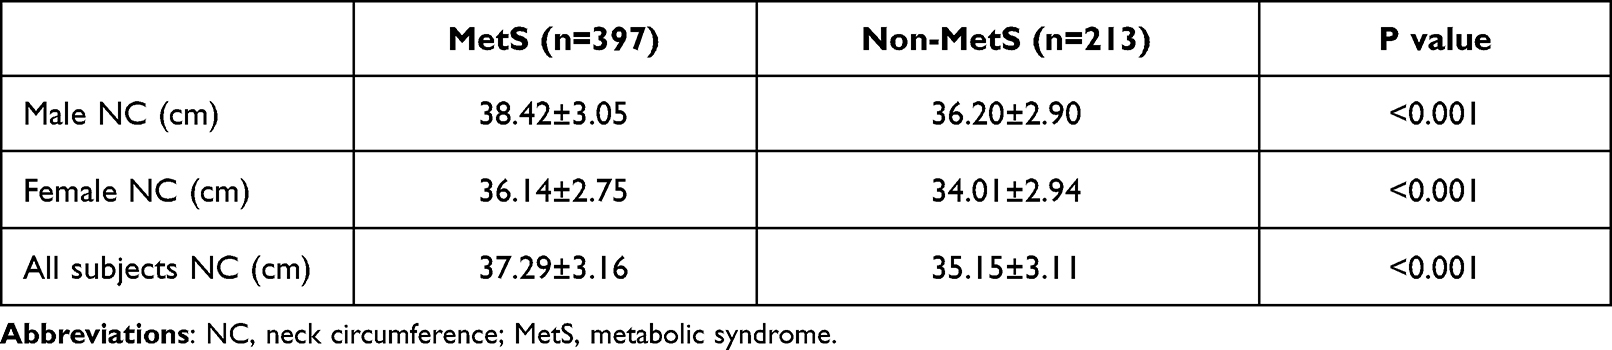 |
Table 3 Comparison of NC Between MetS Group and Non-MetS Group |
The areas under the ROC curves (AUCs) were calculated to evaluate the predictive values of NC for MetS (Figure 1). The AUCs of NC were 0.701 (95% confidence interval [CI], 0.643–0.760) for males and 0.707 (95% CI, 0.641–0.773) for females. Youden index was calculated and NC ≥ 37.3 cm (sensitivity 0.662, specificity 0.649) for males and NC ≥ 35.8 cm (sensitivity 0.59, specificity 0.67) for females was considered as the best cutoff values in identifying MetS.
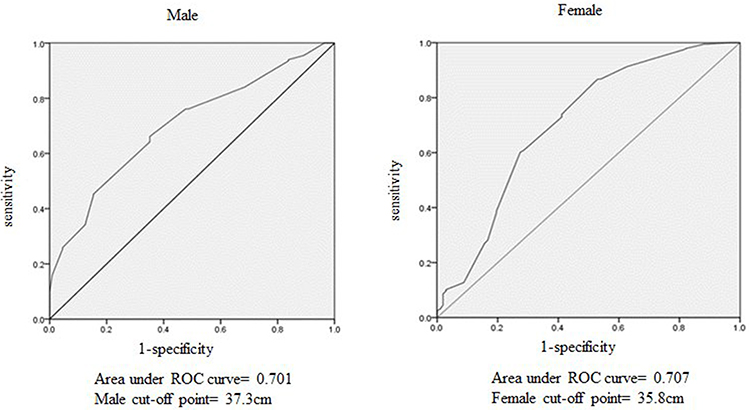 |
Figure 1 Receiver operating characteristic (ROC) curves of neck circumference for identifying metabolic syndrome in Males and Females. The areas under the ROC curves (AUCs) were calculated to evaluate the predictive values of NC for MetS. The AUCs of NC were 0.701 (95% confidence interval [CI], 0.643–0.760) for males and 0.707 (95% CI, 0.641–0.773) for females. Youden index was calculated and NC ≥ 37.3 cm (sensitivity 0.662, specificity 0.649) for males and NC ≥ 35.8 cm (sensitivity 0.59, specificity 0.67) for females was considered as the best cutoff values in identifying MetS. |
Identification of MetS Components by NC or WC
As shown in Table 4, there was no difference between using cutoff points of NC (≥ 37.3 cm) and WC (≥ 90 cm) to recognize MetS components in males, which include high Bp (SBP ≥ 130 mmHg or DBP ≥ 85 mmHg), hypertriglyceridemia (TG ≥ 1.7 mM), low HDL-C (HDL-C < 1.04 mM) and hyperuricemia (uric acid ≥ 420 nM). in males, in females). However, in females, there was no difference between using cutoff points of NC (≥ 35.8 cm) and WC (≥ 85 cm) only when identifying hyperuricemia (uric acid ≥ 360 nM). In females diagnosed with high Bp, hypertriglyceridemia and low HDL-C, the recognition rate of NC ≥ 35.8 cm was lower than that of WC ≥ 85 cm, seen in Table 4. It is suggested that this cutoff point of NC can identify MetS components with the same efficiency as WC in males, but only in female hyperuricemia.
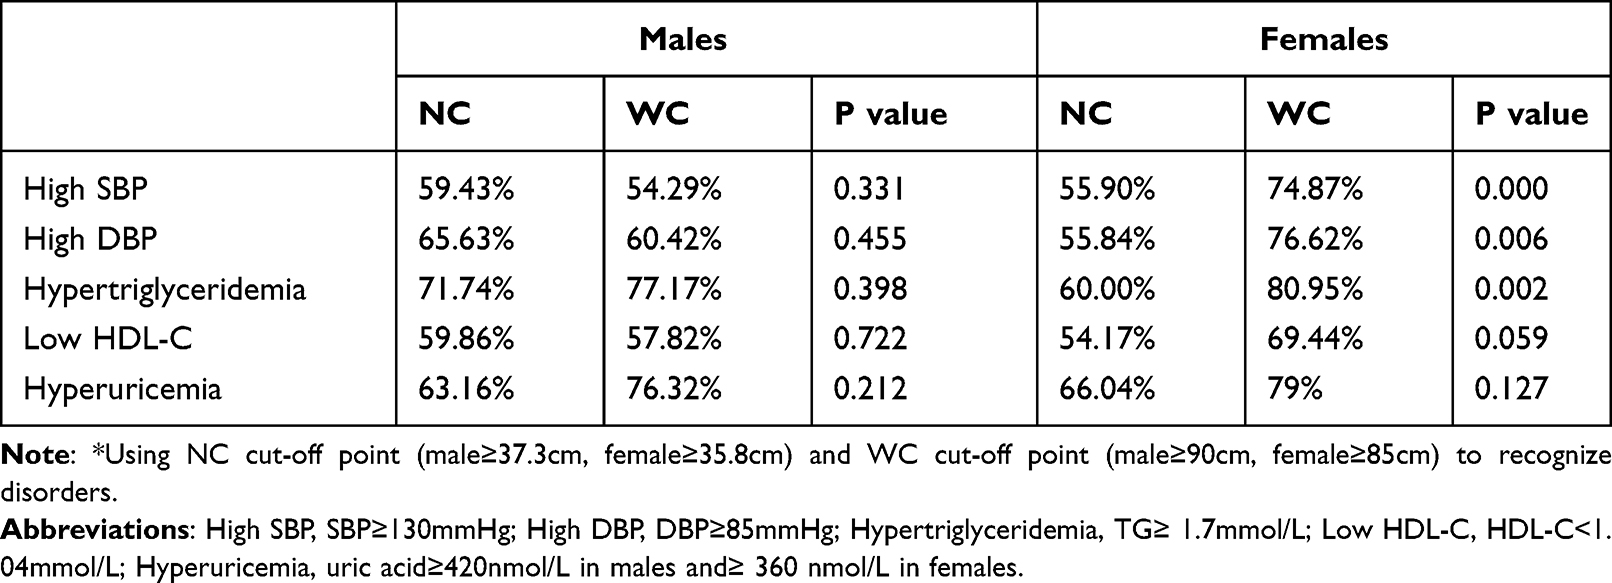 |
Table 4 Identification Rate of MetS Components by NC and WC* |
Discussion
In this research, we found that NC was positively correlated with anthropometric parameters (BMI, WC, and WHR) and MetS components (SBP, DBP, TG and uric acid) in patients with T2DM, while it was negatively correlated with serum HDL-C levels. After adjusting for multiple interference factors, NC was an independent factor associated with serum uric acid levels in females. We also estimated the optimal cut-off value of NC to predict the risk of MetS and found that the estimated value of NC was significantly associated with MetS components in T2DM.
With the improvement of living standards, the incidence rate of MetS is increasing. Obesity, especially abdominal obesity, plays an important role in MetS. Vague et al reported that when the physical shape and fat distribution type of obese individuals are different, the health risks to the body are also different.14 Studies suggest that fat of the upper body releases more free fatty acids (FFAs) than that of the lower body.15 The increase in FFA levels can seriously interfere with the signal transduction pathway of insulin and hence cause or aggravate insulin resistance. Therefore, compared with lower body obesity, upper body obesity is more likely to lead to MetS, including impaired glucose tolerance, hyperinsulinemia, hyperlipidemia, and hyperuricemia.16 Upper body subcutaneous fat is positively correlated with MetS and is an independent risk factor for MetS.
A simple and easy measurement index of upper body obesity is of great significance to MetS epidemiology. At present, WC is an internationally recognized diagnostic index of central obesity, but the body surface mark to measure WC is not obvious, it is inconvenient to measure in winter, and it is easily disturbed by factors such as a full stomach and recent exercise. As one of the evaluation indexes of upper body adipose, the measurement of NC is relatively convenient and simple. NC is highly correlated with traditional anthropometric indicators such as WC, BMI, WHR, especially WC.11 NC was shown to be positively correlated with central obesity and with visceral fat accumulation17,18 by computed tomography and magnetic resonance imaging. Li et al19 found that neck adipose area was correlated with abdominal visceral adipose tissue (VAT) area significantly in men (r = 0.57) and women (r = 0.53). They considered NC can be used as an indicator for evaluating central obesity and MetS.
Some studies even showed that NC can better evaluate metabolic health than WC.20,21 ROC analyses showed that NC was better in distinguishing T2DM, insulin resistance, MetS, and hypertension in individuals with severe obesity.21 NC was an independent predictor for fatty liver disease and provided an additional contribution when applied with other anthropometric measures.22 Compared with BMI and WC, NC alone can improve the prediction of cardiovascular disease risk factors.23,24 Research suggests that in males and females, an NC of 37 and 34 cm, respectively, is equivalent to a BMI of 25.0 kg/m2, and an NC of 39.5 and 36.5 cm, respectively, is equivalent to a BMI of 30.0 kg/m2.5 NC can be used as a new anthropometric index to help judge MetS and metabolic indexes.
The NC cutoff value is a good predictor of MetS and associated diseases. However, the NC cutoff values for identifying MetS and obesity differed due to region,25 age,26 medical history,11 etc. A previous study suggested that NC ≥ 38 cm for males and NC ≥ 33 cm for females are the optimal cutoff values for predicting MetS in a Thai population.25 A survey of 3182 Chinese patients with T2DM showed that NC ≥ 39 cm in males and NC > 35 cm in females was the best cutoff value for the classification of MetS in this population.11 In an elder population, an analysis of 2092 individuals aged over 65 years suggested that NC ≥38 cm for males and ≥35 cm for females was the best cutoff value for diagnosing MS.26 According to the diagnostic criteria of MetS proposed by the International Diabetes Federation (IDF) in 2005, WC ≥ 90 cm in males and WC ≥ 80 cm in females were defined as central obesity, and the optimal NC cutoff value corresponding to this WC was 38.5 cm in males and 34.5 cm in females.1 In our study, the population we selected was diabetic patients in the middle-elderly population. The optimal NC cutoff value in predicting MetS was 37.3 cm in males and 35.8 cm in females. The results are similar to those of other studies. This NC cutoff value could be used to identify male all MetS components such as high Bp, hypertriglyceridemia, low HDL-C, hyperuricemia and female hyperuricemia with the same efficiency as WC in our study.
There are some limitations in our study. First, the sample size of the study was relatively small. Second, the subjects are all patients with T2DM, further studies are needed to identify the relationship of NC with MetS in general population. Thirdly, the female NC cutoff value in our study was higher than that in other studies, which may be one of the reasons why the recognition rates of some female MetS components were lower than that of WC. Therefore, further statistical analysis of large samples is needed.
In conclusion, NC and WC have comparable associations with the components of MetS in Chinese T2DM. NC is expected to be an easy upper body surface measurement for predicting MetS and its components, especially in males and female hyperuricemia.
Disclosure
The authors declare no conflicts of interest in this work.
References
1. Alberti KG, Zimmet P, Shaw J.; Group IDFETFC. The metabolic syndrome–a new worldwide definition. Lancet. 2005;366(9491):1059–1062. doi:10.1016/S0140-6736(05)67402-8
2. Grundy SM, Cleeman JI, Daniels SR, et al. Diagnosis and management of the metabolic syndrome: an American Heart Association/National Heart, Lung, and Blood Institute Scientific Statement. Circulation. 2005;112(17):2735–2752. doi:10.1161/CIRCULATIONAHA.105.169404
3. Bao Y, Lu J, Wang C, et al. Optimal waist circumference cutoffs for abdominal obesity in Chinese. Atherosclerosis. 2008;201(2):378–384. doi:10.1016/j.atherosclerosis.2008.03.001
4. Sjostrom CD, Hakangard AC, Lissner L, Sjostrom L. Body compartment and subcutaneous adipose tissue distribution–risk factor patterns in obese subjects. Obes Res. 1995;3(1):9–22. doi:10.1002/j.1550-8528.1995.tb00116.x
5. Ben-Noun L, Sohar E, Laor A. Neck circumference as a simple screening measure for identifying overweight and obese patients. Obes Res. 2001;9(8):470–477. doi:10.1038/oby.2001.61
6. Papazafiropoulou A, Anagnostopoulou K, Papanas N, Petropoulou K, Melidonis A. Neck circumference as a simple tool for assessing central obesity in patients with type 2 diabetes mellitus in Greece - a descriptive study. Rev Diabet Stud. 2016;13(4):215–216.
7. Wang H. Analyzing neck circumference as a tool for evaluating overweight and obesity in Chinese adolescents. J Healthc Eng. 2021;2021:1274627.
8. Anothaisintawee T, Sansanayudh N, Thamakaison S, Lertrattananon D, Thakkinstian A. Neck circumference as an anthropometric indicator of central obesity in patients with prediabetes: a cross-sectional study. Biomed Res Int. 2019;2019:4808541.
9. Lin S, Hu L, Li P, et al. Utility of neck circumference for identifying metabolic syndrome by different definitions in Chinese subjects over 50 years old: a community-based study. J Diabetes Res. 2018;2018:3708939. doi:10.1155/2018/3708939
10. Joshipura K, Munoz-Torres F, Vergara J, Palacios C, Perez CM. Neck circumference may be a better alternative to standard anthropometric measures. J Diabetes Res. 2016;2016:6058916. doi:10.1155/2016/6058916
11. Yang GR, Yuan SY, Fu HJ, et al. Neck circumference positively related with central obesity, overweight, and metabolic syndrome in Chinese subjects with type 2 diabetes: Beijing Community Diabetes Study 4. Diabetes Care. 2010;33(11):2465–2467. doi:10.2337/dc10-0798
12. Yang GR, Yuan MX, Wan G, et al. Association between neck circumference and the occurrence of cardiovascular events in type 2 diabetes: Beijing community diabetes study 20 (BCDS-20). Biomed Res Int. 2019;2019:4242304. doi:10.1155/2019/4242304
13. Jia W, Weng J, Zhu D, et al. Standards of medical care for type 2 diabetes in China 2019. Diabetes Metab Res Rev. 2019;35(6):e3158. doi:10.1002/dmrr.3158
14. Vague J. The degree of masculine differentiation of obesities: a factor determining predisposition to diabetes, atherosclerosis, gout, and uric calculous disease. 1956. Nutrition. 1999;15(1):
15. Jensen MD. Lipolysis: contribution from regional fat. Annu Rev Nutr. 1997;17:127–139. doi:10.1146/annurev.nutr.17.1.127
16. Vasques AC, Rosado L, Rosado G, Ribeiro Rde C, Franceschini S, Geloneze B. Anthropometric indicators of insulin resistance. Arq Bras Cardiol. 2010;95(1):e14–e23. doi:10.1590/S0066-782X2010001100025
17. Aoi S, Miyake T, Harada T, et al. Neck circumference has possibility as a predictor for metabolic syndrome in postmenopausal women. Hiroshima J Med Sci. 2014;63(4):27–32.
18. Albu JB, Kovera AJ, Johnson JA. Fat distribution and health in obesity. Ann N Y Acad Sci. 2000;904:491–501. doi:10.1111/j.1749-6632.2000.tb06505.x
19. Li HX, Zhang F, Zhao D, et al. Neck circumference as a measure of neck fat and abdominal visceral fat in Chinese adults. BMC Public Health. 2014;14:311. doi:10.1186/1471-2458-14-311
20. da Silva Cde C, Zambon MP, Vasques AC, et al. Neck circumference as a new anthropometric indicator for prediction of insulin resistance and components of metabolic syndrome in adolescents: Brazilian Metabolic Syndrome Study. Rev Paul Pediatr. 2014;32(2):221–229. doi:10.1590/0103-0582201432210713
21. Assyov Y, Gateva A, Tsakova A, Kamenov Z. A comparison of the clinical usefulness of neck circumference and waist circumference in individuals with severe obesity. Endocr Res. 2017;42(1):6–14. doi:10.3109/07435800.2016.1155598
22. Huang BX, Zhu MF, Wu T, et al. Neck circumference, along with other anthropometric indices, has an independent and additional contribution in predicting fatty liver disease. PLoS One. 2015;10(2):e0118071. doi:10.1371/journal.pone.0118071
23. Preis SR, Massaro JM, Hoffmann U, et al. Neck circumference as a novel measure of cardiometabolic risk: the Framingham Heart study. J Clin Endocrinol Metab. 2010;95(8):3701–3710. doi:10.1210/jc.2009-1779
24. Yang GR, Yuan MX, Wan G, et al. Neck circumference and waist circumference associated with cardiovascular events in type 2 diabetes (Beijing Community Diabetes Study 23). Sci Rep. 2021;11(1):9491. doi:10.1038/s41598-021-88927-9
25. Laohabut I, Udol K, Phisalprapa P, et al. Neck circumference as a predictor of metabolic syndrome: a cross-sectional study. Prim Care Diabetes. 2020;14(3):265–273. doi:10.1016/j.pcd.2019.08.007
26. Yan Q, Sun DM, Li X, et al. Neck circumference is a valuable tool for identifying metabolic syndrome and obesity in Chinese elder subjects: a community-based study. Diabetes Metab Res Rev. 2014;30(1):69–76. doi:10.1002/dmrr.2464
 © 2022 The Author(s). This work is published and licensed by Dove Medical Press Limited. The
full terms of this license are available at https://www.dovepress.com/terms
and incorporate the Creative Commons Attribution
- Non Commercial (unported, 3.0) License.
By accessing the work you hereby accept the Terms. Non-commercial uses of the work are permitted
without any further permission from Dove Medical Press Limited, provided the work is properly
attributed. For permission for commercial use of this work, please see paragraphs 4.2 and 5 of our Terms.
© 2022 The Author(s). This work is published and licensed by Dove Medical Press Limited. The
full terms of this license are available at https://www.dovepress.com/terms
and incorporate the Creative Commons Attribution
- Non Commercial (unported, 3.0) License.
By accessing the work you hereby accept the Terms. Non-commercial uses of the work are permitted
without any further permission from Dove Medical Press Limited, provided the work is properly
attributed. For permission for commercial use of this work, please see paragraphs 4.2 and 5 of our Terms.