Back to Journals » International Journal of General Medicine » Volume 17
NDC80 Kinetochore Complex Serves as a Potential Prognostic Predictor and Correlates with Immune Infiltrates in Epithelial Ovarian Cancer Patients
Authors Yu X, Pan M, Jiang L, Liu K ![]()
Received 24 November 2023
Accepted for publication 23 April 2024
Published 2 May 2024 Volume 2024:17 Pages 1789—1805
DOI https://doi.org/10.2147/IJGM.S450976
Checked for plagiarism Yes
Review by Single anonymous peer review
Peer reviewer comments 2
Editor who approved publication: Dr Scott Fraser
Xiaodan Yu,1 Meizhu Pan,2 Lili Jiang,1,* Kuiran Liu1,*
1Department of Obstetrics and Gynecology, Shengjing Hospital of China Medical University, Shenyang, Liaoning, People’s Republic of China; 2Department of Gynecology, the First Affiliated Hospital of China Medical University, Shenyang, Liaoning, People’s Republic of China
*These authors contributed equally to this work
Correspondence: Kuiran Liu; Lili Jiang, Department of Obstetrics and Gynecology, Shengjing Hospital of China Medical University, No. 36, Sanhao Street, Shenyang, Liaoning Province, 110004, People’s Republic of China, Email [email protected]; [email protected]
Purpose: This study focuses on evaluating the prognostic value of the NDC80 kinetochore complex in ovarian cancer (OC) using the Gene Expression Omnibus (GEO) database and the Cancer Genome Atlas (TCGA) database and reveals the relationship between the NDC80 complex and immune infiltrates in OC.
Methods: We collected data on NDC80 complex expression levels in both OC tissues and non-OC ovarian tissues from the University of California Santa Cruz Xena and GEO databases. The clinicopathological characteristics correlated with overall survival were analyzed using Cox regression and the Kaplan–Meier method. Gene Ontology analysis, Kyoto Encyclopedia of Genes and Genomes analysis, gene set enrichment analysis and CIBERSORT were performed using data from TCGA database. Immunohistochemical staining was used to verify the higher expression level of NUF2 protein in OC in vitro. Meanwhile, we utilized the Tumor Immune Estimation Resource to analyze the correlation between the NDC80 complex and immunocyte infiltration.
Results: The NDC80 complex expression level was prominently higher in OC tissues than in non-OC ovarian tissues and correlated with advanced histologic grade characteristics. Gene expression profiling interactive analysis and the Kaplan–Meier survival curve uncovered a close relationship between high expression of the NDC80 complex and poor overall survival in OC patients. The univariate Cox regression hazard model produced age, pathologic stage, tumor status, primary therapy outcome, SPC24 expression level, and Karnofsky performance score as prognostic factors for OC patients. NDC80 complex expression levels were highly associated with immune cell infiltration, showing NK CD56 bright cells and NK cells with a negative correlation and T helper 2 cells with a positive correlation (P< 0.05).
Conclusion: These findings provide evidence that an increased expression level of the NDC80 complex is closely associated with the progression of OC and could also serve as a novel target of immunotherapy in OC.
Keywords: bioinformatics analysis, gene expression omnibus, NDC80 kinetochore complex, epithelial ovarian cancer, immunoinfiltration
Background
Ovarian cancer (OC), which is the most deadly and invasive malignancy in the female reproductive system, has been on the rise in recent years.1 Due to the insidious nature of OC’s early stages, the majority of patients (60%) are diagnosed with advanced disease,2 which is linked with a high fatality rate. The 5-year overall survival (OS) is as low as 45%, owing to complicated symptoms and a lack of early diagnosis measures.3 Given the fact that surgical resection performed on advanced OC requires sophisticated surgical techniques and is usually accompanied by severe complications, immunotherapy has been utilized to treat OC. However, there is currently a limited selection of immune checkpoint inhibitors accessible.4 Thus, it is critical to understand the specific molecular pathways behind OC carcinogenesis, proliferation, and invasion and to determine further effective diagnostic and therapeutic strategies for the management of OC.5
Researchers have demonstrated that increased NDC80 kinetochore complex (NDC80 complex) expression is an excellent prognostic indicator in hepatocellular carcinoma, pancreatic cancer, gastric cancer, and non-small cell lung cancer.6–9 However, the NDC80 complex’s role in OC is uncertain. As a result, we use several databases to investigate the expression, prognosis, and tumor-infiltrating lymphocytes of the NDC80 complex in OC. The NDC80 complex consists of four major components, known as NDC80, NUF2, SPC24, and SPC25. NDC80 is required for proper chromosome segregation and is involved in the organization and stabilization of microtubule–kinetochore interactions. NUF2, SPC24, and SPC25 play an important role in kinetochore integrity and the organization of stable microtubule binding sites in the outer plate of the kinetochore.10
In the present study, four OC datasets were retrieved from the Gene Expression Omnibus (GEO) database to verify NUF2 as a hub gene in OC. Immunohistochemical (IHC) staining was performed to demonstrate different expression levels of NUF2 protein between OC and non-OC ovarian tissues. Considering that NUF2 is an important component of the NDC80 complex, three other major components were taken into account as well. To understand the biological functions and relative molecular mechanisms underlying carcinogenesis, a variety of bioinformatics methods have been used. To our knowledge, this study is the first to investigate the relationship between the NDC80 complex and gene mutations and the tumor microenvironment (TME) in OC, then establish a SPC24-related nomogram to study patient survival and demonstrate that the NDC80 kinetochore complex may accelerate the progression of OC via the spindle and kinetochore-associated (SKA1) complex pathway. The workflow of the entire study is listed in Figure 1.
 |
Figure 1 The framework of the whole study by workflow. |
Materials and Methods
Data Acquisition and Processing
We searched in the GEO database using the keywords “ovarian cancer”, “ovarian carcinoma”, and “ovarian epithelial carcinoma” and screened out four gene expression profile datasets. The criteria were as follows: 1) All datasets were collected from the GPL570[HG-U133_Plus_2] Affymetrix Human Genome U133 Plus 2.0 Array. 2) The species were required to be Homo sapiens. 3) All datasets were required to contain both ovarian cancer epithelia samples and healthy ovarian surface epithelia samples. We downloaded the microarray data of four selected datasets (GSE14407, GSE38666, GSE40595, and GSE54388). GSE14407 includes data from 12 ovarian cancer epithelia (CEPI) samples and 12 healthy ovarian surface epithelia (OSE) samples. GSE38666 includes data from 7 CEPI samples and 8 OSE samples. GSE40595 includes data from 32 CEPI samples and 6 OSE samples. GSE54388 includes data from 16 CEPI samples and 6 OSE samples. We used data from these 4 datasets as the training set. The RNA sequencing gene expression data of 427 OC samples from the Cancer Genome Atlas (TCGA) database and 88 healthy ovarian surface epithelium samples from Genotype-Tissue Expression (GTEx) were retrieved. The data were transformed to the format of Transcripts Per Million, log2 converted and unified using the Toil process by R.11,12 We used the merged dataset as the validation set. It is worth mentioning that pre- and postmenopausal ovarian tissues were taken into account in both the training and validation sets in this study.
Identification of Differentially Expressed Genes (DEGs)
GEO2R was applied to perform comparisons on original submitter-supplied processed data tables, and the GEOquery and limma R packages from the Bioconductor project were used to filter the DEGs between the OC patient group and the non-OC group (Figure 2A–D).13 Background correction, normalization, removal of the batch effect, and calculation of expression were performed during the process. The cut-off threshold in GEO was |log fold change| ≥ 2 and an adjusted P value of <0.05.
 |
Figure 2 Identification of differentially expressed genes (DEGs) in ovarian cancer (OC). (A) Up-regulated and down-regulated DEGs in GSE14407. (B) Up-regulated and down-regulated DEGs in GSE38666. (C) Up-regulated and down-regulated DEGs in GSE40595. (D) Up-regulated and down-regulated DEGs in GSE54388. (E) Venn diagram of up-regulated DEGs between 4 GEO datasets. F.The PPI network of 64 DEGs is shown. |
Integration of Protein–Protein Interaction (PPI) Network
To distinguish the relationship between these DEGs, STRING-based analysis was used to establish the PPI network.14 First, 4 GEO datasets were utilized to build a Venn diagram of 104 overlapping DEGs (Figure 2E) and to determine the DEGs that encode proteins in OC. A total of 104 DEGs were input in Cytoscape to generate a PPI network, and 64 DEGs with significant correlation were output (Figure 2F). Second, the NetworkAnalyst was used to construct a co-expression network with a confidence score of 900.15 Third, the PPI network was imported into Cytoscape, and CytoHubba was used to compute the node degree and select a cluster of 36 DEGs for visualization.16
Gene Function Analysis
Enrichment studies of the Gene Ontology (GO) and Kyoto Encyclopedia of Genes and Genomes (KEGG) pathways were performed using the clusterProfiler package.17 Afterwards, a bubble plot was created using R GOplot. Three categories were defined in the ontology: biological process (BP), molecular function (MF), and cellular component (CC). P<0.05 was used as the cut-off value in this study.
IHC Staining
This study received the approval of the ethics committee of Shengjing Hospital (Reference number: KYCS2023063). Informed consent was waived under intense scrutiny by the ethics committee in this institution. Tissue samples of 30 epithelial ovarian cancers and 30 healthy ovaries were obtained from the specimen repository of Shengjing Hospital, and there were no human participants involved in this study. For IHC staining, five formalin-fixed, paraffin-embedded ovarian cancer tissues and five non-cancerous ovarian tissues were prepared. The samples were cut into 4 um thick slices, mounted on glass slides, deparaffinized in xylene, and rehydrated in a graded series of alcohol. Antigen retrieval was performed at a high temperature through a water bath. Endogenous peroxidases were quenched with 3% hydrogen peroxide after the sections were cooled and rinsed. The sections were then washed three times with phosphate buffer saline (PBS), incubated with calf serum for 10 min to block nonspecific antigens, incubated with polyclonal anti-NUF2 antibody (1:200, bs-7714R, Bioss, Beijing, China) at 4°C overnight, washed three times with PBS, and incubated with secondary antibody at room temperature (RT) for 30–40 min. An optical microscope was used to observe dried sections. Two pathologists, blinded to the source of the clinical cases, observed and analyzed the IHC staining results.
Gene Set Enrichment Analysis (GSEA)
The ggplot2 package was used to conduct GSEA, which serves as a statistical tool to detect whether the selected gene set exhibits statistically significant and concordant differences between the OC group and a group composed of non-OC individuals.18 In this study, after the removal of the batch effect in raw data from TCGA, an ordered list of all genes in OC and a single gene in OC, NUF2, were generated by GSEA. GSEA aims to determine statistically significant differences in the survival rate for all genes between the OC group and the non-OC group and between high and low NUF2 expression groups in order to identify signaling pathways regulated by OC-related genes and NUF2. To calculate and sort the enriched pathways in each phenotype, the normalized enrichment score and the nominal P value were used. C2.all.v6.2.symbols.gmt was selected as the reference gene set. The gene sets were permutated 1000 times.
Multiple Methods of Prognosis Analysis and Nomogram Construction
First, the diagnostic and prognostic values of the NDC80 kinetochore complex in OC patients were evaluated using receiver operating characteristic (ROC) and Kaplan-Meier survival curves. Second, univariate and multivariate regression analyses were conducted to identify the relationship between NDC80, NUF2, SPC24, and SPC25 expression and the OS rates of OC patients. For Cox regression analysis, P<0.05 was considered statistically significant. SPC24-related nomogram is a simplified model for predicting OC prognosis as a single numerical value. The probabilities of 3-year and 5-year OS rates are represented by the total points projected on the bottom scales. The R packages “rms” and “survival” were used to draw the nomogram.19
Correlation Analysis of Immune Cell Infiltration
Single-sample gene set enrichment analysis (ssGSEA) and the tumor immune estimation resource (TIMER) were applied to study the correlations between the NDC80 kinetochore complex and tumor purity, including 23 immunocytes. The correlation between the NDC80 kinetochore complex and immune cell infiltration was examined via Spearman correlation analysis. We used consensus clustering analysis with the R package “ConsensusClusterPlus” to perform an overview of different immune cell infiltration in OC patients.20
Statistical Analysis
P<0.05 was selected as the significance level. We computed the data with the R program (v.3.6.3). Chi-square and Fisher’s tests were applied to analyze the clinical data. Additionally, the Wilcoxon rank sum test was performed to verify the different expression levels of DEGs. Spearman’s test was used to analyze the correlations between the expression levels of NDC80, NUF2, SPC24, and SPC25 and immunocytes.
Results
Clinical Characteristics
The clinical information of 379 patients was collected from TCGA, including age, FIGO stage, race, primary therapy outcome, histologic grade, lymphatic invasion, and tumor status. Data filtering was used to calculate clinical information. The details are provided in Table 1.
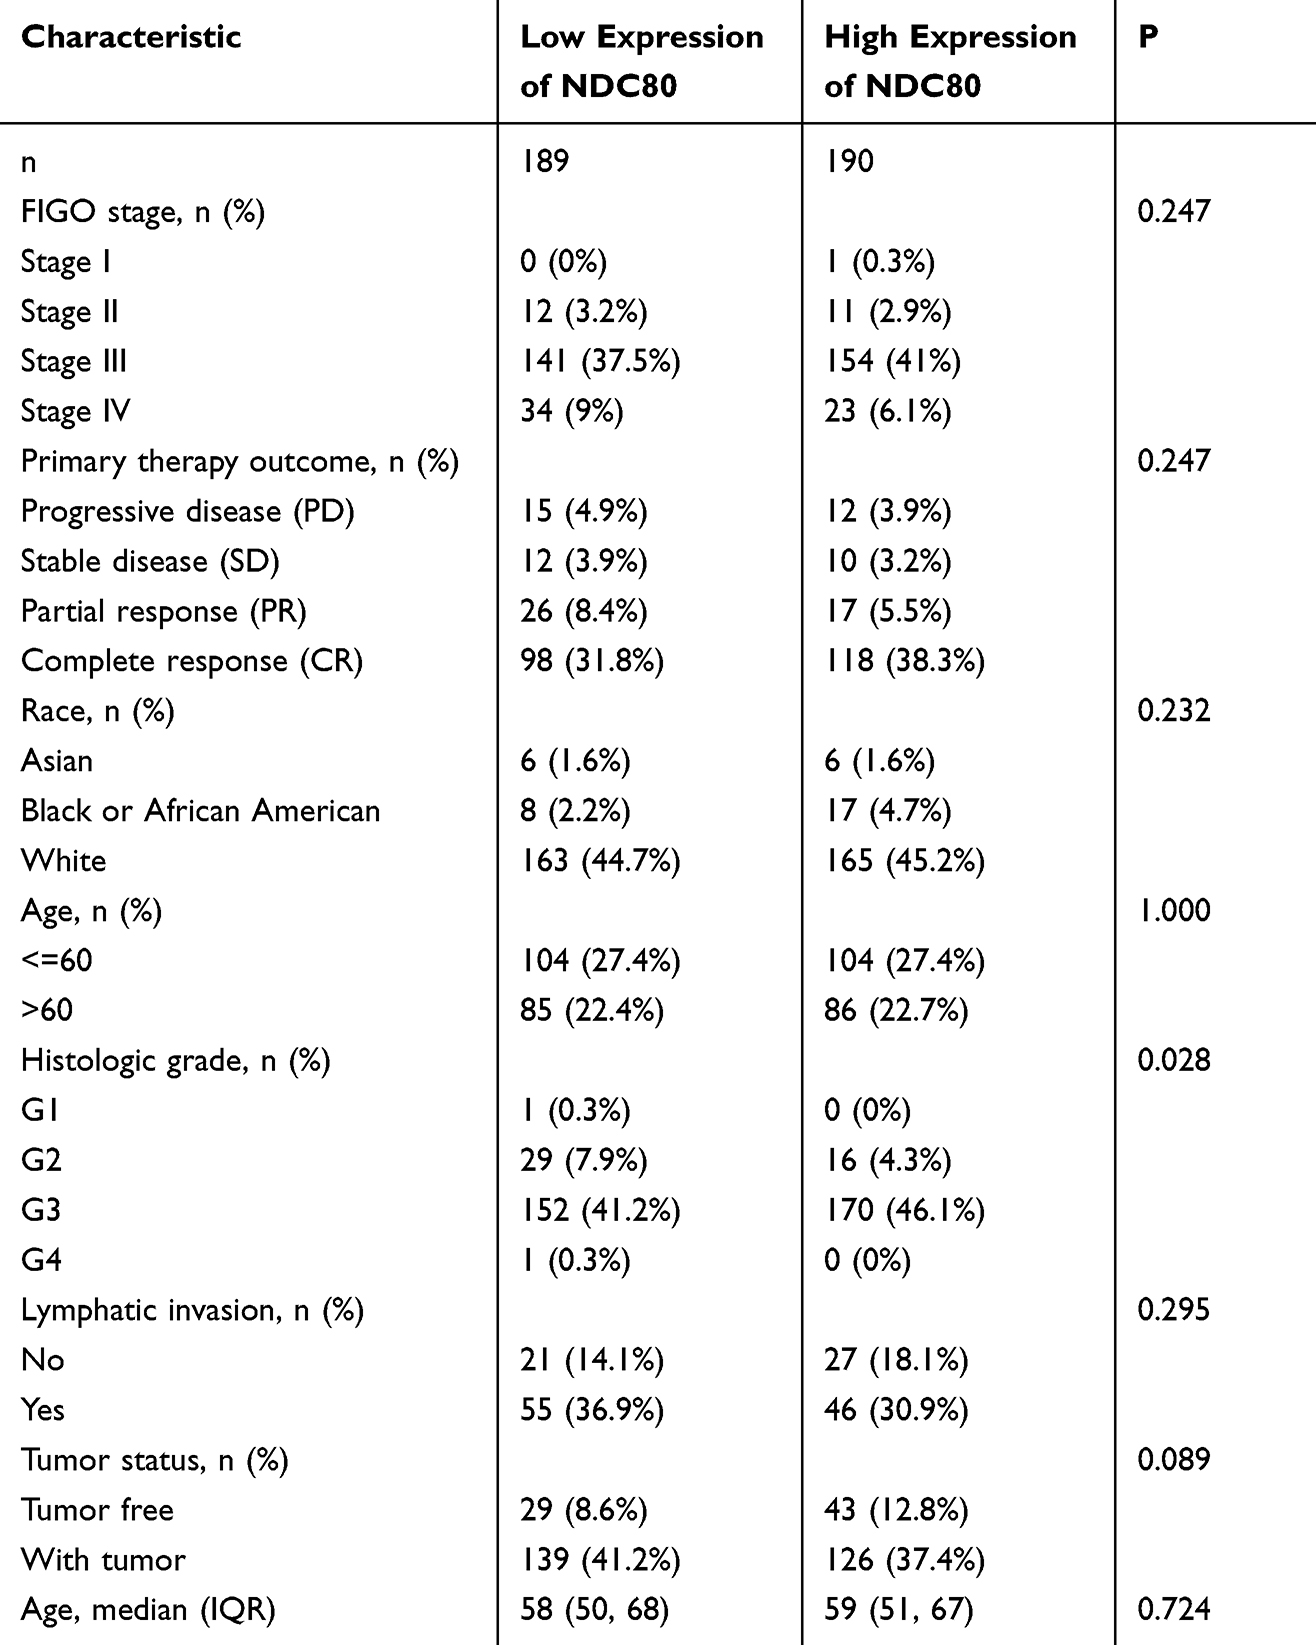 |
Table 1 Clinical Characteristics of the OV Patients Based on TCGA |
Hub Genes Were Connected by Network Analysis and PPI Analysis
104 overlapped DEGs from 4 different datasets were inputted in Network Analyst to generate a regulatory network in order to find out commonalities in gene function. Key genes are shown in Figure 3A. The PPI network was inputted in CytoHubba and a significant clusters of 36 DEGs was outputted in Figure 3B. NUF2, ECT2, BUB1B, AURKA, KIF2C, BUB1, CCNB2, TOP2A, CHEK1, CDK1 are shown in both figures, indicating its pivotal role in ovarian cancer.
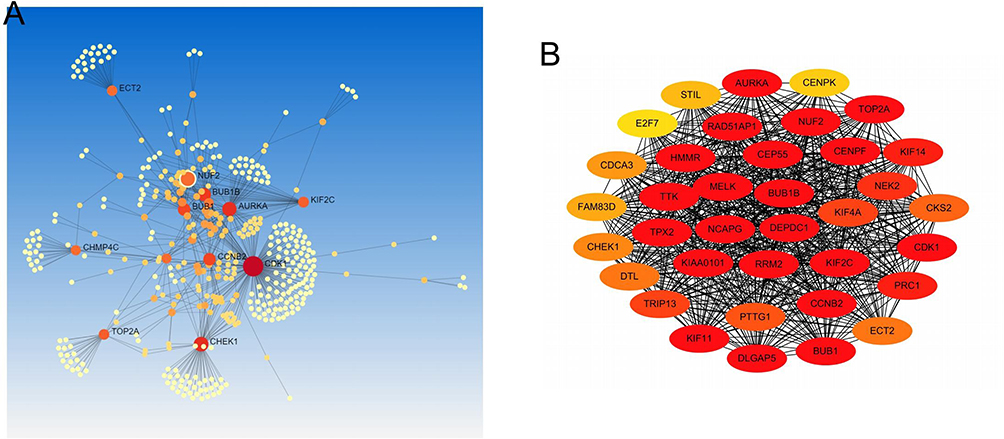 |
Figure 3 Correlation and interaction between selected DEGs. (A) Co-expression analysis was performed using NetworkAnalyst. (B) A cluster of 36 most correlative DEGs was performed by CytoHubba. |
NDC80 Kinetochore Complex Expression in OC Was Elevated
Differential expression of the NDC80 kinetochore complex was analyzed in OC. Compared to those in non-OC tissue, NDC80, NUF2, SPC24, and SPC25 expression levels were significantly higher in OC tissues (Figure 4A–D) (P<0.05), and the expression level of NUF2 was found to increase in 32 different tumors, not including kidney chromophobe (Figure 4E). A statistical difference between NDC80 and histologic grade was found by means of correlation analysis, indicating it may have impact on OC patients’ prognosis (P<0.05) (Table 1). There was no remarkable difference in age, race, FIGO stage, primary therapy outcome, lymphatic invasion, or tumor status. NUF2 protein expression in OC was further investigated by means of IHC staining, which showed that the protein level was increased in OC compared to non-OC ovarian tissue (Figure 5).
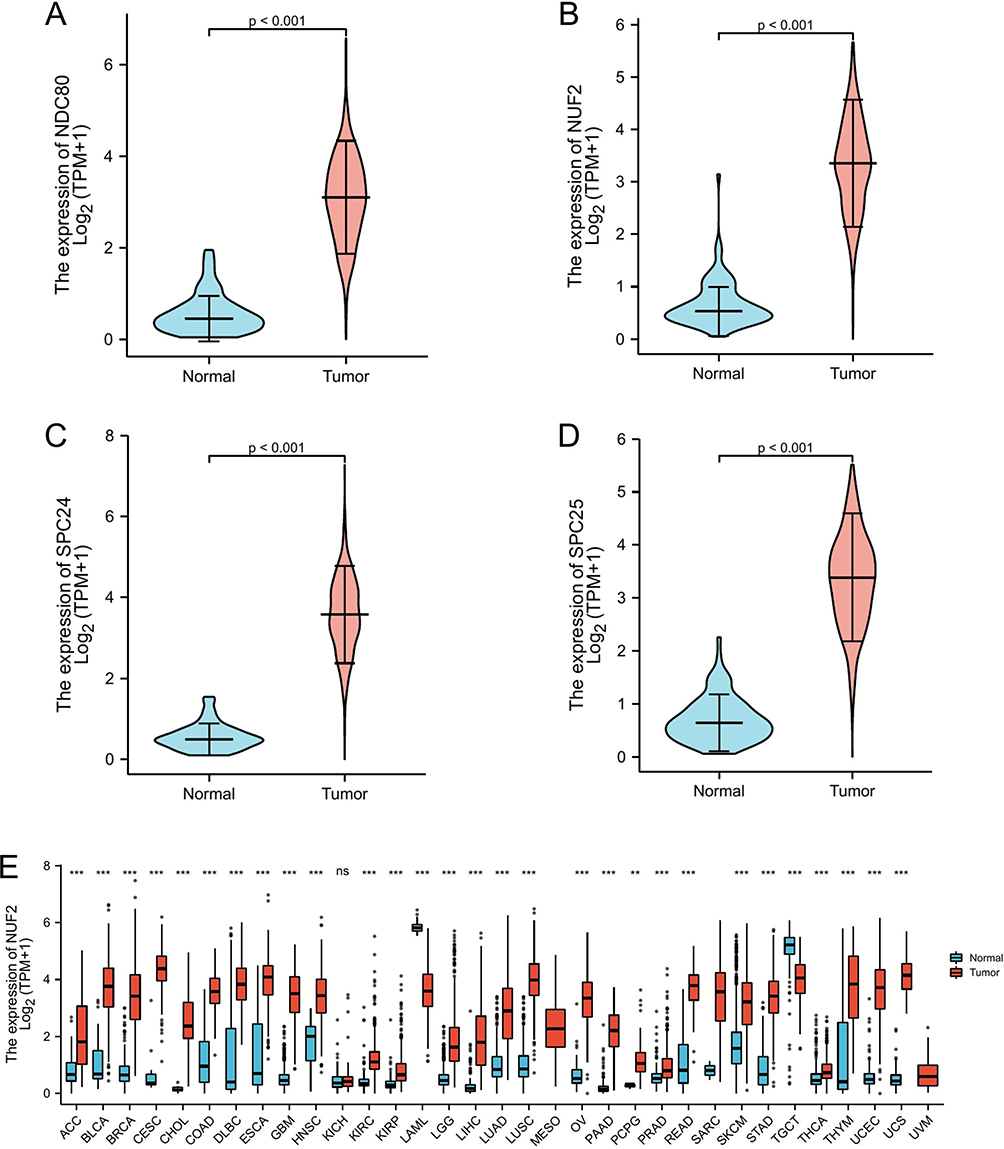 |
Figure 4 The comparison of mRNA expression levels of NDC80 complex. (A) NDC80, (B) NUF2, (C) SPC24 and (D) SPC25 expression levels were confirmed significantly higher in OC samples than that in non-OC samples. (E) NUF2 expression level was up-regulated in 32 different tumors except for KICH. ***<0.001, **<0.01. Abbreviations: ns, not statistically; ACC, adrenocortical cancer; BLCA, bladder cancer; BRCA, breast cancer; CESC, cervical cancer; CHOL, bile duct cancer; COAD, colon cancer; DLBC, large B-cell lymphoma; ESCA, esophageal cancer; GBM, glioblastoma; HNSC, head and neck cancer; KICH, kidney chromophobe; KIRC, kidney clear cell carcinoma; KIRP, kidney papillary cell carcinoma; LAML, acute myeloid leukemia; LGG, lower grade glioma; LIHC, liver cancer; LUAD, lung adenocarcinoma; LUSC, lung squamous cell carcinoma; MESO, mesothelioma; NDC80, NDC80 component of NDC80 kinetochore complex; NUF2, NUF2 component of NDC80 kinetochore complex; OV, ovarian cancer; PAAD, pancreatic cancer; PCPG, pheochromocytoma and paraganglioma; PRAD, prostate cancer; READ, rectal cancer; SARC, sarcoma; SPC24, SPC24 component of NDC80 kinetochore complex; SPC25, SPC25 component of NDC80 kinetochore complex; SKCM, melanoma; STAD, stomach cancer; TGCT, testicular cancer; THCA, thyroid cancer; THYM, thymoma; TPM, transcripts per million; UCEC, endometrioid cancer; UCS, uterine carcinosarcoma; UVM, ocular melanomas. |
 |
Figure 5 Immunohistochemical staining of NUF2 was performed in OC tissues (A–B) and in non-OC tissues (C–D). Representative images are presented. Scare bars, 10 μm. |
GSEA and GO/KEGG Analysis of OC-Related Genes
GSEA identified a number of molecular pathways that were significantly altered in OC patient tissue compared to non-OC patient tissue. To filter out differentially enriched pathways between the OC group and the non-OC group, GSEA of the gene expression profiles was used. These results show that OC is predominantly correlated with the reactome cell cycle, M phase, mitotic prometaphase, mitotic metaphase and anaphase, rho GTPase effectors, and signaling by rho GTPase (Figure 6A–F). Taking enrichment analysis via GO/KEGG (Table 2) into account, we theorized that OC-related genes are mainly enriched in nuclear division, mitotic nuclear division, and organelle fission terms for BP. For CC, the DEGs were mainly enriched in spindle, midbody, and chromosomal region terms, and for MF, they were mainly enriched in microtubule binding, histone kinase activity, and tubulin binding terms (Figure 6G). For KEGG analysis, the cell cycle, oocyte meiosis, and p53 signaling pathway terms were enriched (Figure 6H).
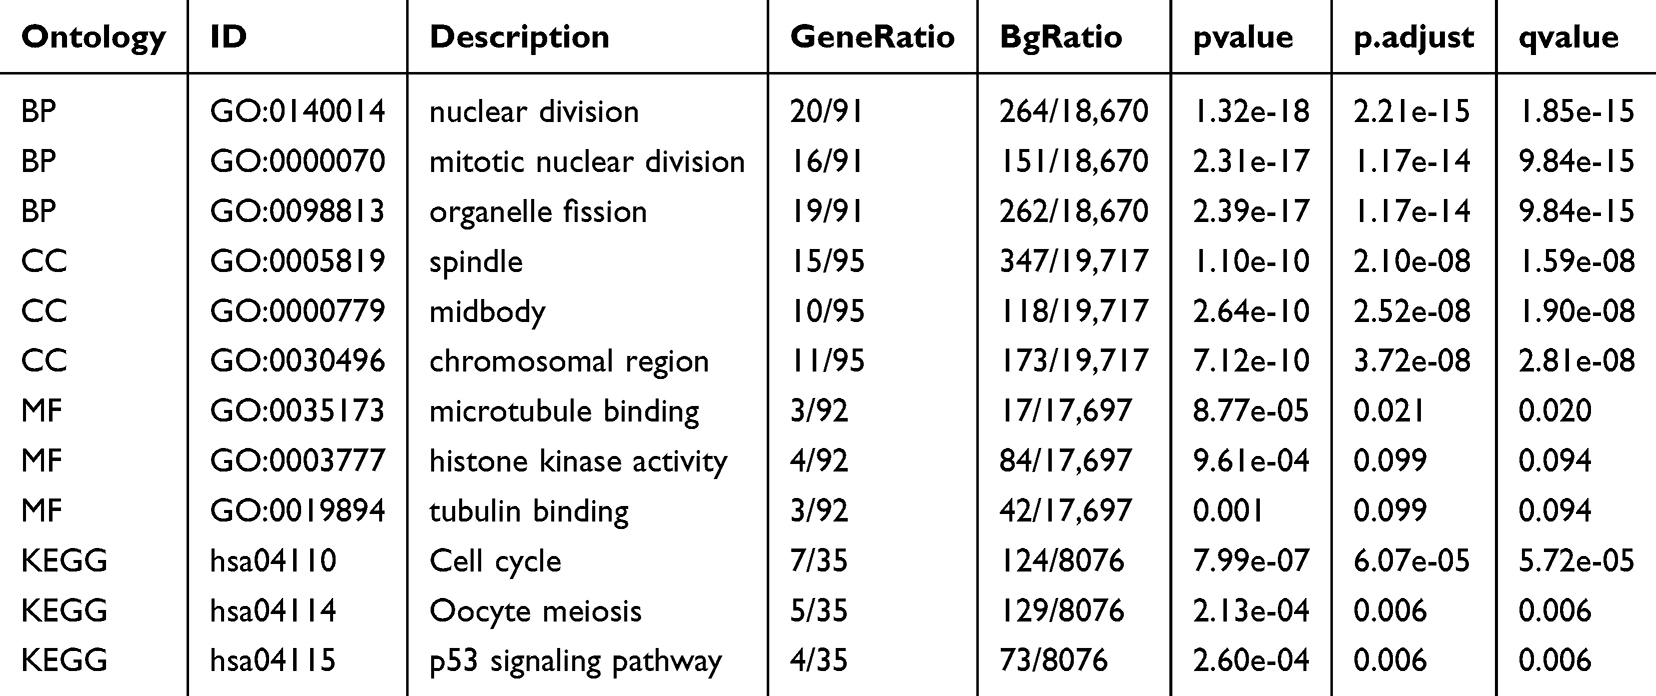 |
Table 2 Results of GO and KEGG Analysis of OV-Related Genes |
 |
Figure 6 GSEA and GO/KEGG enrichment analysis results. OC-related genes were mainly enriched in (A) cell cycle, (B) M phase, (C) mitotic prometaphase, (D) mitotic metaphase and anaphase, (E) rho GTPase effectors and (F) signaling by rho GTPase. (G) Bar plot of significantly enriched GO terms for the DEGs. (H) Bar plot of significantly enriched KEGG terms for the DEGs. |
Correlation Analysis of Diagnosis and Prognosis
Area under curve (AUC) was 0.978 for NUF2, 0.975 for NDC80, 0.996 for SPC24, and 0.986 for SPC25 (Figure 7A). This result indicated that the NDC80 complex could differentiate between non-tumor and tumor tissues. The Kaplan–Meier survival curve reveals that high NDC80, NUF2, and SPC25 levels are correlated with poor prognosis (Figure 7B–D). The survival curve run by the GEPIA database shows that a high SPC24 level is associated with poor prognosis (Figure 7E). Figure 8A shows that a high SPC24 expression level, along with age, tumor status, primary therapy outcome, tumor size and Karnofsky score (KFS), has statistical significance in a poor OC prognosis in the TCGA database (P<0.05). In the multivariate Cox model, only age, tumor status, primary therapy outcome, and KFS were independent prognostic factors in OC patients (Figure 8B).
 |
Figure 7 ROC and Kaplan-Meier survival curve of NDC80, NUF2, SPC24 and SPC25. (A) ROC analysis showed 4 components of NDC80 complex were capable of distinguishing tumor from normal tissue with high accuracy. The AUC was 0.978 for NUF2, 0.975 for NDC80, 0.996 for SPC24 and 0.986 for SPC25. (B–D) The Kaplan-Meier survival curve showed high level of NDC80, NUF2 and SPC25 with a poor prognosis of OC patients. (E) Survival curve run by GEPIA displayed SPC24 as a negative predictor of prognosis. |
 |
Figure 8 The association of NDC80 complex expression and other clinicopathologic features with OS in OC was studied using univariate and multivariate cox analysis. (A) The forest plot of univariate cox analysis. (B) The forest plot of multivariate regression analysis. (C) SPC24-related nomogram was used to assess prognosis of OC patients. |
Identification of the Nomogram
A prognostic nomogram was constructed on the basis of clinicopathological factors in order to produce a quantitative method for the prediction of the prognosis of OC patients (Figure 8C). The nomogram integrated age, histologic grade, tumor status, primary therapy outcome, and SPC24 expression, and the results indicated that histologic grade had the greatest influence on the model, while patients with higher SPC24 expression had a greater risk of a nonideal prognosis.
Correlation Analysis of Immune Cell Infiltration
OC is closely correlated with molecular genetics and the inflammatory environment. The relative percentage of 22 immunocytes in OC patients via CIBERSORT was demonstrated to overwhelm the immune microenvironment in OC patients (Figure 9A). The TIMER data imply statistical significance not only between NDC80 and macrophages, neutrophils, and dendritic cells but also between SPC25 and CD8+T cells and macrophages, whereas no statistically significant difference exists between NUF2, SPC24, and other immunocytes (Figure 9B–E). Using the ssGSEA package, the correlation between NDC80, NUF2, SPC24, SPC25, and other immunocytes was determined (Figure 10A–D). There was a significant correlation between NDC80, NUF2, SPC24, and SPC25 levels and immune cell infiltration, including NK CD56bright cells and NK cells with negative correlation and Th2 cells with positive correlation (P<0.05). Eosinophils, iDC, and Mast cells had a positive correlation with NDC80, NUF2, and SPC24. Th17 cells had a positive correlation with NDC80, NUF2, and SPC25, while T helper cells had a negative correlation with them.
 |
Figure 9 Correlation of NDC80, NUF2, SPC24 and SPC25 expression with immunocyte infiltration in OC. (A) The relative percentage of 22 immunocyte in OC patients via cibersort. (B–E) The correlation of NDC80, NUF2, SPC24 and SPC25 expression with tumor purity and six types of immunocytes was evaluated by TIMER. |
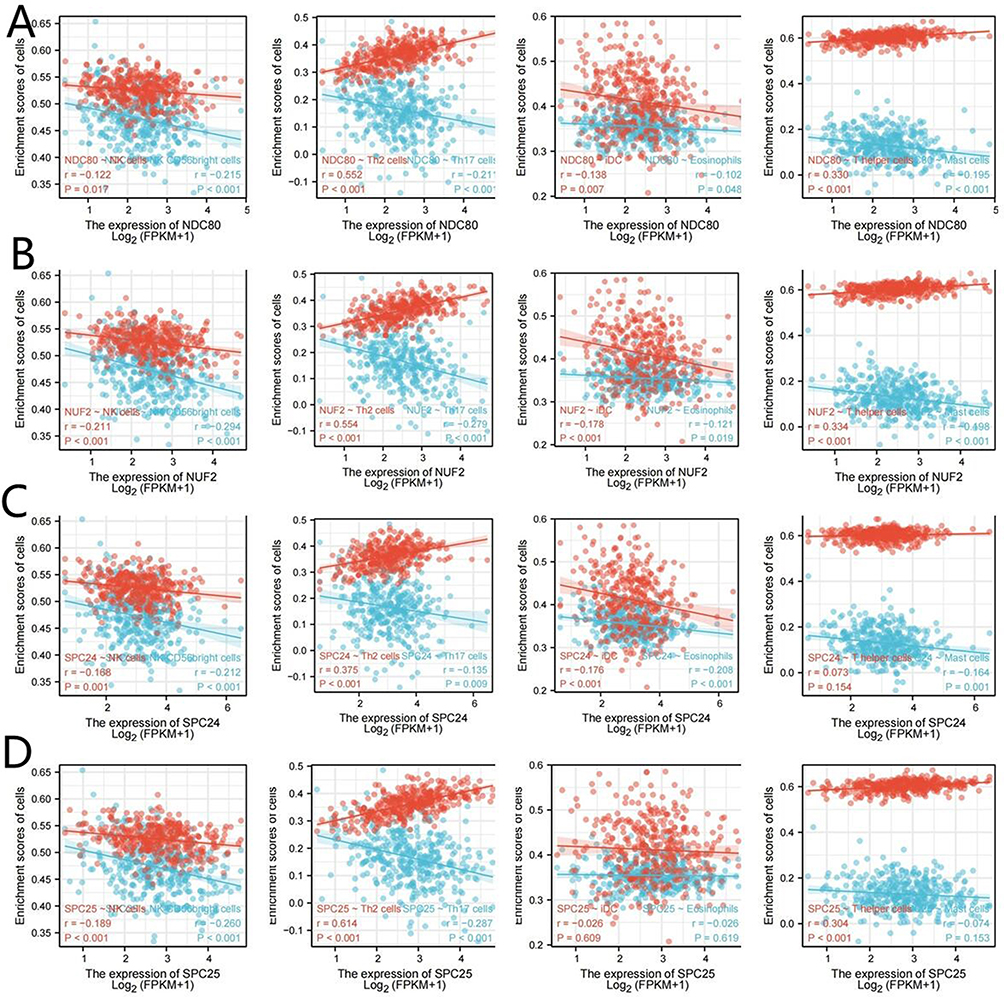 |
Figure 10 Correlation of NDC80, NUF2, SPC24 and SPC25 expression with other immunocyte infiltration in OC. (A–D). The correlation between NDC80, NUF2, SPC24, SPC25 and other immunocytes was studied using ssGSEA. |
Discussion
Despite extensive studies on OC biomarkers, the research on prognostic markers for OC remains limited. High levels of NDC80 kinetochore complex, which consists of NDC80, NUF2, SPC24, and SPC25, are required for tumor cells to retain malignant properties such as uncontrolled invasion, resistance to chemotherapy, and metastasis. Overexpression of NDC80 genes has been identified in a variety of malignant tumors and is often associated with a poor clinical outcome.7–10
During the process of carcinogenesis, there may be discrepancies between the final protein expression and the transcription level of mRNA. In this study, we evaluated the NDC80 complex at the mRNA level and NUF2, the hub gene, at both the mRNA and the protein levels. The NDC80 complex has a central role in the formation and regulation of microtubule attachments, which is supported by additional factors such as the spindle and kinetochore-associated complex.21 A current study demonstrated that inhibition of NDC80 expression enhances the sensitivity of human ovarian cancer cells to paclitaxel.22 NUF2 can serve as a stabilizer during microtubule–kinetochore interactions, which is related to proper chromosome segregation. The knockdown of NUF2 induces chromosomal misalignment during metaphase and a significant reduction in cancer cell proliferation.23 However, few studies have been carried out on the expression of NDC80 genes in OC. As a result, it is crucial to recognize the expression of NDC80 genes in OC and its therapeutic and prognostic significance.
First, this study examined the differential expression of the NDC80 kinetochore complex in OC and non-OC tissues. NDC80, NUF2, SPC24, and SPC25 levels were found to be significantly higher in OC tissues than in non-OC ovarian epithelial tissues. The mRNA levels of the NDC80 complex were markedly distinct according to histologic grade. Next, the co-regulatory proteins of NUF2 were identified using the PPI network. We found that NUF2-related genes were mainly enriched in the cell cycle, oocyte meiosis, and the p53 signaling pathway. Then, the protein expression level of NUF2 was verified by means of IHC staining in precise experiments. We also verified the correlation between the NDC80 kinetochore complex and survival rate in OC patients. ROC and Kaplan–Meier survival analyses were performed to confirm that high expression of NDC80, NUF2, and SPC25 is closely linked to a worse prognosis and that an NUF2-related nomogram could be used as a reliable prognostic indicator in OC.
Furthermore, studies have shown that NUF2 is closely linked with cancer progression through the meditator LncRNA AF339813. LncRNA AF339813 is positively regulated by NUF2. Researchers further demonstrated that knockdown of AF339813 by siRNA in cancer cells significantly reduced cell proliferation and promoted apoptosis.24 On the contrary, NDC80 overexpression induced asymmetrical chromosome alignments and abnormal cell division, thus producing chromosomal instability.8
In addition, OC is closely associated with the immune microenvironment.25 TME refers to the niche, either primary or metastatic, in which tumor cells interact with the host stroma, including various immune cells, endothelial cells, fibroblasts, and metabolic products. Recently, the critical role of TME in OC initiation, progression, and resistance to antitumor therapy has been increasingly recognized. However, there are few studies investigating the connection between the NDC80 complex and immunocytes in OC. Using TIMER and ssGSEA, the correlation between the NDC80 complex and immunocyte infiltration was evaluated in this study. Our results indicate that the NDC80 complex significantly correlated with NK CD56bright cells, NK cells, and Th2 cells.
However, this research has some drawbacks. First, all data were collected in a retrospective way, and selection bias may be inherent. Second, multivariate Cox regression was performed, but there were still some potential confounding factors such as the patients’ economic condition and missing data in online databases. Third, there was a limited number of non-OC samples in the TCGA database and no validation of the hypothesis using animal models. Clearly, these aspects must be verified through further research.
Conclusion
In conclusion, our study revealed the prognostic functions of the NDC80 kinetochore complex in OC patients and a substantial association between the NDC80 kinetochore complex and immune cell infiltration. Therefore, our results indicate that the NDC80 kinetochore complex has a significant prognostic value in OC, and it could serve as a potential immunotherapeutic target for OC patients.
Patient Data Confidentiality
All patient data were anonymized or de-identified prior to analysis. The de-identified data were stored on secure, password-protected servers with limited access. In presenting the results of the study, care was taken to ensure that no individual patient can be identified. Data are reported in aggregate form that do not disclose individual patient information. By following these protocols, we protected the confidentiality of patient data.
Abbreviations
AUC, area under curve; BP, biological process; CC, cellular component; CEPI, ovarian cancer epithelia; CR, complete response; DEGs, differentially expressed genes; GEO, gene expression omnibus; GO, gene ontology; GSEA, gene set enrichment analysis; GTEx, genotype-tissue expression; IHC, immumohistochemical; KEGG, kyoto encyclopedia of genes and genomes; MF, molecular function; NDC80, NDC80 component of NDC80 kinetochore complex; NDC80 complex, NDC80 kinetochore complex; NK, nature killer; NUF2, NUF2 component of NDC80 kinetochore complex; OC, ovarian cancer; OS, overall survival; OSE, ovarian surface epithelia; PBS, phosphate buffer saline; PD, progressive disease; PPI, protein–protein interaction; PR, partial response; ROC, receiver operating characteristic; SD, stable disease; SPC24, SPC24 component of NDC80 kinetochore complex; SPC25, SPC25 component of NDC80 kinetochore complex; ssGSEA, single sample gene set enrichment analysis; TCGA, the cancer genome atlas; Th2, T helper 2; TIMER, tumor immune estimation resource; TME, tumor microenvironment.
Data Availability
The datasets supporting the conclusions of this article are available in TCGA, GEO, GTEx and UCSC Xena repository, https://portal.gdc.cancer.gov/projects/TCGA-OV. https://www.ncbi.nlm.nih.gov/geo/query/acc.cgi?acc=GSE14407. https://www.ncbi.nlm.nih.gov/geo/query/acc.cgi?acc=GSE38666. https://www.ncbi.nlm.nih.gov/geo/query/acc.cgi?acc=GSE40595. https://www.ncbi.nlm.nih.gov/geo/query/acc.cgi?acc=GSE54388. https://xenabrowser.net/datapages/?cohort=GDC%20TCGA%20Ovarian%20Cancer%20(OC)andremoveHub=https%3A%2F%2Fxena.treehouse.gi.ucsc.edu%3A443. The datasets analysed during the current study are not publicly available due but are available from the corresponding author on reasonable request.
Ethics Approval
This study was performed in line with the principles of the Declaration of Helsinki. Approval was granted by the Ethics Committee of Shengjing Hospital of China Medical University. (Reference number: KYCS2023063). The authors confirmed that all the data from patients were anonymized and maintained with confidentiality.
Consent to Participate
This study is exempted from informed consent by the Ethics Committee of Shengjing Hospital of China Medical University.
Consent to Publish
This study is exempted from informed consent by the Ethics Committee of Shengjing Hospital of China Medical University.
Acknowledgment
Lili Jiang and Kuiran Liu contributed equally to this work and should be considered co-first authors.
Funding
The authors declare that no funds, grants, or other support were received during the preparation of this manuscript.
Disclosure
The authors have no relevant financial or non-financial interests to disclose.
References
1. Siegel RL, Miller KD, Jemal A. Cancer statistics, 2019. CA Cancer J Clin. 2019;69(1):7–34. doi:10.3322/caac.21551
2. Jessmon P, Boulanger T, Zhou W, Patwardhan P. Epidemiology and treatment patterns of epithelial ovarian cancer. Expert Rev Anticancer Ther. 2017;17(5):427–437. doi:10.1080/14737140.2017.1299575
3. Webb PM, Jordan SJ. Epidemiology of epithelial ovarian cancer. Best Pract Res Clin Obstet Gynaecol. 2017;41:3–14. doi:10.1016/j.bpobgyn.2016.08.006
4. Yang C, Xia BR, Zhang ZC, Zhang YJ, Lou G, Jin WL. Immunotherapy for ovarian cancer: adjuvant, combination, and neoadjuvant. Front Immunol. 2020;11:577869. doi:10.3389/fimmu.2020.577869
5. Jiang X, Li X, Li W, Bai H, Zhang Z. PARP inhibitors in ovarian cancer: sensitivity prediction and resistance mechanisms. J Cell Mol Med. 2019;23(4):2303–2313. doi:10.1111/jcmm.14133
6. Shen S, Kong J, Qiu Y, Yang X, Wang W, Yan L. Identification of core genes and outcomes in hepatocellular carcinoma by bioinformatics analysis. J Cell Biochem. 2019;120(6):10069–10081. doi:10.1002/jcb.28290
7. Meng QC, Wang HC, Song ZL, et al. Overexpression of NDC80 is correlated with prognosis of pancreatic cancer and regulates cell proliferation. Am J Cancer Res. 2015;5(5):1730–1740.
8. Qu Y, Li J, Cai Q, Liu B. Hec1/Ndc80 is overexpressed in human gastric cancer and regulates cell growth. J Gastroenterol. 2014;49(3):408–418. doi:10.1007/s00535-013-0809-y
9. Wei R, Wang Z, Zhang Y, et al. Bioinformatic analysis revealing mitotic spindle assembly regulated NDC80 and MAD2L1 as prognostic biomarkers in non-small cell lung cancer development. BMC Med Genomics. 2020;13(1):112. doi:10.1186/s12920-020-00762-5
10. Tooley J, Stukenberg PT. The Ndc80 complex: integrating the kinetochore’s many movements. Chromosome Res. 2011;19(3):377–391. doi:10.1007/s10577-010-9180-5
11. Goldman MJ, Craft B, Hastie M, et al. Visualizing and interpreting cancer genomics data via the Xena platform. Nat Biotechnol. 2020;38(6):675–678. doi:10.1038/s41587-020-0546-8
12. Vivian J, Rao AA, Nothaft FA, et al. Toil enables reproducible, open source, big biomedical data analyses. Nat Biotechnol. 2017;35(4):314–316. doi:10.1038/nbt.3772
13. Smyth G. Limma: linear models for microarray data. In: Gentleman R, Carey V, Dudoit S, Irizarry R, Huber W, editors. Bioinformatics and Computational Biology Solutions Using R and Bioconductor. New York: Springer; 2005:397–420.
14. Szklarczyk D, Gable AL, Lyon D, et al. STRING v11: protein-protein association networks with increased coverage, supporting functional discovery in genome-wide experimental datasets. Nucleic Acids Res. 2019;47(D1):D607–D613. doi:10.1093/nar/gky1131
15. Xia J, Gill EE, Hancock RE. NetworkAnalyst for statistical, visual and network-based meta-analysis of gene expression data. Nat Protoc. 2015;10(6):823–844. doi:10.1038/nprot.2015.052
16. Shannon P, Markiel A, Ozier O, et al. Cytoscape: a software environment for integrated models of biomolecular interaction networks. Genome Res. 2003;13(11):2498–2504. doi:10.1101/gr.1239303
17. Ashburner M, Ball CA, Blake JA, et al. Gene ontology: tool for the unification of biology. The gene ontology consortium. Nat Genet. 2000;25(1):25–29. doi:10.1038/75556
18. Damian D, Gorfine M. Statistical concerns about the GSEA procedure. Nat Genet. 2004;36(7):663. doi:10.1038/ng0704-663a
19. Harrell FE. (2021). rms: regression modeling strategies. R package version 6.2-0. Available from: https://CRAN.R-project.org/package=rms.
20. Wilkerson MD, Hayes DN. ConsensusClusterPlus: a class discovery tool with confidence assessments and item tracking. Bioinformatics. 2010;26(12):1572–1573. doi:10.1093/bioinformatics/btq170
21. Wimbish RT, DeLuca KF, Mick JE, et al. The Hec1/Ndc80 tail domain is required for force generation at kinetochores, but is dispensable for kinetochore-microtubule attachment formation and Ska complex recruitment. Mol Biol Cell. 2020;31(14):1453–1473. doi:10.1091/mbc.E20-05-0286
22. Mo QQ, Chen PB, Jin X, et al. Inhibition of Hec1 expression enhances the sensitivity of human ovarian cancer cells to paclitaxel. Acta Pharmacol Sin. 2013;34(4):541–548. doi:10.1038/aps.2012.197
23. Sugimasa H, Taniue K, Kurimoto A, Takeda Y, Kawasaki Y, Akiyama T. Heterogeneous nuclear ribonucleoprotein K upregulates the kinetochore complex component NUF2 and promotes the tumorigenicity of colon cancer cells. Biochem Biophys Res Commun. 2015;459(1):29–35. doi:10.1016/j.bbrc.2015.02.043
24. Hu P, Shangguan J, Zhang L. Downregulation of NUF2 inhibits tumor growth and induces apoptosis by regulating lncRNA AF339813. Int J Clin Exp Pathol. 2015;8(3):2638–2648.
25. Jiang Y, Wang C, Zhou S. Targeting tumor microenvironment in ovarian cancer: premise and promise. Biochim Biophys Acta Rev Cancer. 2020;1873(2):188361. doi:10.1016/j.bbcan.2020.188361
 © 2024 The Author(s). This work is published and licensed by Dove Medical Press Limited. The
full terms of this license are available at https://www.dovepress.com/terms
and incorporate the Creative Commons Attribution
- Non Commercial (unported, 3.0) License.
By accessing the work you hereby accept the Terms. Non-commercial uses of the work are permitted
without any further permission from Dove Medical Press Limited, provided the work is properly
attributed. For permission for commercial use of this work, please see paragraphs 4.2 and 5 of our Terms.
© 2024 The Author(s). This work is published and licensed by Dove Medical Press Limited. The
full terms of this license are available at https://www.dovepress.com/terms
and incorporate the Creative Commons Attribution
- Non Commercial (unported, 3.0) License.
By accessing the work you hereby accept the Terms. Non-commercial uses of the work are permitted
without any further permission from Dove Medical Press Limited, provided the work is properly
attributed. For permission for commercial use of this work, please see paragraphs 4.2 and 5 of our Terms.