
Back to Journals » International Journal of General Medicine » Volume 19

Nasal Microbiota Associated with the Lung Radiomic Features in Asthma
Authors Hua L, Bai W, Wang X, Wang D, Guo M, Chen L, Liu B  , Wang Y, Zhang S, Fang X, Yang Z, Qin L, Xie M
Received 7 April 2026
Accepted for publication 6 July 2026
Published 16 July 2026 Volume 2026:19 614976
DOI https://doi.org/10.2147/IJGM.S614976
Checked for plagiarism Yes
Review by Single anonymous peer review
Peer reviewer comments 2
Editor who approved publication: Professor Reynold Panettieri Jr
Lijuan Hua,1 Wenxue Bai,1 Xuezhao Wang,1 Dongyuan Wang,1 Mengyao Guo,1 Lirong Chen,1 Bingyi Liu,1 Yi Wang,1 Shengding Zhang,2 Xiaoyu Fang,3 Zhenyu Yang,4 Lu Qin,5 Min Xie6
1Department of Respiratory and Critical Care Medicine, Key Laboratory of Pulmonary Diseases of Health Ministry, Tongji Hospital, Tongji Medical College, Huazhong University of Science and Technology, Wuhan, Hubei, 430030, People’s Republic of China; 2Department of Pulmonary and Critical Care Medicine, The First Affiliated Hospital, Jiangxi Medical College, Nanchang University, Nanchang, Jiangxi, 330006, People’s Republic of China; 3Department of Emergency, The Second Affiliated Hospital of Guangzhou Medical University, Guangzhou, Guangdong, 510260, People’s Republic of China; 4Department of Rheumatology and Immunology, The Second Clinical Medical College, Jinan University (Shenzhen People’s Hospital), Department of Medical Treatment, Shenzhen, Guangdong, 518020, People’s Republic of China; 5Department of Respiratory and Critical Care Medicine, The First Affiliated Hospital of Zhengzhou University, Zhengzhou, Henan, 450052, People’s Republic of China; 6Department of Emergency and Critical Care Medicine, Tongji Hospital, Tongji Medical College and State Key Laboratory for Diagnosis and Treatment of Severe Zoonotic Infectious Disease, Huazhong University of Science and Technology, Wuhan, Hubei, 430030, People’s Republic of China
Correspondence: Min Xie, Department of Emergency and Critical Care Medicine, Tongji Hospital, Tongji Medical College and State Key Laboratory for Diagnosis and Treatment of Severe Zoonotic Infectious Disease, Huazhong University of Science and Technology, Wuhan, Hubei, 430030, People’s Republic of China, Email [email protected]
Purpose: This study aims to characterize the nasal lavage fluid (NLF) microbiota in asthma and explore its relationship with lung radiomic features.
Patients and Methods: We collected NLF from 39 participants (12 controls and 27 asthma) for 16S rRNA gene sequencing. Lung radiomics of asthma were analyzed manually and with NeuLungCARE software. The relationships between microbiota and radiomic features were investigated by correlation and regression analyses. Asthma microbiota was further characterized via Jensen-Shannon Divergence (JSD) clustering.
Results: After adjusting for sex and age, the asthma group had a significantly elevated NLF bacterial load compared with the control group, while the microbial dysbiosis index (MDI) remained comparable between the two groups. The asthma group exhibited significantly elevated NLF bacterial load compared with the controls (P< 0.05). The NLF bacterial load was positively correlated with sputum eosinophil percentage and mucus plugs score (both P< 0.05) in asthma. Linear regression revealed that Shannon index was negatively correlated with the wall area percentage of the first-generation bronchi and the percentage of low attenuation area (LAA%) (both P< 0.05). The Chao index showed significantly negative correlations with forced expiratory volume in 1s (P< 0.05). Two distinct microbiota clusters were further identified by JSD clustering in asthma. Cluster 1 demonstrated significantly higher α diversity indices than Cluster 2, along with significant MDI deviation from the control group (all P< 0.05). Patients in Cluster 1 had a significantly higher prevalence of CT-indicated bronchiectasis, lower LAA%-910, and a higher proportion of exacerbation-prone patients than Cluster 2 (all P< 0.05).
Conclusion: The NLF microbiota correlated significantly with the lung radiomic, functional, and inflammatory markers. It is highly necessary to conduct further prospective research on the impact of NLF microbiota on the lower airway characteristics of asthma patients.
Keywords: asthma, nasal microbiota dysbiosis, lung radiomics, airway and parenchyma abnormalities
Introduction
Asthma is a common chronic respiratory disease with a high global disease burden.1 Optimizing asthma assessment and selecting appropriate biomarkers for phenotyping of heterogeneity are crucial for advancing precision treatment.2 A previous study has employed machine learning to identify key features associated with asthma attacks, highlighting the importance of systemic inflammatory indicators and nutritional status, such as peripheral blood eosinophils, C-reactive protein levels, diet, hip circumference, and standing height.3 In contrast, the upper respiratory tract microbiota, as a key player in local mucosal immunity, may serve as a more promising biomarker for asthma evaluation and local targeted intervention. Upper respiratory tract microbiota have long been implicated in asthma pathogenesis.4,5 Notably, studies indicate that microbial alterations in the nasal cavity, rather than the throat, were more correlated with the development of both childhood and adult asthma.6,7 Distinct nasal microbial signatures and abundance were observed in exacerbated versus non‑exacerbated asthma.8 Furthermore, nasal microbiota exhibits more bacterial genera associated with asthma exacerbations despite inhaled corticosteroid therapy compared to salivary and pharyngeal microbiota, indicating nasal microbiota as a possible biomarker for asthma activity.6
Nasal lavage, a more comfortable and better-tolerated sampling method for participants, has been previously used in researches on the upper respiratory tract microbiota.9,10 Nasal lavage fluid (NLF) provides higher microbial α diversity and evenness, offering a more representative sampling of the nasal microbiome.10 It is reported that nasal lavage was more likely to detect potential pathogens compared with nasopharyngeal swabs.11 Moreover, microbial composition in NLF correlated more robustly with sinonasal mucosal inflammation than nasal swabs.10 Therefore, we turn to NLF as the sample for the study of nasal microbiota.
Computed tomography (CT) provides a non-invasive method for evaluating structural alterations in airways and lung parenchyma in respiratory diseases. Our previous study has demonstrated CT signatures of bronchiectasis, mucus plugs, and quantitative characteristics of the airway and lung parenchyma in asthma.12 Previous researches have linked lower respiratory tract microbial characteristics to radiomic signatures in chronic respiratory diseases such as chronic obstructive pulmonary disease (COPD) and cystic fibrosis (CF).13,14 However, the role of airway microbiota in shaping these radiomic features in asthmatic patients remains unexplored.
The upper airway microbiota influences the dysbiosis of the lower airway microbiome. The nasal cavity, offering a less-invasive sampling site, shows stronger associations with asthma as discussed above. Therefore, this study aims to investigate the association between nasal microbiota and pulmonary CT characteristics in asthma and explore microbial features to facilitate asthma assessment.
Materials and Methods
Study Design and Participants
In this cross-sectional study, we recruited asthmatic patients attending the Department of Respiratory and Critical Care Medicine at Tongji Hospital, Tongji Medical College, Huazhong University of Science and Technology. Hospital non-clinical staff were recruited as healthy controls. The detailed inclusion and exclusion criteria of the participants can be found in the Method section of the Supplementary Materials. Twenty-seven asthmatic patients (asthma group) and 12 healthy controls (control group) were recruited in the study from May 2016 to August 2017. The clinical data of the asthmatic patients, including demographic characteristics, diseases, and medication history, inflammation markers (blood and sputum eosinophil, sputum neutrophil, fraction of exhaled nitric oxide (FENO), and serum total immunoglobulin E (Ig E), and lung function parameters, were measured at the time of NLF sampling Asthma control testing (ACT) score was assessed at enrollment. Patients with an exacerbation history (a worsening of symptoms that required treatment with systemic corticosteroids or hospitalization) over 2 times in the previous year were defined as prone to acute exacerbation.
CT Imaging Evaluation
High-resolution CT (GE Healthcare, USA; Philips, Netherlands; or Toshiba Medical Systems, Japan) of the lung was used for pulmonary image assessment in asthmatic patients. The bronchiectasis and mucus plugs were evaluated manually, referring to our previous research.12 Detailed criteria are provided in the Methods section of the Supplementary Materials. Quantitative parameters of the airway and lung parenchyma were obtained by the NeuLungCARE software (NeulungCare, Version 1.0, Neusoft Medical Systems Co. Ltd, Shenyang, Liaoning, China),15,16 a commercially certified analysis platform that could automatically segment the airway tree and measure the lumen diameter (LD), WT, and wall area percentage (WA%) of the trachea and first to fourth generation bronchi after marking the central line of the lumen (Figure 1A). The percentage of low attenuation area (LAA%) below certain Hounsfield Units of the whole lung was also detected and calculated (Figure 1B). Two experienced radiologists independently assessed the images. Any discrepancies in their interpretations were resolved through consensus to ensure the reliability of the results.
 |
Figure 1 The lung radiomic features in asthma. (A) Computed tomography reconstructed image of the airway tree with the central line of the lumen marked. The white, red, yellow, blue, and green line marks the trachea and first to fourth generation bronchi of the lung, respectively. The shared lumen is not calculated. (B) indicates the segmentation of low-density attenuation areas below −950 (yellow) and −910 (red) Hounsfield Units. Bronchiectasis features on lung computed tomography imaging of asthma were marked. The red arrows represented (C) the partial noncontinuous, central distributed bronchiectasis in the right upper lobe, (D) the diffuse continuous, peripheral distributed bronchiectasis in the left upper lobe, as well as (E) the partial noncontinuous, peripheral distributed bronchiectasis in the left lower lobe. |
NLF Collection and Processing
NLF samples were collected from both the asthmatic patients and healthy controls. Each side of the nasal cavity was instilled with 5 mL of sterile saline twice in turn. The liquid was held in the nasal cavity for 10 seconds every time before being blown into a sterile container and stored at −80 °C. Bacterial DNA was extracted from NLF of the same volume (15mL) using QIAamp DNA Mini Kit (Qiagen, Germany). DNA concentration was quantified with a NanoDrop 2000 spectrophotometer (Thermo Scientific, America). Bacterial load was determined by qPCR (Applied Biosystems, America) with E. coli 16s rRNA as the reference. Bacterial load data are expressed as a logarithm of copy number (copies/μL). The amplicon library was constructed by targeting variable region 4 (V4) of the 16S rRNA gene on the Illumina HiSeq sequencing platform. Paired-end (PE) sequencing was applied with a sequencing read length of 250bp. The primer of the V4 region was 515F: GTGCCAGCMGCCGCGG. The reverse was 806R: GGACTACHVGGGTWTCTAAT. All sample collection and processing procedures were carried out by two experienced operators, and the containers and reagents were sterilized to prevent sample contamination. Sample processing and sequencing were completed in the same batch, using the same reagent lot and equipment to minimize batch effects.
Bioinformatics and Statistical Analysis
The amplicon sequences were filtered with fastp (version 0.19.6) and merged with FLASH (version 1.2.11) to get the quality-controlled sequences. Sequences denoising was performed using DADA2 plugin in the Qiime2 (version 2020.2) pipeline,17–20 and the amplicon sequence variant (ASV) representative sequences and abundance information were obtained. Bacterial ASV representative sequences were taxonomically classified using Silva138.2/16s (https://www.arb-silva.de/documentation/release-1382/), with updated taxonomic annotations provided in Table S1. Any ASV annotated as mitochondrial DNA or chloroplast DNA (originating from human host cells or environmental plant debris, respectively) was removed to avoid bias in downstream analyses. Rarefaction was performed according to the minimum sample sequence number to standardize sequencing depth.14 Rarefaction curves were used to assess whether the sequencing depth was adequate. Samples that reached the rarefaction plateau and had complete clinical data were retained for subsequent analyses. Taxonomic analysis, microbial comparison, Spearman correlation analyses, linear regression analyses, Jensen-Shannon Divergence (JSD) cluster stratification for microbial clustering, as well as principal coordinates analysis (PCoA), were conducted on the Majorbio Cloud platform (https://cloud.majorbio.com).
For demographic and clinical parameters, continuous variables were presented as means ± standard deviation or medians with interquartile range and analyzed using the T-test or Wilcoxon rank-sum test, according to their distribution. Categorical variables were compared using the Chi-square test or Fisher’s exact test. Residual diagnostics were performed for linear regression analyses. The Durbin‑Watson (DW) statistic was calculated to assess independence of the residuals. A scatter plot of standardized residuals against standardized predicted values was used to visually check for heteroscedasticity. Outliers were identified using a threshold of absolute studentized residual>3 or a Cook’s distance>1. Further sensitivity analyses were performed to evaluate the robustness of the regression model. False discovery rate (FDR) adjusted P values were calculated for Spearman correlations and linear regression analyses, as well as the comparison of high-dimensional data involving microbial species relative abundance. A P value <0.05 was considered statistically significant. A post-hoc sensitivity power analysis to quantify the minimum effect sizes (Table S2) was performed with 80% power at α=0.05 by G*Power (version 3.1.9.7). Other analyses were performed using IBM SPSS (version 26.0) and GraphPad Prism (version 8.0).
Results
Demographic and Clinical Characteristics of the Subjects
Demographic characteristics were compared between the control group and the asthma group (Table S3). The control group contained a significantly higher proportion of males (75.0% vs 25.9%, P=0.006) and was significantly younger (P<0.001) than the asthma group, with no significant difference in the body mass index (BMI). The detailed clinical features of the asthma patients are shown in Table 1. Patients prone to acute exacerbation accounted for 48.1% (n=13).
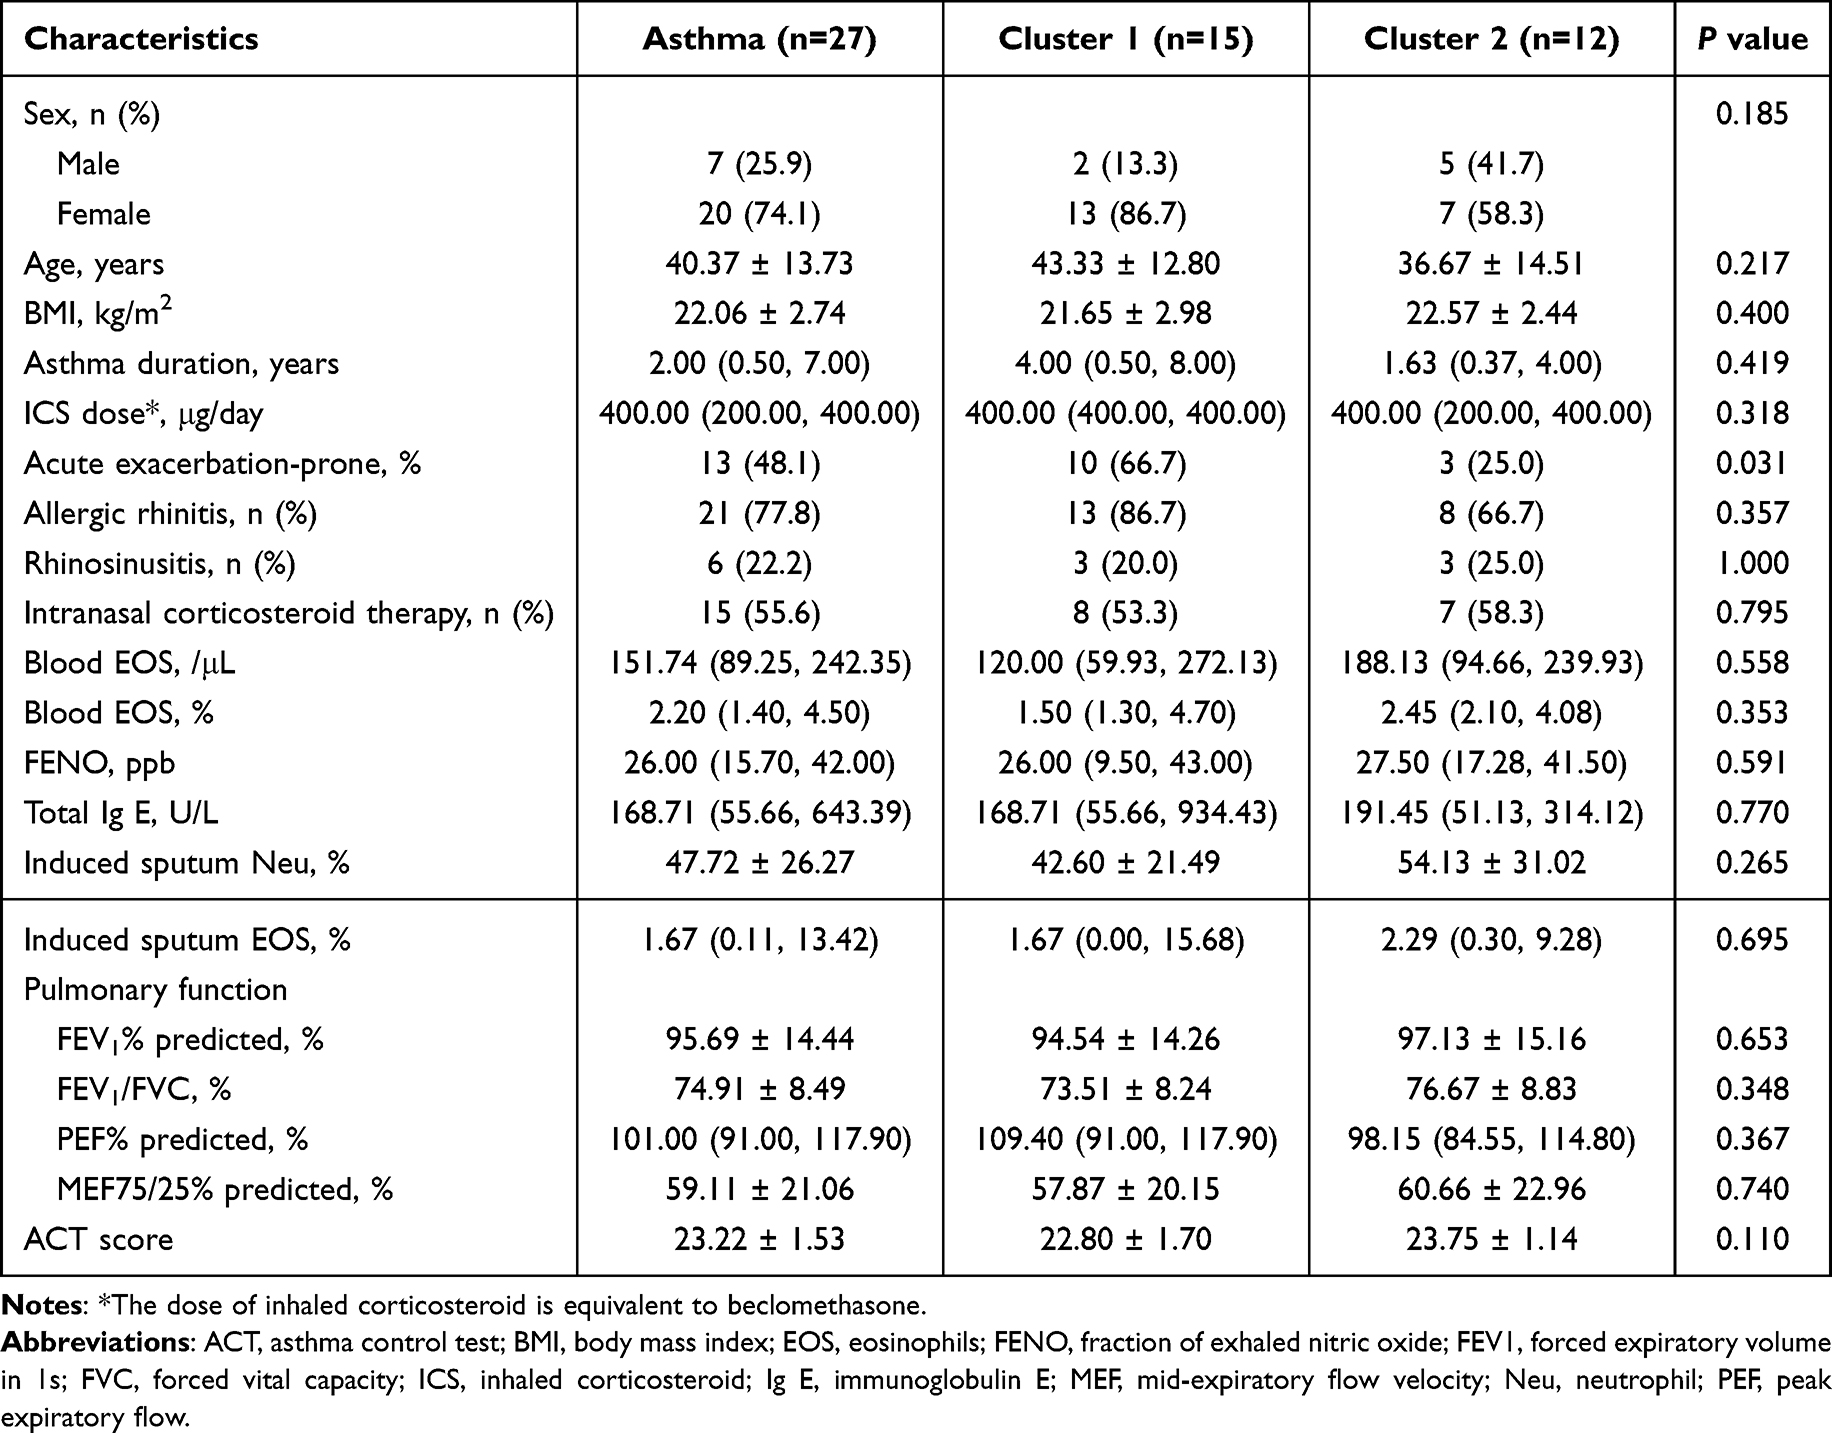 |
Table 1 Comparison of Demographic and Clinical Characteristics of the Asthmatic Patients Based on the Microbial Clustering in Nasal Lavage Fluid |
The lung radiomic features of all the asthma patients are shown in Table 2. Twelve (44.4%) asthmatic patients had CT-indicated bronchiectasis, with an overall BE score of 0.00 (0.00, 2.00). The observed bronchiectasis patterns included partial noncontinuous bronchiectasis (n=8, 29.6%) and continuous bronchiectasis (n=4, 14.8%). The distribution patterns included central type (n=9, 33.3%), peripheral type (n=1, 3.7%), and mixed type (n=2, 7.4%), respectively (shown in Figure 1C–E). Mucus plugs were identified in 13 (48.1%) patients, with the overall MUC score of 0.00 (0.00, 3.00). Based on severity stratification, 25.9% (n=7) were classified as the low mucus plugs group and 22.2% (n=6) as high mucus plugs. The LAA% below −950 and −910 HU (LAA%-950 and LAA%-910) of the whole lung were 0.58 (0.20, 2.59) % and 10.46 (1.68, 25.28) %, respectively. The average LD/BSA, WT/BSA, and WA% of the trachea and first to fourth generation bronchi were also quantified and shown in the table.
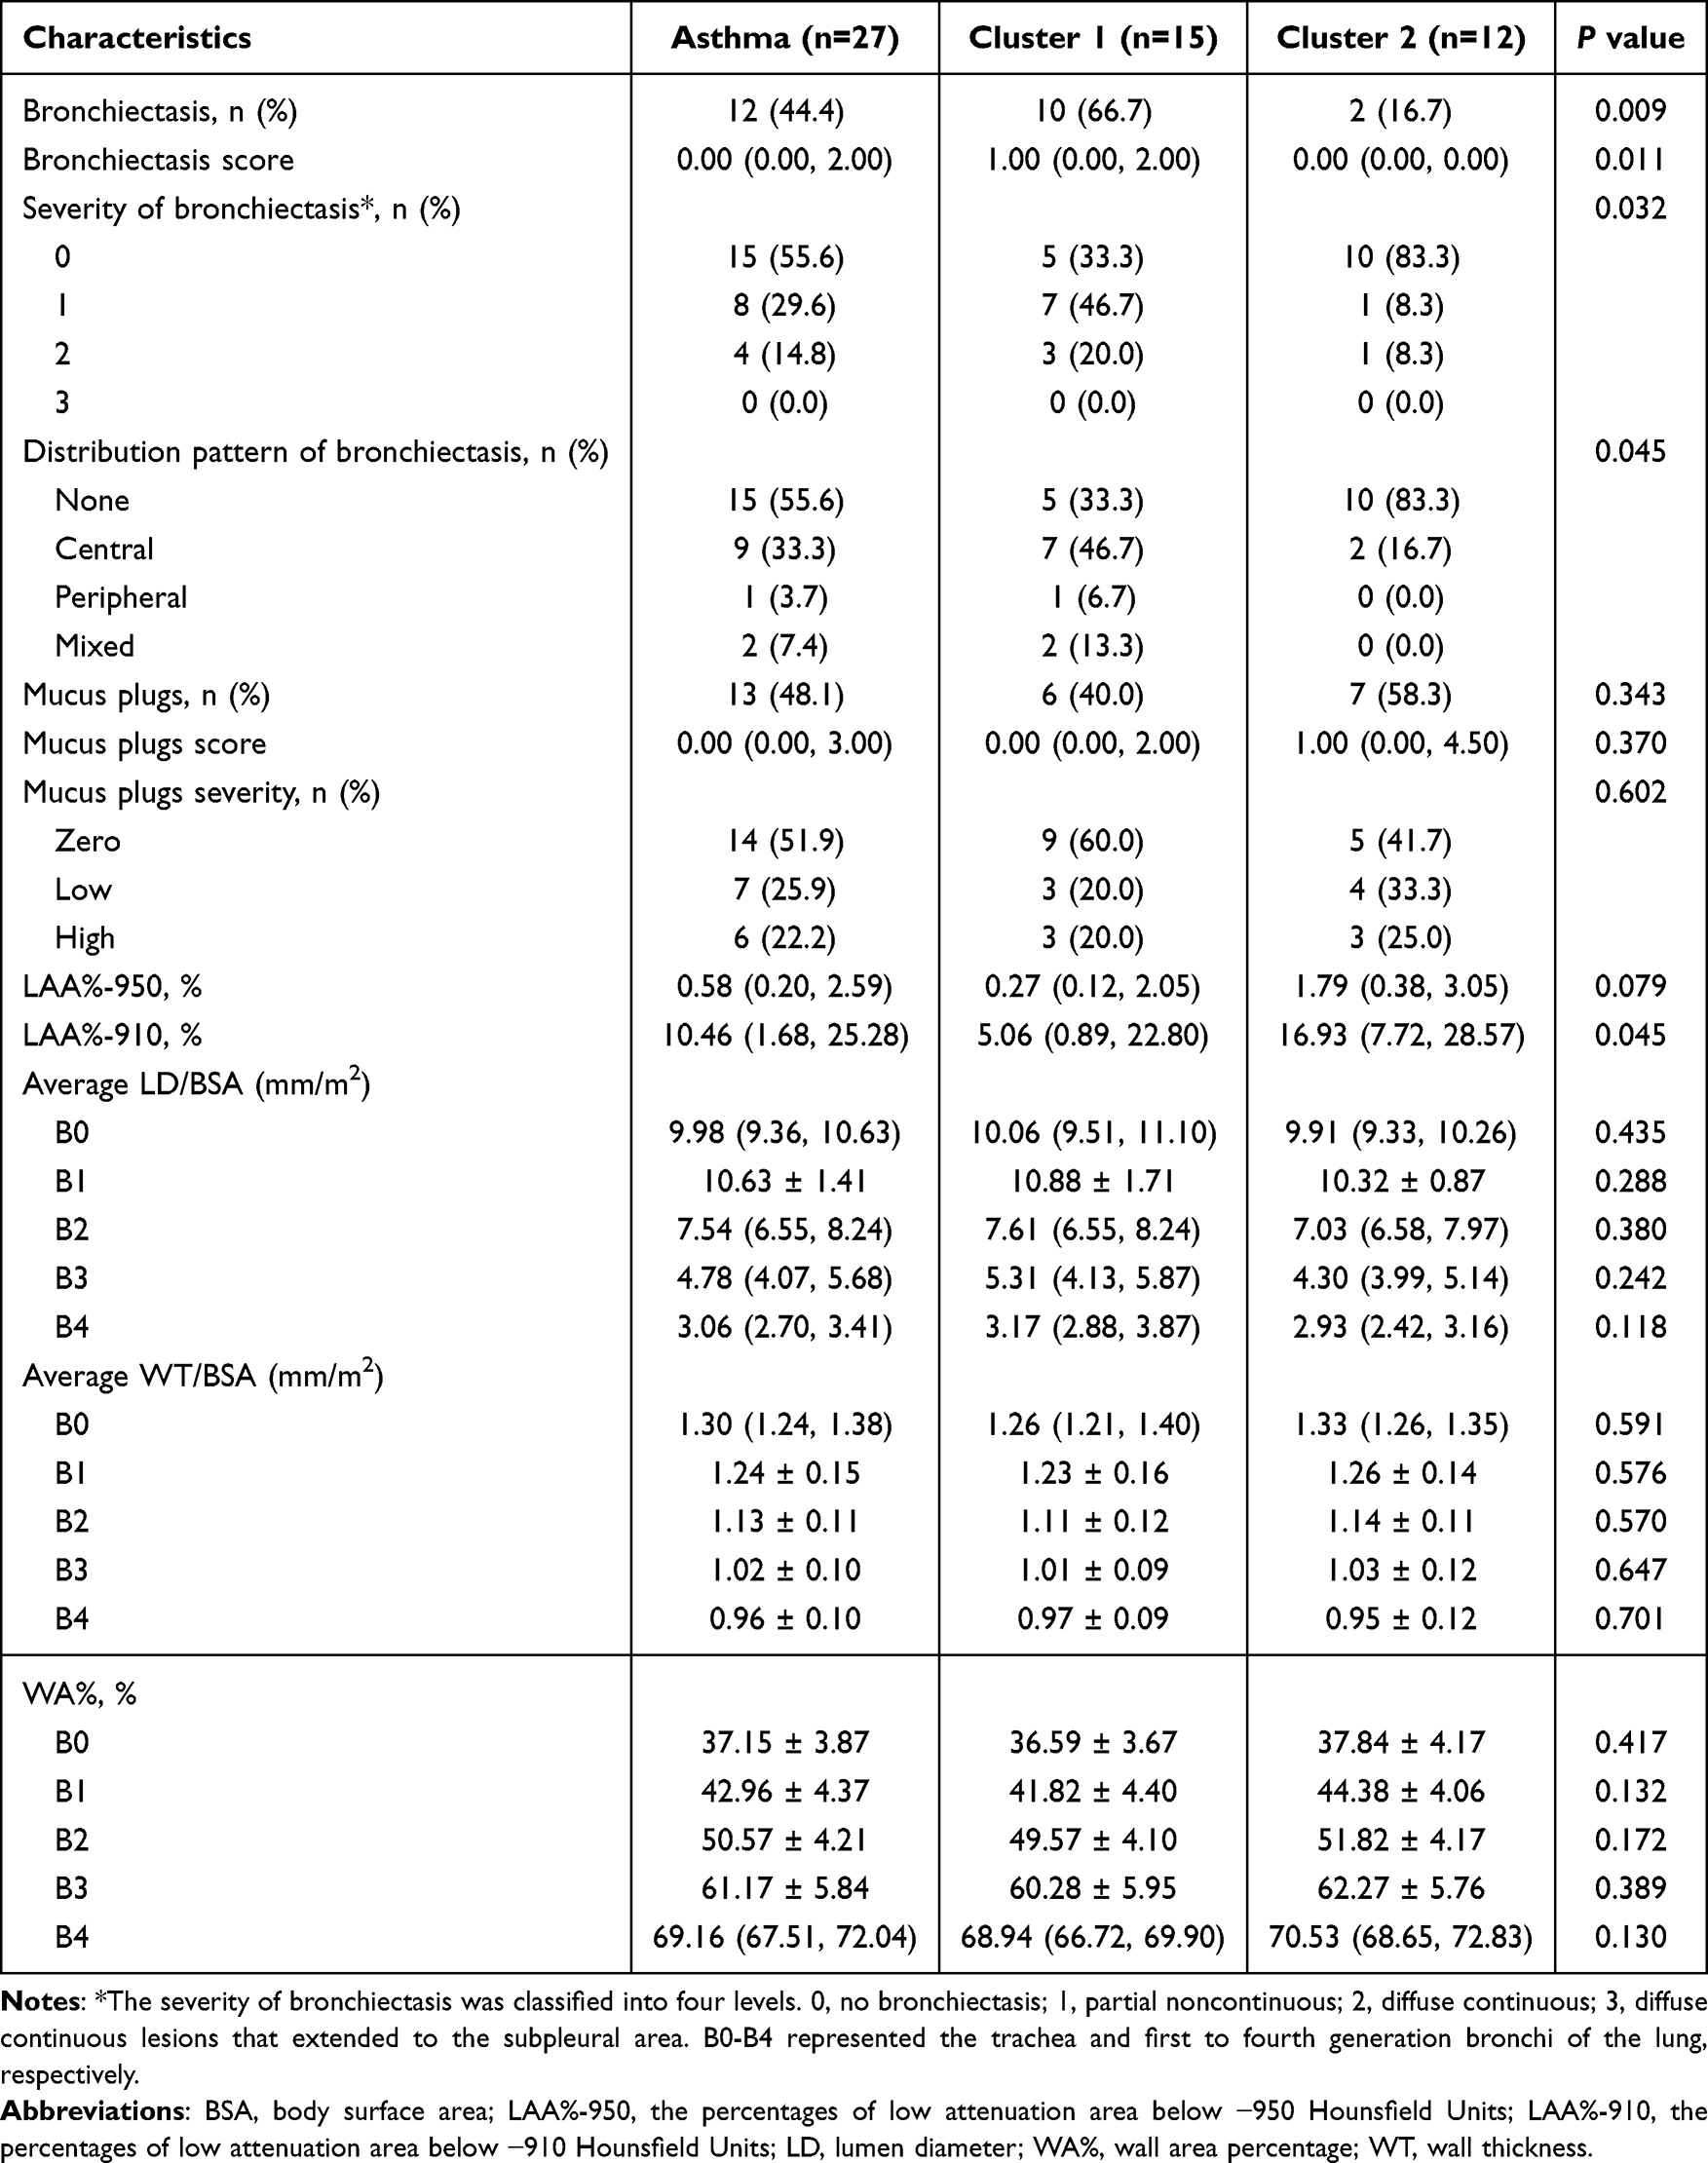 |
Table 2 The Lung Radiomic Features of the Asthmatic Patients Based on the Microbial Clustering in Nasal Lavage Fluid |
Bacterial Microbiota Characteristics of NLF from All the Participants
The sequence number of all 39 samples was rarefied to 7159 sequences according to the minimum sample sequence number. A total of 2071 high-quality bacterial ASV sequences were obtained. Rarefaction curves of the Sobs and Coverage indices indicated adequate sequencing saturation at the ASV level (Figure S1). The top five phyla in relative abundance were Bacillota (formerly known as Firmicutes), Pseudomonadota (formerly known as Proteobacteria), Actinomycetota (formerly known as Actinobacteria), Bacteroidota (formerly known as Bacteroidetes), and Fusobacteriota in both the control and asthma group (Figure 2A and B). The top five genera in NLF from the control group were Staphylococcus, Anaerococcus, Peptoniphilus, Haemophilus, and Streptococcus (Figure 2C), while those were Staphylococcus, Halomonas, Corynebacterium, Anaerococcus, and Streptococcus in the asthma group (Figure 2D). The bacterial load was significantly elevated in NLF from the asthma group compared to those from the control group with age and gender adjusted (P<0.001; Figure 2E and Table S4). No significant difference in α diversity indices (Chao and Shannon indices) of the microbiota was observed between the two groups at the ASV level (both P>0.05; Figure 2F and G). To evaluate the microbial dysbiosis index (MDI), fold change (FC) at the genus level was calculated as the relative abundance ratio of the asthma group and the control group. We identified 75 genera with increased abundance in the asthma group (FC>1) and 58 genera with decreased abundance (FC<1) (Table S5). The MDI was subsequently calculated as the logarithm of [total abundance in genera increased in asthma] over [total abundance in genera decreased in asthma].21,22 The MDI of the control and asthma group was comparable after correcting for gender and age (P>0.05; Figure 2H and Table S4).
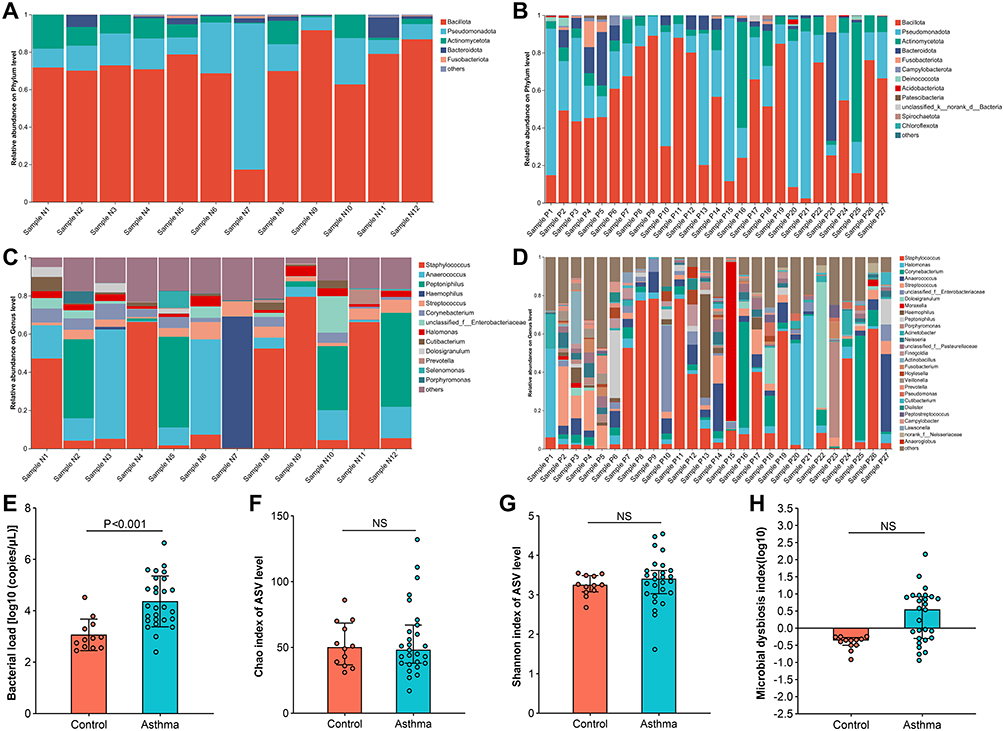 |
Figure 2 Comparison of bacterial community composition features in nasal lavage fluid from the healthy controls and asthmatic patients. (A and B) show the community composition of the healthy controls and the asthmatic patients at the phylum level. (C and D) show the community composition of the healthy controls and the asthmatic patients at the genus level. Comparison of (E) bacterial load, α diversity indices including (F) Chao index and (G) Shannon index, and (H) microbial dysbiosis index between the healthy controls and asthmatic patients. Species with a relative abundance ratio <0.01 at the phylum level and <0.05 at the genus level were included in others. P values were adjusted by gender and age. P value <0.05 was considered statistically significant. Abbreviation: NS, not significant. |
Correlation Between the NLF Microbial Characteristics and Clinical Parameters in Asthmatic Patients
Spearman correlation analyses indicated that there was no significant correlation between blood eosinophil count and bacterial load (r=0.334, P=0.119; Figure 3A), whereas sputum eosinophil percentage demonstrated a significant positive correlation with bacterial load (r=0.488, P=0.030; Figure 3B). No significant correlation was observed between the bacterial load and BE score (r=0.034, P=0.867; Figure 3C). However, the MUC score showed a significantly positive relationship with the bacterial load (r=0.465, P=0.030; Figure 3D). The positive correlation between bacterial load and sputum eosinophil percentage (r=0.430, P=0.028) or MUC score (r=0.497, P=0.014) remained robust in sensitivity analyses that excluded extreme values (Figure S2). By subgroup comparison, bacterial load did not differ significantly between patients with CT-indicated bronchiectasis (BE group) and those without bronchiectasis (non-BE group) (P>0.05; Figure 3E); however, it was significantly higher in patients with mucus plugs (MUC group) compared to those without mucus plugs (non-MUC group) (P=0.005; Figure 3F).
 |
Figure 3 Correlation between the bacterial load in nasal lavage fluid and inflammatory and radiomic indicators of the asthmatic patients. Correlation between the bacterial load and (A) blood EOS (/μL), (B) sputum EOS (%), (C) BE score, and (D) MUC score. Comparison of bacterial load between (E) asthma with bronchiectasis (BE group) and without bronchiectasis (non-BE group) or (F) asthma with mucus plugs (MUC group) and without mucus plugs (non-MUC group) on computed tomography images. FDR-P value <0.05 was considered statistically significant. Abbreviations: BE, bronchiectasis; EOS, eosinophils; MUC, mucus plugs, NS, not significant. |
The linear regression analyses indicated that the Chao index of ASV level showed significant positive correlations with LD-B0/BSA (R2=0.175, β=0.418, P=0.047; Figure 4A) and LD-B4/BSA (R2=0.203, β=0.451, P=0.047; Figure 4C), and a positive correlation trend with LD-B3/BSA (R2=0.110, β=0.331, P=0.091; Figure 4B). In contrast, the Shannon index of ASV level showed significantly negative relationships with WA%-B1 (R2=0.173, β=−0.416, P=0.047; Figure 4D), LAA%-910 (R2=0.172, β=−0.415, P=0.047; Figure 4E), and LAA%-950 (R2=0.222, β=−0.471, P=0.047; Figure 4F). Additionally, the Chao index showed a significantly negative relationship with forced expiratory volume in 1s (FEV1) (R2=0.185, β=−0.430, P=0.047; Figure 4G), and a negative correlation trend with forced vital capacity (FVC) (R2=0.110, β=−0.332, P=0.091; Figure 4H) and mid-expiratory flow velocity (MEF75/25) (R2=0.151, β=−0.389, P=0.058; Figure 4I). The DW statistics were all within the range of 0 to 4, fluctuating around 2, which satisfied the assumption of residual independence. Scatter plots of standardized residuals against standardized predicted values showed an almost random, uniform distribution of points across the horizontal axis, indicating acceptable homoscedasticity (Figure S3). Outliers were identified by Cook’s distance>1 in the regression models of Chao and LD-B0/BSA, Chao and LD-B4/BSA, Shannon and LAA%-950. Further sensitivity analyses by excluding outliers showed that the previously significant correlations of Chao index with LD‑B0/BSA and LD‑B4/BSA became non‑significant (both P>0.05), whereas the regression model of Shannon and LAA%-950 remained significant (R2=0.326, β=−0.571, P=0.002; Figure S4).
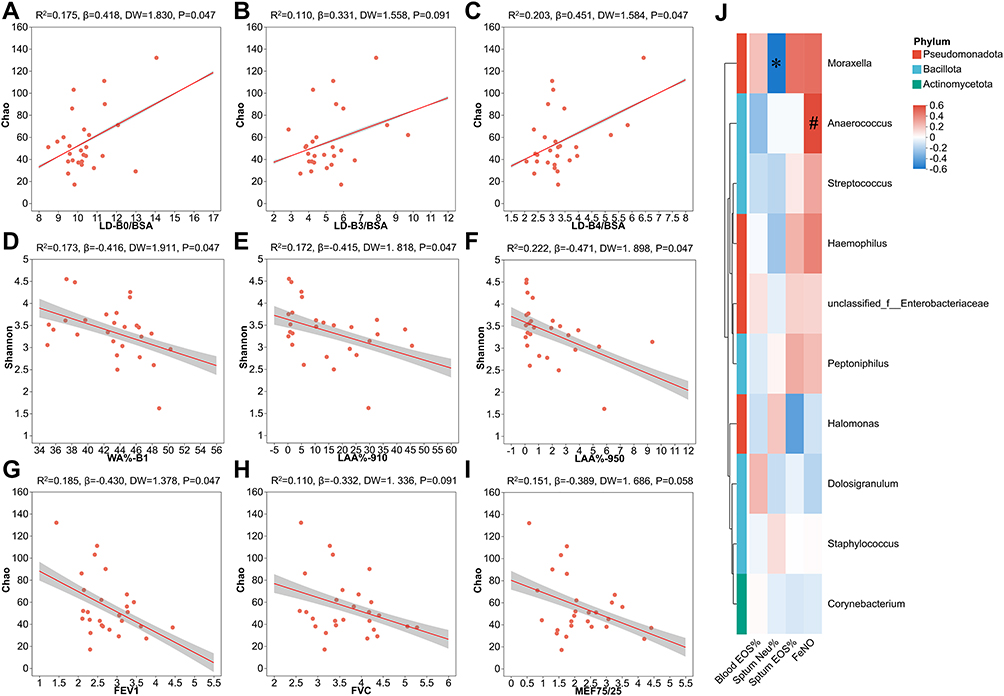 |
Figure 4 Correlation between α diversity of microbial ASV levels in nasal lavage fluid and clinical parameters of the asthmatic patients. Linear regression analyses of Chao index and (A) LD-B0/BSA, (B) LD-B3/BSA, (C) LD-B4/BSA. Linear regression analyses of Shannon index and (D) WA%-B1, (E) LAA%-910, (F) LAA%-950. Linear regression analyses of Chao index and (G) FEV1, (H) FVC, (I) MEF75/25. (J) The correlation heatmap between the relative abundance of the top 10 bacterial genera and inflammatory indicators. Red indicates positive correlation; blue indicates negative correlation. FDR-P value <0.05 was considered statistically significant. *, FDR-adjusted P value <0.05. #, FDR-adjusted P value <0.1. B0-B4 represented the trachea, main bronchus, lobar bronchus, segmental bronchus, and subsegmental bronchus of the lung, respectively. Abbreviations: ASV, amplicon sequence variant; BSA, body surface area; EOS, eosinophils; FENO, fraction of exhaled nitric oxide; FEV1, forced expiratory volume in 1s; FVC, forced vital capacity; LAA%-950, the percentages of low attenuation area below −950 Hounsfield Units; LAA%-910, the percentages of low attenuation area below −910 Hounsfield Units; LD, lumen diameter; MEF, mid-expiratory flow velocity; Neu, neutrophil; WA%, wall area percentage. |
Spearman correlation analyses of the blood and airway inflammation indicators with the top 10 genera in relative abundance showed that Moraxella abundance was negatively correlated with sputum neutrophil percentage (r=−0.596, P=0.041). Conversely, Anaerococcus abundance was in a positive trend with FENO (r=0.548, P=0.062), although this association did not reach statistical significance (Figure 4J).
Clustering Features of NLF Microbiota in Asthmatic Patients
Two clusters were identified in NLF microbiota by JSD cluster stratification. Cluster 1 comprised 15 samples, while Cluster 2 comprised 12 samples (Figure 5A). PCoA based on both unweighted (ANOSIM, R=0.105, P=0.014; Figure 5B) and weighted (ANOSIM, R=0.169, P=0.001; Figure 5C) UniFrac distances revealed a significant difference in species composition among the healthy control and the two clusters at the ASV level.
 |
Figure 5 Community composition characteristics of two bacterial clusters in nasal lavage fluid from asthmatic patients. (A) Jensen-Shannon Divergence cluster stratification at genus level. Principal coordinates analysis based on (B) unweighted and (C) weighted UniFrac distances at the ASV level. Comparison of (D) bacterial load, α diversity indices including (E) Chao index and (F) Shannon index, and (G) microbial dysbiosis index among the healthy controls and two bacterial clusters. Species differences between the two bacterial clusters at the (H) phylum and (I) genus level. Data showed the top 10 species in relative abundance with an FDR-adjusted P value<0.1. Abbreviations: ASV, amplicon sequence variant, NS, not significant. |
There was no significant difference in bacterial load between the two clusters (P>0.05; Figure 5D). Both the Chao and Shannon indices were significantly higher in Cluster 1 than in Cluster 2 (both P<0.05; Figure 5E and F). After correcting for gender and age, Cluster 1 displayed a significantly higher MDI compared to the control group (P=0.016), while Cluster 2 showed no significant difference from the control group (Figure 5G and Table S6). Comparison of species relative abundance revealed that Cluster 1 showed a significantly lower abundance of Bacillota but significantly higher abundances of Bacteroidota and Fusobacteriota (all FDR-adjusted P<0.05) at the phylum level. In addition, several phyla with low relative abundance (Campylobacterota, Patescibacteria, and Spirochaetota; all FDR-adjusted P<0.1) showed an elevated trend in Cluster 1 compared with Cluster 2 (Figure 5H). At the genus level, Cluster 1 showed a significantly lower abundance of Staphylococcus and higher abundance of norank_f__Prevotellaceae (both FDR-adjusted P<0.05), while the abundances of Capnocytophaga showed an elevated trend in Cluster 1 (FDR-adjusted P<0.1) (Figure 5I). Demographic, clinical, and radiomic characteristics of the patients in the two clusters are summarized in Tables 1 and 2. No significant differences were found between clusters regarding gender, age, BMI, course of asthma, history of nasal diseases, inflammatory indicators, lung function parameters, and ACT score at enrollment (all P>0.05). However, the proportion of patients prone to acute exacerbation was significantly higher in Cluster 1 (10 (66.7%) vs 3 (25.0%), P=0.031; Figure 6A). Lung CT imaging assessment revealed significantly higher proportions of bronchiectasis (10 (66.7%) vs 2 (16.7%), P=0.009) and higher BE score (1.00 (0.00, 2.00) vs 0.00 (0.00, 0.00), P=0.011; Figure 6B) in Cluster 1 compared to Cluster 2. Significant differences were also observed in bronchiectasis severity and distribution patterns, with Cluster 1 showing more frequent partial noncontinuous and centrally distributed bronchiectasis in Cluster 1 (all P<0.05; Figure 6C and D). No differences were found between clusters in the prevalence of mucus plugs, MUC score, or mucus plug severity (all P>0.05). The LAA%-910 was significantly lower in Cluster 1 than in Cluster 2 (5.06 (0.89, 22.80) % vs 16.93 (7.72, 28.57) %, P=0.045; Figure 6E). Similarly, the LAA%-950 was also lower in Cluster 1 compared to Cluster 2, with the difference approaching statistical significance (0.27 (0.12, 2.05) % vs 1.79 (0.38, 3.05) %, P=0.079; Figure 6F). No significant differences were found between clusters for average LD/BSA, WT/BSA, or WA% of the trachea and first to fourth bronchi (all P>0.05).
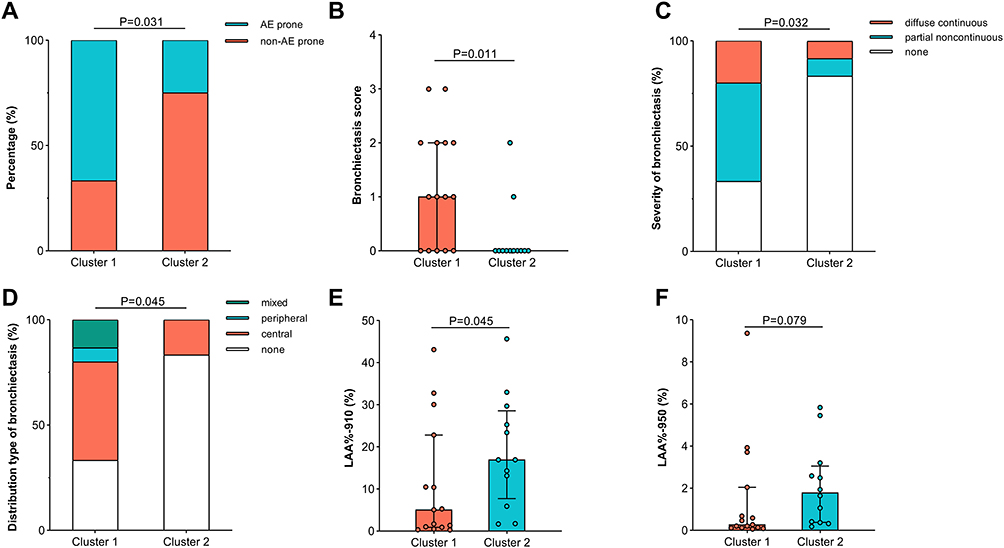 |
Figure 6 Characteristics comparison between two bacterial clusters. Comparison of (A) the percentages of patients prone to acute exacerbation, (B) bronchiectasis score, (C) severity, and (D) distribution pattern, (E) LAA%-910, and (F) LAA%-950 between Cluster 1 and Cluster 2. AE, acute exacerbation; LAA%-950, the percentages of low attenuation area below −950 Hounsfield Units; LAA%-910, the percentages of low attenuation area below −910 Hounsfield Units. |
Discussion
In this exploratory study, no significant differences were observed in the predominant NLF microbiota composition or α diversity between asthmatics and healthy controls. However, the asthma group exhibited significantly higher bacterial load. Bacterial load and specific bacterial genera showed significant correlation with airway inflammation indicators in the asthma group. Bacterial load was significantly elevated in patients from the MUC group. In addition, the microbial α diversity indices closely correlated with CT-quantified airway and lung parenchymal characteristics (WA%-B1, LAA%). Two distinct microbial clusters were further identified in the asthma group. Cluster 1, characterized by increased α diversity indices (Chao and Shannon) and elevated MDI, was associated with a higher prevalence of CT-indicated bronchiectasis, lower LAA%, and more exacerbation-prone patients. These preliminary findings imply that the nasal microbiota could be a valuable subject for future investigations into asthma-related pulmonary pathophysiology and disease control.
The dominant phyla in the nasal microbiota of adult asthma found in our study aligned with previous reports.8,9 However, Chen et al reported significantly lower Chao and Shannon indices in NLF from patients with asthma or asthma combined with allergic rhinitis compared to controls, contradicting our finding of comparable α diversity indices between asthmatic patients and controls.9 This discrepancy may stem from differences in participant characteristics, detection techniques, and geographic and environmental factors. Another study on nasopharyngeal swabs microbiota also reported no diversity differences between young or elderly asthma and non-asthmatics,5 which may explain the comparable diversity observed in our study despite age differences between groups. Alterations in the FC values of many low-abundance genera resulted in an obviously elevated MDI in the asthma group. However, this elevation disappeared after correcting for gender and age. The results of the multiple linear regression analysis suggested that age seemed to have a significant impact on MDI. Previous studies have shown that age significantly influences airway and nasal microbiome composition. It’s reported that aging was associated with altered relative abundance of key bacterial phyla in the airway microbiome, as well as shifts in nasal community state types in adults.23,24 These age-related compositional changes may collectively contribute to a less stable microbial ecosystem, thereby increasing the susceptibility to dysbiosis.
The airway microbiota has previously been associated with asthma inflammatory phenotypes. Wang et al reported that induced sputum dominated by Faecalibacterium and Bacteroides was associated with reduced eosinophils but increased neutrophils in asthma.25 Additionally, sputum microbial diversity correlated negatively with neutrophil percentage, with neutrophilic asthma showing lower diversity and higher dissimilarity than eosinophilic asthma.26 These findings suggest that lower airway microbiota directly influence the local inflammatory environment. Given that lower airway microbiota often originate from the upper airway via mucosal dispersion or microaspiration,27 upper airway microbiota may also modulate lower airway inflammation in asthma. In our study, the NLF bacterial load positively correlated with sputum eosinophil percentage, while Moraxella abundance showed a negative correlation with sputum neutrophil percentage in asthma. This aligns with previous reports linking nasal Moraxella abundance to blood and BALF eosinophilic inflammation in atopic asthma.28 However, whole-genome sequencing identified greater Moraxella catarrhalis abundance in the lower airways of neutrophilic asthma patients, correlating positively with sputum neutrophils.29 These discrepancies may arise from differences in anatomical sites, microbial interactions, or patient characteristics. For a small-sample exploratory study, the currently discovered potential associations between upper airway microbiota and lower airway inflammation should be interpreted cautiously. However, the findings suggest that further investigation into the upper airway microbiota as a potential less‑invasive tool for asthma phenotyping is warranted.
Our previous study established correlations between CT imaging phenotypes and clinical characteristics, therapeutic response, as well as type 2 inflammation characteristics of asthma.12 In the present study, we further explore the correlation between upper respiratory tract microbiota features and the CT features of asthma. We observed that patients with CT‑identified mucus plugs had significantly higher NLF bacterial load, which was positively correlated with mucus plug scores. Excessive mucus secretion is generally attributed to type 2 inflammation‑induced epithelial damage and goblet cell hyperplasia.30 We reported the finding that bacterial load was positively correlated with sputum eosinophil levels. Based on these correlations, we hypothesize that the NLF microbiota may interact with airway inflammation and thereby get involved in mucus plug formation. However, the exploratory nature of this study does not allow us to draw causal conclusions. The observed associations and their underlying mechanisms deserve further validation.
In our study, the correlation between the Chao index and bronchial lumen diameter disappeared after sensitivity analysis, suggesting that this association was driven by a few high‑influence cases. In contrast, the significant negative correlation between Chao index and WA% may better suggest a possible association between upper airway microbial diversity and lower airway morphological changes in asthma. Additionally, the Chao index was negatively correlated with FEV1, which might reflect that airway alterations could be accompanied by impaired lung function. For other lung function parameters, FVC and MEF75/25 showed only negative trends with the Chao index, which may be due to the limitation of small sample size. Similarly, the regression analysis of LAA%, especially LAA%-950 and Shannon, remained significant in the sensitivity analysis. However, the obvious increase in the effect size may suggest strong variability of the data. Therefore, further studies with larger sample sizes are still necessary to further confirm the robustness of these correlations. As a marker of parenchymal destruction in asthma, LAA% had been linked to fixed airflow obstruction and FEV1 decline.31 However, one study reported that LAA% correlated negatively with airflow limitation but not with carbon monoxide transfer factor, a more specific emphysema indicator.32 The author explained the phenomenon as hyperinflation rather than emphysematous change. Therefore, the weak negative correlation between LAA% and Shannon index observed in our study may imply a limited impact of NLF microbiota diversity on lung parenchyma in asthma.
The NLF microbiota cluster characterized by higher α diversity contained more exacerbation-prone patients. The finding aligns with previous reports. A positive correlation trend between nasal bacterial α diversity and asthma activity has been observed,8 and a study on COPD similarly reported that a sputum microbiota cluster characterized by higher α diversity and Streptococcus dominance was associated with more frequent exacerbations.14 However, another study observed decreased sputum microbiota diversity in COPD with frequent exacerbations.33 A remarkable stability in sputum and anterior nares bacterial load and diversity, regardless of aggravation or treatment, was reported in bronchiectasis.34,35 These contrasting findings suggest that the relationship between microbial diversity and disease activity may be disease-dependent and niche-specific.27 Lower airway microbial α diversity was decreased in severe asthma compared with healthy controls.29 In conjunction with our finding that increased nasal microbiota α diversity in Cluster 1 was associated with exacerbation-prone patients, we hypothesize that this elevated diversity may reflect underlying microbial compositional perturbations, which could indirectly influence the lower airway microbiota. Consistent with this, the microbial composition of Cluster 1 was demonstrated to have more severe deviation from the control in our study, suggesting that the extent of microbiota dysbiosis may correlate with the exacerbation risk.
Comparison of the composition between the two bacterial clusters revealed that the low-abundance genera, norank_f__Prevotellaceae and Capnocytophaga, were much more prevalent in Cluster 1, whereas Staphylococcus predominated in Cluster 2. Although 16S rRNA sequencing limited taxonomic resolution of norank_f__Prevotellaceae, its family genus Prevotella, has been associated with asthma exacerbations independent of antibiotic use.6 Prevotella is also frequently cultured in sputum and BALF from bronchiectasis patients, with molecular analyses identifying it as a potentially pathogenic anaerobe.36,37 Staphylococcus, a common respiratory commensal, exhibited strain-specific pathogenicity. Staphylococcus aureus could impair airway epithelial defense against Pseudomonas aeruginosa and neutrophil phagocytosis, promoting airway destruction.38,39 In contrast, Staphylococcus epidermidis competitively excludes Staphylococcus aureus from the nasopharyngeal niche and inhibits biofilm formation.40 In our study, both the control and asthma groups showed a relatively high Staphylococcus abundance. Given that the nasal cavity is adjacent to the keratinized epithelium, which is rich in sebaceous glands and favors lipophilic skin colonizers like Staphylococcus,27 we hypothesize that Cluster 2 harbors primarily low-pathogenicity strains. Further strain-level identification is warranted to verify this hypothesis.
This study has several limitations. First, the small sample size reduced statistical power. Post‑hoc sensitivity power analysis indicated that subgroup analyses could detect large effect sizes in our study. However, the observed effect sizes for the primary positive outcomes in our data were small‑to‑moderate, implying insufficient power. Consequently, these findings should be interpreted conservatively. The observed moderate effect sizes in the correlation and linear regression analyses were approaching the minimum detectable effect size, suggesting that these positive findings may provide meaningful signals for future validation. Some of the initially significant correlations turned out to be negative in the sensitivity analysis, indicating insufficient robustness. Thus, future studies with larger sample sizes are required to validate the findings and improve the robustness of the analyses. Second, given the cross-sectional nature of this study, the observed associations cannot establish causal relationships. Future prospective researches and long-term follow-up are needed to clarify temporal relationships. Third, 16S rRNA sequencing provided only genus-level resolution and did not profile fungi, viruses, and microbial interactions. Future research could focus on cross‑kingdom and host‑microbe interactions by applying high‑resolution and multi‑kingdom detection approaches.
Conclusion
Our study found that the bacterial load in NLF of patients with asthma was higher than that of healthy controls. The MDI was comparable after adjusting for gender and age between the two groups. Age seemed to have a significant impact on MDI. NLF microbiota were associated with lower airway inflammation, radiomic features, and lung function in asthma. The microbial cluster characterized by higher diversity and marked dysbiosis was more common in exacerbation-prone patients. These findings provide preliminary evidence that integrating upper airway microbiota with radiomic characteristics may be a direction worth exploring in future asthma research. Further prospective studies are needed to verify the interaction between NLF microbiota and lung radiomics and its application in the assessment of asthma disease control.
Data Sharing Statement
The raw sequence data reported in this paper have been deposited in the Genome Sequence Archive (Genomics, Proteomics & Bioinformatics 2021) in National Genomics Data Center (Nucleic Acids Res 2024), China National Center for Bioinformation / Beijing Institute of Genomics, Chinese Academy of Sciences (GSA: CRA028293), which are publicly accessible at https://ngdc.cncb.ac.cn/gsa. The other datasets used in the current study are available from the corresponding author on reasonable request.
Ethics Approval and Informed Consent
All procedures involving human participants in this study were performed according to the Declaration of Helsinki. Ethical approval was obtained from the Ethics Committee of Tongji Hospital, Tongji Medical College, Huazhong University of Science and Technology (IRB ID: 20150406). All the participants signed written informed consent.
Acknowledgments
We would like to thank every member of our team who provided support for this paper.
Author Contributions
All authors made a significant contribution to the work reported, whether that is in the conception, study design, execution, acquisition of data, analysis and interpretation, or in all these areas; took part in drafting, revising or critically reviewing the article; gave final approval of the version to be published; have agreed on the journal to which the article has been submitted; and agree to be accountable for all aspects of the work.
Funding
The authors disclosed receipt of the following financial support for the research, authorship, and/or publication of this article: This work was supported by the National Natural Science Foundation of China [grant number 82270029].
Disclosure
The authors declare that the research was conducted in the absence of any commercial or financial relationships that could be construed as a potential conflict of interest.
References
1. Papi A, Brightling C, Pedersen SE, et al. Asthma. Lancet. 2018;391(10122):783–15. doi:10.1016/S0140-6736(17)33311-1
2. Wenzel SE. Severe adult asthmas: integrating clinical features, biology, and therapeutics to improve outcomes. Am J Respir Crit Care Med. 2021;203:809–821. doi:10.1164/rccm.202009-3631CI
3. Huang AA, Huang SY. Use of feature importance statistics to accurately predict asthma attacks using machine learning: a cross-sectional cohort study of the US population. PLoS One. 2023;18:e0288903. doi:10.1371/journal.pone.0288903
4. Tang HHF, Lang A, Teo SM, et al. Developmental patterns in the nasopharyngeal microbiome during infancy are associated with asthma risk. J Allergy Clin Immunol. 2021;147:1683–1691. doi:10.1016/j.jaci.2020.10.009
5. Lee JJ, Kim SH, Lee MJ, et al. Different upper airway microbiome and their functional genes associated with asthma in young adults and elderly individuals. Allergy. 2019;74:709–719. doi:10.1111/all.13608
6. Perez-Garcia J, Gonzalez-Carracedo M, Espuela-Ortiz A, et al. The upper-airway microbiome as a biomarker of asthma exacerbations despite inhaled corticosteroid treatment. J Allergy Clin Immunol. 2023;151:706–715. doi:10.1016/j.jaci.2022.09.041
7. Depner M, Ege MJ, Cox MJ, et al. Bacterial microbiota of the upper respiratory tract and childhood asthma. J Allergy Clin Immunol. 2017;139:826–834e813. doi:10.1016/j.jaci.2016.05.050
8. Fazlollahi M, Lee TD, Andrade J, et al. The nasal microbiome in asthma. J Allergy Clin Immunol. 2018;142:834–843e832. doi:10.1016/j.jaci.2018.02.020
9. Chen M, He S, Miles P, et al. Nasal bacterial microbiome differs between healthy controls and those with asthma and allergic rhinitis. Front Cell Infect Microbiol. 2022;12:841995. doi:10.3389/fcimb.2022.841995
10. Chung J, Boutin S, Frey DL, et al. Nasal lavage microbiome, but not nasal swab microbiome, correlates with sinonasal inflammation in children with cystic fibrosis. J Cyst Fibros. 2024;23(2):226–233. doi:10.1016/j.jcf.2023.12.011
11. Gritzfeld JF, Roberts P, Roche L, et al. Comparison between nasopharyngeal swab and nasal wash, using culture and PCR, in the detection of potential respiratory pathogens. BMC Res Notes. 2011;4(1):122. doi:10.1186/1756-0500-4-122
12. Yang Z, Qin L, Qiao J, et al. Novel imaging phenotypes of naïve asthma patients with distinctive clinical characteristics and T2 inflammation traits. Therapeutic Adv Chronic Dis. 2022;13:20406223221084831. doi:10.1177/20406223221084831
13. Taylor SL, Leong LEX, Ivey KL, et al. Total bacterial load, inflammation, and structural lung disease in paediatric cystic fibrosis. J Cyst Fibros. 2020;19:923–930. doi:10.1016/j.jcf.2020.03.008
14. Wang R, Huang C, Yang W, et al. Respiratory microbiota and radiomics features in the stable COPD patients. Respir Res. 2023;24:131. doi:10.1186/s12931-023-02434-1
15. Lin F, Zhang Z, Wang J, et al. AutoCOPD-A novel and practical machine learning model for COPD detection using whole-lung inspiratory quantitative CT measurements: a retrospective, multicenter study. EClinicalMedicine. 2025;82:103166. doi:10.1016/j.eclinm.2025.103166
16. Zhang W, Zhao Y, Tian Y, et al. Early diagnosis of high-risk chronic obstructive pulmonary disease based on quantitative high-resolution computed tomography measurements. Int J Chronic Obstr. 2023;18:3099–3114. doi:10.2147/COPD.S436803
17. Chen S, Zhou Y, Chen Y, et al. fastp: an ultra-fast all-in-one FASTQ preprocessor. Bioinformatics. 2018;34(17):i884–i890. doi:10.1093/bioinformatics/bty560
18. Magoč T, Salzberg SL. FLASH: fast length adjustment of short reads to improve genome assemblies. Bioinformatics. 2011;27:2957–2963. doi:10.1093/bioinformatics/btr507
19. Callahan BJ, McMurdie PJ, Rosen MJ, et al. DADA2: high-resolution sample inference from Illumina amplicon data. Nat Methods. 2016;13(7):581–583. doi:10.1038/nmeth.3869
20. Bolyen E, Rideout JR, Dillon MR, et al. Reproducible, interactive, scalable and extensible microbiome data science using QIIME 2. Nat Biotechnol. 2019;37:852–857. doi:10.1038/s41587-019-0209-9
21. Gevers D, Kugathasan S, Denson LA, et al. The treatment-naive microbiome in new-onset Crohn’s disease. Cell Host Microbe. 2014;15:382–392. doi:10.1016/j.chom.2014.02.005
22. Gunathilake M, Lee J, Choi IJ, et al. Alterations in gastric microbial communities are associated with risk of gastric cancer in a korean population: a Case-Control Study. Cancers (Basel). 2020;13:12. doi:10.3390/cancers13010012
23. Lee SY, Mac Aogáin M, Fam KD, et al. Airway microbiome composition correlates with lung function and arterial stiffness in an age-dependent manner. PLoS One. 2019;14:e0225636. doi:10.1371/journal.pone.0225636
24. Liu CM, Erikstrup LT, Edslev SM, et al. Composition and dynamics of the adult nasal microbiome. Microbiome. 2026;14:38. doi:10.1186/s40168-025-02250-3
25. Wang J, Chai J, Zhang L, et al. Microbiota associations with inflammatory pathways in asthma. Clin Exp Immunol. 2022;52:697–705. doi:10.1111/cea.14089
26. Taylor SL, Leong LEX, Choo JM, et al. Inflammatory phenotypes in patients with severe asthma are associated with distinct airway microbiology. J Allergy Clin Immunol. 2018;141.
27. Man WH, de Steenhuijsen Piters WAA, Bogaert D. The microbiota of the respiratory tract: gatekeeper to respiratory health. Nat Rev Microbiol. 2017;15:259–270. doi:10.1038/nrmicro.2017.14
28. Durack J, Huang YJ, Nariya S, et al. Bacterial biogeography of adult airways in atopic asthma. Microbiome. 2018;6:104. doi:10.1186/s40168-018-0487-3
29. Versi A, Ivan FX, Abdel-Aziz MI, et al. Haemophilus influenzae and Moraxella catarrhalis in sputum of severe asthma with inflammasome and neutrophil activation. Allergy. 2023;78:2906–2920. doi:10.1111/all.15776
30. Aegerter H, Lambrecht BN. The pathology of asthma: what is obstructing our view? Ann Rev Pathol. 2023;18:387–409. doi:10.1146/annurev-pathol-042220-015902
31. Shimizu K, Tanabe N, Oguma A, et al. Parenchymal destruction in asthma: fixed airflow obstruction and lung function trajectory. J Allergy Clin Immunol. 2022;11(1):149. doi:10.1016/j.jaip.2022.04.045
32. Mitsunobu F, Mifune T, Ashida K, et al. Influence of age and disease severity on high resolution CT lung densitometry in asthma. Thorax. 2001;56:851–856. doi:10.1136/thorax.56.11.851
33. Pragman AA, Knutson KA, Gould TJ, et al. Chronic obstructive pulmonary disease upper airway microbiota alpha diversity is associated with exacerbation phenotype: a case-control observational study. Respir Res. 2019;20:114. doi:10.1186/s12931-019-1080-4
34. Cox MJ, Turek EM, Hennessy C, et al. Longitudinal assessment of sputum microbiome by sequencing of the 16S rRNA gene in non-cystic fibrosis bronchiectasis patients. PLoS One. 2017;12:e0170622. doi:10.1371/journal.pone.0170622
35. Broderick DTJ, Regtien T, Ainsworth A, et al. Dynamic upper and lower airway microbiotas in paediatric bronchiectasis exacerbations: a Pilot Study. Front Cell Infect Microbiol. 2021;11:773496. doi:10.3389/fcimb.2021.773496
36. Tunney MM, Einarsson GG, Wei L, et al. Lung microbiota and bacterial abundance in patients with bronchiectasis when clinically stable and during exacerbation. Am J Respir Crit Care Med. 2013;187:1118–1126. doi:10.1164/rccm.201210-1937OC
37. Byun MK, Chang J, Kim HJ, et al. Differences of lung microbiome in patients with clinically stable and exacerbated bronchiectasis. PLoS One. 2017;12:e0183553. doi:10.1371/journal.pone.0183553
38. Armbruster CR, Wolter DJ, Mishra M, et al. Staphylococcus aureus protein a mediates interspecies interactions at the cell surface of pseudomonas aeruginosa. mBio. 2016;7. doi:10.1128/mBio.00538-16
39. Chekabab SM, Silverman RJ, Lafayette SL, et al. Staphylococcus aureus inhibits IL-8 responses induced by pseudomonas aeruginosa in airway epithelial cells. PLoS One. 2015;10:e0137753. doi:10.1371/journal.pone.0137753
40. Iwase T, Uehara Y, Shinji H, et al. Staphylococcus epidermidis Esp inhibits Staphylococcus aureus biofilm formation and nasal colonization. Nature. 2010;465:346–349. doi:10.1038/nature09074
 © 2026 The Author(s). This work is published and licensed by Dove Medical Press Limited. The
full terms of this license are available at https://www.dovepress.com/terms
and incorporate the Creative Commons Attribution
- Non Commercial (unported, 4.0) License.
By accessing the work you hereby accept the Terms. Non-commercial uses of the work are permitted
without any further permission from Dove Medical Press Limited, provided the work is properly
attributed. For permission for commercial use of this work, please see paragraphs 4.2 and 5 of our Terms.
© 2026 The Author(s). This work is published and licensed by Dove Medical Press Limited. The
full terms of this license are available at https://www.dovepress.com/terms
and incorporate the Creative Commons Attribution
- Non Commercial (unported, 4.0) License.
By accessing the work you hereby accept the Terms. Non-commercial uses of the work are permitted
without any further permission from Dove Medical Press Limited, provided the work is properly
attributed. For permission for commercial use of this work, please see paragraphs 4.2 and 5 of our Terms.