Back to Journals » International Journal of Nanomedicine » Volume 13
Nanoscaled and microscaled parallel topography promotes tenogenic differentiation of ASC and neotendon formation in vitro
Authors Zhou KL, Feng B, Wang WB, Jiang YK, Zhang W, Zhou GD ![]() , Jiang T
, Jiang T ![]() , Cao YL, Liu W
, Cao YL, Liu W
Received 3 January 2018
Accepted for publication 28 March 2018
Published 4 July 2018 Volume 2018:13 Pages 3867—3881
DOI https://doi.org/10.2147/IJN.S161423
Checked for plagiarism Yes
Review by Single anonymous peer review
Peer reviewer comments 2
Editor who approved publication: Professor Lei Yang
Kaili Zhou,1,* Bei Feng,2,* Wenbo Wang,1,* Yongkang Jiang,1 Wenjie Zhang,1,3 Guangdong Zhou,1,3 Ting Jiang,4,* Yilin Cao,1,3 Wei Liu1,3
1Department of Plastic and Reconstructive Surgery, Shanghai Key Laboratory of Tissue Engineering, Shanghai Ninth People’s Hospital, Shanghai Jiao Tong University – School of Medicine, Shanghai, People’s Republic of China; 2Shanghai Children’s Medical Center, Shanghai Jiao Tong University – School of Medicine, Shanghai, People’s Republic of China; 3National Tissue Engineering Center of China, Shanghai, People’s Republic of China; 4Department of Burn and Plastic Surgery, Nanchong Central Hospital, the Second Clinical College of North Sichuan Medical College, Nanchong, Sichuan, People’s Republic of China
*These authors contributed equally to this work
Background: Topography at different scales plays an important role in directing mesenchymal stem cell differentiation including adipose-derived stem cells (ASCs) and the differential effect remains to be investigated.
Purpose: This study aimed to investigate the similarity and difference between micro- and nanoscaled aligned topography for inducing tenogenic differentiation of human ASCs (hASCs).
Methods: Parallel microgrooved PDMS membrane and a parallel aligned electrospun nanofibers of gelatin/poly-ε-caprolactone mixture were employed as the models for the study.
Results: Aligned topographies of both microscales and nanoscales could induce an elongated cell shape with parallel alignment, as supported by quantitative cell morphology analysis (cell area, cell body aspect, and cell body major axis angle). qPCR analysis also demonstrated that the aligned topography at both scales could induce the gene expressions of various tenogenic markers at the 7th day of in vitro culture including tenomodulin, collagen I and collagen VI, decorin, tenascin-C and biglycan, but with upregulated expression of scleraxis and tenascin-C only in microscaled topography. Additionally, tenogenic differentiation at the 3rd day was confirmed only at microscale. Furthermore, microscaled topography was confirmed for its tenogenic induction at tissue level as neotendon tissue was formed with the evidence of mature type I collagen fibers only in parallel aligned polyglycolic acid (PGA) microfibers after in vitro culture with mouse ASCs. Instead, only fat tissue was formed in random patterned PGA microfibers.
Conclusion: Both microscaled and nanoscaled aligned topographies could induce tenogenic differentiation of hASCs and micro-scaled topography seemed better able to induce elongated cell shape and stable tenogenic marker expression when compared to nanoscaled topography. The microscaled inductive effect was also confirmed at tissue level by neotendon formation in vitro.
Keywords: microscales and nanoscales, aligned topography, human adipose-derived stem cells, tenogenic differentiation, microscaled PGA fibers
Introduction
Stem cell-based tissue regeneration has become an important research area in the field of stem cell biology and regenerative medicine.1–4 Among the potential therapeutic cell sources, mesenchymal stem cells (MSCs) are the most applicable one, as they are multipotent, easy accessible, and relatively safe,5 which have been widely used in chondrogenic, cardiovascular, respiratory, osteogenic, and musculoskeletal regeneration and other disease treatment.6–11
Regenerative biomaterials are another major area in the field of regenerative medicine, as rapidly developed intelligent materials are capable of exerting active inductive effect on seeded stem cells or on host stem cells recruited into the implanted materials, which usually employs the physical or chemical signals that were integrated into the designed materials.12,13
In recent years, topographical structure has been proved to be one of the important functional signals for inducing stem cell differentiation.14 For example, Ghasemi Hamidabadi et al reported a novel chitosan-intercalated montmorillonite/poly(vinyl alcohol) nanofibrous mesh as a microenvironment for guiding differentiation of human dental pulp stem cells toward neuron-like cells.15 Particularly, the effects of microtopography/nanotopography on cell behavior modulation have been widely reported.16 These examples include nanotopography on induced pluripotent stem neuronal differentiation,17 nanotopography-mediated cell function modulation through nuclear deformation,18 and nanotopography-mediated capture of circulated tumor cells.19
Parallel-aligned topography has been demonstrated as the important signals for inducing tenogenic differentiation20 as well as neurogenic21 and myogenic lineage differentiation.22 Previously, we have performed the investigation of aligned topographical signals on tenogenic differentiation of different cell types using microscaled23,24 and nanoscaled25 models with confirmed inductive effect. However, there was no direct comparative study on the inductive effect between microscaled and nanoscaled models using the same cell type.
This study employed human adipose-derived stem cells (hASCs) as well as previously used microgrooved polydimethylsiloxane membrane23 and electrospun aligned nanofibers25 to investigate the similarity and difference between these two scaled topographical signals for inducing tenogenic differentiation as well as other lineage differentiations.
Materials and methods
Preparation of electrospun nanofibers and its characterization
As previously described,25 for fabrication of electrospun nanofibers, poly(ε-caprolactone) (PCL; molecular weight [MW] =80,000 Da), 2,2,2-trifluoroethanol (TFE; purity ≥99.0%), and poly(ethylene oxide) (PEO; MW >5,000,000 Da) were purchased from Sigma-Aldrich Co. (St Louis, MO, USA). Gelatin (GT) type A (300 Bloom from porcine skin in powder form) was also purchased from Sigma-Aldrich Co. To make the solution for spinning unparallel nanofibers, PCL and GT (50:50 in weight ratio) were dissolved in the acetic-acid-doped TFE solvent system (HAc/TFE: 0.2% v/v) and then mixed for 72 hours at room temperature resulting in a 10% polymer solution (w/v). To make the solution for spinning parallel nanofibers, PCL, GT, and PEO (48:48:4 in weight ratio) were dissolved in the acetic-acid-doped TFE (HAc/TFE: 0.2% v/v) and then mixed for 72 hours at room temperature resulting in a 10.5% polymer ratio (w/v). To collect unparallel nanofibers, unparallel solution was drawn in a syringe and fixed on an injection pump (KDS 100; KD Scientific, Holliston, MA, USA) with a flow rate of 2.0 mL/h. In addition, 13 kV was applied to the stainless steel needle with a high-voltage power supply (TXR1020N30-30; Teslaman, Dalian, People’s Republic of China). A metal plate of 20×20 cm was placed horizontally opposite in a needle tip collector. The distance between the needle and the collector was 13–14 cm. To obtain parallel nanofibers, parallel solution was employed with the distance between the needle and the collector about 8–10 cm and a flow rate of 1.5 mL/h, and the roller was operated at a speed of 800 rpm. In addition, 8 kV was applied to the stainless steel needle. The ready-made GT/PCL nanofibrous membranes were dried in a vacuum oven for 10 days at room temperature to remove residual solvent and sterilized in a vacuum freeze dryer for 24 hours before subsequent uses. Table 1 lists the specific process parameters.
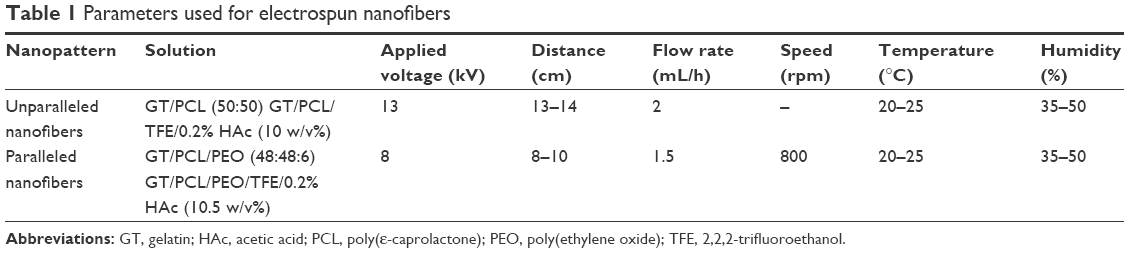 | Table 1 Parameters used for electrospun nanofibers |
Scanning electron microscopic examination
To characterize the topographical structure of electrospun nanofibers, the prepared samples were subjected to gold-coating for better conductivity (BALTEC; Philips, Eindhoven, the Netherlands) and then examined using a scanning electron microscope (SEM; Philips-XL-30) at an accelerating voltage of 15 kV. Nanofibers’ diameters were measured from the SEM images by using ImageJ software. At least 120 fiber segments of each SEM specimen from different images were analyzed.
Preparation of microscaled grooved membrane
The microscaled grooved and smooth membranes were presented as a gift from Dr James Wang from the University of Pittsburgh. The membranes were made of PDMS from silicone elastomer (Dow Corning®, Midland, MI, USA). The microgrooved membrane was used for cell shape control with groove and ridge width of 10 μm and groove depth of 3 μm (Figure 1A).26 Before use, the microgrooved and smooth membranes were sterilized by autoclaving and then coated with 10 ng/mL fibronectin (Roche, Indianapolis, IN, USA), which was dissolved in phosphate-buffered saline (PBS) for 24 hours in order to promote cell adhesion.27 The cells were induced into an elongated cell shape on the microscaled grooved membrane (G group), whereas the cells became spread on smooth membrane (S group).
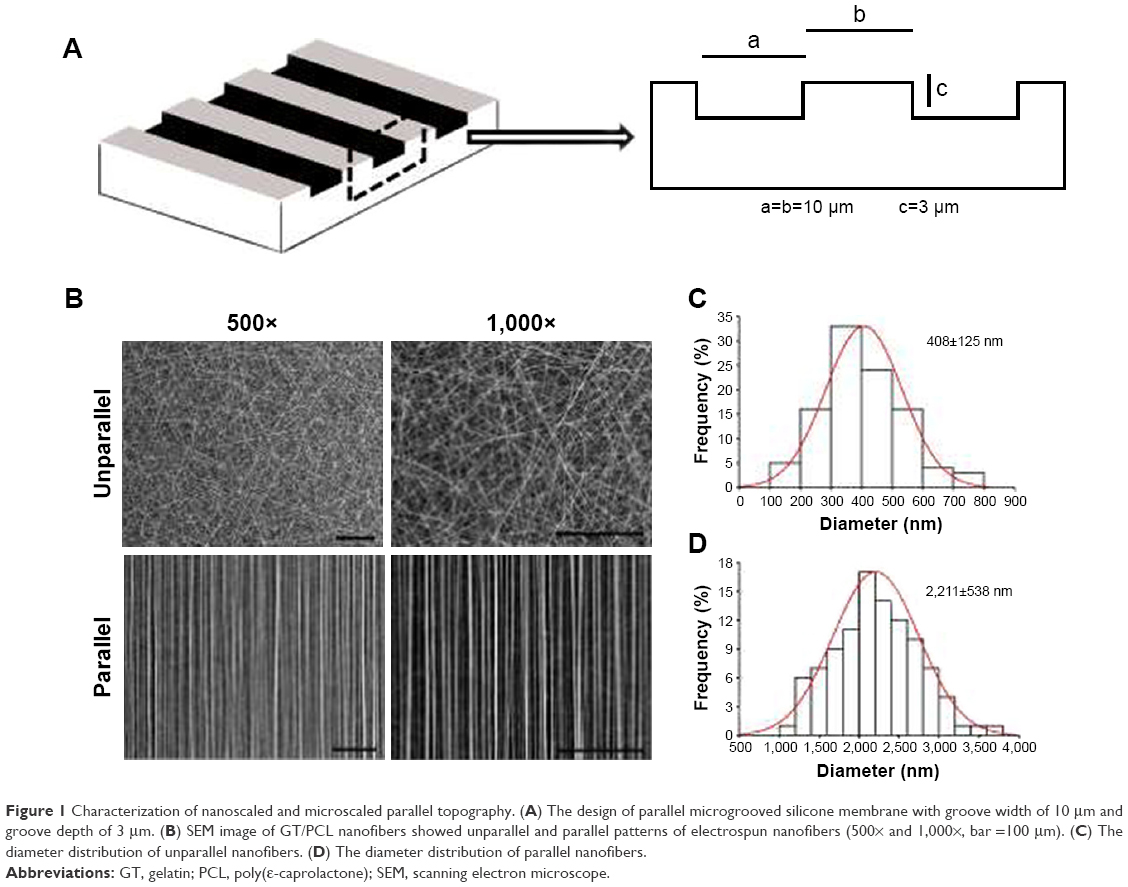 | Figure 1 Characterization of nanoscaled and microscaled parallel topography. (A) The design of parallel microgrooved silicone membrane with groove width of 10 μm and groove depth of 3 μm. (B) SEM image of GT/PCL nanofibers showed unparallel and parallel patterns of electrospun nanofibers (500× and 1,000×, bar =100 μm). (C) The diameter distribution of unparallel nanofibers. (D) The diameter distribution of parallel nanofibers. |
Isolation and culture of mouse adipose-derived stem cells (mASCs)
C57BL/6 mice aged 6–8 weeks were purchased from Shanghai Laboratory Animal Center (Chinese Academy of Sciences, Shanghai, People’s Republic of China) and were used for providing mASCs. All animal experimental protocols were approved by the Animal Care and Experiment Committee of Shanghai Jiao Tong University – School of Medicine. In addition, the animal experiments were performed by following the Animal Experiment Guideline of Shanghai Jiao Tong University – School of Medicine. Briefly, prior to the collection of the adipose tissue, mice were sacrificed by cervical dislocation. Subcutaneous adipose tissues were harvested from the inguinal and armpit areas. The harvested fat tissues were cut into small pieces and digested in 0.1% collagenase (NB4; SERVA, Heidelberg, Germany) in serum-free Dulbecco’s Modified Eagle’s Medium (DMEM; Hyclone, Logan City, UT, USA) with 5 times of volume of the fat tissues at 37°C for 2 hours. The cell suspension was harvested and filtered through a 40-mm nylon filter mesh (BD Falcon, Bedford, MA, USA) to remove tissue residues. The filtrate was centrifuged at 1,500 rpm/min for 5 minutes, and cell pellets were resuspended in DMEM plus 10% fetal bovine serum (FBS; Hyclone) and seeded onto regular flasks (BD Falcon) at a density of 3×10⁵ cells/cm2 for primary culture and 2×10⁴ cells/cm2 for subculture. The medium was changed every 3 days. When reached about 80% confluence, the primary cultured cells were detached with collagenase (400 U/mL in PBS; Worthington Biochemical Corporation, Lakewood, NJ, USA) for 10 minutes at 37°C followed by subculture. Expanded cells at the end of passage 3 were used for the experiments.
Isolation and culture of hASCs
A total of 21 patients aged from 20 to 30 years were involved, and fat tissues collected from three patients were pooled to derive a total of 7 pooled cell samples. Briefly, the fat tissues were donated for research only by the patients who received liposuction procedures at Shanghai Ninth People’s Hospital with written informed consent. The protocol of using human tissue was approved by the Ethics Committee of Shanghai Ninth People’s Hospital. To isolate hASCs, lipoaspirate was soaked in equal volume of 0.25% chloramphenicol solution for 30 minutes, followed by three washes in equal volume of PBS. Then, the fat tissues were digested with equal volume of 0.2% collagenase (dissolved in DMEM plus 10% FBS, SERVA, Germany) at 37°C for 60 minutes to extract hASCs. Afterward, the digested tissue solution was filtered through 40-mm nylon filter (BD Falcon) to remove tissue residues followed by centrifugation. The collected cells were cultured in DMEM (Hyclone) supplemented with 10% FBS (Thermo Fisher Scientific, Waltham, MA, USA) and 1% Antibiotic–Antimycotic (100×, Gibco™, Thermo Fisher Scientific) at a density of 6×10⁵/cm2 and subcultured at the same density. The medium was changed every 3 days. When reached about 80% confluence, cultured primary cells were detached with 0.05% trypsin plus 0.02% EDTA in PBS at 37°C for 30 seconds followed by subculture. Expanded cells of passage 3 were used for the experiments.
F-actin staining
The passage 3 hASCs were seeded on the microgrooved and smooth membranes for 72 hours at a density of 1.5×10³ cells/cm2 to observe the effect of microscaled groove structure on cell shape control. Similarly, the cells were seeded on GT/PCL nanofibrous coated glass cover slips in a 24-well plates at the same density for 1, 3, 5, and 7 days to observe the cell control effect of the parallel nanofibers. Cytoskeletons were visualized by anticellular actin staining using rhodamine phalloidin (Cytoskeleton Inc., Denver, CO, USA). At the desired time points, the cells were fixed in 4% formaldehyde for 10 minutes and permeabilized with 0.5% triton X-100 for 5 minutes, and then incubated in rhodamine phalloidin (100 nM, dissolved in DMSO) for 2 hours. The nuclei were counterstained in DAPI (100 nM, dissolved in ethanol; Sigma-Aldrich Co.) for 1 minute.
Cell morphology analysis
As previously described,23,25 F-actin-stained hASCs that were seeded on both smooth and microgrooved surfaces as well as on both unparallel and parallel nanofibers were, respectively, photographed under a fluorescent microscope (Nikon Corporation, Tokyo, Japan), and the pictures were analyzed with Image-Pro Plus processing software (Version 6.0; Media Cybernetics, Silver Spring, MD, USA) for cell area, cell body aspect (length/width), and cell body major axis angle. For microscaled based cell analysis, a total of 32 cells were examined for each image, and the data of 4 images were collected for each group to generate means and SD. For nanoscaled analysis, 10 cells were examined for each image, and a total of 4 images from each group were analyzed to generate means and SD.
Cell Counting Kit-8 (CCK-8) cell proliferation and cell counting
To understand the effect of topographical structure on cell proliferation, passage 3 hASCs were seeded onto GT/PCL nanofibrous coated glass cover slips in 24-well plates and examined with a CCK-8 assay (Dojindo Molecular Technologies, Kumamoto, Japan). Briefly, a total of 3×10³ cells in 2 mL DMEM were seeded in each well of a 24-well plate. On days 1, 3, 5, and 7, 500 μL DMEM containing 50 μL of CCK-8 solution was added to each well and incubated for 2 hours at 37°C. Then, the medium was harvested for measuring the optical density at a wavelength of 450 nm using a microplate reader (Varioskan Flash; Thermo Fisher Scientific) according to the protocol of CCK-8 assay. The test was performed in quadruplicate and repeated in three cell samples.
Cell counting was also employed to examine the effect of microscaled groove on cell proliferation; hASCs were also seeded onto the microgrooved and smooth membranes at a density of 1.5×10³ cells/cm2, cultured for 1, 3, 5, and 7 days, respectively, and then harvested and counted, respectively. The assay was repeated in three cell samples.
RNA isolation and real-time quantitative PCR (qPCR)
Total RNAs were respectively extracted from hASCs cultured on microscaled grooved (G) and smooth (S) membranes as well as from hASCs cultured on unparallel and parallel nanofibers using TRIzol® reagent (Invitrogen, Carlsbad, CA, USA), and 2 μg total RNA per sample was used to synthesize complementary DNA (cDNA) with avian myeloblastosis virus reverse transcriptase (Promega Corporation, Fitchburg, WI, USA). For qPCR analysis, cDNA was amplified using a Power SYBR Green PCR master mix (Applied Biosystems, Foster City, CA, USA) in a real-time thermal cycler (Mx3000PTM real-time PCR System; Stratagene, La Jolla, CA, USA). qPCR was performed with a protocol of 95°C for 10 minutes followed by 40 cycles (30 seconds at 95°C, 30 seconds at 58°C, and 45 seconds at 72°C) and terminated by 5-minute extension at 72°C. Table 2 lists the primers for RT-qPCR analysis. The Ct values were analyzed by the Mx3000PTM Real Time PCR System Software Package (La Jolla, CA, USA), and gene expression was normalized to the housekeeping genes of human GAPDH by using the 2 −ΔΔC(t) method. Experiments were performed in triplicate for each sample and were repeated in three samples.
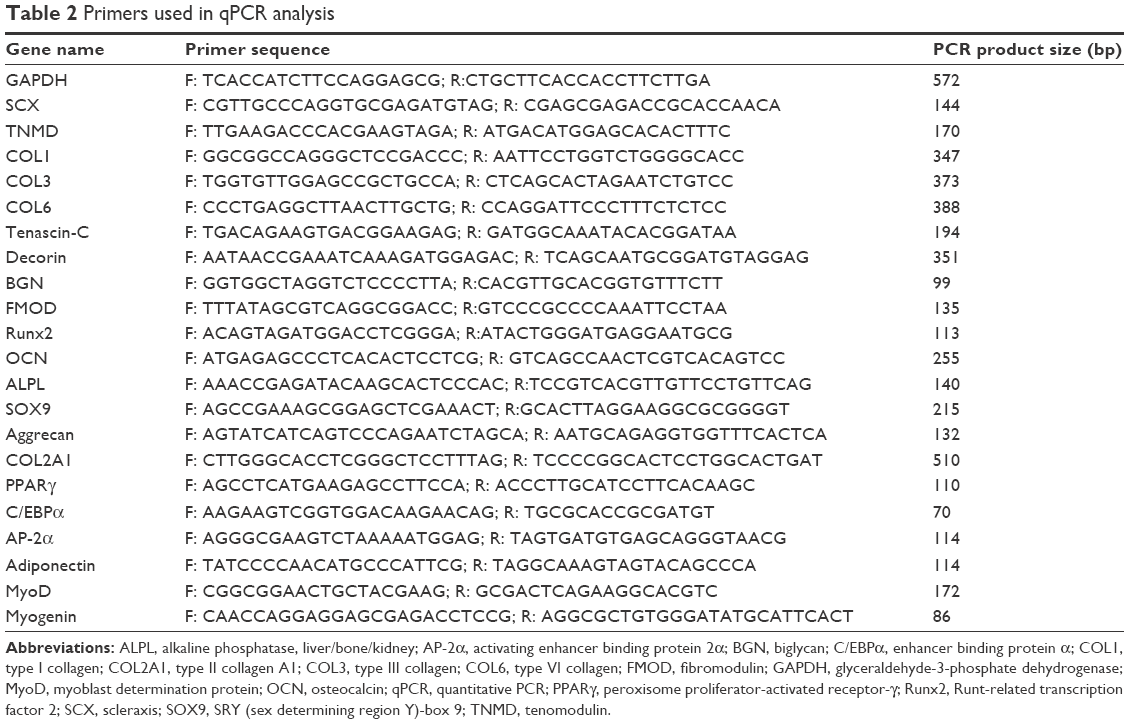 | Table 2 Primers used in qPCR analysis |
Preparation of microscaled polyglycolic acid (PGA) fiber scaffold
As previously described,28 a stainless steel spring of U-shape was employed to provide the constant strain to make the parallel-aligned microscaled fibrous scaffold. Briefly, a total of 100 mg of long PGA fibers (with a diameter of 20–30 μm; Shanghai Ju Rui Biomaterials Co. Ltd., Shanghai, People’s Republic of China) was arranged to a cord with a length of 4.5 cm and a diameter of 0.8 cm, and the fibers were then fixed to hooks at their two ends and loaded on the spring (Figure 2A). As a control, the same amount of longer PGA fibers in random orientation was loosely arranged to a cord (also 4.5 cm in length and 0.8 cm in diameter) as opposed to the experimental group. Before cell seeding, the PGA scaffold was sterilized with immersion of iodophor for 30 minutes and then repeated washing in 75% ethanol. Afterward, the scaffold was immersed in 75% ethanol again for 1 hour followed by repeated washing in PBS. Then, the scaffold was preincubated in DMEM supplemented with 10% FBS at 37°C overnight in an incubator.
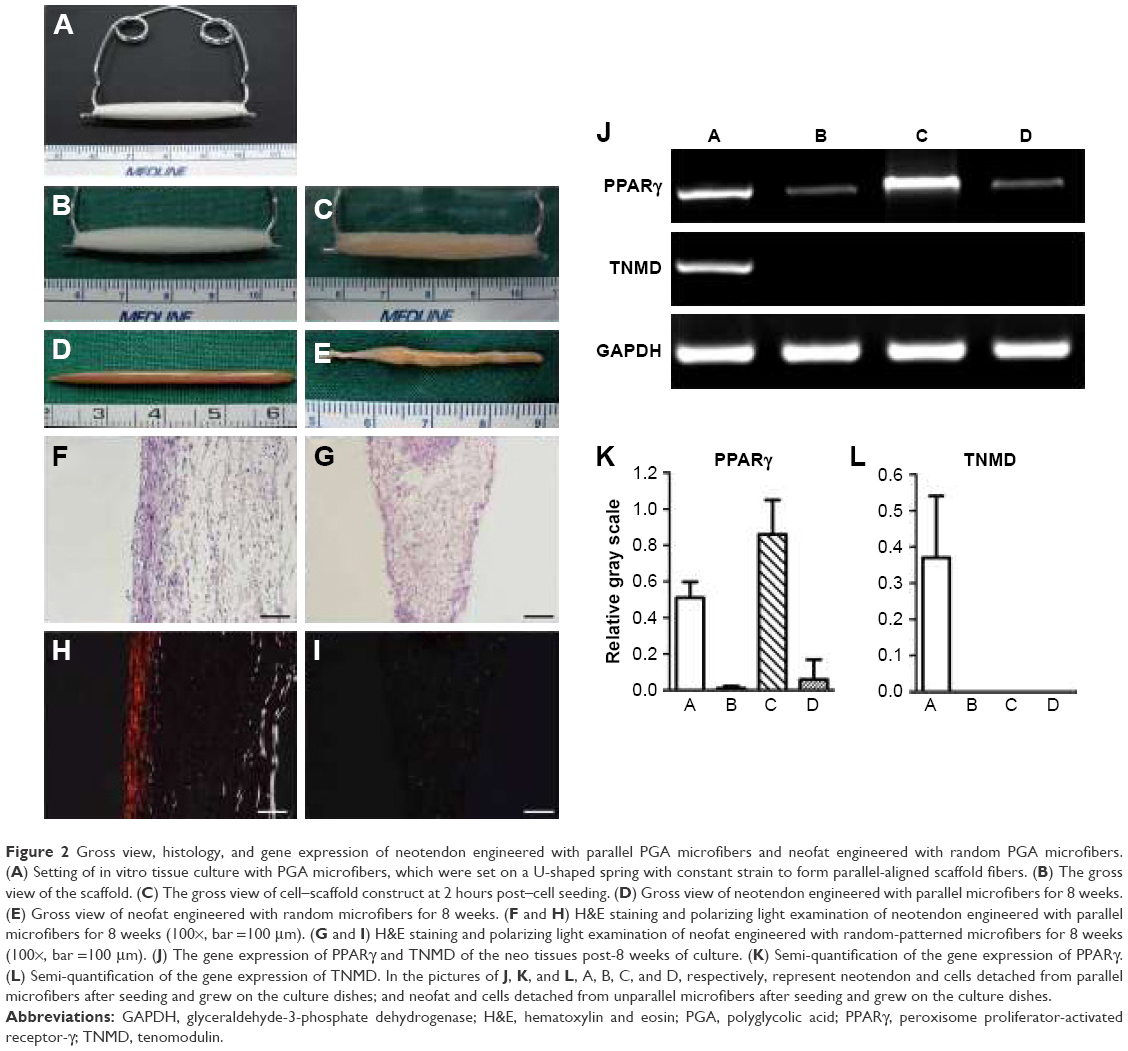 | Figure 2 Gross view, histology, and gene expression of neotendon engineered with parallel PGA microfibers and neofat engineered with random PGA microfibers. (A) Setting of in vitro tissue culture with PGA microfibers, which were set on a U-shaped spring with constant strain to form parallel-aligned scaffold fibers. (B) The gross view of the scaffold. (C) The gross view of cell–scaffold construct at 2 hours post–cell seeding. (D) Gross view of neotendon engineered with parallel microfibers for 8 weeks. (E) Gross view of neofat engineered with random microfibers for 8 weeks. (F and H) H&E staining and polarizing light examination of neotendon engineered with parallel microfibers for 8 weeks (100×, bar =100 μm). (G and I) H&E staining and polarizing light examination of neofat engineered with random-patterned microfibers for 8 weeks (100×, bar =100 μm). (J) The gene expression of PPARγ and TNMD of the neo tissues post-8 weeks of culture. (K) Semi-quantification of the gene expression of PPARγ. (L) Semi-quantification of the gene expression of TNMD. In the pictures of J, K, and L, A, B, C, and D, respectively, represent neotendon and cells detached from parallel microfibers after seeding and grew on the culture dishes; and neofat and cells detached from unparallel microfibers after seeding and grew on the culture dishes. |
In vitro tendon engineering
To engineer tendon in vitro, passage 3 mASCs were collected, and a total of 2.5×10⁷ mASCs were resuspended in 1 mL of culture medium and then evenly distributed onto the scaffold. Afterward, cell-seeded constructs were incubated in an incubator with 5% CO2 at 37°C for 2 hours to allow cell attachment on the scaffold. Then, the cell-seeded constructs were cultured in DMEM plus 10% FBS. Media were changed after 4 days of culture and then changed every 3 days. As described above, the construct was kept in tension to form parallel-aligned fiber structure in the experimental group. In the control group, the construct was kept in a loose status to maintain the fiber structure of random orientation. The in vitro cultured neotissues were harvested at 8 weeks for grow view, histological analysis, and qPCR analysis.
Gross examination and hematoxylin and eosin (H&E) staining
Neotissues harvested at 8 weeks were first observed grossly, and then, half of them were subjected to H&E staining and half of them to qPCR analysis. As previously described,28 the tissue specimens were randomly selected and fixed with 4% paraformaldehyde for 4 hours followed by three washes in PBS and then paraffin-embedded and sectioned to 5 μm thickness for H&E staining to examine tissue structure, especially for cell density, PGA degradation, as well as collagen formation and alignment. To examine collagen bundle structure and types, the tissue sections were also subjected to polarized microscope as previously described.29
Data Analysis
All data (mean ± SD) were statistically analyzed with Student’s t-test using statistical software SPSS (version 19.0, SPSS Inc., IL, USA) with significant difference with *p<0.05, **p<0.01 and ***p<0.001.
Results
Characterization of microscaled and nanoscaled parallel topography
As shown in Figure 1A, the microscaled topography was composed by parallel microgrooves with the width of 10 μm, the depth of 3 μm, and the ridge width of 10 μm. As a control, a smooth surface was employed.
As shown in Figure 1B, there were two types of GT/PCL electrospun nanofibers, unparallel and parallel patterns as visualized by SEM. The former exhibited a randomly distributed form, whereas the latter revealed an aligned form. Further quantitative analysis showed that unparallel nanofibers were relatively thinner with an average diameter of 408±126 nm (Figure 1C), whereas parallel nanofibers were relatively thicker with an average diameter of 2,221±538 nm (Figure 1D), possibly due to self-combination of the fibers during preparation.
Cell morphology and orientation on nanoscaled and microscaled topographical surface
The morphology of hASCs on microscaled topographical surface was observed under phase contrast microscope. As shown in Figure 3A, hASCs spread in a normal manner and exhibited a random arrangement on the smooth surface (S group) on day 3 postseeding. By contrast, the cells seeded on microgrooved membrane (G group) exhibited elongated cell morphology and were oriented in a parallel direction by growing onto the groove or on the ridges of the microgrooved membrane on day 3 postseeding. To further demonstrate cell morphology and orientation changes, F-actin staining was also employed. As shown in Figure 3B, the examination under fluorescence microscope also demonstrated clear elongated cell morphology with parallel alignment on the microgrooved surface (G group), whereas the cells remained spread on the smooth surface (S group) on day 3 postseeding. Nuclei counterstaining with DAPI also showed that cell nuclei exhibited parallel-oriented pattern on the microgrooved surface (G), while revealing random pattern on the smooth surface (S).
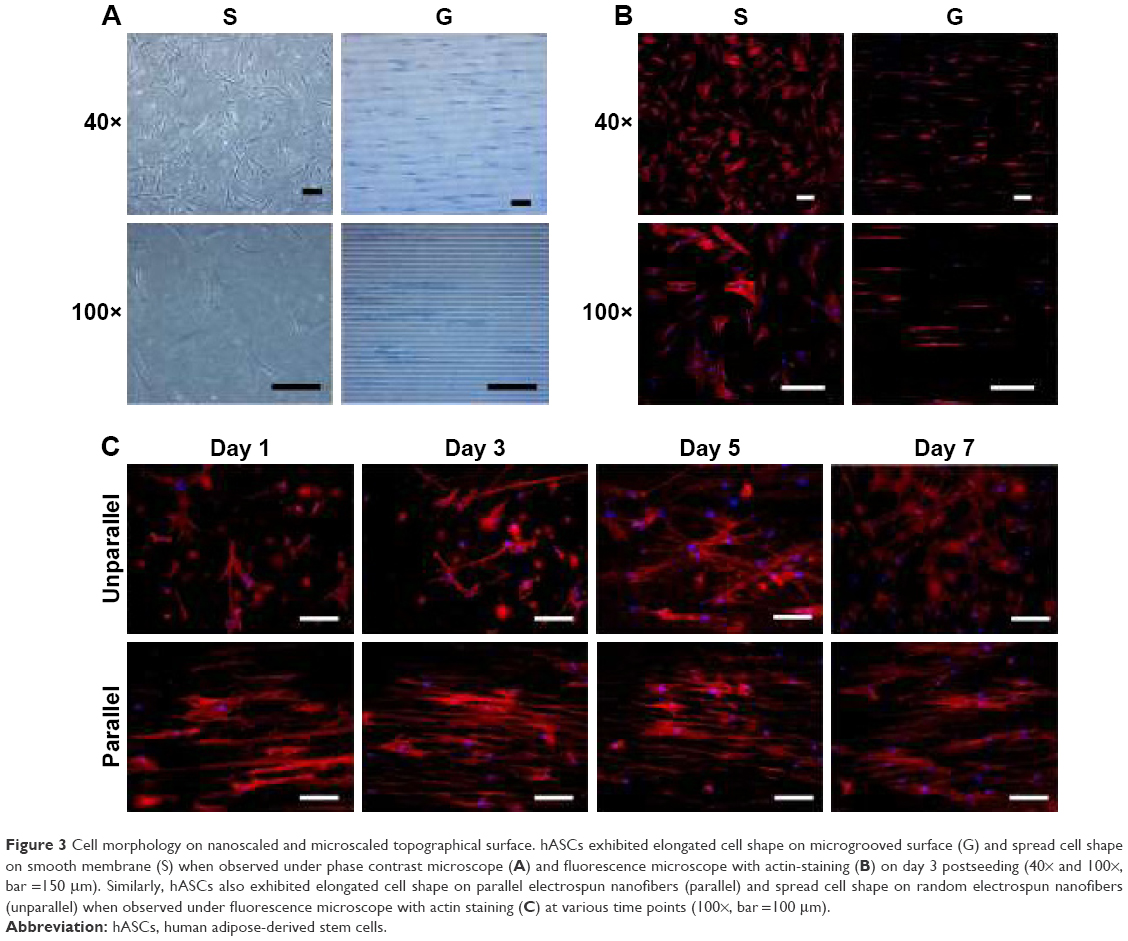 | Figure 3 Cell morphology on nanoscaled and microscaled topographical surface. hASCs exhibited elongated cell shape on microgrooved surface (G) and spread cell shape on smooth membrane (S) when observed under phase contrast microscope (A) and fluorescence microscope with actin-staining (B) on day 3 postseeding (40× and 100×, bar =150 μm). Similarly, hASCs also exhibited elongated cell shape on parallel electrospun nanofibers (parallel) and spread cell shape on random electrospun nanofibers (unparallel) when observed under fluorescence microscope with actin staining (C) at various time points (100×, bar =100 μm). |
Due to the difficulty in observing cell morphology on electrospun membrane with phase contrast microscope, fluorescence microscopic observation using F-actin staining was employed. As shown in Figure 3C, hASCs seeded on aligned nanofibers demonstrated relatively aligned pattern, and the cells became significantly elongated with culturing time. In contrast, hASCs seeded on random-patterned nanofibers exhibited random pattern and became significantly spread with culturing time. Compared with microscaled surface, cell elongation and orientation were relatively less optimal on nanoscaled surface (Figure 3B vs C).
Cell proliferation profiles on nanoscaled and microscaled topographical surface
To examine the effect of topographical surface on cell proliferation, cell counting method and CCK-8 assay were, respectively, used for microscaled and nanoscaled groups. As shown in Figure 4A and B, hASCs revealed an exponential growth pattern during the culture time from day 1 to day 7. There was no difference in cell proliferation potentials between unparallel and parallel groups on nanoscaled fibers (Figure 4B). However, spread cells proliferated relatively faster than elongated cells on days 3 and 5 (p<0.05) when seeded on microscaled surface (Figure 4A).
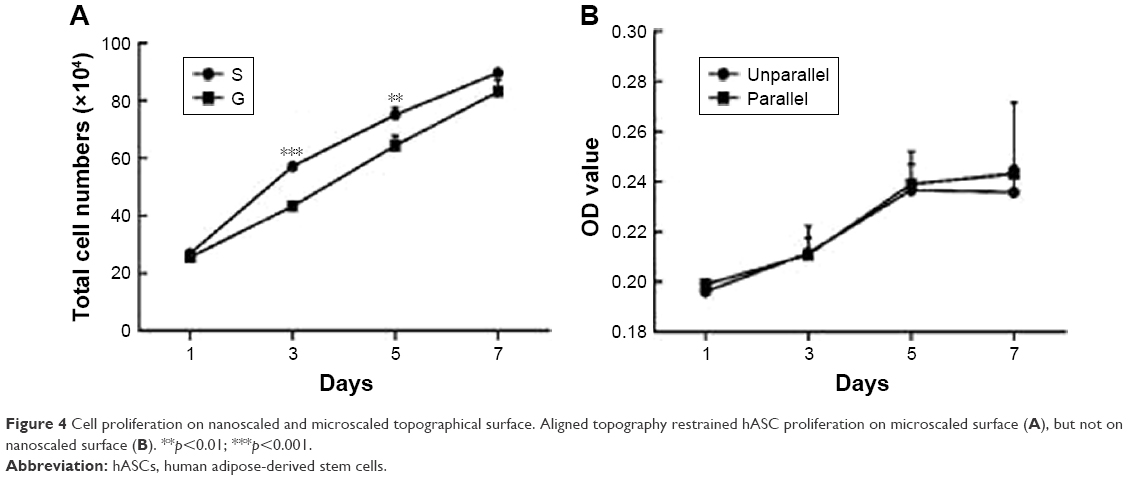 | Figure 4 Cell proliferation on nanoscaled and microscaled topographical surface. Aligned topography restrained hASC proliferation on microscaled surface (A), but not on nanoscaled surface (B). **p<0.01; ***p<0.001. |
Quantitative analysis of cell morphology and orientation
To further analyze the cell morphology and orientation quantitatively, a previously employed method was used.24 For the cells on microscaled surface, cell area, cell body aspect ratio, and major axis angle were quantitatively analyzed using F-actin-stained cell images on day 3 culture. As shown in Figure 5A, the cells on microgrooved surface (G) exhibited a significantly smaller area (5,854.10±3,732.36 μm2) compared to the smooth group cells (S; 13,859.86±5,227.42 μm2, p<0.001). The cell body aspect ratio on G group (20.57±5.97) was also significantly larger than that of S group (2.95±1.66, p<0.001). In addition, the cell major axis angle of G group (1.38°±1.06°) was significantly lower than that of S group (50.83°±26.38°, p<0.001).
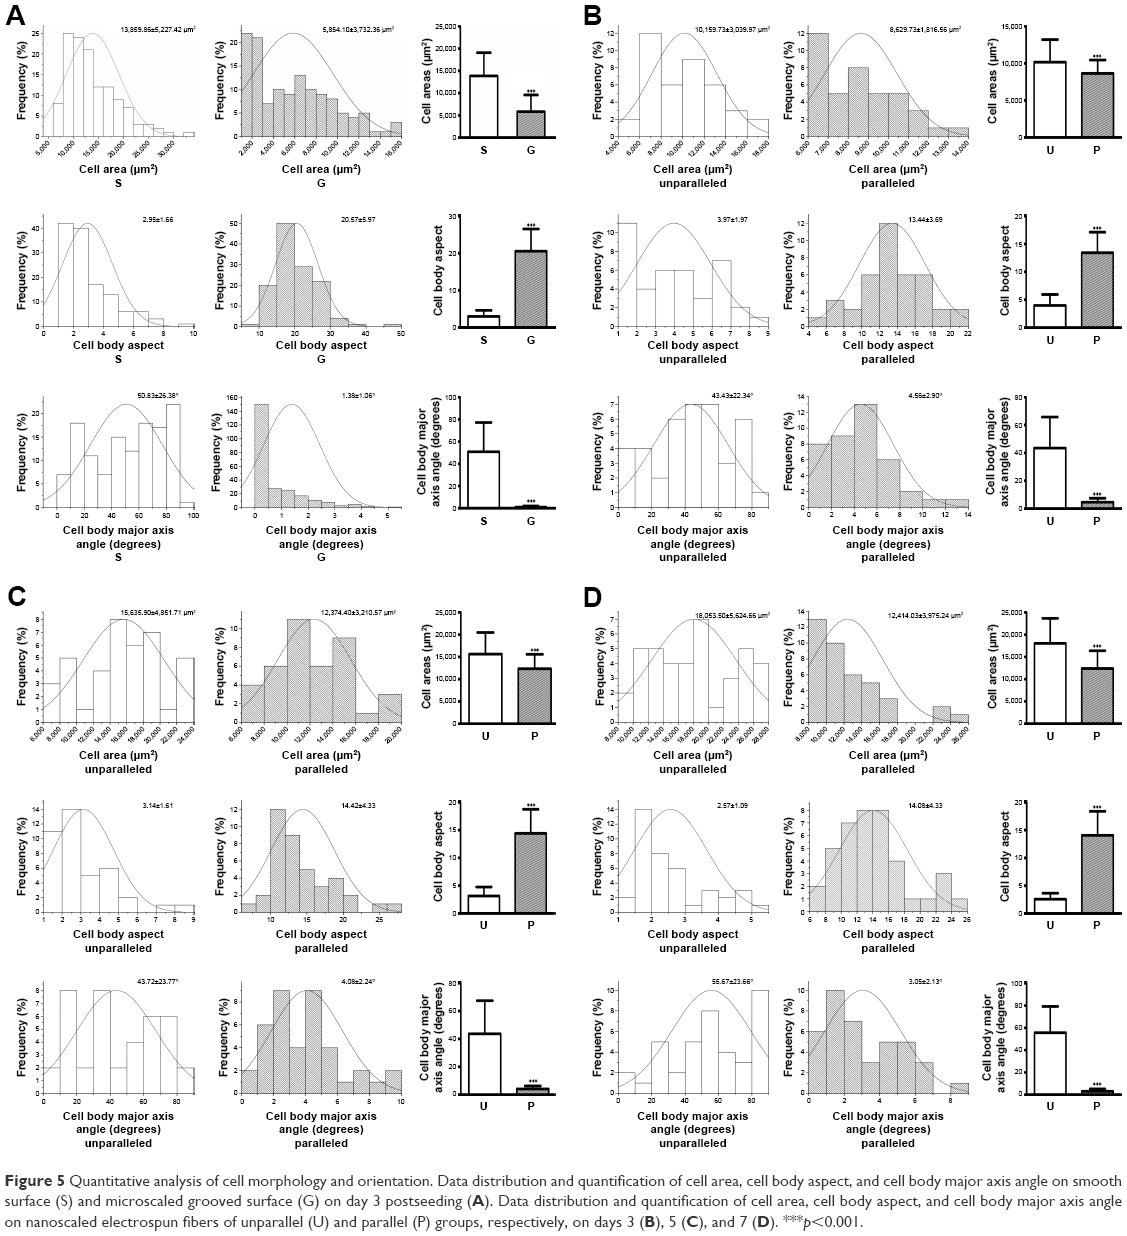 | Figure 5 Quantitative analysis of cell morphology and orientation. Data distribution and quantification of cell area, cell body aspect, and cell body major axis angle on smooth surface (S) and microscaled grooved surface (G) on day 3 postseeding (A). Data distribution and quantification of cell area, cell body aspect, and cell body major axis angle on nanoscaled electrospun fibers of unparallel (U) and parallel (P) groups, respectively, on days 3 (B), 5 (C), and 7 (D). ***p<0.001. |
To quantify cell elongation on nanoscaled surface, individual cells of F-actin-stained images were outlined for quantitative analysis. As shown in Figure 5B, on day 3 postseeding, the cells on unparallel nanofibers revealed an average cell area (10,159.73±3,039.97 μm2), which was significantly larger than that on parallel nanofibers (8,629.73±1,816.56 μm2, p<0.001). The cell body aspect ratio on parallel nanofibers (13.44±3.69) was significantly larger than that of unparallel nanofibers (3.97±1.97, p<0.001). In addition, the elongated cells on parallel nanofibers also demonstrated significantly lower cell major axis angle (4.56°±2.90°) than that of unparallel group (43.43°±22.34°, p<0.001).
As shown in Figure 5C, on day 5 postseeding, the cells on unparallel nanofibers revealed an average cell area (15,635.90±4,851.71 μm2), which is significantly larger than that of parallel nanofibers (12,374.40±3,210.57 μm2, p<0.001). Better alignment was also observed in elongated cells on parallel nanofibers with a much larger cell body aspect ratio (14.42±4.33) than that of unparallel group (3.14±1.61, p<0.001) as well as with a much lower cell major axis angle (4.08°±2.24°) than that of unparallel group (43.72°±23.77°, p<0.001).
With the increase of culturing time, the difference between parallel and unparallel groups became much more significant when compared to the time points of days 3 and 5. As shown in Figure 5D, on day 7, the cells seeded on unparallel nanofibers exhibited an average cell area (18,053.50±5,624.66 μm2) much larger than that of parallel nanofibers (12,414.03±3,975.24 μm2, p<0.001) with significant difference. The cell body aspect ratio of the parallel group (14.08±4.33) was also significantly larger than that of unparallel group (2.57±1.09, p<0.001). Furthermore, the cell major axis angle of parallel group (3.05°±2.13°) was also significantly smaller than that of unparallel group (55.67°±23.66°, p<0.001).
Tenogenic differentiation of hASCs on nanoscaled and microscaled aligned surface
To investigate the role of nanoscaled and microscaled surfaces in tenogenic differentiation, the expression of various tenogenic markers was examined. As shown in Figure 6A, after 3 days of culture on different microscaled surfaces, scleraxis (SCX; 3.910±0.349 folds, p<0.01), tenascin-C (TNC; 2.023±0.629 folds, p<0.05), biglycan (BGN; 1.573±0.355 folds, p<0.05), and fibromodulin (FMOD; 3.013±0.715 folds, p<0.05) were significantly upregulated in microgrooved surface (G) compared with the levels of smooth surface (S). With prolonged culturing time, the gene expression levels of more tenogenic markers were significantly upregulated in the elongated hASCs than in the spread hASCs after 7 days of culture as shown in Figure 6B, including SCX (2.250±0.346 folds, p<0.01), tenomodulin (TNMD; 3.017±0.374 folds, p<0.01), collagen I (COL 1; 1.450±0.286 folds, p<0.05), collagen VI (COL 6; 2.067±0.721 folds, p<0.05), decorin (DCN; 1.510±0.060 folds, p<0.01), TNC (1.397±0.140 folds, p<0.05), BGN (2.230±0.383 folds, p<0.05), and FMOD (4.387±1.571 folds, p<0.05).
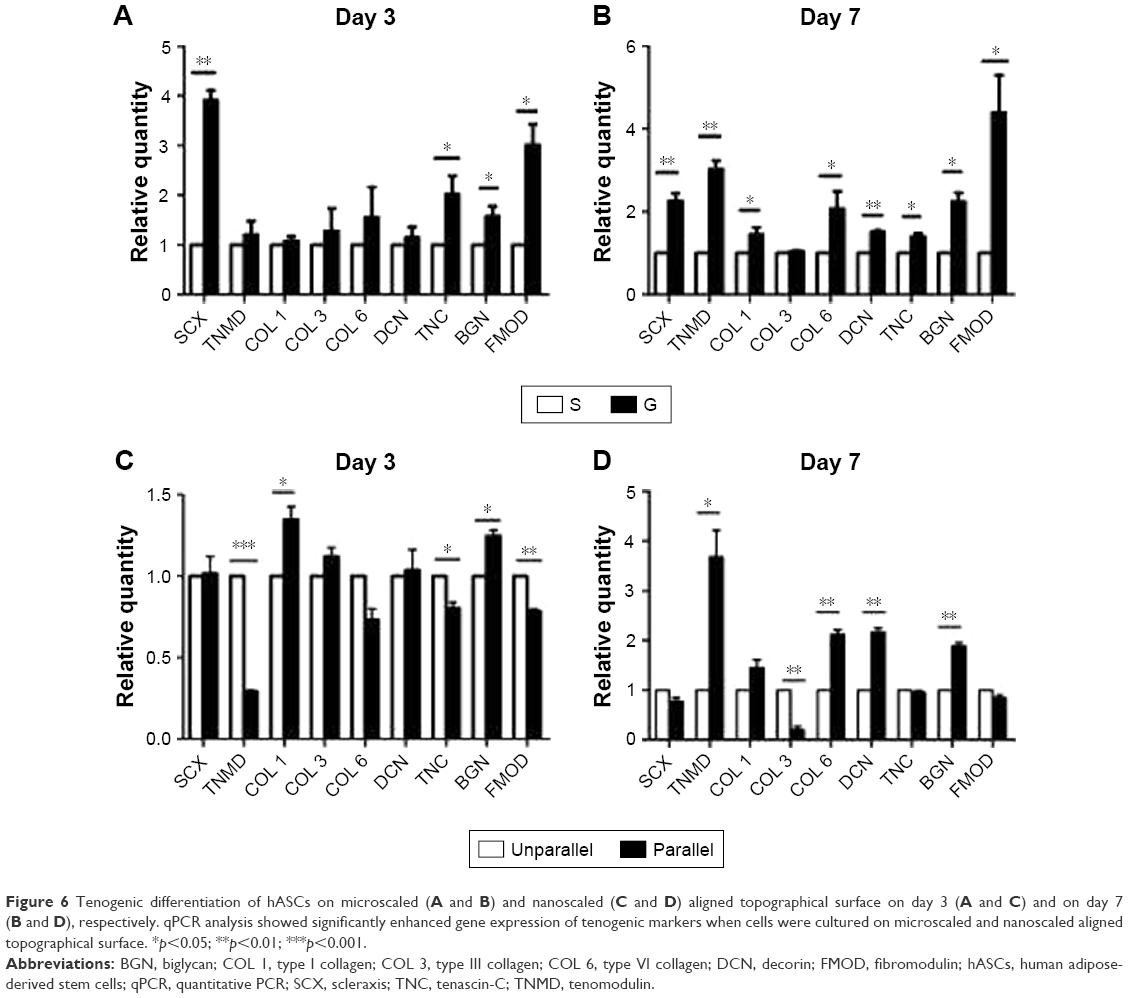 | Figure 6 Tenogenic differentiation of hASCs on microscaled (A and B) and nanoscaled (C and D) aligned topographical surface on day 3 (A and C) and on day 7 (B and D), respectively. qPCR analysis showed significantly enhanced gene expression of tenogenic markers when cells were cultured on microscaled and nanoscaled aligned topographical surface. *p<0.05; **p<0.01; ***p<0.001. |
The role of aligned nanofibers in tenogenic differentiation was also investigated. As shown in Figure 6C, there was no confirmed pattern of gene regulation on tenogenic markers after 3 days of culture, as some were upregulated and some were downregulated. Compared with the cells of unparallel group, the gene expression of some tenogenic markers was upregulated in parallel group cells including COL 1 (1.347±0.140 folds, p<0.05) and BGN (1.245±0.066, p<0.01), whereas other markers were significantly downregulated including TNMD (0.290±0.019 folds, p<0.001), COL 6 (0.731±0.118 folds, p<0.05), TNC (0.802±0.062 folds, p<0.05), and FMOD (0.784±0.026 folds, p<0.01).
However, with prolonged culturing time, an inductive pattern of parallel nanofibers was confirmed. As shown in Figure 6D, a large part of the examined tenogenic markers were induced to significantly upregulate their gene expressions in hASCs of parallel group than in the cells of unparallel group after 7 days of culture including TNMD (3.680±0.937 folds, p<0.05), COL 1 (1.450±0.282 folds, p<0.05), COL 6 (2.117±0.170 folds, p<0.01), DCN (2.163±0.146 folds, p<0.01), and BGN (1.884±0.125 folds, p<0.01), despite minor level of downregulated expression for SCX (0.773±0.126 folds, p<0.05), collagen III (0.199±0.123 folds, p<0.01), and FMOD (0.840±0.109 folds, p<0.05).
Other lineage differentiations of ASCs on nanoscaled aligned surface
In addition to tenogenic markers, other lineages were also investigated for inductive effects of parallel nanofibers, and there seemed no confirmed patterns. As shown in Figure 7A and B, for osteogenic markers, Runt-related transcription factor 2 (Runx2) was significantly upregulated in parallel group cells (1.997±0.136 folds, p<0.01) on day 3, but there was no significant change for osteocalcin (OCN; p>0.05) and alkaline phosphatase, liver/bone/kidney (ALPL; p>0.05). On day 7, Runx2 (0.231±0.110 folds, p<0.01) and OCN (0.757±0.111, p<0.05) were downregulated, and there was no change for ALPL (p>0.05).
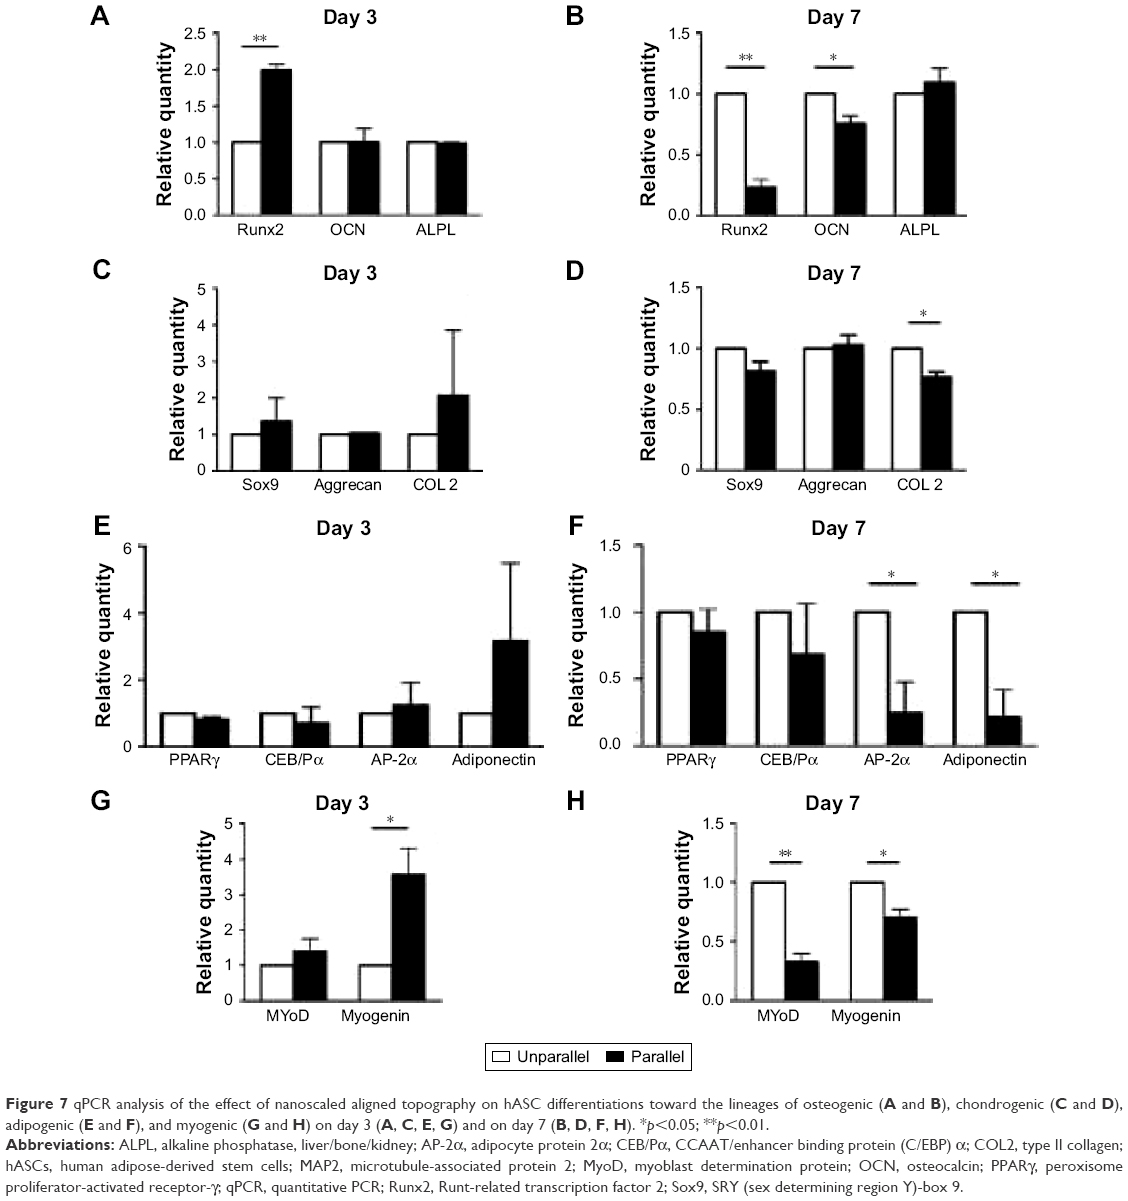 | Figure 7 qPCR analysis of the effect of nanoscaled aligned topography on hASC differentiations toward the lineages of osteogenic (A and B), chondrogenic (C and D), adipogenic (E and F), and myogenic (G and H) on day 3 (A, C, E, G) and on day 7 (B, D, F, H). *p<0.05; **p<0.01. |
As shown in Figure 7C and D, there was no significant difference in the gene expressions of chondrogenic markers of SRY (sex-determining region Y)-box 9(Sox9) and Aggrecan in both days 3 and 7 time points (p>0.05), although collagen II (COL 2) was only downregulated (0.766±0.076 folds, p<0.05) on day 7. For adipogenic lineage differentiation as shown in Figure 7E and F, only activating enhancer binding protein 2α (AP-2α; 0.243±0.404 folds, p<0.05) and adiponectin (0.211±0.355 folds, p<0.05) were significantly downregulated in parallel group cells on day 7.
Regarding myogenic lineage differentiation, as shown in Figure 7G and H, myogenin was upregulated on day 3 (3.573±1.274 folds, p<0.05) and downregulated on day 7 (0.700±0.122 folds, p<0.05). There was no change for myoblast determination protein on day 3, but it was downregulated on day 7 (0.324±0.124 folds, p<0.01).
Gross view of neotendons engineered with parallel and random microfibers
As shown in Figure 2A and B, microfibers were fixed on a spring, and mouse ASCs were seeded on the microfibers and cultured in vitro without tenogenic differentiation (Figure 2C). As shown in Figure 2D, after 8 weeks of in vitro culture, neotendon tissue was formed in parallel-aligned microfibers with relatively thinner and liner gross view, whereas neotissue was formed in randomly arranged microfibers, which exhibited uneven and locally enlarged tissue block when observed grossly (Figure 2E), similar to the gross view of an adipose tissue.
Histological structure and tenogenic gene expression of in vitro engineered neotendons
As supported by the gross view, histological examination demonstrated neofat tissue formation in randomly arranged microfibers (Figure 2G). In contrast, neotendon tissue was formed in parallel microfibers with the formation of parallelly arranged collagen microfibers at the peripheral area (Figure 2F). Further examination with polarized microscope showed relatively mature type I collagen (red color) only at the peripheral area of the parallel group (Figure 2H), but not in the random group (Figure 2I), indicating that aligned fiber topography favored tenogenic differentiation of seeded mASCs. This indication was further supported by the RT-qPCR examination. As shown in Figure 2J, the gene expression of TNMD, a tenogenic marker, was significantly upregulated in the neotendon of the parallel group when compared to the other groups (Figure 2J). In contrast, the gene expression of peroxisome proliferator-activated receptor-γ (PPARγ), a marker of adipogenic differentiation, was significantly downregulated in the neotendon of parallel group (Figure 2J–A) when compared to the neofat tissue of the random group (Figure 2J–C). PPARγ expression in the cells that were detached from the scaffolds and grew on the culture dishes was similar in both the parallel (Figure 2J–B) and random (Figure 2J–D) groups. Semi-quantification of the gene expression derived from three independent tests also showed that TNMD gene expression was significantly upregulated in the parallel group (p<0.05; Figure 2L), whereas the PPARγ expression was significantly downregulated in the parallel group when compared to those of the random group (Figure 2K).
Discussion
With the advancement of biomaterials research field, intelligent materials become more important in the field of regenerative medicine, as it is able to actively regulate the functions of cells either seeded on the materials or recruited from host tissue environment to the implanted materials.12,30–32
The bioactive effect of specially designed intelligent materials relies on the chemical or physical signals that are able to regulate cell functions. The former includes the modification of materials with the integration of growth factor,33 peptide,34 or extracellular matrices,35,36 whereas the latter employs mainly topographical structure to play instructive roles.37 The major roles of topographical induction include osteogenic, neurogenic, cardiovascular, and skin differentiation.38–43
Topographical structure–mediated cell shape control is one of the major working mechanisms. For example, geometric cues–induced round shape of MSCs was prone to adipogenic lineage differentiation, and polygon-shaped MSCs tented to differentiate toward chondrogenic lineage, whereas rectangular shape was apt to osteogenic lineage.44 Likewise, parallel topographical structure has been demonstrated to induce elongated cell shape to mimic the cell morphologies of tenocyte24 and myoblast45 cells depending on cell body aspect.
Previously, we have respectively employed microscaled based microgrooved structural surface with parallel alignment23 and nanoscaled based aligned electrospun fibers25 to demonstrate the topographically inductive effect on tenogenic differentiation on seeded dermal fibroblasts. In addition, we also previously demonstrated that microscaled parallel PGA nonwoven fibers were able to regenerate tendon tissue in vivo via induced tenogenic differentiation of adipose-derived stem cells.46 Likewise, parallel nanofibers were also able to in vivo regenerate tendon better than random nanofibers.25 However, there is no direct side-by-side comparison between microscaled and nanoscaled aligned topography for their efficiency in inducing tenogenic differentiation of seeded MSCs in the literature. Elucidation of this matter will have impact on advising the use of proper scaffold materials for tendon regeneration in vivo.
MSCs exist widely in different types of human tissues such as bone marrow, adipose tissue, cord blood, umbilical cord tissue, and endometrium.47–49 ASCs are one type of MSCs, which have obvious advantages over the other types of MSCs, including convenient gain, abundant source, potent proliferative capability, low osteogenic potential, immunosuppressive properties, and low immunogenicity.50–52 In addition, ASCs have also been investigated for their tenogenic differentiation capability in vitro53,54 as well as their ability to regenerate tendon in vivo.46 For example, Ricco et al used ASCs in the therapy of superficial digital flexor tendonitis in the horse;55 Stanco et al investigated the therapeutic potential of human tendon-derived MSCs;56 Raabe et al determined the optimal conditions for in vitro differentiation toward the tenogenic lineage of equine ASCs.55–57
In this study, we focused on tenogenic differentiation of hASCs in vitro using microscaled as well as nanoscaled topography of parallel alignment. As shown in Figure 3, both microscaled and nanoscaled aligned topography could induce cell elongation with better parallel alignment than their random-patterned counterparts. The observation of F-actin-stained cell morphology indicated that microscaled topography seemed to be better able to align the seeded ASCs than nanoscaled topography. Quantitative analysis did support such an observation. As shown in Figure 5A and B, on day 3 post–cell seeding, cell area in microscaled group (5,854.10±3,732.36 μm2) was smaller than that of nanoscaled group (8,629.73±1,816.56 μm2) in spite of aligned topography in both groups. By contrast, spread cells of microscaled group were larger (13,859.86±5,227.42 μm2) than those of nanoscaled group (10,159.73±3,039.97 μm2).
This difference may explain that the observed differences in tenogenic differentiation between microscaled and nanoscaled groups on day 3 post–cell seeding. As shown in Figure 6A and C, the expression of tenogenic markers of SCX and TNC was steadily upregulated in microscaled group, whereas no confirmed pattern could be observed in nanoscaled group as some was upregulated and some was downregulated. However, with the increase of culturing time, more stable tenogenic differentiation pattern could be confirmed on day 7 for both groups as shown in Figure 6B and D, because most of the examined tenogenic markers were upregulated for their gene expressions in parallel topography when compared to random topography, particularly for nanoscaled group. This was likely due to improved cell elongation and alignment in nanoscaled group with prolonged culturing time, as the differences between random and aligned groups in cell area, cell body aspect, and major axis angle were much more significant on day 7 (Figure 5D) than on day 3 (Figure 5C).
By the comparison of tenogenic marker regulation, it remains a bit of inconsistence between microscaled and nanoscaled groups. As shown in Figure 6, SCX was upregulated by the aligned topography in microscaled group, but not in nanoscaled group. The mechanism causing this difference remains unknown. We believed that this might be caused by the differences in cell–cell contact and cell alignment. As shown in Figure 3, cells seeded on microsurface tented to be better aligned with less cell–cell contact, whereas some of the cells seeded on nanofibers seemed to be able to merge together. In addition, seeded cells were usually restricted into the single microgroove instead of across the microgrooves. By contrast, seeded hASCs could cross several aligned nanofibers with no predetermined limitation. These differences in cell behaviors between the microscaled and nanoscaled groups may cause the observed differences in gene expression patterns.58,59
In addition to tenogenic lineage, we also investigated the role of aligned nanofibers on other lineage differentiation of seeded hASCs. In agreement with previous report, alteration of round shape of MSCs to any other type could decline their adipogenic potentials,44 and elongated hASCs on day 7 did reduce the gene expression of AP-2α and adiponectin, the markers of adipogenic lineage. Similarly, COL 2, a marker of chondrogenic lineage, was also significantly downregulated on day 7 in elongated hASCs. On day 7, osteogenic and myogenic lineage potentials were also limited.
As supported, we did observe an in vitro tendon engineering model, which showed mASCs seeded on aligned microscaled PGA fibers were able to partially regenerate neotendon tissue after 8 weeks of in vitro culture with aligned collagen fiber formation at the peripheral area (Figure 2F). Polarized microscope also showed the relative maturity of formed collagen fibers (Figure 2H). By contrast, instead of fat tissue formation, no collagen fiber formation by the seeded hASCs was observed in the control group (Figure 2G and I), indicating that microscaled PGA fibers with aligned topography did play a significant role in neotendon formation, although it remains far less optimal.
Conclusion
This study demonstrated that both microscaled and nanoscaled topography with parallel alignment could drive tenogenic lineage differentiation of seeded hASCs. Among these two models, microscaled topography with parallel alignment seems to be relatively stable for tenogenic induction at both cellular level and tissue regeneration level. The integration of aligned photographical signals as well as others such as mechanical or electronic countermeasure signals into the design and preparation of tenogenic scaffold may optimize inductive scaffold-based tendon regeneration in vivo.
Acknowledgment
This work was supported by National Key R&D Program of China (2016YFC1100202 to WL), National Natural Science Foundation of China (31470943 to WL, 81401530 to YKJ, 81701841 to WBW, and 81601622 to BF), and the Biomedical Engineering Fund of Shanghai Jiao Tong University (YG2015QN22 to BF). Kaili Zhou, Bei Feng, Wenbo Wang, and Ting Jiang share first authorship.
Disclosure
The authors report no conflicts of interest in this work.
References
Daley GQ, Scadden DT. Prospects for stem cell-based therapy. Cell. 2008;132(4):544–548. | ||
Shaker A, Rubin DC. Stem cells: one step closer to gut repair. Nature. 2012;485(7397):181–182. | ||
Klassen H, Reubinoff B. Stem cells in a new light. Na Biotechnol. 2008;26(2):187–188. | ||
Blanpain C, Fuchs E. Stem cell plasticity. Plasticity of epithelial stem cells in tissue regeneration. Science. 2014;344(6189):1242281. | ||
Bianco P, Cao X, Frenette PS, et al. The meaning, the sense and the significance: translating the science of mesenchymal stem cells into medicine. Nat Med. 2013;19(1):35–42. | ||
Toh WS, Foldager CB, Pei M, Hui JH. Advances in mesenchymal stem cell-based strategies for cartilage repair and regeneration. Stem Cell Rev. 2014;10(5):686–696. | ||
Ji ST, Kim H, Yun J, Chung JS, Kwon SM. Promising therapeutic strategies for mesenchymal stem cell-based cardiovascular regeneration: from cell priming to tissue engineering. Stem Cells Int. 2017;2017:3945403. | ||
Shafei AE, Ali MA, Ghanem HG, et al. Mesenchymal stem cells therapy: a promising cell based therapy for treatment of myocardial infraction. J Gene Med. 2017;19(12). | ||
Kang M, Thebaud B. Stem cell biology and regenerative medicine for neonatal lung diseases. Pediatr Res. 2018;83(1–2):291–297. | ||
Ghasroldasht MM, Irfan-Maqsood M, Matin MM, et al. Mesenchymal stem cell based therapy for osteo-diseases. Cell Biol Inte. 2014;38(10):1081–1085. | ||
Samsonraj RM, Raghunath M, Nurcombe V, Hui JH, van Wijnen AJ, Cool SM. Concise review: multifaceted characterization of human mesenchymal stem cells for use in regenerative medicine. Stem Cells Transl Med. 2017;6(12):2173–2185. | ||
Li Y, Xiao Y, Liu C. The horizon of materiobiology: a perspective on material-guided cell behaviors and tissue engineering. Chem Rev. 2017;117(5):4376–4421. | ||
Taraballi F, Bauza G, McCulloch P, Harris J, Tasciotti E. Concise review: biomimetic functionalization of biomaterials to stimulate the endogenous healing process of cartilage and bone tissue. Stem Cells Transl Med. 2017;6(12):2186–2196. | ||
Lin X, Shi Y, Cao Y, Liu W. Recent progress in stem cell differentiation directed by material and mechanical cues. Biomed Mater. 2016;11(1):014109. | ||
Ghasemi Hamidabadi H, Rezvani Z, Nazm Bojnordi M, et al. Chitosan-intercalated montmorillonite/poly(vinyl alcohol) nanofibers as a platform to guide neuronlike differentiation of human dental pulp stem cells. ACS Appl Mater Interfaces. 2017;9(13):11392–11404. | ||
Yang Y, Wang K, Gu X, Leong KW. Biophysical regulation of cell behavior-cross talk between substrate stiffness and nanotopography. Engineering (Beijing). 2017;3(1):36–54. | ||
Song L, Wang K, Li Y, Yang Y. Nanotopography promoted neuronal differentiation of human induced pluripotent stem cells. Colloids Surf B Biointerfaces. 2016;148:49–58. | ||
Wang K, He X, Linthicum W, et al. Carbon nanotubes induced fibrogenesis on nanostructured substrates. Environ Sci Nano. 2017;4(3):689–699. | ||
Shi L, Wang K, Yang Y. Adhesion-based tumor cell capture using nanotopography. Colloids Surf B Biointerfaces. 2016;147:291–299. | ||
Zhang C, Wang X, Zhang E, et al. An epigenetic bioactive composite scaffold with well-aligned nanofibers for functional tendon tissue engineering. Acta Biomater. 2018;66:141–156. | ||
Cirillo V, Guarino V, Alvarez-Perez MA, Marrese M, Ambrosio L. Optimization of fully aligned bioactive electrospun fibers for “in vitro” nerve guidance. J Mater Science Mater Med. 2014;25(10):2323–2332. | ||
Moghadasi Boroujeni S, Mashayekhan S, Vakilian S, Ardeshirylajimi A, Soleimani M. The synergistic effect of surface topography and sustained release of TGF-beta1 on myogenic differentiation of human mesenchymal stem cells. J Biomed Mater Res A. 2016;104(7):1610–1621. | ||
Wang W, Li J, Wang K, et al. Induction of predominant tenogenic phenotype in human dermal fibroblasts via synergistic effect of TGF-beta and elongated cell shape. Am J Physiol Cell Physiol. 2016;310(5):C357–C372. | ||
Shi Y, Zhou K, Zhang W, et al. Microgrooved topographical surface directs tenogenic lineage specific differentiation of mouse tendon derived stem cells. Biomed Mater. 2017;12(1):015013. | ||
Wang W, He J, Feng B, et al. Aligned nanofibers direct human dermal fibroblasts to tenogenic phenotype in vitro and enhance tendon regeneration in vivo. Nanomedicine (Lond). 2016;11(9):1055–1072. | ||
Thampatty BP, Wang JH. A new approach to study fibroblast migration. Cell Motil Cytoskeleton. 2007;64(1):1–5. | ||
Wang JH, Yang G, Li Z. Controlling cell responses to cyclic mechanical stretching. Ann Biomed Eng. 2005;33(3):337–342. | ||
Deng D, Liu W, Xu F, et al. Engineering human neo-tendon tissue in vitro with human dermal fibroblasts under static mechanical strain. Biomaterials. 2009;30(35):6724–6730. | ||
Wang B, Liu W, Zhang Y, et al. Engineering of extensor tendon complex by an ex vivo approach. Biomaterials. 2008;29(20):2954–2961. | ||
Ricapito NG, Ghobril C, Zhang H, Grinstaff MW, Putnam D. Synthetic biomaterials from metabolically derived synthons. Chem Rev. 2016;116(4):2664–2704. | ||
Green JJ, Elisseeff JH. Mimicking biological functionality with polymers for biomedical applications. Nature. 2016;540(7633):386–394. | ||
Huang G, Li F, Zhao X, et al. Functional and biomimetic materials for engineering of the three-dimensional cell microenvironment. Chem Rev. 2017;117(20):12764–12850. | ||
Bruggeman KF, Williams RJ, Nisbet DR. Dynamic and responsive growth factor delivery from electrospun and hydrogel tissue engineering materials. Adv Healthc Mater. 2018;7(1). | ||
Tsuchiya K, Numata K. Chemoenzymatic synthesis of polypeptides for use as functional and structural materials. Macromol Biosci. 2017;17(11). | ||
Freytes DO, Martin J, Velankar SS, Lee AS, Badylak SF. Preparation and rheological characterization of a gel form of the porcine urinary bladder matrix. Biomaterials. 2008;29(11):1630–1637. | ||
Wolf MT, Daly KA, Brennan-Pierce EP, et al. A hydrogel derived from decellularized dermal extracellular matrix. Biomaterials. 2012;33(29):7028–7038. | ||
Jun I, Chung YW, Park J, et al. Ultrathin metal films with defined topographical structures as in vitro cell culture platforms for unveiling vascular cell behaviors. Adv Healthc Mater. 2016;5(18):2396–2405. | ||
Arjmand M, Ardeshirylajimi A, Maghsoudi H, Azadian E. Osteogenic differentiation potential of mesenchymal stem cells cultured on nanofibrous scaffold improved in the presence of pulsed electromagnetic field. J Cell Physiol. 2018;233(2):1061–1070. | ||
Chen H, Huang X, Zhang M, et al. Tailoring surface nanoroughness of electrospun scaffolds for skeletal tissue engineering. Acta Biomater. 2017;59:82–93. | ||
Jung AR, Kim RY, Kim HW, et al. Nanoengineered polystyrene surfaces with nanopore array pattern alters cytoskeleton organization and enhances induction of neural differentiation of human adipose-derived stem cells. Tissue Eng Part A. 2015;21(13–14):2115–2124. | ||
Tan KK, Tann JY, Sathe SR, et al. Enhanced differentiation of neural progenitor cells into neurons of the mesencephalic dopaminergic subtype on topographical patterns. Biomaterials. 2015;43:32–43. | ||
Tallawi M, Dippold D, Rai R, et al. Novel PGS/PCL electrospun fiber mats with patterned topographical features for cardiac patch applications. Mater Sci Eng C Mater Biol Appl. 2016;69:569–576. | ||
Mashinchian O, Bonakdar S, Taghinejad H, et al. Cell-imprinted substrates act as an artificial niche for skin regeneration. ACS Appl Mater Interfaces. 2014;6(15):13280–13292. | ||
Kilian KA, Bugarija B, Lahn BT, Mrksich M. Geometric cues for directing the differentiation of mesenchymal stem cells. Proc Natl Acad Sci U S A. 2010;107(11):4872–4877. | ||
Costantini M, Testa S, Mozetic P, et al. Microfluidic-enhanced 3D bioprinting of aligned myoblast-laden hydrogels leads to functionally organized myofibers in vitro and in vivo. Biomaterials. 2017;131:98–110. | ||
Deng D, Wang W, Wang B, et al. Repair of Achilles tendon defect with autologous ASCs engineered tendon in a rabbit model. Biomaterials. 2014;35(31):8801–8809. | ||
Carrade Holt DD, Wood JA, Granick JL, Walker NJ, Clark KC, Borjesson DL. Equine mesenchymal stem cells inhibit T cell proliferation through different mechanisms depending on tissue source. Stem Cells Dev. 2014;23(11):1258–1265. | ||
Cabezas J, Rojas D, Navarrete F, et al. Equine mesenchymal stem cells derived from endometrial or adipose tissue share significant biological properties, but have distinctive pattern of surface markers and migration. Theriogenology. 2018;106:93–102. | ||
Kargozar S, Mozafari M, Hashemian SJ, et al. Osteogenic potential of stem cells-seeded bioactive nanocomposite scaffolds: a comparative study between human mesenchymal stem cells derived from bone, umbilical cord Wharton’s jelly, and adipose tissue. J Biomed Mater Res B Appl Biomater. 2018;106(1):61–72. | ||
Pikula M, Marek-Trzonkowska N, Wardowska A, Renkielska A, Trzonkowski P. Adipose tissue-derived stem cells in clinical applications. Expert Opin Biol Ther. 2013;13(10):1357–1370. | ||
Zuk PA, Zhu M, Mizuno H, et al. Multilineage cells from human adipose tissue: implications for cell-based therapies. Tissue Eng. 2001;7(2):211–228. | ||
Domenis R, Lazzaro L, Calabrese S, et al. Adipose tissue derived stem cells: in vitro and in vivo analysis of a standard and three commercially available cell-assisted lipotransfer techniques. Stem Cell Res Ther. 2015;6:2. | ||
Zarychta-Wisniewska W, Burdzinska A, Kulesza A, et al. Bmp-12 activates tenogenic pathway in human adipose stem cells and affects their immunomodulatory and secretory properties. BMC Cell Biol. 2017;18(1):13. | ||
Yang G, Rothrauff BB, Lin H, Yu S, Tuan RS. Tendon-derived extracellular matrix enhances transforming growth factor-β3-induced tenogenic differentiation of human adipose-derived stem cells. Tissue Eng Part A. 2017;23(3–4):166–176. | ||
Ricco S, Renzi S, Del Bue M, et al. Allogeneic adipose tissue-derived mesenchymal stem cells in combination with platelet rich plasma are safe and effective in the therapy of superficial digital flexor tendonitis in the horse. Int J Immunopathol Pharmacol. 2013;26(1 Suppl):61–68. | ||
Stanco D, Vigano M, Perucca Orfei C, et al. Multidifferentiation potential of human mesenchymal stem cells from adipose tissue and hamstring tendons for musculoskeletal cell-based therapy. Regen Med. 2015;10(6):729–743. | ||
Raabe O, Shell K, Fietz D, et al. Tenogenic differentiation of equine adipose-tissue-derived stem cells under the influence of tensile strain, growth differentiation factors and various oxygen tensions. Cell Tissue Res. 2013;352(3):509–521. | ||
Jeffery N, Richardson S, Beall C, Harries LW. The species origin of the cellular microenvironment influences markers of beta cell fate and function in EndoC-βH1 cells. Exp Cell Res. 2017;361(2):284–291. | ||
Ogawa T, Sukotjo C, Nishimura I. Modulated bone matrix-related gene expression is associated with differences in interfacial strength of different implant surface roughness. J Prosthodont. 2002;11(4):241–247. |
 © 2018 The Author(s). This work is published and licensed by Dove Medical Press Limited. The
full terms of this license are available at https://www.dovepress.com/terms
and incorporate the Creative Commons Attribution
- Non Commercial (unported, 3.0) License.
By accessing the work you hereby accept the Terms. Non-commercial uses of the work are permitted
without any further permission from Dove Medical Press Limited, provided the work is properly
attributed. For permission for commercial use of this work, please see paragraphs 4.2 and 5 of our Terms.
© 2018 The Author(s). This work is published and licensed by Dove Medical Press Limited. The
full terms of this license are available at https://www.dovepress.com/terms
and incorporate the Creative Commons Attribution
- Non Commercial (unported, 3.0) License.
By accessing the work you hereby accept the Terms. Non-commercial uses of the work are permitted
without any further permission from Dove Medical Press Limited, provided the work is properly
attributed. For permission for commercial use of this work, please see paragraphs 4.2 and 5 of our Terms.