Back to Journals » Nanotechnology, Science and Applications » Volume 13
Nanoparticles Affect the Expression Stability of Housekeeping Genes in Plant Cells
Authors Selvakesavan RK ![]() , Franklin G
, Franklin G ![]()
Received 3 June 2020
Accepted for publication 30 July 2020
Published 13 August 2020 Volume 2020:13 Pages 77—88
DOI https://doi.org/10.2147/NSA.S265641
Checked for plagiarism Yes
Review by Single anonymous peer review
Peer reviewer comments 2
Editor who approved publication: Professor Israel Rubinstein
Rajendran K Selvakesavan, Gregory Franklin
Institute of Plant Genetics of the Polish Academy of Sciences, Poznan 60-479, Poland
Correspondence: Gregory Franklin Tel +48 61 655 0266
Email [email protected]
Purpose: We report on the expression stability of several housekeeping/reference genes that can be used in the normalization of target gene expression in quantitative real-time PCR (qRT-PCR) analysis of plant cells challenged with metal nanoparticles (NPs).
Materials and Methods: Uniform cell suspension cultures of Hypericum perforatum were treated with 25 mg/l silver and gold NPs (14– 15 nm in diameter). Cells were collected after 0.5, 4.0, and 12 h. The total RNA isolated from the cells was analyzed for the stability of ACT2, ACT3, ACT7, EF1-α, GAPDH, H2A, TUB-α, TUB-β, and 18S rRNA genes using qRT-PCR. The cycle threshold (Ct) values of the genes were analyzed using the geNorm, NormFinder, BestKeeper, and RefFinder statistical algorithms to rank gene stability. The stability of the top-ranked genes was validated by normalizing the expression of HYP1.
Results: The expression of the tested housekeeping genes varied with treatment duration and NP types. EF1-α in gold NP treatment and TUB-α and EF1-α in silver NP treatment ranked among the top three positions. However, none of the genes retained their top ranking with time and across NP types.
Conclusion: EF1-α can be used as a reference for treatment involving both silver and gold NPs in H. perforatum cells. TUB-α can be used only for silver NP-treated cells. The expression instability of most of the housekeeping genes highlights the importance of systematic standardization of reference genes for NP treatment conditions to draw proper conclusions on the target gene expression.
Keywords: nanoparticle, plant cell, Hypericum, gene expression, reference gene, quantitative real-time PCR
Introduction
Metal nanoparticles (NPs) possess better physico-chemical properties than those of their bulk form and are useful in various industrial sectors, including agriculture. Recent developments in NP-based pesticides, fungicides, and fertilizers have significantly increased the possibilities of the direct exposure of plants to engineered NPs. Similarly, the environmental concentration of contaminating NPs is steadily increasing owing to the release of metal NPs as waste products from various consumer industries and products. Thus, plants are directly exposed to NPs present in crop protectants and plant growth enhancers, and indirectly to NPs present in the environment as contaminants. These exposures have spurred recent studies regarding the impact of nanomaterials on plant metabolism.1
Quantitative real-time PCR (qRT-PCR) analysis of gene expression would provide a clear understanding of the changes in the physiology, biochemistry, metabolism, and other aspects of plants under various physiological and environmental conditions. This technique is widely used for the quantification of gene expression, reflecting its accuracy across a relatively broad and dynamic range.2 However, the reliability of the results depends on the reference genes used in the normalization step of qRT-PCR. A good reference gene should be consistently expressed under both control and experimental conditions. Glyceraldehyde-3-phosphate dehydrogenase (GAPDH), actin (ACT), tubulin alpha (TUB-α), tubulin beta (TUB-β), translation elongation factor, ubiquitin-conjugating enzyme (UBC), 18S ribosomal RNA (18SrRNA), mitogen-activated protein kinase 6 (MPK6), and 25S ribosomal RNA (25SrRNA) are common reference genes.2,3
The stability of reference genes differs according to the experimental conditions and plant species. EF1-α has been found to be the most stable gene under heat stress, whereas the ADP-ribosylation factor 1 (ADP) gene is the most stable under salt stress in Hordeum brevisubulatum.4 In Calotropis procera subjected to salt stress, CYP23 has been found to be the most stable reference gene.5 The GAPDH gene has been demonstrated to be the most reliable reference gene for cold stress, whereas it is less stable under heat stress in Hypericum perforatum plants.6 These variations in the expression of the housekeeping genes in different conditions highlight the need to assess gene stability in each experimental condition before using the genes for the normalization of target gene expression in qRT-PCR analysis.
Despite the need to understand plant responses upon NP stress at the transcriptional level, a formal standardization of reference genes for the qRT-PCR analysis of gene expression in NP-treated plant cells has not been reported. Plant culture systems can possibly avoid the interference of the structural complexity of plant tissues and environmental fluctuations, which would aid in understanding the response of plants to NPs at the cellular level more precisely. Plant cell culture systems can also be potentially useful in the exploitation of NPs as elicitors of important secondary metabolites. These reasons prompted the present evaluation of the stability of nine housekeeping genes—ACT2, ACT3, ACT7, EF1-α, GAPDH, Histone H2A (H2A), TUB-α, TUB-β, and 18SrRNA— in plant cells challenged with NPs.
Materials and Methods
Nanoparticle Size, Polydispersity Index, and Zeta Potential
Water dispersions of silver (US7140) and gold (US7805) NPs (14–15 nm) were purchased from US Research Nanomaterials Inc. (Houston, TX, USA). These NPs were diluted to 25 mg/L in Millipore water. They were characterized by mean size, polydispersity index (PDI), and zeta potential using dynamic light spectroscopy with a Mastersizer 3000 zetasizer (Malvern Instruments, Malvern, UK).
Fate of Nanoparticles in Culture Medium
To understand the changes of the NPs in culture medium, NPs diluted to 25 mg/L in MS medium were spectroscopically characterized using a model UV-1800 spectrophotometer (Shimadzu, Kyoto, Japan). The ultraviolet/visible (UV-VIS) spectra were recorded from 190 to 1000 nm with a stepwise increment of 1 nm.
Nanoparticle Treatment of H. perforatum Suspension Cultures
Various concentrations of silver NPs (5–50 mg/L) were added to H. perforatum (cv Helos) suspension cultures, which were then analyzed for changes in color, secondary metabolic profiles, and alkalization. Based on these preliminary data, the 25 mg/L concentration was selected and used for the subsequent experiments. Final concentrations of 25 mg/L of the silver and gold NPs were added to 50 mL cell suspension cultures containing approximately 150 mg (fresh weight) cells/mL in 250 mL Erlenmeyer flasks in triplicate. Cultures that received a corresponding volume of sterile distilled water served as the control. Samples (10 mL) collected at 0.5, 4, and 12 h were filtered through a PluriStrainer® 1 μm filter (pluriSelect, Leipzig, Germany) to remove the medium. The cells were collected in 50 mL Falcon tubes and frozen in liquid nitrogen.
RNA Isolation and cDNA Synthesis
Approximately 100 mg of the frozen cells from NP treated and control cultures were ground into fine powder using liquid nitrogen and a sterile, pre-chilled mortar and pestle. Total RNA was isolated using a spectrum RNA extraction kit (Sigma-Aldrich, St. Louis, MO, USA) following the manufacturer’s information. Column DNase treatment (Sigma-Aldrich) was performed to remove contaminating DNA. RNA quantity was measured using a NanoDrop™ OneC (Thermo Fisher Scientific, Waltham, MA, USA). RNA integrity (RIN) was measured using the 2100 Bioanalyzer System (Agilent Technologies, Santa Clara, CA, USA). Approximately 1 µg of RNA with a RIN value >7 was converted to cDNA using the M-MLV Reverse Transcriptase kit (Promega, Madison, WI, USA) following the manufacturer’s instructions.
Genes, Primers, and qRT-PCR Conditions
Nine housekeeping genes (ACT2, ACT3, ACT7, EF1-α, GAPDH, H2A, TUB-α, TUB-β, and 18SrRNA) were tested as candidate reference genes (Table 1). The forward and reverse primer sequences used in the amplification of these genes were derived from previous reports.2,6 Primers were synthesized and their specificity was tested using PCR and qRT-PCR based on melting curve analysis. Amplification of specific fragments of the genes using qRT-PCR was carried out in a Lightcycler 480 real-time PCR system (Roche, Basel, Switzerland) using the SYBR Green-based PCR assay. The final volume for each reaction was 10 μL with the following components: 4.2 μL diluted cDNA template (0.1 μg), 5 μL SensiFAST SYBR No-ROX (Bioline, London, UK), 0.4 μL forward primer (10 μM), and 0.4 μL reverse primer (10 μM). The reaction was conducted in 96-well plates (Brooks Life Sciences, Manchester, UK) at 95°C for 5 min, followed by 35 cycles of denaturation at 95°C for 10 s, annealing at 60°C for 15 s, and extension at 72°C for 25 s. The melting curve was obtained by heating the amplicon from 65°C to 97°C in the continuous acquisition mode and five acquisitions at each temperature. qRT-PCR analysis was performed with three technical replicates for each biological replicate. The standard curve for each set of primers was generated with 10-fold serial dilution of the pooled cDNA of all treatment conditions. Average cycle threshold (Ct) values for each dilution were used to calculate the amplification efficiency (E%) of each primer pair using the equation: E (%) = (10(–1/slope)–1) × 100%.7,8 The E% of all primer sets was 90% to 110% (Table 1).
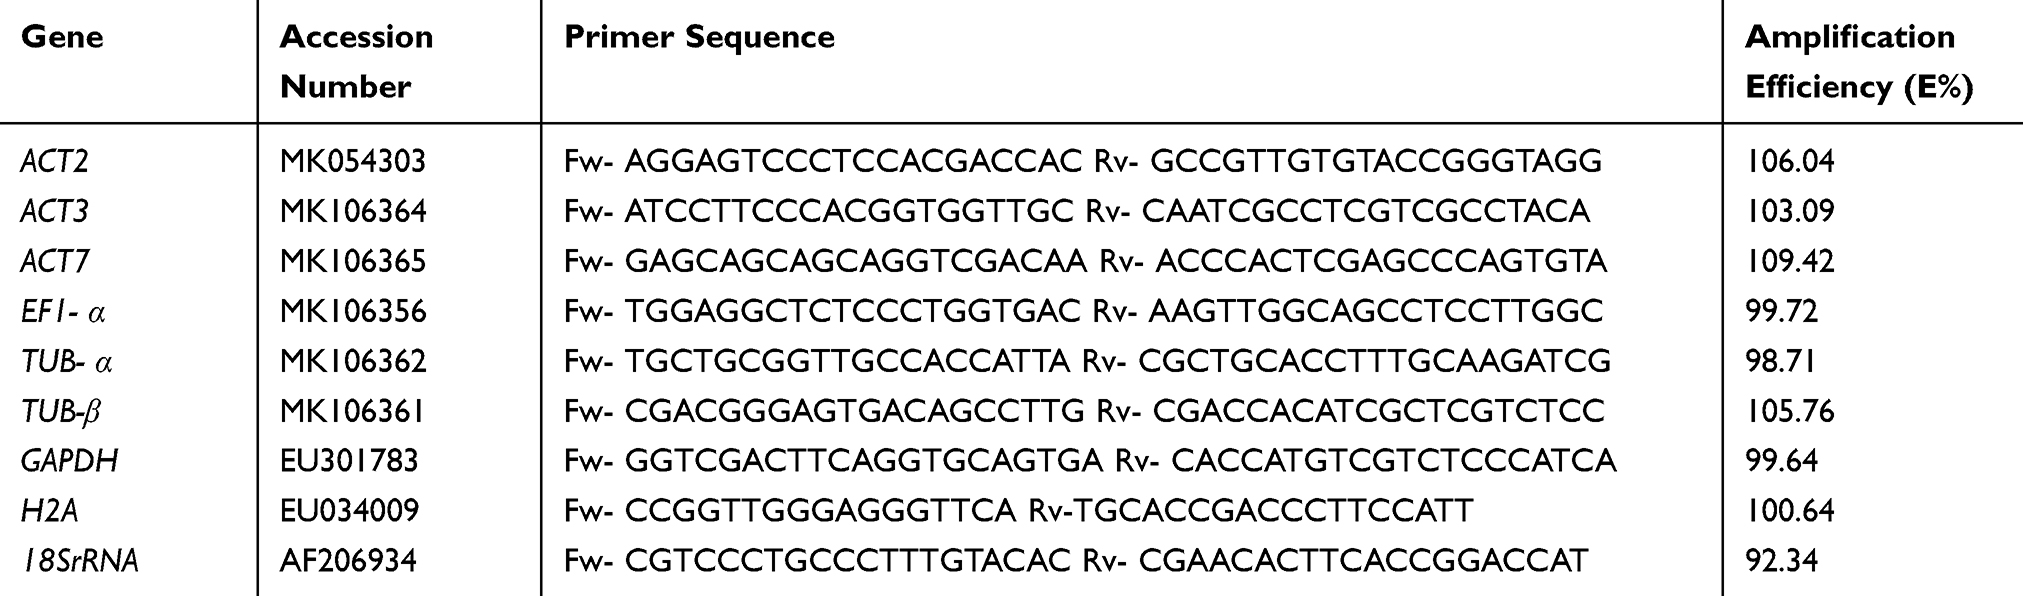 |
Table 1 Details of the Housekeeping Genes Tested for Their Stability After Gold and Silver NP Treatment |
Ranking of Genes Based on Ct Values
To test the stability of the selected genes in the various NP treatment conditions, the Ct values obtained in qRT-PCR analyses were analyzed using four statistical algorithms: geNorm, NormFinder, BestKeeper, and RefFinder. The mean pairwise variation (V) between the Ct values of the tested genes was used to calculate the expression stability value (M) of each reference gene in the geNorm analysis.9 An ANOVA-based model was applied to determine inter- and intra-group variations of the Ct values of the reference genes. The findings were used to calculate the expression stability value in NormFinder.10 The standard deviation and coefficient of variance of raw Ct values were used in the calculation of expression stability of the candidate reference genes in BestKeeper.11 All the statistical data were used to generate a comprehensive ranking of genes in RefFinder.12
Validation of Housekeeping Genes for Stability Upon Nanoparticle Treatment
Phenolic oxidative coupling protein (HYP1), a gene that is up-regulated by various biotic and abiotic stress conditions in H. perforatum, was used as the target gene to confirm the stability of the reference genes predicted by the statistical analyses. The relative expression of HYP1 after NP treatment at different times was calculated by normalizing with the most and least stable reference genes by 2−ΔΔCt method.7
Results and Discussion
Characteristics of Nanoparticles
The mean particle size of both silver and gold NPs was higher than the actual sizes reported by the manufacturer. The mean size of silver and gold NPs was 38.57 (nm diameter) and 84.05 (nm diameter), respectively (Table 2). The size distribution of silver and gold NPs is shown in Figure 1. The PDI of silver and gold NP suspensions was 0.289 and 0.178, respectively. The zeta potential of silver and gold NPs was −9.56 and −13.4, respectively. The UV-VIS spectra of the NPs remained more or less similar in the MS medium after different time-points (Figure 2).
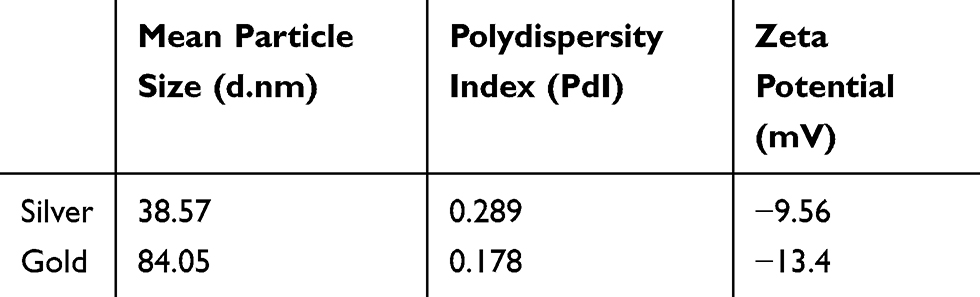 |
Table 2 Mean Particle Size, Polydispersity Index and Zeta Potential of the NPs |
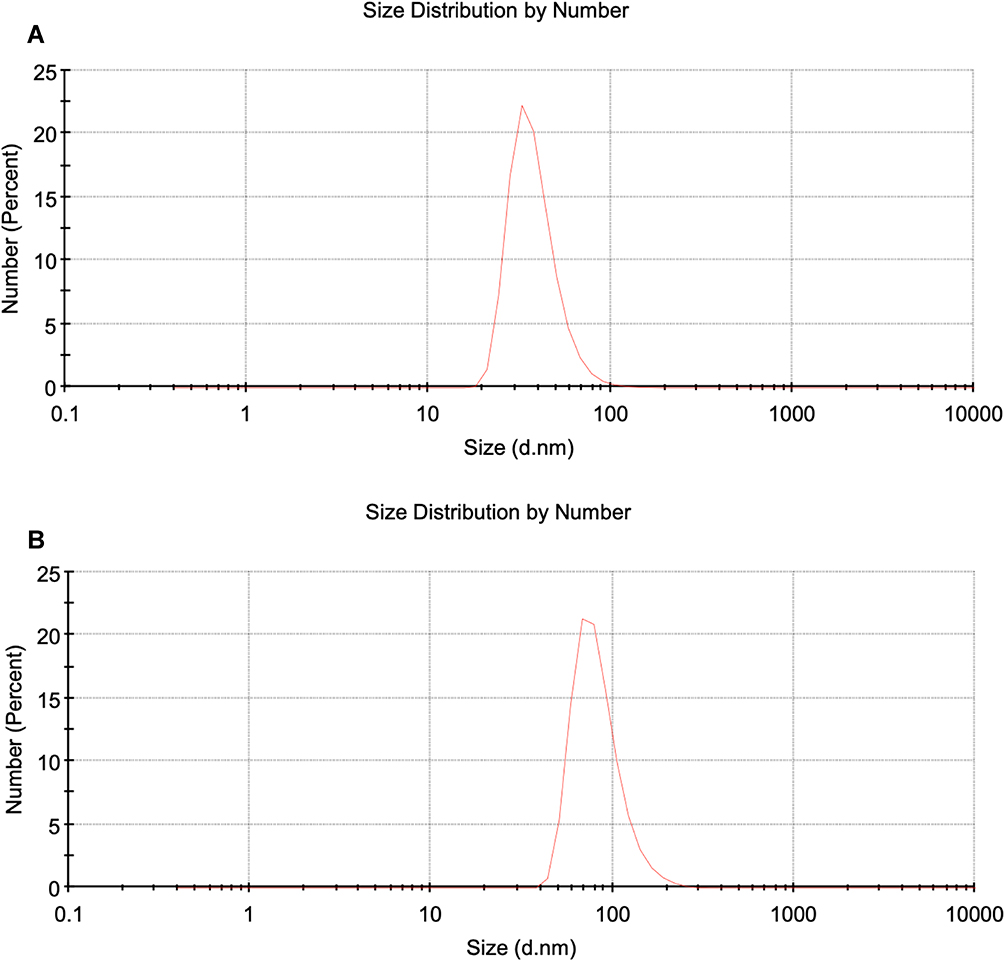 |
Figure 1 Size distribution of silver (A) and gold (B) NPs used in the present study. |
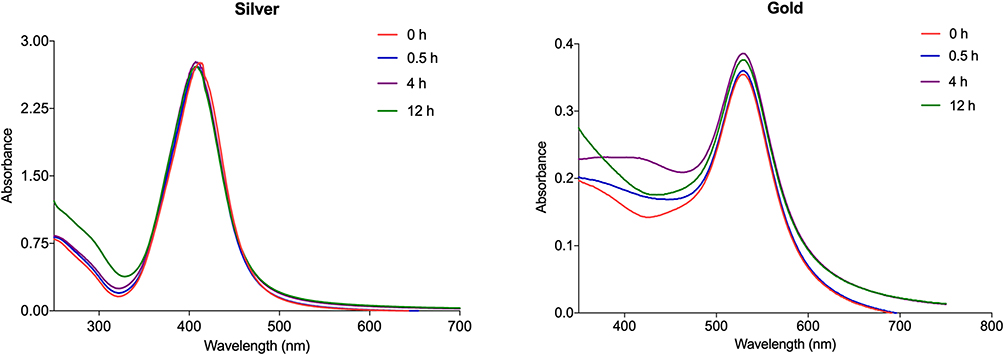 |
Figure 2 UV-VIS spectra of NPs diluted in MS medium. |
Influence of Nanoparticle Treatment on H. perforatum
Gradual darkening of H. perforatum suspension cultures was observed by time after challenging them with the gold (Figure 3D–F) and silver (Figure 3G–I) NPs. However, no color change was observed in the control (Figure 3A–C). Silver NP treatment reduced cell viability after 12 h (Figure 4C). The cell viability remained almost the same in gold NP-treated (Figure 4B) and control (Figure 4A) cultures. Toxicity mediated by silver NPs involves various mechanisms including the production of reactive oxygen species (ROS).13 A lower level of ROS is involved in the regulation of various cellular functions, while cell death is induced by higher levels of ROS.14–16 Viability of Lemna gibba plant cells reduces after silver NP treatment, which is also significantly correlated with intracellular ROS induction.16 RNA degradation can be rapidly triggered by cell death.17,18 The proportion of mRNA to total RNA was reduced in Escherichia coli treated with silver nitrate compared to untreated E. coli.19
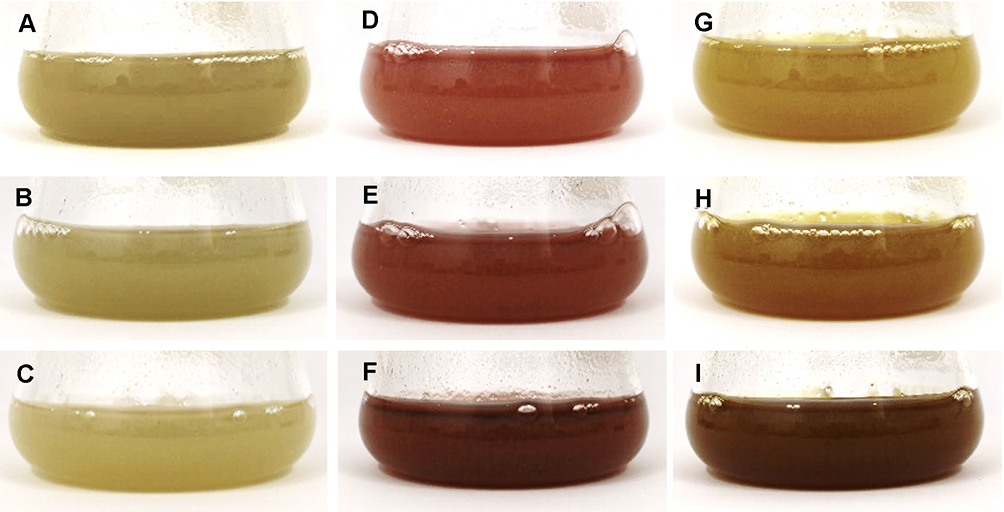 |
Figure 3 H. perforatum cell suspension cultures after NP treatment. Control cultures remained yellowish-green throughout the experimental period ((A) 0.5 h, (B) 4 h (C) and 12 h), whereas cultures gradually darkened with time in the presence of gold ((D) 0.5 h, (E) 4 h, and (F) 12 h), and silver ((G) 0.5 h, (H) 4 h and (I) 12 h), NPs. |
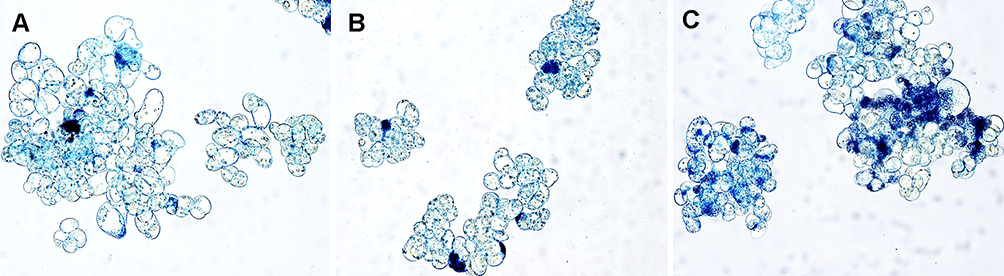 |
Figure 4 Trypan blue staining of control (A), and cultures treated with gold (B) and silver (C) NPs after 12 h showing cell viability. |
Metal NPs reportedly induce both positive and negative changes in major metabolic processes such as seed germination, growth, shoot/root length, biomass, and physiological or biochemical activities.20,21 These effects are largely based on the plant species and the physico-chemical properties of the NPs. Magnetic NPs negatively affect the metabolism and induce biosynthesis of protective compounds in suspension cultures of Tobacco BY-2 cells.22 Biomass fresh weight and production of secondary metabolites reportedly increase after treatment with zinc oxide23 and silver24 NPs in cell suspension cultures of Linum usitatissimum. Copper oxide NPs treatment significantly increases the production of gymnemic acid II and phenolic compounds in Gymnema sylvestre suspension cell cultures.25 Aluminum oxide NPs were toxic for Tobacco BY-2 cells in suspension, which involved the generation of reactive oxygen and nitrogen species.26
Gold and silver NPs generally behave in an opposite manner to each other across plant species. While gold NPs beneficially influence growth and metabolism in various plant species, silver NPs inhibit growth and metabolism. Allium cepa seeds treated with green synthesized gold NPs display enhanced seed germination, emergence, growth, and yield,27 whereas cytotoxic and genotoxic impacts have been observed in A. cepa root tip cells treated with silver NPs.28 The application of gold NPs improved the growth and yield of Brassica juncea.29 Phytotoxic effects that include lower chlorophyll contents, higher superoxide dismutase activity, and less fruit productivity have been reported in Lycopersicon esculentum treated with silver NPs.30 A dose-dependent inhibitory effect of silver NPs has been observed for the germination and subsequent growth and development of Oryza sativa seeds.31 Similar positive and negative impacts of NPs have also been recorded in plant cell suspension cultures. Silver NPs increase malondialdehyde (MDA) and hydrogen peroxide (H2O2) contents in Momordica charantia suspension cell cultures,32 while gold NP treatment enhances biomass accumulation in Prunella vulgaris suspension cell cultures.33
Nanoparticles Affect Expression Stability of Housekeeping Genes
The ACT2, ACT3, ACT7, EF1-α, GAPDH, H2A, TUB-α, TUB-β, and 18SrRNA housekeeping genes were analyzed for their stability upon NP treatment. Agarose gel electrophoresis of the amplicon from PCR and melting curve analyses following qRT-PCR confirmed the primer specificity of all the tested genes. The specific fragments of the selected genes could be efficiently amplified using these primers as revealed by agarose gel electrophoresis (Figure S1, Supplementary data). Melting curve analysis showed a single peak, further confirming the primer specificity (Figure S2, Supplementary data).
All the housekeeping genes were previously examined concerning their stability in different abiotic conditions in plants. ACT2, TUB-β, and EF1- α were the most stable reference genes in different tissues, developmental stages, and stress conditions in H. perforatum.2 Expression of ACT3 was stable in cucumber upon cold and heat stress.34 ACT7 was stably expressed in Corchorus olitorius during drought and water stress.35 GAPDH expression was stable in Arabidopsis under cold, heat, and salt stresses.3 Similarly, the expression of 18SrRNA was stable upon metal stress in Camellia sinensis,36 H2A expression was stable under heat, salt, drought, and dark stresses in Reaumuria soongorica,37 and TUB-α was stably expressed in Hordeum vulgare subjected to salt and cold stresses.38
Ct represents the number of cycles in which the fluorescent signal crosses the background level (threshold) in qRT-PCR. Ct values were used to determine the expression levels of candidate reference genes by boxplot analysis (Figure 5). The Ct values ranged from 14.71 to 29.44, 14.33 to 29.24, and 15.62 to 29.79 at 0.5 h (Figure 5A), 4 h (Figure 3B), and 12 h (Figure 5C), respectively, in both control and NP treatments. The Ct values were lowest for 18SrRNA across the NP treatments and times, and highest for ACT3. Among the genes analyzed, TUB-β showed a high variation of Ct values in cultures treated with NPs for 12 h. The lowest variation of expression levels was observed in 18SrRNA at various times.
 |
Figure 5 BoxPlot showing Ct values of the housekeeping genes in experimental samples taken at 0.5 h (A), 4 h (B) and 12 h (C) post-treatment time points. The line across the box is the median value, whereas the 25th percentile to the 75th percentile is indicated by the lower and upper boxes. The maximum and minimum values are represented by Whiskers. |
Ct values of the control and NP treatments were further analyzed by hierarchical clustering to understand the major differences between the expression patterns of the genes in the different treatment conditions using the ClustVis web tool.39 Heatmap analysis revealed no significant difference compared to the control at 0.5 h of treatment. However, cells treated with silver NPs for longer than 0.5 h showed a greater variation of Ct values than the control and gold NP treatments. Silver NP-treated samples displayed higher Ct values at 4 h and 12 h of treatment, while control and gold NP-treated samples displayed comparatively lower Ct values for the respective genes at these times (Figure 6). The number of mRNA transcripts available for amplification may decrease due to breaks that occur in degraded or partially degraded samples, which may lead to the higher Ct value in the qRT-PCR assay compared to intact RNA.40,41 This correlated with the higher Ct values obtained for the silver NP-treated samples with lower RIN (Table S1, Supplementary data).
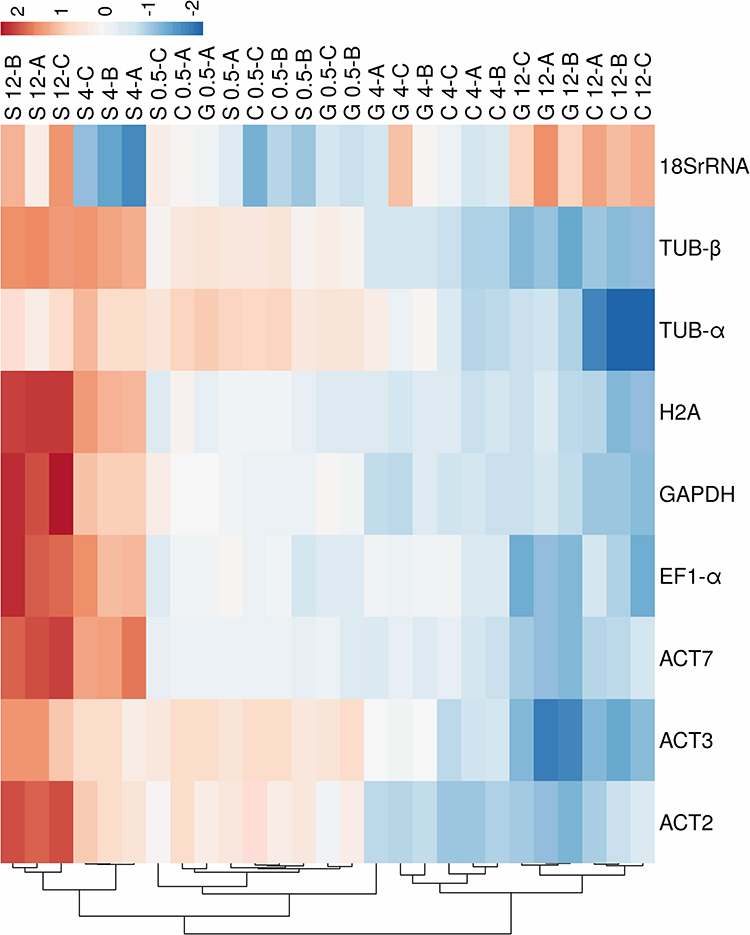 |
Figure 6 Heatmap constructed by hierarchical clustering analysis (HCA) of Ct values of ACT2, ACT3, ACT7, EF1-α, GAPDH, H2A, TUB- α, TUB-β and 18SrRNA genes in control (C), and gold (G) and silver (S) NPs treated cultures at 0.5 h (0.5), 4 h (4) and 12 h (12) post-treatment in three biological replications (A-C). Red color represent positive values or higher Ct values and blue color represents negative values or low Ct values. |
Statistical Analysis of Gene Stability in Nanoparticle Treated Cells
Ct values from all treatment conditions were analyzed together to identify the stable reference gene suitable for all treatment conditions. The genes were ranked for their stability based on the geNorm, NormFinder, BestKeeper analyses of the Ct values of genes at various times of NP treatment.
Each statistical tool predicted different genes as the top reference gene for the same experimental condition (Table S2-S4, Supplementary data). For example, 18SrRNA was the best reference gene for silver NP-treated cells in the BestKeeper analysis, while geNorm and NormFinder ranked 18SrRNA as the least reliable gene. Similar differences in the ranking of reference genes between statistical algorithms were reported. Hence, geometrical mean of the results from different algorithms generally ranked by RefFinder was used to precisely select the reference genes.42 RefFinder analysis results revealed TUB-α, EF1-α, and ACT7 as top three stable genes at 0.5 h treatment with gold and silver NPs (Table 3). After 4 h of treatment, EF1-α, H2A, and GAPDH were ranked as top three stable genes for gold NPs, with EF1-α, TUB-α, and GAPDH being the top three stable genes when silver NPs were used. At 12 h post-treatment, GAPDH, H2A, and EF1-α genes were the top three for gold NPs, and TUB-α, GAPDH, and EF1-α were the top three genes for silver NPs. Interestingly, except for EF1-α, none of the tested genes consistently occupied the top three positions for both NPs and their treatment durations.
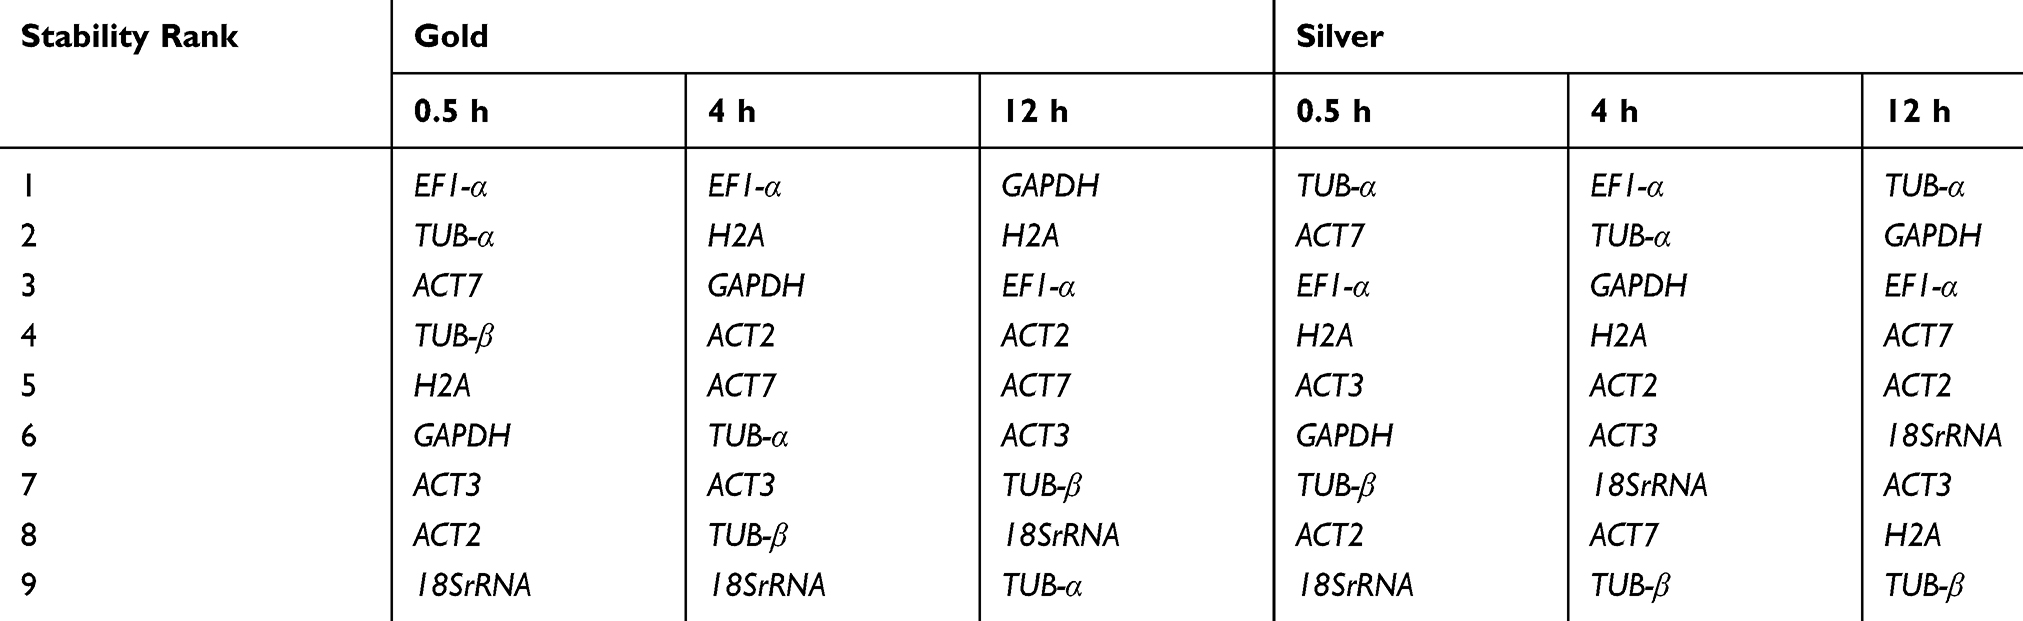 |
Table 3 Comprehensive Stability Ranking of Genes Based on RefFinder Analysis at Various Time Points After NP Treatment of H. perforatum Cells |
Although EF1-α ranked in the top three positions for both NPs and for the treatment times, its position in the ranking was not consistent in all the variants. EF1-α catalyzes the binding of aminoacyl-tRNA to the A-site of the ribosome.43,44 The gene exhibits higher expression stability to heat and cold stresses in Urochloa brizantha,44 cold and salt stress in Caragana intermedia,45 and cold, heat, drought, and salt stresses in Achyranthes bidentate.46 Similarly, TUB-α ranked in the top two positions across treatment periods for the silver NPs, while it ranked very low in the case of gold NP treatment. Nevertheless, TUB-α expression was stable across various abiotic stresses in plants.38 All these findings clearly highlight the necessity of standardizing reference genes for each parameter when NPs are used.
Validation of Gene Stability
HYP1 gene expression for both NPs and for all treatment durations was normalized with the Ct values of housekeeping genes to validate stability. The fold change in HYP1 gene expression was approximately equal at any given time of NP treatment when its expression was normalized with the top-ranking housekeeping genes of the corresponding variant. However, when normalized according to the least ranking gene, a difference in the fold change was evident as early as 30 min, with further deviation as the treatment time increased. While normalization using 18SrRNA for 4 h and 12 h of silver NP treatment indicated down-regulation of HYP1 expression, normalization with other genes indicated upregulation of the gene for the same variants. Similarly, TUB-α showed a higher variation in its expression compared to other housekeeping genes at 12 h of gold NP treatment (Figure 7). Upregulation of HYP1 was observed at 12 h after treatment with gold and silver NPs. However, no significant change in the expression level was observed at 0.5 h and 4 h.
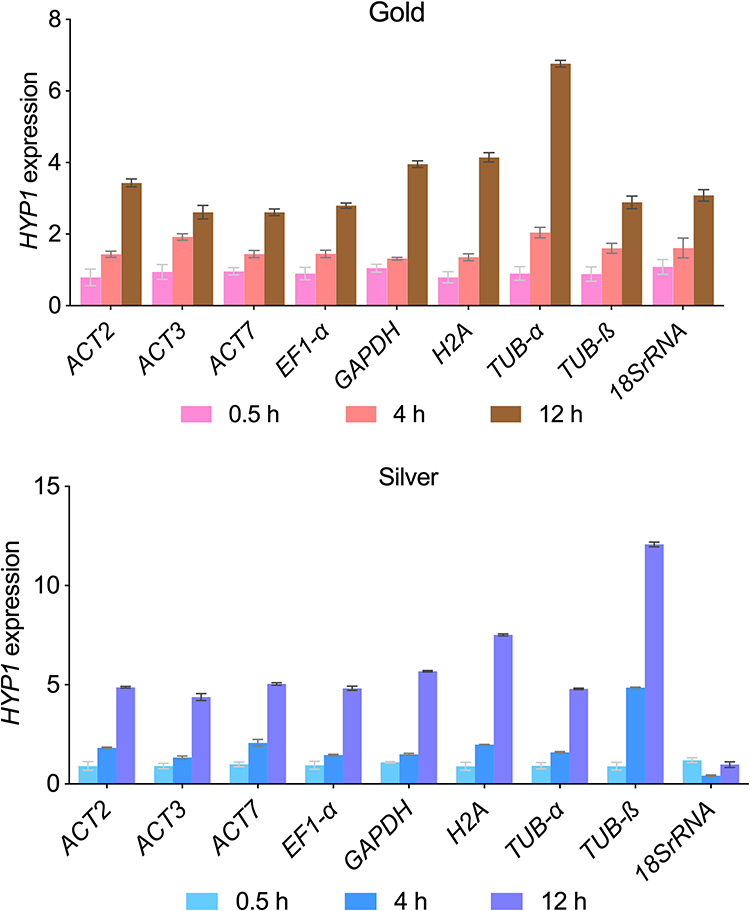 |
Figure 7 Gold and silver NPs induced HYP1 gene expression in H. perforatum cells after normalization with the expression of housekeeping genes. |
All the above observations emphasize that the expression of the housekeeping genes also varies between NPs and their treatment durations. Nevertheless, qRT-PCR studies conducted to date with NP-treated plant samples have used reference genes without formal standardization or validation. The response of A. thaliana to treatment with silver NPs was studied using the mitogen-activated protein kinase 6 (MPK6) gene as the reference without validation.47 In another study, EF1-α and 18SrRNA genes were selected as the references based on microarray data in the normalization of target gene expression in qRT-PCR analysis of A. thaliana treated with cerium oxide and titanium dioxide NPs.48 The ACT2 gene was used as the reference in the study of the response of A. thaliana to cerium and indium oxides,49 zinc oxide,50 and silver51 NPs without validation. However, the expression of the ACT2 gene fluctuated drastically with time during treatment with NPs, even in the uniform cell suspension cultures that were maintained under tightly controlled conditions. Normalization of HYP1 gene expression with the ACT2 gene would lead to an erroneous conclusion.
Conclusions
To the best of our knowledge, the present study is the only systematic analysis of the stability of housekeeping genes in plant cells treated with NPs. Results of this study clearly show that the expression of tested housekeeping genes varies in cultures treated with the same NPs based on the treatment duration. The variation between the gold and silver NPs was pronounced. EF1-α ranked amongst the top three for both types of NPs and their treatment duration. Thus, the gene can be used as a reliable reference for the normalization of qRT-PCR in studies of gene expression in H. perforatum cells treated with gold and silver NPs. Similarly, TUB-α ranked in the top two when silver NPs were used for the treatment. Thus, this gene can be used as a reference for silver NP treatment in H. perforatum cells. However, most of the other genes were not consistent in their expression with time for the same NP treatment, clearly emphasizing the need for a formal standardization of reference genes for every condition of NP treatment.
Acknowledgments
This work was supported by the National Science Centre (NCN), OPUS project no Reg. No 2016/21/B/NZ9/01980. RKS received a postdoctoral fellowship from this project.
Disclosure
The authors report no conflicts of interest in this work.
References
1. Kruszka D, Sawikowska A, Selvakesavan, et al. Silver nanoparticles affect phenolic and phytoalexin composition of Arabidopsis thaliana. Sci Total Environ. 2020;716:135361. doi:10.1016/j.scitotenv.2019.135361
2. Zhou W, Wang S, Yang L, et al. Reference genes for qRT-PCR normalisation in different tissues, developmental stages, and stress conditions of Hypericum perforatum. PeerJ. 2019;7:e7133–e7133. doi:10.7717/peerj.7133
3. Jin Y, Liu F, Huang W, Sun Q, Huang X. Identification of reliable reference genes for qRT-PCR in the ephemeral plant Arabidopsis pumila based on full-length transcriptome data. Sci Rep. 2019;9(1):8408. doi:10.1038/s41598-019-44849-1
4. Zhang L, Zhang Q, Jiang Y, Li Y, Zhang H, Li R. Reference genes identification for normalization of qPCR under multiple stresses in Hordeum brevisubulatum. Plant Meth. 2018;14(1):110. doi:10.1186/s13007-018-0379-3
5. Coêlho MRV, Rivas R, Ferreira-Neto JRC, et al. Reference genes selection for Calotropis procera under different salt stress conditions. PLoS One. 2019;14(4):1–20. doi:10.1371/journal.pone.0215729
6. Velada I, Ragonezi C, Arnholdt-Schmitt B, Cardoso H. Reference genes selection and normalization of oxidative stress responsive genes upon different temperature stress conditions in Hypericum perforatum L. PLoS One. 2014;9(12):e115206–e115206. doi:10.1371/journal.pone.0115206
7. Kubista M, Andrade JM, Bengtsson M, et al. The real-time polymerase chain reaction. Mol Aspects Med. 2006;27(2–3):95–125. doi:10.1016/j.mam.2005.12.007
8. Laamiri N, Aouini R, Marnissi B, Ghram A, Hmila I. A multiplex real-time RT-PCR for simultaneous detection of four most common avian respiratory viruses. Virology. 2018;515:29–37. doi:10.1016/j.virol.2017.11.021
9. Vandesompele J, De Preter K, Pattyn F, et al. Accurate normalization of real-time quantitative RT-PCR data by geometric averaging of multiple internal control genes. Genome Biol. 2002;3(7):
10. Andersen CL, Jensen JL, Ørntoft TF. Normalization of real-time quantitative reverse transcription-PCR data: a model-based variance estimation approach to identify genes suited for normalization, applied to bladder and colon cancer data sets. Cancer Res. 2004;64(15):5245LP- 5250. doi:10.1158/0008-5472.CAN-04-0496
11. Pfaffl MW, Tichopad A, Prgomet C, Neuvians TP. Determination of stable housekeeping genes, differentially regulated target genes and sample integrity: bestKeeper – excel-based tool using pair-wise correlations. Biotechnol Lett. 2004;26(6):509–515. doi:10.1023/B:BILE.0000019559.84305.47
12. Xie F, Xiao P, Chen D, Xu L, Zhang B. miRDeepFinder: a miRNA analysis tool for deep sequencing of plant small RNAs. Plant Mol Biol. 2012;80(1):75–84. doi:10.1007/s11103-012-9885-2
13. Marslin G, Sheeba CJ, Franklin G. Nanoparticles alter secondary metabolism in plants via ROS burst. Front Plant Sci. 2017;8:832. doi:10.3389/fpls.2017.00832
14. Lee JH, Kim YS, Song KS, et al. Biopersistence of silver nanoparticles in tissues from Sprague-Dawley rats. Part Fibre Toxicol. 2013;10:36. doi:10.1186/1743-8977-10-36
15. Gurunathan S, Qasim M, Park C, et al. Cytotoxicity and transcriptomic analysis of silver nanoparticles in mouse embryonic fibroblast cells. Int J Mol Sci. 2018;19(11):3618. doi:10.3390/ijms19113618
16. Oukarroum A, Barhoumi L, Pirastru L, Dewez D. Silver nanoparticle toxicity effect on growth and cellular viability of the aquatic plant Lemna gibba. Environ Toxicol Chem. 2013;32(4):902–907. doi:10.1002/etc.2131
17. Thomas MP, Liu X, Whangbo J, et al. Apoptosis triggers specific, rapid, and global mRNA decay with 3ʹ uridylated intermediates degraded by DIS3L2. Cell Rep. 2015;11(7):1079–1089. doi:10.1016/j.celrep.2015.04.026
18. Falcone C, Mazzoni C. RNA stability and metabolism in regulated cell death, aging and diseases. FEMS Yeast Res. 2018;18:6. doi:10.1093/femsyr/foy050
19. Saulou-Bérion C, Gonzalez I, Enjalbert B, et al. Escherichia coli under ionic silver stress: an integrative approach to explore transcriptional, physiological and biochemical responses. PLoS One. 2015;10(12):e0145748. doi:10.1371/journal.pone.0145748
20. Mosa KA, El-Naggar M, Ramamoorthy K, et al. Copper nanoparticles induced genotoxicty, oxidative stress, and changes in Superoxide Dismutase (SOD) gene expression in Cucumber (Cucumis sativus) plants. Front Plant Sci. 2018;9:872. doi:10.3389/fpls.2018.00872
21. Yan A, Chen Z. Impacts of silver nanoparticles on plants: a focus on the phytotoxicity and underlying mechanism. Int J Mol Sci. 2019;20(5):1003. doi:10.3390/ijms20051003
22. Krystofova O, Sochor J, Zitka O, et al. Effect of magnetic nanoparticles on tobacco BY-2 cell suspension culture. Int J Environ Res Public Health. 2012;10(1):47–71. doi:10.3390/ijerph10010047
23. Abbasi BH, Zahir A, Ahmad W, Nadeem M, Giglioli-Guivarc’h N, Hano C. Biogenic zinc oxide nanoparticles-enhanced biosynthesis of lignans and neolignans in cell suspension cultures of Linum usitatissimum L. Artif Cells Nanomedicine Biotechnol. 2019;47(1):1367–1373. doi:10.1080/21691401.2019.1596942
24. Zahir A, Nadeem M, Ahmad W, Giglioli-Guivarc’h N, Hano C, Abbasi BH. Chemogenic silver nanoparticles enhance lignans and neolignans in cell suspension cultures of Linum usitatissimum L. Plant Cell Tissue Organ Cult. 2019;136(3):589–596. doi:10.1007/s11240-018-01539-6
25. Chung I-M, Rajakumar G, Subramanian U, Venkidasamy B, Thiruvengadam M. Impact of copper oxide nanoparticles on enhancement of bioactive compounds using cell suspension cultures of gymnema sylvestre (Retz.). R Br Appl Sci. 2019;9:2165. doi:10.3390/app9102165
26. Poborilova Z, Opatrilova R, Babula P. Toxicity of aluminium oxide nanoparticles demonstrated using a BY-2 plant cell suspension culture model. Environ Exp Bot. 2013;91:1–11. doi:10.1016/J.ENVEXPBOT.2013.03.002
27. Acharya P, Jayaprakasha GK, Crosby KM, Jifon JL, Patil BS. Green-synthesized nanoparticles enhanced seedling growth, yield, and quality of onion (Allium cepa L.). ACS Sustain Chem Eng. 2019;7(17):14580–14590. doi:10.1021/acssuschemeng.9b02180
28. Kumari M, Mukherjee A, Chandrasekaran N. Genotoxicity of silver nanoparticles in Allium cepa. Sci Total Environ. 2009;407(19):5243–5246. doi:10.1016/j.scitotenv.2009.06.024
29. Arora S, Sharma P, Kumar S, Nayan R, Khanna PK, Zaidi MGH. Gold-nanoparticle induced enhancement in growth and seed yield of Brassica juncea. Plant Growth Regul. 2012;66(3):303–310. doi:10.1007/s10725-011-9649-z
30. Song U, Jun H, Waldman B, et al. Functional analyses of nanoparticle toxicity: a comparative study of the effects of TiO2 and Ag on tomatoes (Lycopersicon esculentum). Ecotoxicol Environ Saf. 2013;93:60–67. doi:10.1016/j.ecoenv.2013.03.033
31. Ottoni CA, Lima Neto MC, Léo P, Ortolan BD, Barbieri E, De Souza AO. Environmental impact of biogenic silver nanoparticles in soil and aquatic organisms. Chemosphere. 2020;239:124698. doi:10.1016/j.chemosphere.2019.124698
32. Chung I-M, Rekha K, Rajakumar G, Thiruvengadam M. Elicitation of silver nanoparticles enhanced the secondary metabolites and pharmacological activities in cell suspension cultures of bitter gourd. 3 Biotech. 2018;8(10):412. doi:10.1007/s13205-018-1439-0
33. Fazal H, Abbasi BH, Ahmad N, et al. Sustainable production of biomass and industrially important secondary metabolites in cell cultures of selfheal (Prunella vulgaris L.) elicited by silver and gold nanoparticles. Artif Cells Nanomedicine Biotechnol. 2019;47(1):2553–2561. doi:10.1080/21691401.2019.1625913
34. Wan H, Zhao Z, Qian C, Sui Y, Malik AA, Chen J. Selection of appropriate reference genes for gene expression studies by quantitative real-time polymerase chain reaction in cucumber. Anal Biochem. 2010;399(2):257–261. doi:10.1016/j.ab.2009.12.008
35. Hossain MS, Ahmed R, Haque MS, Alam MM, Islam MS. Identification and validation of reference genes for real-time quantitative RT-PCR analysis in jute. BMC Mol Biol. 2019;20(1):13. doi:10.1186/s12867-019-0130-2
36. Le WM, Li QH, Xin HH, Chen X, Zhu XJ, Li XH. Reliable reference genes for normalization of gene expression data in tea plants (Camellia sinensis) exposed to metal stresses. PLoS One. 2017;12(4):e0175863–e0175863. doi:10.1371/journal.pone.0175863
37. Yan X, Dong X, Zhang W, et al. Reference gene selection for quantitative real-time PCR normalization in Reaumuria soongorica. PLoS One. 2014;9(8):e104124–e104124. doi:10.1371/journal.pone.0104124
38. Cai J, Li P, Luo X, et al. Selection of appropriate reference genes for the detection of rhythmic gene expression via quantitative real-time PCR in Tibetan hulless barley. PLoS One. 2018;13(1):e0190559–e0190559. doi:10.1371/journal.pone.0190559
39. Metsalu T, Vilo J. ClustVis: a web tool for visualizing clustering of multivariate data using Principal Component Analysis and heatmap. Nucleic Acids Res. 2015;43(W1):W566–W570. doi:10.1093/nar/gkv468
40. Antonov J, Goldstein DR, Oberli A, et al. Reliable gene expression measurements from degraded RNA by quantitative real-time PCR depend on short amplicons and a proper normalization. Lab Investig. 2005;85(8):1040–1050. doi:10.1038/labinvest.3700303
41. Cholet F, Ijaz UZ, Smith CJ. Differential ratio amplicons (Ramp) for the evaluation of RNA integrity extracted from complex environmental samples. Environ Microbiol. 2019;21(2):827–844. doi:10.1111/1462-2920.14516
42. Sun H, Jiang X, Sun M, Cong H, Qiao F. Evaluation of reference genes for normalizing RT-qPCR in leaves and suspension cells of Cephalotaxus hainanensis under various stimuli. Plant Meth. 2019;15(1):31. doi:10.1186/s13007-019-0415-y
43. Browning KS. The plant translational apparatus. Plant Mol Biol. 1996;32(1):107–144. doi:10.1007/BF00039380
44. Takamori LM, Pereira AVC, Maia Souza G, Vieira LGE, Ferreira Ribas A. Identification of endogenous reference genes for RT-qPCR expression analysis in urochloa brizantha under abiotic stresses. Sci Rep. 2017;7(1):8502. doi:10.1038/s41598-017-09156-7
45. Zhu J, Zhang L, Li W, Han S, Yang W, Qi L. Reference gene selection for quantitative real-time PCR normalization in caragana intermedia under different abiotic stress conditions. PLoS One. 2013;8(1):e53196. doi:10.1371/journal.pone.0053196
46. Li J, Han X, Wang C, et al. Validation of suitable reference genes for RT-qPCR data in achyranthes bidentata blume under different experimental conditions. Front Plant Sci. 2017;8:776. doi:10.3389/fpls.2017.00776
47. Kaveh R, Li Y-S, Ranjbar S, Tehrani R, Brueck CL, Van Aken B. Changes in Arabidopsis thaliana gene expression in response to silver nanoparticles and silver ions. Environ Sci Technol. 2013;47(18):10637–10644. doi:10.1021/es402209w
48. Tumburu L, Andersen CP, Rygiewicz PT, Reichman JR. Phenotypic and genomic responses to titanium dioxide and cerium oxide nanoparticles in Arabidopsis germinants. Environ Toxicol Chem. 2015;34(1):70–83. doi:10.1002/etc.2756
49. Ma C, Chhikara S, Xing B, Musante C, White JC, Dhankher OP. Physiological and molecular response of Arabidopsis thaliana (L.) to nanoparticle cerium and indium oxide exposure. ACS Sustain Chem Eng. 2013;1(7):768–778. doi:10.1021/sc400098h
50. Wang X, Yang X, Chen S, et al. Zinc oxide nanoparticles affect biomass accumulation and photosynthesis in arabidopsis. Front Plant Sci. 2016;6:1243. doi:10.3389/fpls.2015.01243
51. Gopalakrishnan Nair PM, Chung I-M. Cell cycle and mismatch repair genes as potential biomarkers in Arabidopsis thaliana seedlings exposed to silver nanoparticles. Bull Environ Contam Toxicol. 2014;92(6):719–725. doi:10.1007/s00128-014-1254-1
 © 2020 The Author(s). This work is published and licensed by Dove Medical Press Limited. The
full terms of this license are available at https://www.dovepress.com/terms
and incorporate the Creative Commons Attribution
- Non Commercial (unported, 3.0) License.
By accessing the work you hereby accept the Terms. Non-commercial uses of the work are permitted
without any further permission from Dove Medical Press Limited, provided the work is properly
attributed. For permission for commercial use of this work, please see paragraphs 4.2 and 5 of our Terms.
© 2020 The Author(s). This work is published and licensed by Dove Medical Press Limited. The
full terms of this license are available at https://www.dovepress.com/terms
and incorporate the Creative Commons Attribution
- Non Commercial (unported, 3.0) License.
By accessing the work you hereby accept the Terms. Non-commercial uses of the work are permitted
without any further permission from Dove Medical Press Limited, provided the work is properly
attributed. For permission for commercial use of this work, please see paragraphs 4.2 and 5 of our Terms.