")
Back to Journals » International Journal of Nanomedicine » Volume 19
Nanofabrications of Erythrocyte Membrane-Coated Telmisartan Delivery System Effective for Radiosensitivity of Tumor Cells in Mice Model
Authors Chen S, Wang C , Meng Y, Li P, Pan Y, He M, Ni X
Received 13 October 2023
Accepted for publication 30 January 2024
Published 16 February 2024 Volume 2024:19 Pages 1487—1508
DOI https://doi.org/10.2147/IJN.S441418
Checked for plagiarism Yes
Review by Single anonymous peer review
Peer reviewer comments 2
Editor who approved publication: Dr Farooq A. Shiekh
Shaoqing Chen,1,2 Cheng Wang,3 Yanyan Meng,1– 3 Pengyin Li,1– 3 Yiwen Pan,1– 3 Mu He,1,2 Xinye Ni1,2
1Department of Radiotherapy, the Affiliated Changzhou No. 2 People’s Hospital of Nanjing Medical University, Changzhou Medical Center, Nanjing Medical University, Changzhou, Jiangsu, 213003, People’s Republic of China; 2Jiangsu Province Engineering Research Center of Medical Physics, Changzhou, Jiangsu, 213003, People’s Republic of China; 3School of Pharmacy, Changzhou University, Changzhou, Jiangsu, 213164, People’s Republic of China
Correspondence: Xinye Ni, Email [email protected]
Background: Radiation stimulates the secretion of tumor stroma and induces resistance, recurrence, and metastasis of stromal-vascular tumors during radiotherapy. The proliferation and activation of tumor-associated fibroblasts (TAFs) are important reasons for the production of tumor stroma. Telmisartan (Tel) can inhibit the proliferation and activation of TAFs (resting TAFs), which may promote radiosensitization. However, Tel has a poor water solubility.
Methods: In this study, self-assembled telmisartan nanoparticles (Tel NPs) were prepared by aqueous solvent diffusion method to solve the insoluble problem of Tel and achieve high drug loading of Tel. Then, erythrocyte membrane (ECM) obtained by hypotonic lysis was coated on the surface of Tel NPs (ECM/Tel) for the achievement of in vivo long circulation and tumor targeting. Immunofluorescence staining, western blot and other biological techniques were used to investigate the effect of ECM/Tel on TAFs activation inhibition (resting effect) and mechanisms involved. The multicellular spheroids (MCSs) model and mouse breast cancer cells (4T1) were constructed to investigate the effect of ECM/Tel on reducing stroma secretion, alleviating hypoxia, and the corresponding promoting radiosensitization effect in vitro. A mouse orthotopic 4T1 breast cancer model was constructed to investigate the radiosensitizing effect of ECM/Tel on inhibiting breast cancer growth and lung metastasis of breast cancer.
Results: ECM/Tel showed good physiological stability and tumor-targeting ability. ECM/Tel could rest TAFs and reduce stroma secretion, alleviate hypoxia, and enhance penetration in tumor microenvironment. In addition, ECM/Tel arrested the cell cycle of 4T1 cells to the radiosensitive G2/M phase. In mouse orthotopic 4T1 breast cancer model, ECM/Tel played a superior role in radiosensitization and significantly inhibited lung metastasis of breast cancer.
Conclusion: ECM/Tel showed synergistical radiosensitization effect on both the tumor microenvironment and tumor cells, which is a promising radiosensitizer in the radiotherapy of stroma-vascular tumors.
Keywords: telmisartan, tumor-associated fibroblasts, tumor hypoxia, G2/M arrest, radiosensitization
Introduction
So far, radiotherapy is still widely recognized as one of the most effective cytotoxic therapies to combat localized tumors. It was estimated that over half of the cancer patients had received curative radiotherapy during their course of illness1,2 and the combination of radiation therapy with other modalities, such as chemotherapy, immunotherapy, etc., has been widely explored at both experimental and clinical practices.3,4 However, the unavoidable damage to the adjacent normal tissue upon treatment has long been considered as the “Achilles’ Heel” of radiation therapy. In particular, to find the delicate balance between cure and harm, under some circumstances, radiation dose de-escalation has been applied to give compromise to the increasing side effects.5,6 Therefore, the concept of “radiosensitization” has been proposed in recent years to strike the right balance between tumor eradication and minimizing the possible side effects.7,8
The cytotoxicity effect of radiotherapy relies on producing reactive oxygen species (ROSs), during which O2 is essential for ROS generation and DNA damage fixation.9 However, many tumor tissues, especially stroma-vascular tumors, usually suffer from low oxygen levels, where O2 content is even less than 1–2% (v/v) of normal tissues.10 Under hypoxia, tumor cells usually require 2.5 to 3 times higher irradiation dose to achieve the same level of damage compared to that under normal O2 conditions.11 Most current research focused on increasing the local oxygen content of the tumor through exogenous oxygen-carrying or catalytic oxygen production agents or combined with the introduction of high atomic number materials to absorb more radiation energy and enhance the local radiation energy in cells for radiosensitization.12–14 Sang et al13 increased the oxygen content in the tumor by carrying hemoglobin in the carrier to enhance the efficacy of radiotherapy. Pei et al14 prepared a nano-oxygen generator based on metal-organic framework and Au-Pt composite material, which can effectively catalyze the decomposition of H2O2 at the tumor site to generate O2 and cooperate with the radiation energy enhancement effect of high atomic number Au and Pt to promote radiosensitization. These studies have alleviated the hypoxia in the tumor microenvironment and promoted radiosensitization to a certain extent. However, most studies mainly focused on the static effect of radiation on killing isolated cancer cells but ignored the possible dynamic effects of local and systemic factors on the radiation response. A large number of studies have shown that in stromal-vascular tumors such as breast cancer, pancreatic cancer, and prostate cancer, the secretion of tumor stroma was intensified after radiotherapy.15–17 It showed IGF1/2, CXCL12, and β-hydroxybutyrate produced in tumor stroma can induce tumor cell autophagy after radiotherapy and promote the recovery of tumor cells from radiation-induced damage, which is an essential reason for tumor recurrence and metastasis after radiotherapy.18 Studies have found that in a variety of stromal-vascular tumors, the high content of tumor stroma seriously hinders the prognosis of stromal-vascular tumors after radiotherapy.19,20 These studies together suggest that the dynamic changes of tumor stroma caused by radiotherapy affect the efficacy of radiosensitization, which deserves significant attention.
Tumor-associated fibroblasts (TAFs), the most abundant stromal cells in the stroma-vascular tumor microenvironment, are capable of secreting stromal components to provide nutritional support and a protective environment for the proliferation of tumor cells, leading to decreased intratumoral permeability and hypoxia.21,22 Studies have found that TAFs have strong radiation resistance during the radiation process.23,24 The clinically applied radiation dose cannot cause death in TAFs. Instead, it will cause continuous DNA damage of TAFs and affect the secretion of TAFs.25–27 Moreover, it has been reported in the literature that radiation-mediated TGF-β signaling induces the activation of normal fibroblasts into TAFs and promotes the proliferation of TAFs, leading to aggravated hypoxia and exacerbated fibrosis in the tumor microenvironment, which hinders immune cell infiltration.23–25
The renin–angiotensin system (RAS) is a circulatory or hormonal system that regulates blood pressure, electrolytes, and fluid homeostasis.28 Local RAS is expressed in many tissues and regulates cellular functions, including growth and metabolism.29,30 Angiotensin II (Ang II) is a critical bioactive RAS peptide. In local tissues, local Ang II acts in an autocrine or paracrine manner by binding to Ang II type 1 receptor (AT1R) or Ang II type 2 receptor (AT2R), involved in organ homeostasis and the pathogenesis of chronic diseases, and studies found that most of these functions are mediated by AT1R.31 Ang II/AT1R signaling at the tumor site significantly affects tumor growth and invasion through TAFs. Tomohiro et al32 found that the Ang II/AT1R signal affected the proliferation and migration of tumor cells by acting on fibroblasts in the tumor area while having no significant effect on tumor cell proliferation and migration. The Ang II/AT1R signal at the tumor site plays a vital role in the proliferation and activation of TAFs. It has been reported in the literature that AT1R is overexpressed in a variety of stromal-rich tumors, such as breast cancer and pancreatic ductal adenocarcinoma.33,34 AT1R is overexpressed more than 100-fold in primary and metastatic breast cancer.35,36 During radiotherapy, radiation can stimulate the production of a large amount of Ang II in the body.37,38 The large amount of Ang II produced can bind to the overexpressed AT1R in TAFs and can up-regulate the pro-fibrotic protein connective tissue growth factor (connective tissue growth factor, CTGF), thereby stimulating the deposition of extracellular matrix proteins and promoting tumor stroma formation.39,40 Therefore, precisely blocking Ang II/AT1R signaling is the key to inhibiting the proliferation and activation of TAFs (resting TAFs) induced by radiation.
Telmisartan (Tel) is a widely adopted AT1R antagonist. Due to its unique “triangular lock” molecular structure, compared with candesartan, losartan, irbesartan, and other sartan drugs, Tel has a higher affinity with AT1R and can efficiently and specifically block the function of AT1R.41,42 In addition to, its application in the treatment of hypertension, the researchers found that Tel also plays a role in tumor treatment. Previous works presented by Zhu et al have revealed that pre-administration of Tel can sufficiently decrease TAFs-derived stromal components, followed by reduced solid stress and alleviated hypoxia in the tumor matrix, which makes it an excellent choice to remodel the tumor microenvironment.43,44 Notably, recent studies also suggest that Tel can inhibit the proliferation of different tumor cells by inducing cell cycle arrest to the G2/M phase.45,46 For radiotherapy, studies have shown that the G2/M phase is the most radiosensitive phase for tumor cells.47 G2/M cell cycle arrest of tumor cells can increase the radiosensitivity of tumor cells and promote radiosensitization. Therefore, Tel might be a suitable candidate to simultaneously target both tumor cells and TAFs for comprehensive and precise radiosensitization.
As a proof of concept, here in our study, we first prepare the self-assembled Tel nanoparticles (NPs) with high drug loading content by aqueous solvent diffusion method and then stabilized it using biomimetic erythrocyte membrane (ECM) coating for the fabrication of ECM/Tel. Studies have shown that ECM coating can improve the drug delivery system (DDS) stability and endow the DDS with surface antigens consistent with red blood cells, which can promote its escape from macrophage recognition and clearance.48,49 ECM-coated DDS has the characteristics of long circulation in vivo and passive targeting effect in tumor tissue. Benefit from these merits, ECM/Tel, enables targeted delivery of a high dose of Tel to the tumor tissue to give the following effects: (1) Reverse the phenotype of TAFs for TAFs resting, reduce tumor stroma secretion, and alleviate tumor hypoxia in TME; (2) Arrest the cell cycle of tumor cells to the radiosensitive G2/M phase for enhancing the radiosensitivity of tumor cells. As a potential radiosensitizing platform, ECM/Tel can synergistically realize radiosensitization by regulating both tumor microenvironment and tumor cells. The study can provide new strategies for the theoretical research of radiosensitization and promote the clinical application of new radiosensitization agents.
Materials and Methods
Coomassie blue fast staining solution, cell cycle, apoptosis analysis kit, DAPI staining solution, RIPA lysis buffer, crystal violet staining solution, cyclin D1 rabbit monoclonal antibody, and cyclin A2 rabbit monoclonal antibody were supplied by the Beyotime (Shanghai, China). Telmisartan (Tel) was obtained from Sigma-Aldrich Inc. (St Louis, MO). Thiazolyl blue tetrazolium bromide (MTT) and Fluorescein isothiocyanate (FITC) were provided from Shanghai Macklin Biochemical Technology Co., Ltd. Indocyanine green (ICG) was supplied by Tokyo Chemical Industry (Tokyo, Japan). Primary antibody for α-SMA was purchased from Proteintech Group, Inc. Primary antibodies for HIF-1α, TGF-β1, and TGFβR1 were obtained from Santa Cruz Biotechnology (U.S.A.). Smad2/3 antibody sampler kit was supplied by Cell Signaling Technology Inc. (U.S.A.). Other chemicals used were of chromatographic grade or analytical grade.
Fabrication and Characterization of ECM/Tel
Tel (10 mg) was weighed and added to 2 mL of DMSO; then the liquid was stirred in a water bath to obtain the Tel solution (5 mg/mL). One milliliter of the Tel solution was injected into 9 mL of phosphate buffer solution (PBS, pH 6.8) at a constant speed under mechanical stirring (200 rpm, 40 °C) for 5 min to prepare self-assembled Tel nanoparticles. Blood from female BALB/c mice (the mice used were the same as those used in the subsequent animal experiments) was centrifuged (800 g, 5 min) to obtain mouse erythrocyte precipitates, and the precipitates were washed three times with PBS (pH 7.4). Then, 0.25X PBS (10 times the pellet volume) was added to the mouse erythrocyte precipitates for hypotonic lysis in an ice bath for 1 h. After the lysis procedure, the sample was centrifuged (10,000 g, 10 min), washed with PBS three times to remove hemoglobin, and then the pink pellet was collected. The pink pellet was redispersed in PBS and sonicated in an ice-water bath for 30 min to obtain the erythrocyte membrane (ECM). Then, ECM was extruded through a liposome extruder (Avanti® polar lipids, Inc., U.S.A) with a membrane pore size of 0.45 μm, and the membrane protein content of the obtained ECM was quantified by the BCA protein assay kit.50 After protein quantification, the self-assembled Tel nanoparticles and ECM were mixed, among which the mass ratio of Tel and membrane protein content of ECM was 0.5:1, 1:1, and 2:1, respectively. Then, the mixture was successively extruded through liposome extruders with the membrane pore sizes of 0.45 μm and 0.22 μm, respectively, with each extrusion repeated 20 times to obtain ECM-coated Tel nanoformulation (ECM/Tel). The particle size and morphology of self-assembled Tel nanoparticles, ECM, and ECM/Tel were investigated by the Zetasizer Nano (Malvern, UK) and transmission electron microscope (TEM, H-7800, Hitachi), respectively.
Physiological Stability of ECM/Tel
The ECM/Tel prepared by the different mass ratio of Tel and membrane protein content of ECM (0.5:1, 1:1, 2:1) was incubated with PBS solution in a constant temperature shaker at 37 °C for 7 days, and the particle sizes of ECM/Tel on various days (Day 0, Day 1, Day 3, Day 7) were measured by the Zetasizer Nano. In addition, the zeta potentials of various ECM/Tel were measured by the zetasizer.
Coomassie Staining
SDS-PAGE was conducted to analyze the distribution of proteins on ECM and ECM/Tel. ECM and ECM/Tel were lysed using RIPA lysate, and the proteins were quantified. Then, ECM and ECM/Tel lysates were individually added to the SDS loading buffer and heated at 100 °C for 5 min. Then, ECM and ECM/Tel samples containing 10 μg of protein were added into each well and run on a 10% SDS-PAGE gel at 120 V for 2 h. Coomassie staining was performed according to the instructions provided by the manufacturer for visualization.
Cell Culture
Mouse embryonic fibroblast (NIH/3T3) and 4T1 cells were purchased from Shanghai Zhong Qiao Xin Zhou Biotechnology Co., Ltd. NIH/3T3 and 4T1 cells were cultured in Dulbecco’s modified Eagle’s medium (DMEM, high glucose) supplemented with 10% fetal bovine serum in a 37 °C incubator. The trypsin-EDTA solution was used to trypsinize the cells. 4T1 cells were cultured in the culture flask for 4 days, and the supernatant was collected and mixed with an equal volume of fresh culture medium to obtain the mixed culture medium. Then, mouse embryonic fibroblast (NIH/3T3) cells were co-incubated with the mixed culture medium for one week to obtain activated NIH/3T3 (A-NIH/3T3) as a TAFs cell model
Cytotoxicity of ECM/Tel on NIH/3T3 and A-NIH/3T3 Cells
NIH/3T3 or A-NIH/3T3 cells were inoculated into 96-well plates at a density of 6×10³ cells/well and cultured in the incubator for 12 h. After 12 h, the cells were added with various concentrations of free Tel or ECM/Tel (2, 4, 6, 8, 10 μg/mL) and continued to culture for 48 h. After culture, 20 μL of MTT solution (5 mg/mL) was added to each well and incubated for 4 h. Then, the liquids in each well were carefully discarded, and 200 μL of DMSO was added to each well to dissolve formaz crystals. After that, the 96-well plates were shaken in a shaker for 30 min. The absorbance at a wavelength of 570 nm was measured by a spectrophotometer (BioTer, Epoch, U.K.), and the untreated group was used as the blank control.
Cellular Uptake of ECM/Tel
Before the experiment, the 12 mm circular slides were sterilized and put into 24-well culture plates. A-NIH/3T3 cells were inoculated into the 24-well plates containing circular slides at 2×10⁴ cells/well density. After incubation for 24 h, the plate culture medium was discarded and replaced with a serum-free culture medium. Then, coumarin 6 (C6)-labeled ECM/Tel (the preparation of C6-labeled ECM/Tel was described in the supporting information 1.1) was added to the cells (finally Tel concentration = 5 μg/mL). After incubation for 2, 6, 12, and 24 h, the cells were rinsed with PBS and added with DAPI solution for nuclear staining. Then, the cells were rinsed with PBS and added with 4% paraformaldehyde for 20 min. After the fixation, the circular glass slides were removed from the 24-well plates, placed on the glass slides, dripped with glycerol, covered with the slides, and observed by fluorescence microscopy (iX71, Olympus).
Tumor Targeting Ability of ECM/Tel
Female BALB/c mice (6–8 weeks) were supplied by the Changzhou Cavens Laboratory Animal Co. Ltd. All the animal procedures complied with the guidelines of the Laboratory Animal Ethics Committee of Nanjing Medical University and were approved by the Nanjing Medical University ethics committee.
A suspension of ≈1×10⁶ 4T1 cells was orthotopically injected into the mammary fat pad of the BALB/c mice to construct the mouse orthotopic 4T1 breast tumor model. When the tumor volume reached ≈150 mm3, the six mice were divided into two groups of two mice each. The mice in the first group were i.v. injected with ICG solution (200 µL). The mice in the second group were i.v. injected with ICG-loaded ECM/Tel (ICG-ECM/Tel, 200 µL; the preparation of ICG-ECM/Tel was described in the supporting information). After injection, the mice were observed at predetermined times (6, 24, and 48 h) by the in vivo Imaging System (IVIS Lumina Series III, PerkinElmer, U.S.A). In addition, the hearts, livers, spleens, lungs, kidneys, and tumors in each group were dissected and analyzed. The tumor volume (V) was calculated according to the formula: V (mm3) = a×b2/2, where a is the long diameter and b is the short diameter of the tumor.
Resting Effect of ECM/Tel on TAFs
A-NIH/3T3 or NIH/3T3 cells were inoculated in a 24-well plate at a density of 5×10⁴ cells/well and cultured for 12 h, then processed according to Table 1 (Tel = 2 μg/mL, cultured for 48 h). The cells were irradiated by X-rays using the linear accelerator Infinity (Elekta Corporation, Sweden). The dose rate was 600 MU/min, and the energy was 6 MV. After treatment, the cells were fixed with 4% paraformaldehyde, then incubated with the primary antibody of α-smooth muscle actin (α-SMA, 1:100 dilution) at 4 °C overnight. At the end of incubation, the cells were rinsed with PBS, and then Cy3-goat anti-rabbit IgG was added for the immunofluorescent staining ofα-SMA. The expression of α-SMA was observed by the laser scanning confocal microscope to investigate the phenotype reversal of NIH/3T3 and A-NIH/3T3. In addition, the expression of TGF-β1, TGFR1, Smad2, Smad3, p-Smad2, and Smad4 in each group was detected by Western blot, respectively. In brief, the cells were lysed by the RIPA solution and mixed with the SDS loading buffer, then heated at 100 °C for 5 min. The samples were added to each well, run on a 10% SDS-PAGE gel, and then transferred to a PVDF membrane. The membrane was blocked by the 5% skim milk at 4 °C for 1 h and then incubated with the corresponding primary antibodies at 4 °C overnight. After incubation, the membrane was rinsed and added with the secondary antibodies for 2 h. The bands were subsequently developed using developer solutions according to the manufacturer’s instructions. GAPDH was used as a protein loading control.
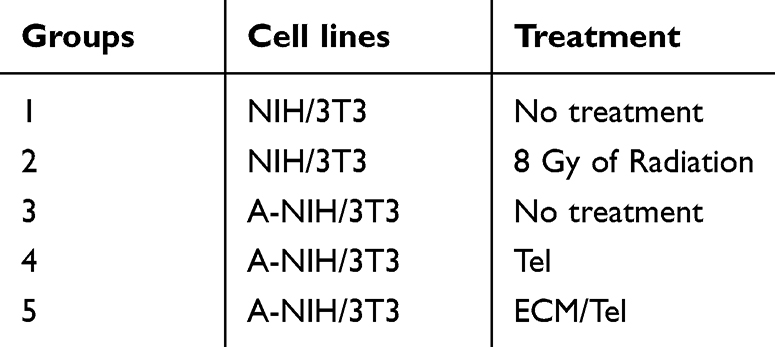 |
Table 1 Different Treatments for NIH/3T3 and a-NIH/3T3 Cells |
Construction and Penetration of Multicellular Spheroids
The 2% agarose liquid was sterilized and added to each well of 96-well plates for plating. After the agarose forms the gel at room temperature, 200 μL of culture medium was added to each well, and then A-NIH/3T3 and 4T1 cells were trypsinized to form a cell suspension of 2×10⁵ cells/mL, respectively. Then, two suspensions were mixed together, and 10 μL of the mixture was slowly dropped into each well to grow into three-dimensional multicellular spheroids (MCSs).43 When the MCSs grew to the 7th day, free Tel or ECM/Tel (Tel concentration: 2 μg/mL) was added and incubated for 48 h. DiI solution (5 μg/mL) was added and incubated for 1 h. The Z-stack scanning of the multicellular spheroids from top to bottom was performed under a laser scanning confocal microscope (Carl Zeiss LSM 510) to observe the permeability condition of the MCSs after different treatments.
Remodeling of Tumor Microenvironment by ECM/Tel in vivo
The mouse orthotopic 4T1 breast cancer model was constructed. When the tumor volume grew to ≈150 mm3, Group I was administered with saline (200 μL/mouse), Group II was administered with free Tel (Tel = 5 mg/kg), and Group III was administered with ECM/Tel (Tel = 5 mg/kg). All formulations were administered intravenously every two days for three times. Forty-eight hours after the last administration, a part of the tumors of the mice were dissected, embedded in the embedding agent, frozen overnight, and sectioned with a cryostat (section thickness = 10 μm). The sections were fixed with 4% paraformaldehyde at room temperature, rinsed, and blocked with 5% skim milk for 1 h. After blocking, the Collagen I primary antibody (1:100) was added and incubated at room temperature for 4 h. After the incubation, the sections were rinsed, and the fluorescent secondary antibody (1:200) was added to incubate at room temperature for 1 h. Then, DAPI solution was added for nuclear staining. The sections were observed under a fluorescence microscope to investigate the expression of Collagen I. The rest of the dissected tumors were fixed and embedded in paraffin to prepare sections. The sections were subjected to HIF-1α immunohistochemical and Masson staining and were observed under a fluorescence microscope. Forty-eight hours after the last administration, the remaining surviving mice were intratumorally injected with 20 μL of FITC (FITC = 10 μg/mL); the tumors were dissected after 6 h and prepared into slices and analyzed by the fluorescence microscope for the distribution and penetration of FITC in tumor tissues.
Flow Cytometry of the Cell Cycle
4T1 cells were inoculated into 6-well plates at a density of 5×10⁴ cells/well and cultured in an incubator. When the cell confluency reached 70%–80%, Tel or ECM/Tel (Tel = 2 μg/mL) was added to the culture for 48 h. After the culture, the cells were rinsed with PBS and then collected by trypsinization and centrifugation. After that, pre-cooled 70% ethanol was slowly added to the cells for fixation. The samples were stored overnight at 4 °C, centrifuged to obtain cell pellets, and rinsed with PBS. Then, 50 μL of PI (1 mg/mL) was added to the cells for staining. After staining, the samples were added with PBS and analyzed using the flow cytometer (BD FACSCanto II, U.S.A).
Immunofluorescence Staining of Cell Cycle Proteins
4T1 cells were inoculated into 24-well plates at a density of 3×10⁴ cells/well. After incubation for 24 h, cells were treated with Tel or ECM/Tel (Tel = 2 μg/mL) for 48 h. After 48 h, the cells were rinsed three times with PBS, fixed by 4% paraformaldehyde solution for 15 min, permeated by triton X-100, and blocked by 2% BSA for 1 h. Then, cyclin D1/cyclin A2 rabbit monoclonal antibody (at 1:100 dilution) was added to the cells overnight at 4 °C. After rinsing with PBS three times, the cells were added with the fluorescent secondary antibody and incubated at room temperature for 2 h, and then DIPA was added for nuclear staining. The samples were observed by fluorescence microscope.
Western Blot Assay of Cell Cycle Proteins
4T1 cells were inoculated into 6-well plates at a density of 5×10⁴ cells/well and cultured in an incubator. When the cell confluency reached 70%–80%, Tel or ECM/Tel (Tel = 2 μg/mL) was added to the culture for 48 h. After the culture, the cells were rinsed with PBS and then collected by trypsinization and centrifugation, and the cyclin D1 and cyclin A2 expressions of cells were detected by western blot. In brief, the cells were lysed by the RIPA solution and mixed with the SDS loading buffer, then heated at 100 °C for 5 min. The samples were added to each well, run on a 10% SDS-PAGE gel, and then transferred to a PVDF membrane. The membrane was blocked by the 5% skim milk at 4 °C for 1 h, then incubated with the primary antibodies of cyclin D1 and cyclin A2 at 4 °C overnight. After incubation, the membrane was rinsed and added with the secondary antibodies for 2 h. The bands were subsequently developed using developer solutions according to the manufacturer’s instructions. GAPDH was used as a protein loading control.
Cytotoxicity of ECM/Tel on 4T1 Cells
4T1 cells were inoculated into 96-well plates at a density of 6×10³ cells/well and cultured in the incubator for 12 h. After 12 h, the cells were added with various concentrations of free Tel or ECM/Tel (1, 5, 10, 25, 50, 100 μg/mL) and continued to culture for 48 h. After culture, 20 μL of MTT solution (5 mg/mL) was added to each well and incubated for 4 h. Then, the liquids in each well were carefully discarded, and 200 μL of DMSO was added to each well to dissolve formaz crystals. After that, the 96-well plates were shaken in a shaker for 30 min. The absorbance at a wavelength of 570 nm was measured by a spectrophotometer, and the untreated group was used as the blank control.
Colony Formation Assay
4T1 were cultured in four cell culture bottles to reach the same cell density of about 50%. Two of the bottles were pretreated with Tel or ECM/Tel (final Tel concentration = 2 μg/mL) for 48 h; the remaining two were used as controls. After the pretreatment, one control group, Tel group, and ECM/Tel group received a single dose of 8 Gy X-ray by the linear accelerator Infinity (Elekta Corporation, Sweden). After 48 h, the cells in each bottle were trypsinized and inoculated on the 6-well plates with a density of 800 cells/well. The medium was changed every 3 days, and the culture was continued to the 14th day. After 14 days, 4% paraformaldehyde was added to each well for fixation for 20 min. After fixation, 1 mL of crystal violet dye was added to each well and stained for 20 min. The cells were rinsed three times with PBS, dried, and photographed for each well.
Radiation Sensitization of ECM/Tel in MCSs
The MCSs were constructed using the method in 2.8. When MCSs grew to the 7th day, free Tel or ECM/Tel (Tel concentration: 2 μg/mL) was added for 48 h. After pretreatment (marked as Day 0), 8 Gy of X-ray was conducted for a single time to the MCSs to observe and record the subsequent growth of MCSs on Day 0, Day 1, and Day 3 using an optical microscope (CKX53, Olympus).
Radiation Sensitization of ECM/Tel in Mice
4T1 cells in good growth condition were inoculated in 150 mm cell culture dishes. After the cell density reached over 90%, the cells were trypsinized and collected by centrifugation. The cells were washed three times with pre-cooled PBS at 4 °C. After counting, the cells were diluted with serum-free culture medium to about 1×10⁶ cells/mL. The mouse orthotopic 4T1 breast cancer model was prepared by orthotopically injecting the cell suspension into the right mammary fat pad of BALB/c mice. Mice were randomly divided into 6 groups (I. saline, II. Tel, III: ECM/Tel, IV. saline+8 Gy, V. Tel+8 Gy, VI. ECM/Tel+8 Gy), and seven mice were in each group. After 14 days, when the tumor volume grows to ≈150 mm3, Group I and IV were administered with saline (200 μL/mouse), Group II and V were administered with free Tel (Tel = 5 mg/kg), Group III and VI were administered with ECM/Tel (Tel = 5 mg/kg), all formulations were administered intravenously every two days for 3 times, and the first injection was marked as Day 1. On Day 7, the tumor areas of mice were irradiated with a single dose of 8 Gy X-ray. During the experiment, the tumor volume and weight of mice in all groups were recorded every two days for 21 days. On Day 21, the mice were sacrificed, the tumor tissues and visceral organs (heart, liver, spleen, lung, and kidney) were dissected. The tumors in each group were photographed and weighed. Part of the dissected tumor was taken, and part of it was embedded in an embedding agent, frozen overnight, and sectioned with a cryostat (section thickness: 10 μm). The sections were fixed with 4% paraformaldehyde at room temperature, rinsed, and blocked with 5% skim milk for 1 h. After blocking, the slices were incubated with hypoxia factor HIF-1α primary antibody (1:100 dilution) at 4 °C overnight. Then, fluorescent secondary antibody (1:200 dilution) was added and incubated at room temperature for 2 h. After incubation, the slices were rinsed, and DAPI staining reagent was added to stain the nuclei. After the nuclear staining was completed, glycerol was added dropwise to mount the slides, and the samples were observed under the fluorescence microscope to investigate the expression of HIF-1α in tumors. Parts of the dissected tumor were added with the lysate and lysed with a tissue homogenizer. Western blot was used to detect the expression of TGF-β1, TGF R1, Smad2, Smad3, and Smad4 in the tumors of each group. The remaining tumors were fixed, embedded in paraffin, and prepared into slices, and Ki67 and Masson staining were performed on the tumor slices to investigate the death of tumor cells and the changes in the tumor matrix.
Parts of the dissected lung were taken, fixed, and stained with Bouin solution, and the tumor metastases on the lungs were photographed and counted. The remaining dissected lungs and other organs were fixed, embedded in paraffin, and sliced. The organ tissue sections were conducted with hematoxylin–eosin (H&E) staining to observe the pathological changes in the organs.
Statistical Analysis
All data are presented as the mean value±standard deviation from at least three independent measurements. Semi-quantitative data were obtained by image J software analysis. Differences between groups were analyzed with ANOVA (one-way) followed by Tukey–Kramer tests, and mean differences with P <0.05 were considered statistically significant. The corresponding markers in the figures are defined as *P < 0.05, **P < 0.01, and ***P < 0.001, respectively.
Results and Discussion
Tel belongs to the class II drug of the biopharmaceutical classification system. Due to its poor water solubility, Tel has low bioavailability and poor tumor targeting. Therefore, it is urgent to develop a corresponding DDS to increase Tel’s solubility and tumor targeting ability. Drawing on previous research experience,51,52 based on the amphipathic structure of Tel with both hydrophilic and hydrophobic groups, we fabricated self-assemble Tel NPs by aqueous solvent diffusion method (Figure 1A), which significantly increased the solubility of Tel. In order to enhance the stability, long-term circulation in vivo and tumor targeting of Tel NPs, we performed ECM coating on the surface of Tel NPs. Studies have shown that ECM coating can not only improve the stability of the drug delivery system but also endow the DDS with surface antigens consistent with red blood cells, which can promote its escape from macrophage recognition and clearance and achieve long-term circulation and enrichment in tumor tissues by passive targeting effects.48,49 After ECM was prepared by hypotonic lysis, self-assembled Tel NPs were mixed with ECM for the fabrication of various ECM/Tel with different Tel to membrane protein ratios (0.5:1, 1:1, and 2:1). The size change of various ECM/Tel in PBS was determined for 7 days to investigate the stability of various ECM/Tel (Figure 1B). The particle size of ECM/Tel at the mass ratio of 1:1 was relatively stable within 7 days (from ≈164 nm on Day 0 to ≈180 nm on Day 7). The particle size of ECM/Tel at the mass ratio of 0.5:1 increased from 130 nm on Day 0 to 219 nm on Day 7. The particle size of ECM/Tel at the mass ratio of 2:1 increased to 256 nm after the first day of incubation and continuously increased to 303 nm on Day 7. The above stability results indicate that the ECM/Tel with a mass ratio of 1:1 has the best stability, as an improper amount of ECM coating was detrimental to stability. It was suggested that overcoating ECM will lead to aggregation of adjacent ECM/Tel and an increase in particle size. Considering the physiological stability of ECM/Tel, we chose the ECM/Tel at the mass ratio of 1:1 as the optimal formulation for subsequent experiments.
 |
Figure 1 Fabrication and characterization of ECM/Tel. (A) Fabrication steps of ECM/Tel. (B) Particle size variation of different formulations of ECM/Tel, with the mass ratio of Tel and membrane protein content of ECM was 0.5:1, 1:1, and 2:1, respectively. (C) Coomassie blue staining results of ECM/Tel. (D and F) TEM and particle size results of self-assembled Tel NPs (left), ECM (middle), and ECM/Tel (right). Red arrows indicate the membrane-mimic structure. Scale bar = 100 μm. |
To verify the successful coating of ECM in ECM/Tel, we performed coomassie blue staining, surface zeta potential determination, and TEM observation. Coomassie blue staining results (Figure 1C) revealed the preservation of whole-protein (from 25 kDa to 180 kDa) of ECM in ECM/Tel, which confirmed the successful modification of ECM in ECM/Tel. In addition, the surface zeta potential determination results (Table S1) showed that when the proportion of ECM in ECM/Tel decreased, the zeta potential of ECM/Tel increased accordingly, proving the successful modification of ECM in ECM/Tel. The TEM observations are shown in Figure 1D–F. Self-assembled Tel NPs had a spherical shape with a particle size of 110±6 nm. The particle size of ECM prepared by the hypotonic lysis method was 182±12 nm. ECM/Tel had a particle size of 160±8 nm. Compared with Tel NPs, a membrane-mimic structure was observed around the spherical morphology of the inner Tel “core” for ECM/Tel (as indicated by the red arrow), indicating the successful ECM decoration.
NIH/3T3 was used as the normal fibroblast model, and activated NIH/3T3 (A-NIH/3T3) was used as the TAFs cell model in in vitro cell experiments. The cytotoxicity of ECM/Tel on NIH/3T3 and A-NIH/3T3 cells was determined by MTT assay. As shown in Figure 2A, when Tel concentration increased to 10 μg/mL in both NIH/3T3 and A-NIH/3T3 cells, the cell survival rate could still reach about 80% after being treated with Tel or ECM/Tel, indicating that ECM/Tel had low cytotoxicity in both cell lines. In order to observe the cell entry ability of ECM/Tel, ECM/Tel was labeled with C6 to observe the uptake of ECM/Tel by A-NIH/3T3 cells within 24 h (Figure 2B). The results showed that with the increase of time, the fluorescence intensity in the cells increased and reached saturation at about 6 h, and gradually attenuated in the following time points, indicating that ECM/Tel could be readily internalized by A-NIH/3T3 cells. The low toxicity and strong intracellular ability of ECM/Tel are mainly attributed to the self-assembly capacity of Tel into Tel NPs and the surface modification of ECM. After Tel self-assembled into Tel NPs, the solubility of the original insoluble Tel was greatly increased. After the formation of nanoparticles, the original mode of uptake of free Tel was invalid, and endocytosis or macropinocytosis played an important role. This cellular uptake of non-specific recognition has been demonstrated in many nanoparticle uptake studies.53,54 ECM surface modification also greatly enhanced the biocompatibility of ECM/Tel.48,49
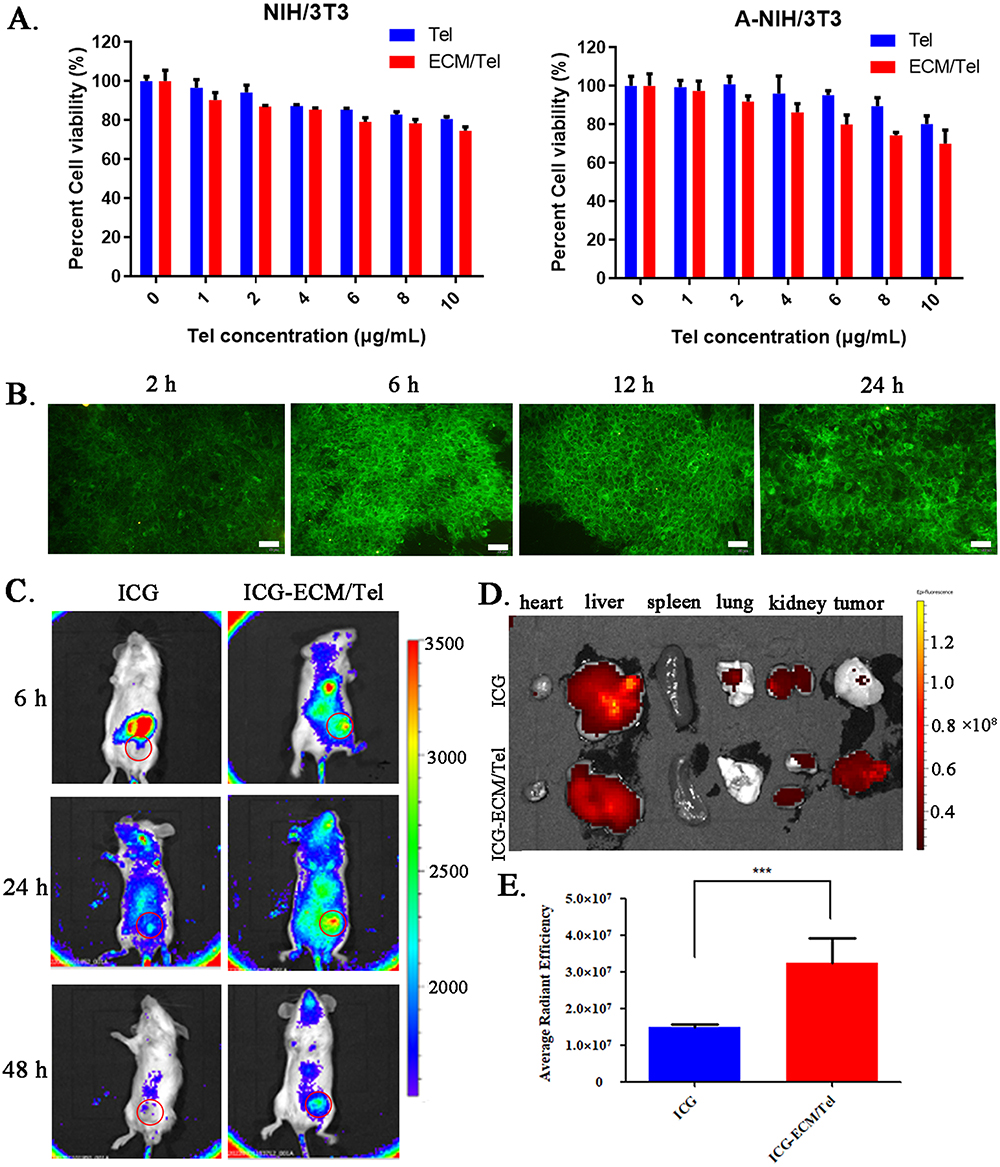 |
Figure 2 Cytotoxicity, cellular uptake and in vivo distribution of ECM/Tel. (A) Cytotoxicity of ECM/Tel against NIH/3T3 and A-NIH/3T3 cells. (B) Time-dependent cellular uptake of ECM/Tel in A-NIH/3T3. Scale bar: 50 μm. (C) In vivo distribution of ECM/Tel in mouse orthotopic 4T1 breast cancer model. Red circle: tumor area. (D) Fluorescence distribution of organs and tumors after dissection. (E) Semi-quantitative analysis of tumor fluorescence. ***P < 0.001. |
In order to evaluate the tumor-targeting ability of ECM/Tel, a mouse orthotopic 4T1 breast cancer model was constructed to study the distribution of ICG-labeled ECM/Tel in tumor-bearing mice. The results (Figure 2C) showed that when compared with the free ICG group, ECM/Tel exhibited more evident distribution in the tumor tissue at all tested time points, which was still observable at 48 h post-administration, indicating the excellent tumor targeting ability of ECM/Tel. The ex vivo imaging of fluorescence distribution in major organs/tumor tissue and semi-quantitative results of tumor fluorescence (Figure 2D and E) also revealed that ICG mainly accumulated more in the liver and less in the tumor, while ICG-ECM/Tel had a significant accumulation in the tumor site. These results collectively confirmed that ECM/Tel had good tumor targeting ability, which was attributed to the ECM encapsulation on the ECM/Tel surface. Studies have shown that ECM coating can not only improve the stability of the DDS but also endow the DDS with surface antigens consistent with red blood cells, which can promote its escape from macrophage recognition and clearance, achieving long circulation in vivo and passive targeting effect in tumor tissue.48,49
α-SMA has been proved to be a specific marker presented on TAFs.55 The expression of α-SMA was evaluated to confirm the successful phenotypic transformation of TAFs. Flow cytometry was performed to detect the expression of α-SMA in NIH/3T3, A-NIH/3T3, Tel-treated A-NIH/3T3, and ECM/Tel-treated A-NIH/3T3 (Figure S1, the corresponding experimental procedures were in supporting information). The results showed that the expression of α-SMA in A-NIH/3T3 was higher than in NIH/3T3, indicating the successful construction of TAFs model A-NIH/3T3. After being treated with Tel or ECM/Tel, the expression of α-SMA in A-NIH/3T3 decreased. The immunofluorescence results (Figure 3A and B) showed that A-NIH/3T3 had significantly higher α-SMA expression than NIH/3T3, which was 7.7-fold that of the NIH/3T3, indicating the successful construction of TAFs model A-NIH/3T3. After 8 Gy of irradiation, the expression of α-SMA in NIH/3T3 was also up-regulated to 5.2-fold compared with that before irradiation, suggesting that irradiation can trigger the transformation of normal fibroblast cells into TAFs. After Tel treatment, the expression of α-SMA in A-NIH/3T3 cells decreased to 0.41-fold from that before treatment, which was consistent with previous reports to support the resting effect of Tel on TAFs.43,44 It was noted that ECM/Tel treatment could more effectively decrease the expression of α-SMA in A-NIH/3T3 cells to 0.28-fold of that before treatment, which proved that ECM/Tel had a more substantial resting effect on TAFs than Tel. This showed that Tel with poor solubility and bioavailability could play a certain resting effect in A-NIH/3T3, but the strong cell-entry ability of ECM/Tel promoted more Tel accumulation and exerted a superior resting effect. The Western blot assay of α-SMA (Figure 3C) also showed similar results, confirming that 8 Gy of irradiation-activated NIH/3T3 into A-NIH/3T3, Tel, and ECM/Tel could rest A-NIH/3T3, and ECM /Tel had a better resting effect on TAFs.
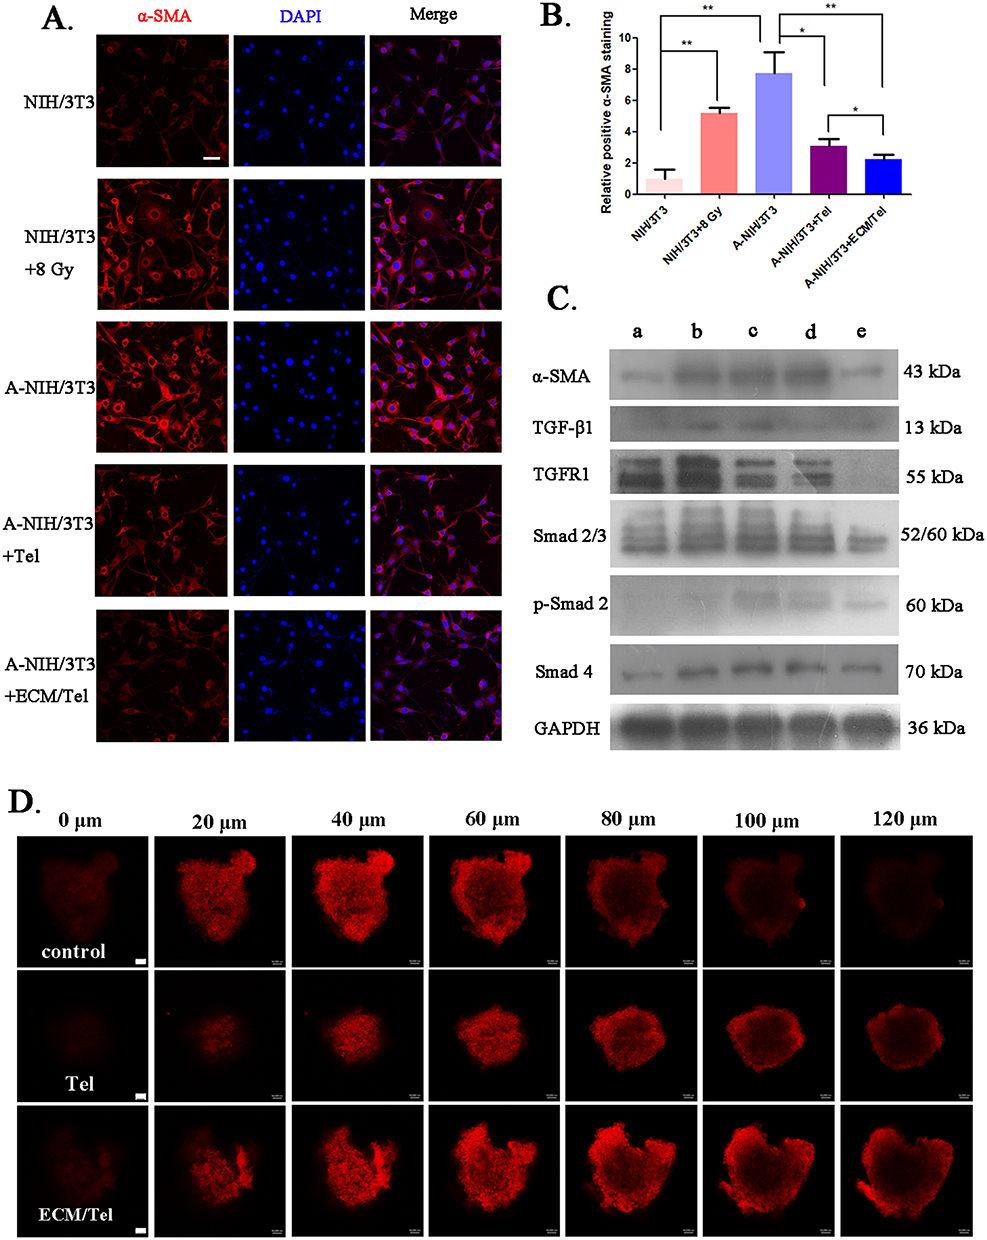 |
Figure 3 Resting effect of ECM/Tel and permeability changes of MCSs. (A) α-SMA immunofluorescence staining of NIH/3T3 with different treatments (with or without 8 Gy irradiation) and A-NIH/3T3 with different treatments (Tel or ECM/Tel for 48 h, Tel = 2 μg/mL). Blue: DAPI, red: α-SMA. Scale bar: 20 μm. (B) Semi-quantitative analysis of α-SMA staining. (C) Western blot assay of α-SMA and related proteins in the TGF-β/Smads pathway in a. NIH/3T3, b. NIH/3T3+8 Gy, c. A-NIH/3T3, d. A-NIH/3T3+Tel, e. A-NIH/3T3+ECM/Tel groups. (D) Changes in the permeability of cell spheroids after treatment with Tel and ECM/Tel (Tel = 2 μg/mL, 48 h). Red: DiI, scale bar: 50 μm. *P < 0.05, **P < 0.01. |
It was reported that Tel reduced tumor stroma secretion of TAFs through TGF-β signaling.56,57 Studies have revealed that the activation process of fibroblasts in the kidney, myocardium, liver, tumor, and other tissues was closely related to Smad2, 3, 4, 7, and other signaling molecules in the Smads pathway.58–61 TGFR1 causes phosphorylation and activation of Smad2 and Smad3. Smad4 binds to activated Smad2/3, and the formed complex translocates to the nucleus for transcription of specific genes, activating fibroblasts in the tissue. In order to elucidate the molecular mechanism of ECM/Tel resting TAFs, we evaluated the expression of related proteins in the TGF-β/Smads pathway during the ECM/Tel resting TAFs process. Western blot analysis of proteins involved in the TGF-β/Smads pathway showed that the expressions of TGFR1, Smad2/3, p-Smad2, and Smad4 were all significantly upregulated in A-NIH/3T3 and 8 Gy-irradiated NIH/3T3 cells, suggesting that the upregulated α-SMA expression was positively correlated to the activation of TGF-β/Smads pathway. As expected, after being treated with Tel or ECM/Tel, the expression of α-SMA was decreased, along with the downregulation of a series of proteins in the TGF-β/Smads pathway. Consistent with the results in Figure 3A, compared with Tel, ECM/Tel showed lower expression of both α-SMA and TGF-β/Smads pathway-related proteins. These results demonstrated that at the cellular level, ECM/Tel can effectively reverse the phenotype of TAFs to the resting state via the TGF-β/Smads pathway.
Previous studies have shown that resting TAFs can compromise tumors’ structure to promote intratumoral drug delivery and penetration.43,44 To explore the changes in tumor permeability after TAFs resting, we constructed the MCSs by co-growth of 4T1 and A-NIH/3T3 cells. After pretreatment with different formulations, MCSs were incubated with red fluorescent dye DiI, and the distribution of DiI was investigated using the z-scanning function of laser scanning confocal microscope to reflect the permeability of different layers in MCSs. As shown in Figure 3D, compared with the control group, the red fluorescence from the outermost layer of 0 μm to the center layer of 120 μm increased significantly in the Tel group, indicating that the permeability of MCSs was significantly enhanced after Tel pretreatment. After ECM/Tel pretreatment, the red fluorescence intensity at the near-center layer of 120 μm was slightly stronger than in the Tel group. Theoretically, the uptake of ECM/Tel by MCSs was stronger than Tel; the difference in fluorescence intensity between Tel and ECM/Tel should be more outstanding. However, the results showed that the red fluorescence intensity in the ECM/Tel group was slightly greater than that at the Tel group at the same layer. This might be because DiI was a small molecule with strong permeability, which narrowed the difference between Tel and ECM/Tel groups, resulting in the results showing that compared with the Tel group, ECM/Tel only slightly enhanced the fluorescence distribution of DiI in MCSs.
Based on the exciting results from Figure 3, a mouse orthotopic 4T1 breast cancer model was established and intravenously administered with three injections of Tel or ECM/Tel, followed by an assessment of the changes in the tumor microenvironment. As shown in Figure 4A and D, the HIF-1α expression upon different treatments was evaluated to reflect the hypoxic condition of tumor tissue. The results showed that compared with the control group, the positive ratio of HIF-1α in tumor tissue decreased from 46% to 30% after Tel administration. After ECM/Tel administration, the positive ratio of HIF-1α further decreased to 14%, confirming the significantly alleviated hypoxia in tumor tissue. To continue exploring changes in the tumor microenvironment, the expression of collagen fibers and collagen I in tumor tissues was assessed. As shown in Figure 4B–F, upon Tel treatment, the positive ratio of collagen fiber decreased from 30% (control) to 22%, and the positive collagen I ratio was 0.71 times that of the control group. ECM/Tel treatment further decreased the positive ratio of collagen fiber to 13% and the positive collagen I ratio to 0.34 times that of the control group. In addition, mice with three Tel or ECM/Tel injections were given another FITC tail vein injection. The results (Figure S2) showed that the intratumoral FITC fluorescence distribution in the ECM/Tel group was significantly stronger than in the Tel group, indicating that ECM/Tel significantly enhanced the tumor tissue permeability after three administrations. These in vivo results showed that ECM/Tel could significantly reduce the secretion of tumor stroma, alleviate tumor hypoxia, and enhance intratumoral permeability, thus remodeling the tumor microenvironment. Compared with the in vitro experiments results in Figure 3, it could be concluded that the gap between the effects of ECM/Tel and free Tel in vivo experiments was further widened, which might be attributed to the long-term circulation in vivo and tumor target effect of ECM/Tel.
 |
Figure 4 Changes in the tumor microenvironment of mice treated with ECM/Tel. (A) Immunohistochemical staining for HIF-1α. (B) Masson staining. Scale bar: 100 μm. (C) Collagen I immunofluorescent staining. Scale bar: 50 μm. (D) Semi-quantitative analysis of HIF-1α. (E) Semi-quantitative determination of Masson’s staining. (F) Semi-quantitative assay of Collagen immunofluorescence staining. NS: no significant difference, *P < 0.05, **P < 0.01. |
Increasing the radiation sensitivity of tumor cells is of great importance for radiotherapy. Studies have shown that the G2/M phase is the most radiosensitive phase in the cell cycle.47 It was reported that paclitaxel and phosphatidylinositol-3 kinase (PI3K) inhibitor HS-173, etc., could arrest the cell cycle of tumor cells to the G2/M phase and increase the apoptosis of radiation-resistant tumor cells.62,63 Studies in the literature have revealed that Tel could arrest the cell cycle of renal cell carcinoma cells to the G2/M phase.45 To further explore whether ECM/Tel could arrest the cell cycle of 4T1 cells to G2/M to promote radiosensitization, the cell cycle of 4T1 cells treated with Tel or ECM/Tel was determined by flow cytometry. The results (Figure 5A and B) showed that after being treated with Tel, the S phase of 4T1 cells decreased from 36.6% to 27.3%, and the G2/M phase increased from 8.7% to 15.7%. After the treatment of ECM/Tel, the S phase of 4T1 cells decreased from 36.6% to 24.8%, and the G2/M phase increased from 8.7% to 19.0%, indicating that Tel and ECM/Tel could arrest the cell cycle to G2/M phase, and ECM/Tel had stronger G2/M arresting effect on 4T1 cells than Tel. This might also be because that ECM/Tel had stronger cell entry ability than Tel in 4T1 cells. Network systems including cyclin-dependent kinases (CDKs) and cyclin-dependent kinase inhibitors (CDKIs) play an important role for the cell cycle. Cyclin D1 is the regulatory protein for G1 to S phases, and cyclin A2 is the regulatory protein for S to G2 phases. To explore the effect of ECM/Tel on cyclin expression, cyclin D1 and cyclin A2 in 4T1 cells were immunofluorescence stained (Figure 5C and D) and semi-quantitatively analyzed (Figure 5F and G). The results showed that after the treatment of Tel, the positive cyclin D1 and cyclin A2 staining increased to 2.18 and 1.80-fold, respectively, compared with that of the control group. ECM/Tel treatment increased the positive cyclin D1 and cyclin A2 ratio to 3.28 and 3.94-fold, respectively. The protein expressions of cyclin D1 and cyclin A2 were also measured by Western blot (Figure 5E), which showed similar results. The expression of cyclin D1 and cyclin A2 were up-regulated after the treatment of ECM/Tel, indicating that ECM/Tel could arrest the 4T1 cell cycle to the radiosensitive G2/M phase.
 |
Figure 5 Effect of ECM/Tel on 4T1 cell cycle. (A) The cell cycle of 4T1 treated with Tel or ECM/Tel was measured by flow cytometry. (B) Cell cycle quantification results of 4T1 after Tel or ECM/Tel treatment (C) Immunofluorescence staining of cyclin D1. (D) Immunofluorescence staining of cyclin A2. (E) Western blot determination of cyclinA2, cyclinB1 and cyclinD1. (F) Semi-quantitative analysis of immunofluorescence staining for cyclin D1. (G) Semi-quantitative analysis of immunofluorescence staining for cyclin A2. Scale bar: 50 μm. **P < 0.01, ***P < 0.001. |
In order to explore the change in radiosensitivity of 4T1 cells after the cell cycle was arrested to the G2/M phase by ECM/Tel, corresponding experiments were performed. The cytotoxic effect of ECM/Tel on 4T1 cells in the absence of radiation was first determined. The MTT results (Figure S3) showed that when Tel was less than 10 μg/mL, the cell viability could reach more than 80%, indicating that ECM/Tel had no significant effect on 4T1 proliferation in the absence of irradiation. To explore the proliferation of irradiated 4T1 after the G2/M phase arrest by ECM/Tel, the colony formation experiment was carried out. As shown in Figure 6A and C, compared with the unirradiated control group, the number of 4T1 cell clones after 8 Gy of irradiation was significantly reduced from 212 to 134, while the number of clones dropped to 75 in Tel+8 Gy group and 54 in the ECM/Tel+8 Gy group, respectively, indicating that ECM/Tel significantly enhanced the radiosensitivity of 4T1 cells, attenuated the proliferation ability of irradiated 4T1 cells. Similarly, it might be that ECM/Tel had a stronger G2/M phase arrest effect on 4T1 cells than Tel; the corresponding change of radiosensitivity in tumor cells was greater. Combined with the results in Figure 5, it was shown that ECM/Tel could increase the radiosensitivity of 4T1 cells by arresting the cell cycle of 4T1 cells to the radiosensitive G2/M phase.
 |
Figure 6 Colony formation assay of 4T1 treated with ECM/Tel and radiation-sensitizing effect of ECM/Tel in MCSs. (A) Photographs of colony formation in each group. (B) Morphological changes of MCSs in 3 days. (C) Number of colonies in each group. (D) Diameters of MCSs over 3 days in each group. Scale bar: 0.1 mm. NS: no significant difference, *P < 0.05, **P < 0.01, ***P < 0.001. |
To evaluate the synergetic radiosensitizing effect of ECM/Tel by remodeling tumor microenvironment and enhancing radiosensitivity of tumor cells, MCSs were used as the model. After being treated with Tel or ECM/Tel (Tel concentration = 2 μg/mL) for 48 h, MCSs were irradiated with a single dose of 8 Gy. During this process, as shown in Figure 6B and D, the size of the MCSs in the control group gradually increased with time, from ≈320 μm on Day 0 to ≈402 μm on Day 3. There was almost no change in the size of the 8 Gy group, indicating that irradiation was helpful to control the growth of MCSs. The size of the Tel+8 Gy group was slightly reduced from ≈320 μm to ≈303 μm, indicating that Tel has a specific radiosensitizing effect on MCSs. The size of the ECM/Tel+8 Gy group decreased from ≈320 μm to ≈278 μm, which indicates that ECM/Tel exerts a more effective radiosensitization effect than Tel in MCSs. Combined with the above results, this is attributed to the fact that the cell entry ability of ECM/Tel was significantly stronger than that of free Tel, which could more effectively rest TAFs for reducing tumor stroma secretion, alleviating hypoxia, and enhancing intratumoral penetration. Moreover, ECM/Tel could more effectively arrest the cell cycle of tumor cells to the radiosensitive G2/M phase. The synergistic effect of ECM/Tel on tumor microenvironment and tumor cells contributed to promoting radiosensitization.
The schematic diagram of in vivo experiment was shown in Figure 7A. In brief, mice with appropriate tumor size received tail vein injections on Day 1, 3, and 5, respectively, and 8 Gy of irradiation on Day 7. The tumor volume and body weight of all subjects were recorded until Day 21. The tumors of each group after dissection on Day 21 was shown in Figure 7B, and the tumor weight was shown in Figure 7C. It was shown that the average weight of tumors was 2.528 g in the saline group, 2.264 g in the Tel group, and 1.766 g in the ECM/Tel group, respectively. This was consistent with the results in Figure 7B, indicating that ECM/Tel could directly help to reduce tumor volume. This might be because ECM/Tel could significantly rest TAFs after targeting the tumor site, reduce the secretion of tumor stroma, alleviate tumor hypoxia, and inhibit tumor growth. The average tumor weight in the ECM/Tel+8 Gy group was only 0.674 g, significantly smaller than in other irradiated groups (1.144 g in the saline+8 Gy group and 1.101 g in the Tel+8 Gy group). These results demonstrated the powerful radiosensitization effect of ECM/Tel, which is not only related to the TAFs resting, tumor stroma secretion reduction, and tumor hypoxia alleviation in the tumor microenvironment but also due to the fact that ECM/Tel can enhance the radiosensitivity of tumor cells by arresting the cell cycle to G2/M phase. In the irradiated or non-irradiated groups under the same conditions, the effect of Tel was close to that of the saline group under the corresponding conditions and significantly weaker than that of the ECM/Tel group under the corresponding conditions, which may be due to the poor solubility and the absence of tumor targeting of Tel, leading to low bioavailability. The changes in tumor volume are shown in Figure 7D. As time extended, the differences in tumor volume among different groups gradually increased. On Day 21, the tumor volume of the saline group reached 1960.2 mm3, and the tumor volume of the Tel and ECM/Tel groups decreased to 1809.3 mm3 and 1655.4 mm3, respectively, indicating that the regulation effect of Tel on the tumor microenvironment could exert a beneficial effect on tumor inhibition. Further information revealed that the tumor volume in the saline+8 Gy group was 1396.4 mm3, the tumor volume in the Tel+8 Gy group was 1285.6 mm3, and the tumor volume in the ECM/Tel+8 Gy group was 990.7 mm3. These results were in line with the above results to conclude the significant radiosensitization effect of ECM/Tel. During this period, the body weight of the mice also fluctuated (Figure S4). The body weight of the mice in the saline, Tel, and ECM/Tel groups experienced a process of first increasing and then decreasing, while the weight changes of mice in saline+8 Gy, Tel+8 Gy, and ECM/Tel+8 Gy groups were relatively stable. This was in line with the results of H&E staining on major organs (Figure S6, heart, liver, spleen, kidney), suggesting that ECM/Tel is a highly biocompatible system for in vivo applications. After 21 days, two mice in each group of saline, Tel, and ECM/Tel groups died, and the survival rate was 71.4%, while all seven mice in the saline+8 Gy, Tel+8 Gy, and ECM/Tel+8 Gy groups survived, and the survival rate was 100% (Figure S5).
 |
Figure 7 Radiosensitizing efficacy of ECM/Tel in BALB/c mice. (A) Schematic of animal administration regimen. (B) Tumor morphology of mice in each group after dissection. (C) Tumor weights of mice in each group after dissection. (D) Tumor volume changes of mice in each group. (E) Bouin solution staining of lungs in each group. Red arrows indicate the location of the tumor metastasis in the lung. (F) Number of tumor nodules on the lungs in each group. (G) H&E staining of lungs in each group. Scale bar = 100 μm. NS: no significant difference, *P < 0.05, **P < 0.01, ***P < 0.001. |
4T1 cells derived from breast cancer of BALB/c mice have the ability of spontaneous lung metastasis as allograft tumors. This animal model has a similar disease progression as that of advanced malignant breast cancer in humans and is widely used in preclinical studies.64,65 Therefore, the inhibitory effect of ECM/Tel on lung metastasis of 4T1 breast cancer has also been explored. The dissected lungs of mice were fixed in Bouin’s solution (Figure 7E), and the number of tumor metastases on the lungs was counted (Figure 7F). The number of lung metastatic nodules was 26 in the Tel group and 22 in the ECM/Tel group, compared with 28 in the saline group. This indicates that ECM/Tel reduced lung metastatic nodules, which is consistent with the in situ tumor inhibition effect of ECM/Tel on breast cancer. It revealed that ECM/Tel inhibited tumor lung metastasis while reducing tumor growth in situ. Irradiation of 8 Gy significantly reduced the number of lung metastases, as the number of lung metastatic nodules in the saline+8 Gy group was 15. After being treated with Tel, the number of lung metastatic nodules in the Tel+8 Gy group was 14. In contrast, the ECM/Tel+8 Gy group had the best inhibitory effect on lung metastasis, with lung metastatic nodule number of only 6. This indicated that ECM/TEL significantly inhibited the growth of tumor in situ and the lung metastasis of breast cancer due to the synergistic effect of ECM/Tel on tumor microenvironment and tumor cells, while there was no significant difference between the Tel group and saline group, which might due to the poor solubility and the absence of tumor targeting of Tel, leading to low bioavailability. H&E staining was performed on the lungs of each group, and the lung metastatic nodules of each group can be seen in Figure 7G. The results showed that the ECM/Tel+8 Gy group exhibited the best inhibitory effect on lung metastasis, consistent with the results of Figure 7E and F.
After the animal experiments, the tumor sections of each group were stained with α-SMA immunofluorescence to reflect the resting of TAFs. The results (Figure 8A) showed that compared with the saline group and the Tel group, the expression of α-SMA in the ECM/Tel group was significantly decreased, indicating that the ECM/Tel could target tumor sites to rest TAFs. The expression of α-SMA in the saline+8 Gy group and Tel+8 Gy group was significantly increased, indicating that irradiation promoted the activation of TAFs. Compared with the saline+8 Gy group and the Tel+8 Gy group, the expression of α-SMA in the ECM/Tel+8 Gy group was significantly decreased, indicating that compared with Tel, ECM/Tel had better tumor-targeting ability and played a more influential role in exerting TAFs resting effect.
 |
Figure 8 Investigation of tumor properties in all groups. (A) α-SMA immunofluorescence staining. Blue: DAPI, red: α-SMA. (B) Masson staining of each group. (C) Ki67 staining of each group. (D) HIF-1α immunofluorescence staining of each group. (E) Semi-quantitative results of Masson staining. (F) Semi-quantitative results of Ki67 staining. (G) Semi-quantitative results of HIF-1α staining. n = 3. (H) Western blot assay of TGF-β/Smads pathway proteins. a: saline, b: Tel, c: ECM/Tel, d: saline+8 Gy, e: Tel+8 Gy, f: ECM/Tel+8 Gy. Scale bar: 100 μm. NS: no significant difference, *P < 0.05, **P < 0.01, ***P < 0.001. |
Masson staining was performed on the tumor sections after the animal experiment to reflect the level of collagen fibers in the tumor tissue. The results (Figure 8B and E) showed no significant difference between the saline and Tel group, and the collagen volume in the ECM/Tel group was significantly reduced from 22.3% (saline group) to 5.4%. In the saline+8 Gy group and Tel+8 Gy group, the volume of collagen increased to 35.0% and 31.6%, respectively. This may be related to the fact that irradiation can trigger the proliferation of TAFs, which promotes collagen secretion. However, the poor effect of free Tel might be due to its poor solubility and lack of tumor targeting. In the ECM/Tel+8 Gy group, the collagen volume decreased to 7.9%, which indicated that ECM/Tel had a powerful effect on collagen reduction. This was attributed to the excellent tumor targeting of ECM/Tel, which can target the tumor site to play a more effective role.
Ki67, a nuclear protein associated with tumor cell proliferation,66 was also studied (Figure 8C) to investigate the proliferation of tumor cells with semi-quantitative analysis (Figure 8F). The results showed that among the saline, Tel, and ECM/Tel groups, the ECM/Tel group had the lowest positive Ki67 content of 10.0%, which was significantly different from that of the saline (19.4%) and Tel (16.1%) group, indicating that ECM/Tel exerted more tumor cell death. After 8 Gy irradiation, the ratio of positive Ki67 in the saline+8 Gy group and Tel+8 Gy group decreased to 4.7% and 3.0%, respectively, indicating that irradiation can significantly increase the death of tumor cells. ECM/Tel+8 Gy group had the lowest ratio of positive Ki67, which was only 1.1%, indicating that ECM/Tel+8 Gy has the most potent tumor inhibition effect. The results of Ki67 were also consistent with the previous results of tumor size.
HIF-1α immunofluorescent staining of the tumor area (Figure 8D) and corresponding semi-quantitative analysis (Figure 8G) showed that the ECM/Tel group had less positive HIF-1α staining area than that of the saline group and Tel group, which was only 0.31-fold that of the saline group. After 8 Gy irradiation, the positive expression of HIF-1α in the saline+8 Gy group was 1.68-fold that in the saline group. There was no significant difference in the expression of HIF-1α between Tel+8 Gy and saline+8 Gy group. The positive HIF-1α decreased to 0.37-fold in the ECM/Tel+8 Gy group compared with the saline group. These results demonstrated that ECM/Tel significantly alleviates hypoxia in the tumor tissue. The expression of TGF-β/Smads pathway-related proteins in the tumor tissue was also determined by Western blot (Figure 8H). In the saline and Tel groups, there was no significant difference in the expression of TGF-β1, TGFR1, Smad2/3, and Smad4, while in the ECM/Tel group, the expression of each protein was significantly decreased. After 8 Gy of irradiation, the expression of each protein in thesaline+8 Gy and Tel+8 Gy groups increased, indicating that irradiation did stimulate the TGF-β/Smads pathway and affect the protein expression in it. Compared with saline+8 Gy and Tel+8 Gy groups, the ECM/Tel+8 Gy group significantly decreased the expression of TGF-β/Smads proteins. These results were in line with the above data to further confirm that ECM/Tel could rest TAFs via the TGF-β/Smads pathway.
Conclusions
The biomimetic erythrocyte membrane (ECM)-coated self-assembled Tel nano drug delivery system (ECM/Tel) was successfully constructed in our study using aqueous solvent diffusion and liposome extrusion methods. ECM/Tel showed good physiological stability, preferable cellular uptake and decent tumor-targeting ability. In A-NIH/3T3 cells, MCSs, and mouse orthotopic 4T1 breast cancer model, ECM/Tel could reduce the expression of α-SMA in TAFs and rest TAFs via the regulation of proteins in TGF-β/Smads pathway. After resting TAFs with ECM/Tel, the secretion of tumor stroma was reduced, the hypoxic microenvironment was alleviated, and intratumoral penetration was enhanced. Moreover, ECM/Tel could arrest the cell cycle of 4T1 cells to the radiosensitive G2/M phase and enhance the radiosensitivity of tumor cells. The mouse orthotopic 4T1 breast cancer model confirmed that ECM/Tel had a superior radiosensitizing effect attributed to the effect of ECM/Tel on remodeling the tumor microenvironment and enhancing the radiosensitivity of tumor cells, which not only significantly reduced the growth of breast cancer in situ but also inhibited the lung metastasis of breast cancer. Our study can not only provide new ideas and new strategies for theoretical research on radiosensitization but is also expected to promote the clinical application of new radiosensitizers.
Data Sharing Statement
All materials and data supporting this study are available from the author ([email protected]) upon reasonable request.
Acknowledgments
This work has been supported by National Natural Science Foundation of China (Grant No. 81871756 and No. 82303692), Jiangsu Provincial Outstanding Postdoctoral Program (No. 2022ZB824), the Fourth Batch of City Leading Innovative Talents Introduction and Cultivation Project of Changzhou “Dragon City Talent Plan” (Research No. CQ20220107), Science and Technology Project of Changzhou Health Commission (Science and Technology Project for Young Talents) (Research No. QN202224), Basic Research Project of Changzhou Medical Center of Nanjing Medical University (CMCB202231), Innovation Fund of National Orthopedics and Exercise Rehabilitation Clinical Medical Research Center (Research No. 2021-NCRC-CXJJ-ZH-13), Jiangsu Provincial Medical Key Discipline Cultivation Unit (JSDW202237), Jiangsu Provincial Key Research and Development Program Social Development Project (BE2022720), General Program of Jiangsu Provincial Health Commission (M2020006).
Disclosure
The authors declare that they have no competing interests for this work.
References
1. Schaue D, McBride WH. Opportunities and challenges of radiotherapy for treating cancer. Nat Rev Clin Oncol. 2015;12(9):527–540. doi:10.1038/nrclinonc.2015.120
2. Baskar R, Lee KA, Yeo R, et al. Cancer and radiation therapy: current advances and future directions. Int J Med Sci. 2012;9(3):193. doi:10.7150/ijms.3635
3. Levy A, Chargari C, Cheminant M, et al. Radiation therapy and immunotherapy: implications for a combined cancer treatment. Crit Rev Oncol Hematol. 2013;85(3):278–287. doi:10.1016/j.critrevonc.2012.09.001
4. Matei D, Filiaci V, Randall ME, et al. Adjuvant chemotherapy plus radiation for locally advanced endometrial cancer. New Engl J Med. 2019;380(24):2317–2326. doi:10.1056/NEJMoa1813181
5. Sacchini V, Norton L. Escalating de-escalation in breast cancer treatment. Breast Cancer Res Treat. 2022;195(2):85–90. doi:10.1007/s10549-022-06685-2
6. Masterson L, Moualed D, Liu ZW, et al. De-escalation treatment protocols for human papillomavirus-associated oropharyngeal squamous cell carcinoma: a systematic review and meta-analysis of current clinical trials. Eur J Cancer. 2014;50(15):2636–2648. doi:10.1016/j.ejca.2014.07.001
7. Gong L, Zhang Y, Liu C, et al. Application of radiosensitizers in cancer radiotherapy. Int J Nanomed. 2021;16:1083. doi:10.2147/IJN.S290438
8. Goswami N, Luo Z, Yuan X, et al. Engineering gold-based radiosensitizers for cancer radiotherapy. Mater Horiz. 2017;4(5):817–831. doi:10.1039/C7MH00451F
9. Srinivas US, Tan BWQ, Vellayappan BA, et al. ROS and the DNA damage response in cancer. Redox Biol. 2019;25:101084. doi:10.1016/j.redox.2018.101084
10. Barbara M, Pilar DLP, Feda A, et al. The role of hypoxia in cancer progression, angiogenesis, metastasis, and resistance to therapy. Hypoxia. 2015;3:83–92. doi:10.2147/HP.S93413
11. Horsman MR, Wouters BG, Joiner MC, et al. The oxygen effect and fractionated radiotherapy. Basic Clin Radiobiol. 2009;2009:207–216.
12. Chen L, Zhang Y, Zhang X, et al. A GdW10@ PDA-CAT Sensitizer with high-Z effect and self-supplied oxygen for hypoxic-tumor radiotherapy. Molecules. 2022;27:128. doi:10.3390/molecules27010128
13. Sang W, Xie L, Wang G, et al. Oxygen-enriched metal-phenolic X-ray Nanoprocessor for cancer radio-radiodynamic therapy in combination with checkpoint blockade immunotherapy. Adv Sci. 2021;8:2003338. doi:10.1002/advs.202003338
14. Pei P, Shen W, Zhang Y, et al. Radioactive nano-oxygen generator enhance anti-tumor radio-immunotherapy by regulating tumor microenvironment and reducing proliferation. Biomaterials. 2022;280:121326. doi:10.1016/j.biomaterials.2021.121326
15. Xu S, Xu H, Wang W, et al. The role of collagen in cancer: from bench to bedside. J Transl Med. 2019;17(1):309. doi:10.1186/s12967-019-2058-1
16. Hessmann E, Buchholz SM, Demir IE, et al. Microenvironmental determinants of pancreatic cancer. Physiol Rev. 2020;100(4):1707–1751. doi:10.1152/physrev.00042.2019
17. Harryman WL, Warfel NA, Nagle RB, et al. The tumor microenvironments of lethal prostate cancer. Prostate Cancer. 2019;2019:149–170.
18. Wang Y, Gan G, Wang B, et al. Cancer-associated fibroblasts promote irradiated cancer cell recovery through autophagy. EBioMedicine. 2017;17:45–56. doi:10.1016/j.ebiom.2017.02.019
19. Sosa MS, Bragado P, Aguirre-Ghiso JA. Mechanisms of disseminated cancer cell dormancy: an awakening field. Nat Rev Cancer. 2014;14(9):611–622. doi:10.1038/nrc3793
20. Liu Y, Liang X, Yin X, et al. Blockade of IDO-kynurenine-AhR metabolic circuitry abrogates IFN-γ-induced immunologic dormancy of tumor-repopulating cells. Nat Commun. 2017;8(1):1–15. doi:10.1038/s41467-016-0009-6
21. Barrett RL, Puré E. Cancer-associated fibroblasts and their influence on tumor immunity and immunotherapy. Elife. 2020;9:e57243. doi:10.7554/eLife.57243
22. Liao Z, Tan ZW, Zhu P, Tan NS. Cancer-associated fibroblasts in tumor microenvironment-Accomplices in tumor malignancy. Cell Immunol. 2019;343:103729. doi:10.1016/j.cellimm.2017.12.003
23. Hellevik T, Pettersen I, Berg V, et al. Cancer-associated fibroblasts from human NSCLC survive ablative doses of radiation but their invasive capacity is reduced. Radiat Oncol. 2012;7:59. doi:10.1186/1748-717X-7-59
24. Rodier F, Coppé JP, Patil CK, et al. Persistent DNA damage signalling triggers senescence-associated inflammatory cytokine secretion. Nat Cell Biol. 2009;11:973–979. doi:10.1038/ncb1909
25. Tommelein J, De Vlieghere E, Verset L, et al. Radiotherapy-activated cancer-associated fibroblasts promote tumor progression through paracrine IGF1R activation. Cancer Res. 2018;78:659–670. doi:10.1158/0008-5472.CAN-17-0524
26. Hellevik T, Pettersen I, Berg V, et al. Changes in the secretory profile of NSCLC-associated fibroblasts after ablative radiotherapy: potential impact on angiogenesis and tumor growth. Transl Oncol. 2013;6:66–74. doi:10.1593/tlo.12349
27. Pereira PMR, Edwards KJ, Mandleywala K, et al. iNOS regulates the therapeutic response of pancreatic cancer cells to radiotherapy. Cancer Res. 2020;80:1681–1692. doi:10.1158/0008-5472.CAN-19-2991
28. George AJ, Thomas WG, Hannan RD. The renin-angiotensin system and cancer: old dog, new tricks. Nat Rev Cancer. 2010;10:745–59.
29. Mastoor Z, Diz-Chaves Y, González-Matías LC, et al. Renin-angiotensin system in liver metabolism: gender differences and role of incretins. Metabolites. 2022;12(5):411. doi:10.3390/metabo12050411
30. Menikdiwela KR, Ramalingam L, Rasha F, et al. Autophagy in metabolic syndrome: breaking the wheel by targeting the renin-angiotensin system. Cell Death Dis. 2020;11(2):87. doi:10.1038/s41419-020-2275-9
31. De Gasparo M, Catt KJ, Inagami T, et al. International union of pharmacology. XXIII. The angiotensin II receptors. Pharmacol Rev. 2000;52:415–472.
32. Takiguchi T, Takahashi-Yanaga F, Ishikane S, et al. Angiotensin II promotes primary tumor growth and metastasis formation of murine TNBC 4T1 cells through the fibroblasts around cancer cells. Eur J Pharmacol. 2021;909:174415. doi:10.1016/j.ejphar.2021.174415
33. Chen X, Meng Q, Zhao Y, et al. Angiotensin II type 1 receptor antagonists inhibit cell proliferation and angiogenesis in breastcancer. Cancer Lett. 2013;328:318e324. doi:10.1016/j.canlet.2012.10.006
34. Kim S, Toyokawa H, Yamao J, et al. Antitumor effect of angiotensin II type 1 receptor blocker losartan for orthotopic rat pancreatic adenocarcinoma. Pancreas. 2014;43:886e890. doi:10.1097/MPA.0000000000000125
35. Rhodes DR, Ateeq B, Cao Q. AGTR1 overexpression defines a subset of breast cancer and confers sensitivity to losartan, an AGTR1 antagonist. Proc Natl Acad Sci U S A. 2009;106:10284–10289. doi:10.1073/pnas.0900351106
36. Amaya K, Ohta T, Kitagawa H. Angiotensin II activates MAP kinase and NF-kappaB through angiotensin II type I receptor in human pancreatic cancer cells. Int J Oncol. 2004;25:849–856.
37. Hasan HF, Elgazzar EM, Mostafa DM. Diminazene aceturate extenuate the renal deleterious consequences of angiotensin-II induced by γ-irradiation through boosting ACE2 signaling cascade. Life Sci. 2020;253:117749. doi:10.1016/j.lfs.2020.117749
38. Song L, Wang D, Cui X, et al. Kinetic alterations of angiotensin-II and nitric oxide in radiation pulmonary fibrosis. J Environ Pathol Toxicol Oncol. 1998;17:141.
39. Yin Q, Liu H. Connective tissue growth factor and renal fibrosis. Renal Fibrosis. 2019;2019:365–380.
40. Seo H-Y, Lee S-H, Lee J-H, et al. Src inhibition attenuates liver fibrosis by preventing hepatic stellate cell activation and decreasing connective tissue growth factor. Cells. 2020;9(3):558. doi:10.3390/cells9030558
41. Balakumar P, Jagadeesh G. Structural determinants for binding, activation, and functional selectivity of the angiotensin AT1 receptor. J Mol Endocrinol. 2014;53:R71eR92. doi:10.1530/JME-14-0125
42. Ohno K, Amano Y, Kakuta H, et al. Unique ”delta lock” structure of telmisartan is involved in its strongest binding affinity to angiotensin II type 1 receptor. Biochem Biophys Res Commun. 2011;404:434e437. doi:10.1016/j.bbrc.2010.11.139
43. Zhu Y, Wen L, Shao S, et al. Inhibition of tumor-promoting stroma to enforce subsequently targeting AT1R on tumor cells by pathological inspired micelles. Biomaterials. 2018;161:33–46. doi:10.1016/j.biomaterials.2018.01.023
44. Zhu Y, F. Y, Tan Y, et al. Reversing activity of cancer associated fibroblast for staged glycolipid micelles against internal breast tumor cells. Theranostics. 2019;9(23):6764. doi:10.7150/thno.36334
45. Tsujiya Y, Hasegawa A, Yamamori M, et al. Telmisartan-induced cytotoxicity via G2/M phase arrest in renal cell carcinoma cell lines. Biol Pharm Bull. 2021;44(12):1878–1885. doi:10.1248/bpb.b21-00654
46. Oura K, Tadokoro T, Fujihara S, et al. Telmisartan inhibits hepatocellular carcinoma cell proliferation in vitro by inducing cell cycle arrest. Oncol Rep. 2017;38(5):2825–2835. doi:10.3892/or.2017.5977
47. Parshad R, Gantt R, Sanford KK, et al. Chromosomal radiosensitivity of human tumor cells during the G2 cell cycle period. Cancer Res. 1984;44:5577–5582.
48. Xiong J, M. W, Chen J, et al. Cancer-erythrocyte hybrid membrane-camouflaged magnetic nanoparticles with enhanced photothermal-immunotherapy for ovarian cancer. ACS Nano. 2021;15:19756–19770. doi:10.1021/acsnano.1c07180
49. Mao Y, Zou C, Jiang Y, et al. Erythrocyte-derived drug delivery systems in cancer therapy. Chinese Chem Lett. 2021;32:990–998. doi:10.1016/j.cclet.2020.08.048
50. Fang RH, C.m.j. H, Luk BT, et al. Cancer cell membrane-coated nanoparticles for anticancer vaccination and drug delivery. Nano Lett. 2014;14(4):2181–2188. doi:10.1021/nl500618u
51. Chen S, Wang C, Tao S, et al. Rational design of redox-responsive and P-gp-inhibitory lipid nanoparticles with high entrapment of paclitaxel for tumor therapy. Adv Healthc Mater. 2018;7:1800485. doi:10.1002/adhm.201800485
52. Chen S, Song Y, Wang C, et al. Chitosan-modified lipid nanodrug delivery system for the targeted and responsive treatment of ulcerative colitis. Carbohyd Polym. 2020;230:115613. doi:10.1016/j.carbpol.2019.115613
53. Ding L, Yao C, Yin X, et al. Size, shape, and protein Corona determine cellular uptake and removal mechanisms of gold nanoparticles. Small. 2018;14(42):1801451. doi:10.1002/smll.201801451
54. Sabourian P, Yazdani G, Ashraf SS, et al. Effect of physico-chemical properties of nanoparticles on their intracellular uptake. Int J Mol Sci. 2020;21(21):8019. doi:10.3390/ijms21218019
55. Lai D, Ma L, Wang F. Fibroblast activation protein regulates tumor-associated fibroblasts and epithelial ovarian cancer cells. Int J Oncol. 2012;41(2):541–550. doi:10.3892/ijo.2012.1475
56. Habashi JP, Judge DP, Holm TM, et al. Losartan, an AT1 antagonist, prevents aortic aneurysm in a mouse model of Marfan syndrome. Science. 2006;312:117–121. doi:10.1126/science.1124287
57. Liu J, Liao S, Diop-Frimpong B, et al. TGF-β blockade improves the distribution and efficacy of therapeutics in breast carcinoma by normalizing the tumor stroma. Proc Natl Acad Sci. 2012;109:16618. doi:10.1073/pnas.1117610109
58. F. X, Liu C, Zhou D, et al. TGF-β/SMAD pathway and its regulation in hepatic fibrosis. J Histochem Cytochem. 2016;64:157–167. doi:10.1369/0022155415627681
59. Meng X-M, Tang PM-K, Li J, et al. TGF-β/Smad signaling in renal fibrosis. frontiers in Physiology. 2015;6:82. doi:10.3389/fphys.2015.00082
60. Ferrão PM, Nisimura LM, Moreira OC, et al. Inhibition of TGF-β pathway reverts extracellular matrix remodeling in T. cruzi-infected cardiac spheroids. Exp Cell Res. 2018;362:260–267. doi:10.1016/j.yexcr.2017.11.026
61. Shi X, Young CD, Zhou H, et al. Transforming growth factor-β signaling in fibrotic diseases and cancer-associated fibroblasts. Biomolecules. 2020;10:1666. doi:10.3390/biom10121666
62. Toiyama Y, Inoue Y, Hiro J, et al. The range of optimal concentration and mechanisms of paclitaxel in radio-enhancement in gastrointestinal cancer cell lines. Cancer Chemother Pharmacol. 2007;59(6):733–742. doi:10.1007/s00280-006-0327-1
63. Lee H, Park JH, Jung KH, Lim JH, Hong -S-S. HS-173, a novel PI3K inhibitor enhances radiosensitivity of breast cancer cells. Int J Radiat Res. 2022;20(2):347–352. doi:10.52547/ijrr.20.2.14
64. Tao K, Fang M, Alroy J, et al. Imagable 4T1 model for the study of late stage breast cancer. BMC Cancer. 2008;8(1):1–19. doi:10.1186/1471-2407-8-228
65. Rashid OM, Nagahashi M, Ramachandran S, et al. Is tail vein injection a relevant breast cancer lung metastasis model? J Thorac Dis. 2013;5(4):385. doi:10.3978/j.issn.2072-1439.2013.06.17
66. Denkert C, Budczies J, von Minckwitz G, et al. Strategies for developing Ki67 as a useful biomarker in breast cancer. Breast. 2015;24:S67–S72. doi:10.1016/j.breast.2015.07.017
 © 2024 The Author(s). This work is published and licensed by Dove Medical Press Limited. The full terms of this license are available at https://www.dovepress.com/terms.php and incorporate the Creative Commons Attribution - Non Commercial (unported, v3.0) License.
By accessing the work you hereby accept the Terms. Non-commercial uses of the work are permitted without any further permission from Dove Medical Press Limited, provided the work is properly attributed. For permission for commercial use of this work, please see paragraphs 4.2 and 5 of our Terms.
© 2024 The Author(s). This work is published and licensed by Dove Medical Press Limited. The full terms of this license are available at https://www.dovepress.com/terms.php and incorporate the Creative Commons Attribution - Non Commercial (unported, v3.0) License.
By accessing the work you hereby accept the Terms. Non-commercial uses of the work are permitted without any further permission from Dove Medical Press Limited, provided the work is properly attributed. For permission for commercial use of this work, please see paragraphs 4.2 and 5 of our Terms.