Back to Journals » Drug Design, Development and Therapy » Volume 11
N-(3-hydroxymethyl-β-carboline-1-yl-ethyl-2-yl)-L-Phe: development toward a nanoscaled antitumor drug capable of treating complicated thrombosis and inflammation
Authors Wu JH ![]() , Zhao M, Wang YJ, Wang YN
, Zhao M, Wang YJ, Wang YN ![]() , Zhu HM
, Zhu HM ![]() , Zhao SR, Gui L, Zhang XY, Peng SQ
, Zhao SR, Gui L, Zhang XY, Peng SQ ![]()
Received 5 October 2016
Accepted for publication 10 November 2016
Published 17 January 2017 Volume 2017:11 Pages 225—239
DOI https://doi.org/10.2147/DDDT.S123919
Checked for plagiarism Yes
Review by Single anonymous peer review
Peer reviewer comments 2
Editor who approved publication: Professor Anastasios Lymperopoulos
Jianhui Wu,1–4 Ming Zhao,1–5 Yuji Wang,1–4 Yaonan Wang,1–4 Haimei Zhu,1–4 Shurui Zhao,1–4 Lin Gui,1–4 Xiaoyi Zhang,1–4 Shiqi Peng1–4
1Beijing Area Major Laboratory of Peptide and Small Molecular Drugs, 2Engineering Research Center of Endogenous Prophylactic, Ministry of Education of China, 3Beijing Laboratory of Biomedical Materials, 4College of Pharmaceutical Sciences, Capital Medical University, Beijing, People’s Republic of China; 5Department of Biomedical Science and Environmental Biology, Kaohsiung Medical University, Kaohsiung, Taiwan, Republic of China
Abstract: It is well documented that the surfaces of cancer cells, activated platelets and inflammatory cells are rich in P-selectin. N-(3-hydroxymethyl-β-carboline-1-yl-ethyl-2-yl)-l-Phe (HMCEF) is a P-selectin inhibitor capable of simultaneously inhibiting thrombosis and inflammation. Based on the knowledge that P-selectin is a common target for antithrombotic, anti-inflammatory and antitumor drugs, the aim of this study article was to estimate the possibility of HMCEF as a nanoscaled antitumor drug. Images of transmission electron microscopy, scanning electron microscopy and atomic force microscopy proved that HMCEF forms nanoparticles with a diameter of <120 nm that promote delivery in blood circulation. In vitro HMCEF intercalates into calf thymus DNA, cuts off DNA pBR22 and inhibits the proliferation of cancer cells. In vivo HMCEF dose dependently (0.2, 2 and 200 nmol/kg per day) slows tumor growth in treated S180 mice, and has a minimal effective dose of 2 nmol/kg per day. At 200 nmol/kg per day, HMCEF does not affect the liver and the kidney of the treated S180 mice, and at 20,000 nmol/kg HMCEF does not affect the liver and the kidney of the treated healthy ICR mice. HMCEF is a promising antitumor drug, which is characterized by its high safety and efficacy in the prevention of the complications of thrombosis and inflammation in patients.
Keywords: P-selectin, antitumor, antithrombosis, anti-inflammation, nanomedicine
Introduction
Cancer induces an increased risk of coagulation and ~5%–10% of patients with cancer may develop thrombosis within the first year after diagnosis;1 and in addition, coagulation promotes cancer growth.2 Chronic inflammation is involved in all stages of cancer development, and inflammatory tumor microenvironment is a hallmark of cancer.3,4 According to the epidemiological and clinical estimation, ~25% of cancers are linked to chronic and acute inflammations.5–7 It has been well documented that P-selectin triggers the adhesion of leukocytes toward platelets, cancer cells, endothelial cells and other leukocytes at the thrombosis sites, inflammation tissues and tumor tissues.8–12 In addition, inhibiting P-selectin-mediated interactions of tumor cells with blood constituents results in attenuation of tumor metastasis.11,13–16 Elevated serum level of P-selectin has been correlated with some human neoplastic disorders, such as lung cancer, breast cancer, melanoma malignancy and hematological malignancy.17–21 Clinical trials show that P-selectin inhibitors, such as heparin and low-molecular-weight heparin, can protect cancer patients in advanced stage from the complication of thrombosis, thereby prolonging survival.22,23 The findings demonstrate that P-selectin is a common target of cancer and its complications, such as thrombosis and inflammation, and imply that N-(3-hydroxymethyl-β-carboline-1-yl-ethyl-2-yl)-L-Phe (HMCEF), a P-selectin inhibitor, capable of inhibiting thrombosis and blocking the inflammatory response (on mouse thrombosis and ear edema models, its minimal effective dose is 20 nmol/kg), should also be antitumor active.
Structural similarity of intercalators N-[2(3-carboxyl-9-benzyl/H-carboline-1-yl)ethyl-1-yl]-amino acids,24–27 benzyl 1-(4-hydroxy-3-methoxycarbonyl-phenyl)-9H-pyrido[3,4-b]indole-3-carboxylate (BPIC),28 N-[1-(3-methoxycarbonyl-4-hydroxyphenyl)-β-carboline-3-carbonyl]-Trp-Lys-OBzl (PZL318)29 and benzyl Nω-nitro-Nα-(9H-pyrido[3,4-b]indole-3-carbonyl)-L-argininate (NRCB)30 with HMCEF means that HMCEF may be an intercalator (Figure 1).
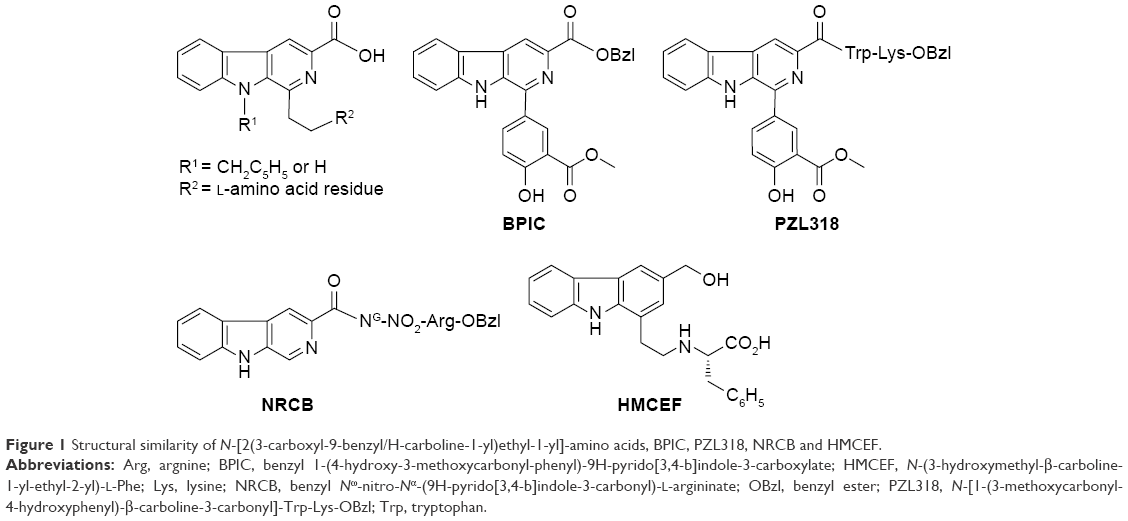 | Figure 1 Structural similarity of N-[2(3-carboxyl-9-benzyl/H-carboline-1-yl)ethyl-1-yl]-amino acids, BPIC, PZL318, NRCB and HMCEF. |
This knowledge leads to a hypothesis that P-selectin inhibitor and intercalator HMCEF could simultaneously exhibit antitumor, antithrombosis and anti-inflammatory actions, ie, HMCEF is able to not only reduce the tumor growth in patients with cancer but also prevent them from the complications of thrombosis and inflammation. To estimate the possibility of developing HMCEF as an antitumor drug, this study first docked HMCEF into the active site pocket of d(CGATCG)2.
Figure 2 indicates that by intercalating the aromatic planar ring of HMCEF into the base pairs of d(CGATCG)2, four hydrogen bonds could occur between HMCEF and d(CGATCG)2, of which the first hydrogen bond belongs to hydroxyl H of HMCEF and the O of pentose, the second and the third hydrogen bonds belong to hydroxyl H of HMCEF and the O of phosphate skeleton and the fourth hydrogen bond belongs to O of carboxyl group of HMCEF and H of amino group of bases. These interactions give the docking a −10.02 kcal/mol of binding free energy and predict HMCEF to be a desirable intercalator. In this context, this study explores the prospect of HMCEF toward developing a nanoscaled antitumor drug capable of treating complicated thrombosis and inflammation.
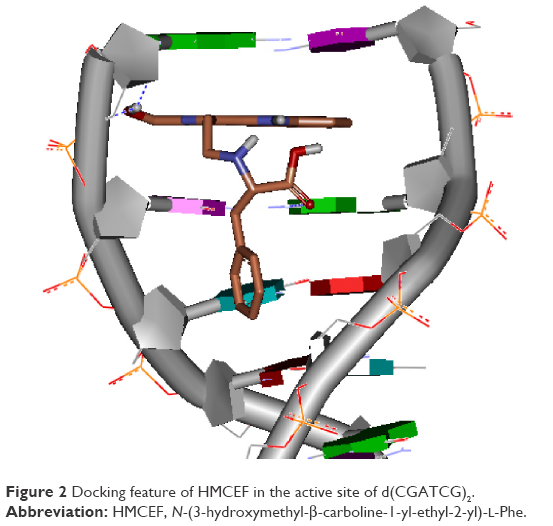 | Figure 2 Docking feature of HMCEF in the active site of d(CGATCG)2. |
Materials and methods
Male ICR mice (20±2 g) were purchased from the Laboratory Animal Center of Capital Medical University. Mouse evaluation was based on the protocol reviewed and approved by the ethics committee of Capital Medical University. The committee assured that the animal welfare was maintained according to the requirements of the Animal Welfare Act and National Institutes of Health (NIH) Guide for Care and Use of Laboratory Animals. Statistical analyses of all biological data were carried out by analysis of variance, and least significant difference (LSD) for multiple group comparison. All the analyses were performed using the SPSS 19.0 program, and P-value <0.05 was considered statistically significant. HMCEF was prepared by following the procedure in the literature,31 and its high-performance liquid chromatography (HPLC) purity (Atlantic T3 column, 4.6 mm ×150 mm, 3.0 μm) was >98%.
Docking toward active site of d(CGATCG)2
Software AutoDock 4.0 and d(CGATCG)2 were used to perform the molecular docking of HMCEF. The DNA, d(CGATCG)2, was treated as rigid and prepared by using AutoDockTools 1.5, ie, merging nonpolar hydrogens and assigning Gasteiger charges and autodock elements. HMCEF was treated as a rigid ligand and prepared by using AutoDockTools 1.5, ie, merging nonpolar hydrogens, assigning Gasteiger charges,32 finding root and aromatic carbons, detecting rotatable bonds and setting torsions. The grid box dimensions were set to 70×70×50 Å with a grid spacing of 0.375 Å. Lamarckian genetic algorithm (LGA) was used to find the appropriate binding positions, orientations and conformations of HMCEF in the active pocket of d(CGATCG)2. The global optimization was started with parameters of a population of 300 randomly positioned individuals. The maximum number of energy evaluations was increased to 2.5×10⁷, and the maximum number of generations in LGA was increased to 2.7×10⁵. The Solis and Wets local search was performed with a maximum number of 3,000. During the molecular docking experiments, 100 runs were carried out for HMCEF. The formed 100 conformations of HMCEF were achieved by the lowest binding energy and clustered with a root mean square tolerance of 2.0 Å.
In vitro interaction of HMCEF with calf thymus DNA (CT DNA)
Preparing stock solution of CT DNA
CT DNA was commercially obtained from Solarbio Ltd (Beijing, People’s Republic of China). A stock solution was prepared by dissolving CT DNA in phosphate-buffered saline (PBS; pH 7.4) and stored at 4°C, of which the sufficient purity was confirmed by the ratio of ultraviolet (UV) absorbance at 260 and 280 nm.33 The concentration of the stock solution was determined by extinction coefficient at 260 nm (6,600 cm−1).34
UV spectrum assay for HMCEF intercalating toward CT DNA
Absorbance spectra were recorded on a Shimadzu 2550 spectrophotometer with a 1.0 cm path quartz cell. Absorption titration was performed in the quartz cell by fixing 90 μM concentration of 2 mL HMCEF, into which 10 μL of CT DNA solution was added each time in 0.42–2.53 ratios of (DNA)/(HMCEF). The titration system was incubated at 37°C for 5 min for recording the absorption spectrum.
Fluorescence spectrum assay for HMCEF intercalating toward CT DNA
To further explore the interaction of HMCEF and CT DNA, the fluorescence quenching experiment of HMCEF with CT DNA was performed. In brief, 10 μL of solution of CT DNA in PBS (final concentration: 0, 8, 16, 24, 32, 40, 48, 56, 64 and 72 μM, pH =7.4) was added into the solution of HMCEF in PBS (0.5 μM, pH =7.4). For recording fluorescence spectrum, the solution was excited at 254 nm to observe the emission between 350 and 470 nm on a Shimadzu RF-5310PC spectrofluorometer.
To investigate the mode of HMCEF-binding CT DNA, ethidium bromide (EB) was used to carry out the fluorescence quenching experiment.35 In brief, 10 μL of HMCEF in PBS (final concentration: 0, 10, 20, 30, 40, 50, 60 and 70 μM, pH =7.4) was added into the solution of 5 μM of EB plus 10 μM of CT DNA in PBS. For recording fluorescence spectrum, the solution was excited at 254 nm to observe the emission between 300 and 700 nm on a Shimadzu RF-5310PC spectrofluorometer.
Circular dichroic (CD) spectrum assay for HMCEF intercalating toward CT DNA
To explore the effect of HMCEF on the conformation of CT DNA, the CD spectrum of CT DNA with and without HMCEF was determined. In the CD experiment, a solution of 0.2 mM of CT DNA in PBS (pH 7.4) and a solution of 0.4 mM of HMCEF and 0.2 mM of CT DNA in PBS were incubated at 37°C for 12 h to record the CD spectrum.
Melting temperature assay for HMCEF intercalating toward CT DNA
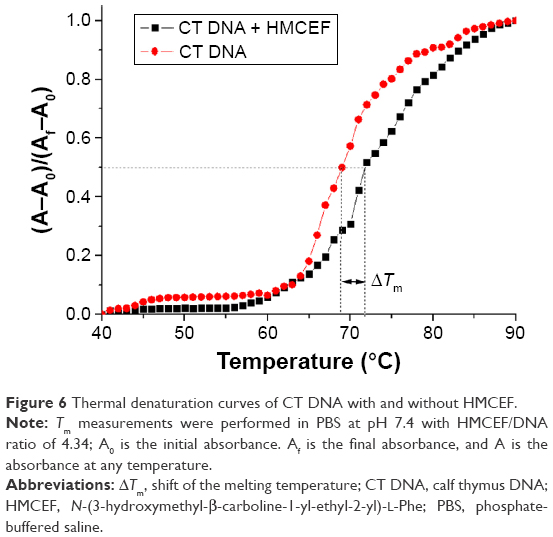
Thermal denaturation experiment was carried out for 92 μM CT DNA in the presence and absence of HMCEF in PBS (0.4 mM, pH 7.4), and the absorption intensity of CT DNA at 260 nm was monitored at 40°C–90°C on a Shimadzu Model UV-2100 UV-visible spectrophotometer. The temperature of the solution was controlled by water circulating bath (Thermo Fisher Scientific, Waltham, MA, USA) around cuvette chamber and measured before and after recording each spectrum. In this study, the temperature of the solution was increased at a rate of 1°C/min. The melting temperature (Tm) of CT DNA was determined as the midpoint of the optically detected transition curves. The ΔTm value reflects the difference between Tm of CT DNA without HMCEF and Tm of CT DNA with HMCEF.
Viscosity assay for HMCEF intercalating toward CT DNA
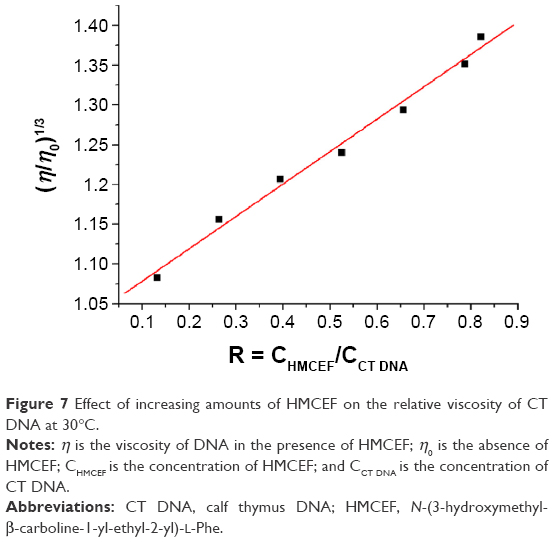
Viscosity experiment was carried out on Ostwald-type viscometer immersed in a circulating water bath of 25°C. CT DNA or HMCEF was dissolved in PBS to prepare stock solutions. Solutions of (HMCEF)/(CT DNA) in the ratios of 0.13–0.82 were prepared by adding HMCEF solution into CT DNA solution followed by bubbling with nitrogen for mixing. The flow time of CT DNA with or without HMCEF, t or t0, was measured after a thermal equilibrium time of 5 min. The relative viscosities of CT DNA with and without HMCEF were calculated according the equation η = (t−t0)/t0. Data are presented as (η/η0)1/3 versus binding ratio, where η is the relative viscosity of the solutions of (HMCEF)/(CT DNA) in the ratios of 0.13–0.82 and η0 is the relative viscosity of CT DNA alone in PBS.
DNA cleavage assay of HMCEF
HMCEF was measured by agarose gel electrophoresis in 20 mM Tris–HCl buffer (pH 7.4) in the presence of supercoiled plasmid DNA pBR322. The DNA damage activity of HMCEF was evaluated by the conversion of DNA from form I (supercoiled form) to form II (nicked circular form). pBR322 DNA was incubated with HMCEF of various concentrations at 37°C for 1 h, then was loaded on the 0.8% agarose gel (with 0.5 μg/mL EB) and run for 1.5 h under the voltage of ~90 V and photographed under UV light, and the intensity of the bands was measured on Fluorchem FC3 (ProteinSimple, Santa Clara, CA, USA).
Mesoscale simulation and nanostructure prediction
In the simulation of molecular dynamics, the molecular force field of HMCEF was selected and the standard procedures defined by Visualizer module of Material Studio 6.1 were followed. In brief, after the performance of constructing all-atom model, HMCEF was structurally optimized. Upon the coarse-graining mapping scheme, HMCEF was divided into three beads corresponding to its three structural units. The beads were assigned force field by following Visualizer module.
The box in the periodic boundary conditions was assigned to have a volume of 200×200×200 Å3. Inside the box, the packing density was 0.15 g/cm3, and three molecules of HMCEF were placed in the box. By using Visualizer module, the simulation was started from the amorphous state of HMCEF and performed in number of particles, constant volume and constant temperature ensemble, for which the setting temperature was 500 K, the setting step number was 50,000 and the setting time step was 10 fs. When the simulation time reached 15,000 ps, various forms of the molecules of HMCEF reached the equilibrium state and a stable aggregator was obtained, of which the size and feature did not change with the extension of the simulation time.
Measuring Fourier transform mass spectrometry (FT-MS) spectra of HMCEF
Mass spectra were recorded on a Bruker 9.4T solariX Fourier transform ion cyclotron resonance (FT-ICR) mass spectrometer equipped with an electrospray ionization (ESI)/matrix-assisted laser desorption/ionization (MALDI) dual ion source in positive ion mode. Three replicate measurements were performed for each sample. Data were acquired using solariX control software. Spectral data were processed using the Bruker Daltonics Data Analysis software.
Measuring transmission electron microscopy (TEM) image of HMCEF
Shape and size of the nanospecies of HMCEF in water were measured with TEM (JSM-2100; JEOL, Tokyo, Japan). In brief, an aqueous solution of HMCEF (pH 7.0, 10−6 M) was dripped onto a formvar-coated copper grid to form the monolayer of nanoparticles. The sample grid was dried thoroughly at 35°C for 14 days. The copper grids were viewed by microscope. The shape and size of the nanospecies on the copper grid were measured by counting >100 species in a randomly selected region. TEM images were recorded on an imaging plate (Gatan Bioscan Camera Model 1792; Gatan, Inc., Pleasanton, CA, USA) with 20 eV energy windows at 6,000–400,000× and were digitally enlarged. Each measurement was tested with triplicate grids at 80 kV (the electron beam accelerating voltage).
Measuring scanning electron microscopy (SEM) images of HMCEF
The shape and size of the nanospecies of HMCEF in solid state were measured by SEM (s-4800; Hitachi, Tokyo, Japan) at 50 kV. In brief, the lyophilized powders from 10−6 M solution of HMCEF in ultrapure water were attached to a copper plate with double-sided tape (Euromedex, Strasbourg, France). The specimens were coated with 20 nm gold–palladium using a Joel JFC-1600 Auto Fine Coater. The coater was operated at 15 kV, 30 mA and 200 mTorr (argon) for 60 s. The shape and size of the nanospecies on the SEM alloy were determined by examining >100 species in a randomly selected region. SEM images were recorded on an imaging plate (Gatan Bioscan Camera Model 1792) with 20 eV energy windows at 100–10,000× and were digitally enlarged. Each determination was performed with triplicate grids.
Measuring atomic force microscopy (AFM) images of HMCEF
In ambient conditions, AFM experiments were carried out on a Nanoscope 3D AFM (Veeco Metrology, Santa Barbara, CA, USA) with contact mode. AFM images of rat plasma alone, HMCEF in rat plasma (10−6 M) or HMCEF in ultrapure water (10−6 M) were recorded by following a standard procedure.
In vitro antiproliferation assay of HMCEF
The in vitro antiproliferation assays were carried out by the use of 96 microtiter plate cultures and MTT staining. The Bel7402, Hela, HepG2 and K562 cells (final concentration in the growth medium, 1×10⁴/mL) were grown in RPMI-1640 medium containing fetal bovine serum (10%, v/v), penicillin (100 μg/mL) and streptomycin (100 μg/mL) without (for control) or with HMCEF (final concentrations ranging from 0.1 to 200 μM). The cultures were propagated at 37°C for 24 h in a humidified atmosphere containing 5% CO2; after the first renewal of the growth medium, without or with HMCEF, they were propagated for another 48 h; after the second renewal of the growth medium with 25 μL of MTT solution (5 mg/mL), they were propagated for another 4 h. The growth medium was removed, and the residue was dried in the air. The dried residues were dissolved in 100 μL of dimethyl sulfoxide (DMSO), and the absorption values of light of the formed purple solutions were recorded on a Spectra Max M3 microplate reader (BioTek, Winooski, VT, USA) at 492 nm. The half maximal inhibitory concentration (IC50) values were calculated from the concentration–response curve by a nonlinear regression analysis using Graphpad Prism 5 software.
A549 cell-induced platelet aggregation assay
A549 cell-induced rat platelet aggregation assay was performed in a two-channel platelet aggregometer (Chrono-log Corp, Havertown, PA, USA) according to the manufacturer’s instructions. Sprague Dawley rat blood was collected in 3.8% aqueous sodium citrate (1:9, v/v) and immediately centrifuged at 1,500 rpm for 10 min to collect platelet-rich plasma (PRP). The residue was centrifuged at 3,000 rpm for another 10 min to prepare platelet-poor plasma (PPP). At 37°C, PRP was preincubated with HMCEF (0.5, 1.0 and 3 μM) or normal saline (NS) for 2 min. With stirring at 900 rpm, A549 cells (final concentration, 5×10⁶ cells/mL) were added into the preincubation solution to observe the effect of HMCEF on A549 cell-induced platelet aggregation. The peak height of the aggregation curve represented the maximal rate of platelet aggregation (Am%). The inhibition rate was calculated by the following equation:
|
In vivo antitumor assay of HMCEF
Male ICR mice were 10–12 weeks old at the beginning of experiments. S180 cells for initiation of subcutaneous tumors were obtained in ascitic form from abdominal cavities of S180 tumor bearing mice, which were serially transplanted once per week. Subcutaneous tumors were implanted by injecting 0.2 mL of NS containing 1.8×10⁷ viable tumor cells under the skin on the right oxter. Approximately 24 h after implantation, the tumor-bearing mice were randomized into six groups (12 per group). All mice were given a daily intraperitoneal injection of doxorubicin (2 μmol/kg per day in NS) or orally dosed HMCEF (0.2, 2 and 200 nmol/kg per day in NS) for 10 consecutive days. Approximately 24 h after the last administration, all the mice were sacrificed by ether anesthesia, fresh blood was collected immediately and the tumors, brains, hearts, livers, spleens and kidneys were removed and weighed.
In vivo liver and kidney injury of HMCEF-treated S180 mice
The blood from the mice to be used in the in vivo antitumor assay was collected and centrifuged at 1,000 rpm for 15 min to get the serum. Then, serum alanine transaminase (ALT) and aspartate transaminase (AST) were measured by following the guidance of the kits (AST/glutamic oxaloacetic transaminase (GOT) testing kit, ALT/glutamic pyruvic transaminase (GPT) testing kit; JCBIO Co., Nanjing, People’s Republic of China). In addition, commercial creatinine (Cr) assay kit was used to measure the kidney injury according to the standard protocol (Cr assay kit; JCBIO Co.).
In vivo toxicity of healthy mice orally receiving 20 μmol/kg of HMCEF
Male ICR mice (10 weeks old at the beginning of the experiment, purchased from Capital Medical University) in a conventional animal colony were maintained at 21°C with a natural day/night cycle. Twelve hours after fasting, mice were randomly divided into treatment groups (12 per group) of orally dosed 20 μmol/kg HMCEF or NS (vehicle control, 0.2 mL). The body weights and the food weights were taken at 0 and 48 h of the experiments to calculate the change in body weight and the amount of the food consumed. Forty-eight hours later, the anesthetized mice were killed, the blood was collected and the organs were weighed. The collected blood was centrifuged at 1,000 rpm for 15 min to get serum. Then, serum ALT, AST and Cr were measured by following the guidance of the kits (AST/GOT testing kit, ALT/GPT testing kit, Cr testing kit).
Results
HMCEF is an intercalator of CT DNA
Small molecule-induced variation of spectra and melting temperature of CT DNA have been widely used to identify the intercalation of small molecules and CT DNA. In the examination of the intercalation of CT DNA with HMCEF, the changes in UV spectrum, fluorescence spectrum, CD spectrum, viscosity and melting temperature of CT DNA were used to demonstrate the intercalation of HMCEF with CT DNA, and the results are given as follows in detail.
HMCEF is an intercalator of CT DNA: evidence from UV spectrum
In the UV experiments, the spectra of a solution of HMCEF in PBS buffer (pH 7.4, final concentration: 90 μM) and the spectra of HMCEF plus CT DNA (pH 7.4; 38, 76, 114, 152, 190 and 228 μM) were recorded in the region of 220–400 nm. Figure 3 shows the changes in the spectra upon the addition of CT DNA into HMCEF and indicates that CT DNA induces hypochromic effect and hypsochromic shift of HMCEF’s bands in the spectrum; such as the band at 238 nm (absorbance, 2.24) shows a hypochromism of 32.5%, the band at 289 nm (absorbance, 0.85) shows a hypsochromic shift (1.4 nm), the band at 340 nm (absorbance, 0.29) shows a hyperchromic effect of 31.1% and a hypsochromic shift of 1.8 nm.
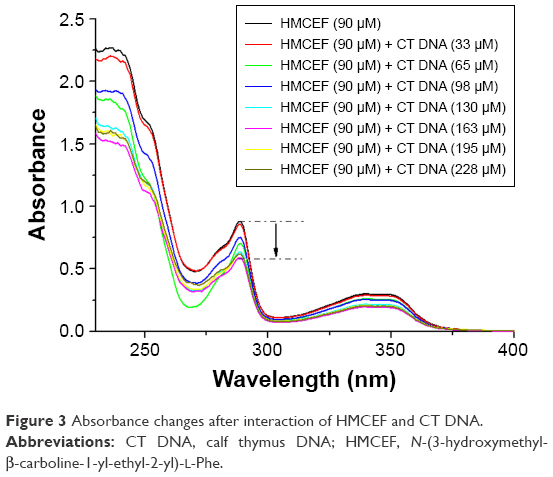 | Figure 3 Absorbance changes after interaction of HMCEF and CT DNA. |
HMCEF is an intercalator of CT DNA: evidence from fluorescence spectrum
In the fluorescence experiments, the spectra of HMCEF and HMCEF plus CT DNA were recorded. Figure 4A shows that when the concentration of CT DNA is increased to 72 μM the fluorescence intensity of HMCEF is lowered to its minimum (fluorescence intensity decreases by 84.03%). Figure 4B shows that in EB displacement experiments, EB itself has no fluorescence; when EB is incubated with CT DNA, the fluorescence intensity of the latter is greatly enhanced; while when EB-treated CT DNA is incubated with HMCEF, the enhanced fluorescence intensity of CT DNA was quenched. With the increase in the concentration of HMCEF, EB-enhanced fluorescence intensity of CT DNA decreased, which indicates a sharp quenching phenomenon (fluorescence intensity decreases by 52.79%), and a new emission peak appears at 587 nm.
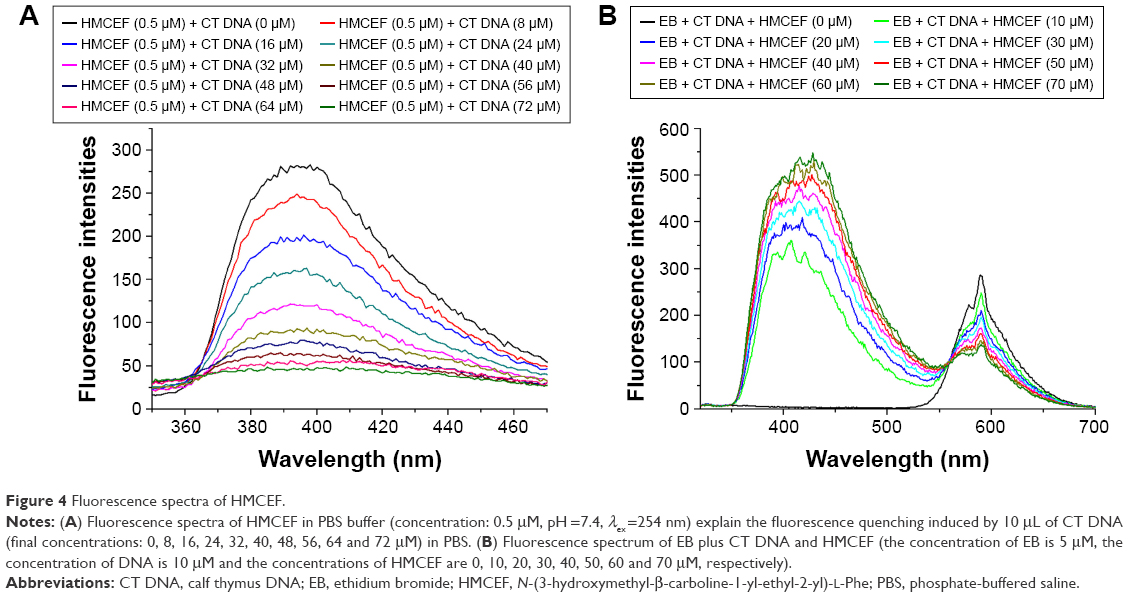 | Figure 4 Fluorescence spectra of HMCEF. |
HMCEF is an intercalator of CT DNA: evidence from CD spectrum
The comparison of the CD spectra of CT DNA with and without HMCEF is observed. Figure 5 shows that the CD spectrum of CT DNA without HMCEF (curve a) exhibits a negative peak around 245 nm and a positive peak around 276 nm, which are remarkably changed in the presence of 0.4 mM HMCEF. The ellipticity of the positive band increases by 54.6%, while the ellipticity of the negative band increases by 61.0% (curve b).
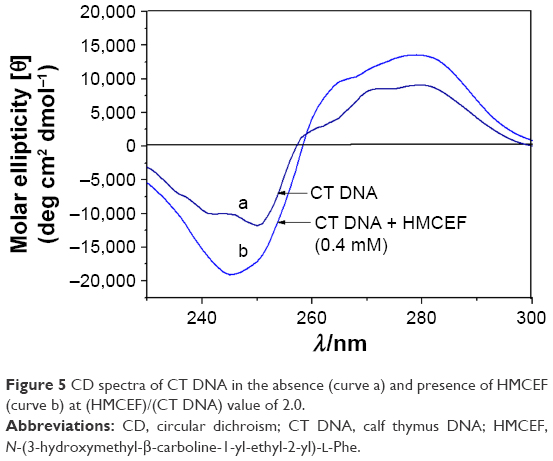 | Figure 5 CD spectra of CT DNA in the absence (curve a) and presence of HMCEF (curve b) at (HMCEF)/(CT DNA) value of 2.0. |
HMCEF is an intercalator of CT DNA: evidence from melting temperature
The thermal denaturation curves of CT DNA with and without HMCEF were drawn to show the change in the Tm, ie, to give the ΔTm. Figure 6 indicates that the ΔTm of CT DNA with and without HMCEF in PBS is 2.5°C, suggesting that the melting temperature of CT DNA increases by 2.5°C in the presence of HMCEF.
 | Figure 6 Thermal denaturation curves of CT DNA with and without HMCEF. |
HMCEF is an intercalator of CT DNA: evidence from viscosity
HMCEF-induced change in the viscosity of CT DNA is represented by the relative viscosity of the solutions of (HMCEF)/(CT DNA) in the ratios of 0.13–0.82. Figure 7 indicates that the relative viscosity of CT DNA is increasing steadily with the increase in the concentration of HMCEF. The results suggest that HMCEF intercalates between the base pairs of DNA, which are consistent with the docking of HMCEF toward the active pocket of DNA.
 | Figure 7 Effect of increasing amounts of HMCEF on the relative viscosity of CT DNA at 30°C. |
HMCEF cuts off supercoiled plasmid DNA pBR322
To further explore the action of HMCEF on DNA, the cleavage of supercoiled plasmid DNA pBR322 in the presence of HMCEF was monitored with agarose gel electrophoresis. Figure 8 shows that HMCEF is able to cut off supercoiled plasmid DNA pBR322, ie, HMCEF can concentration dependently promote the conversion of supercoiled plasmid DNA pBR322 from form I (supercoiled form) toward form II (nicked circular form). Figure 8 also shows that with the increase in the concentration of HMCEF from 0 μM to 100, 200, 300, 400 and 500 μM, the density% of electrophoresis strip of form II increases from 29% to 58%, 62%, 69%, 68% and 68%, respectively. In contrast, HMCEF promotes the density% of electrophoresis strip of form I to have a gradual decrease.
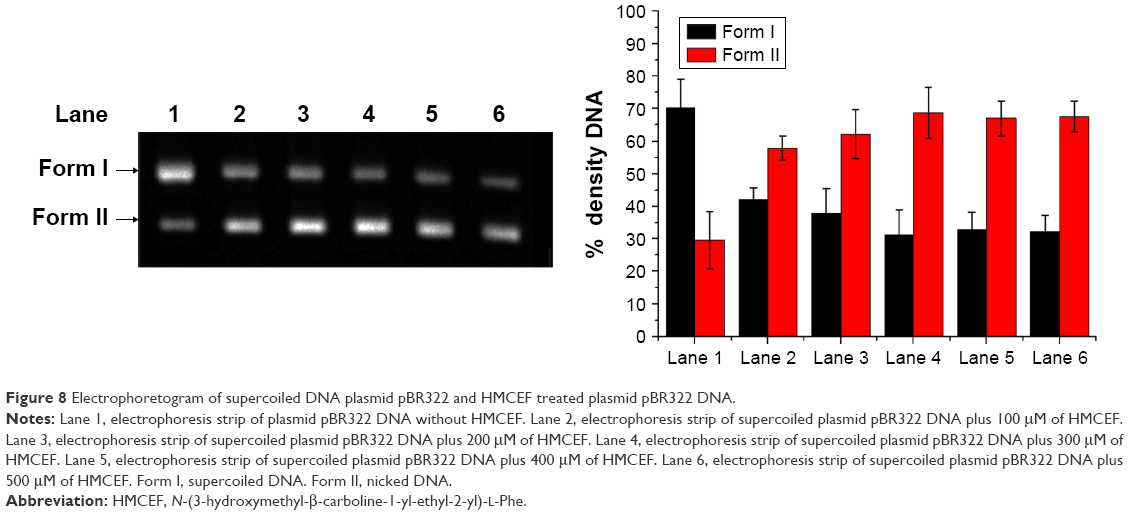 | Figure 8 Electrophoretogram of supercoiled DNA plasmid pBR322 and HMCEF treated plasmid pBR322 DNA. |
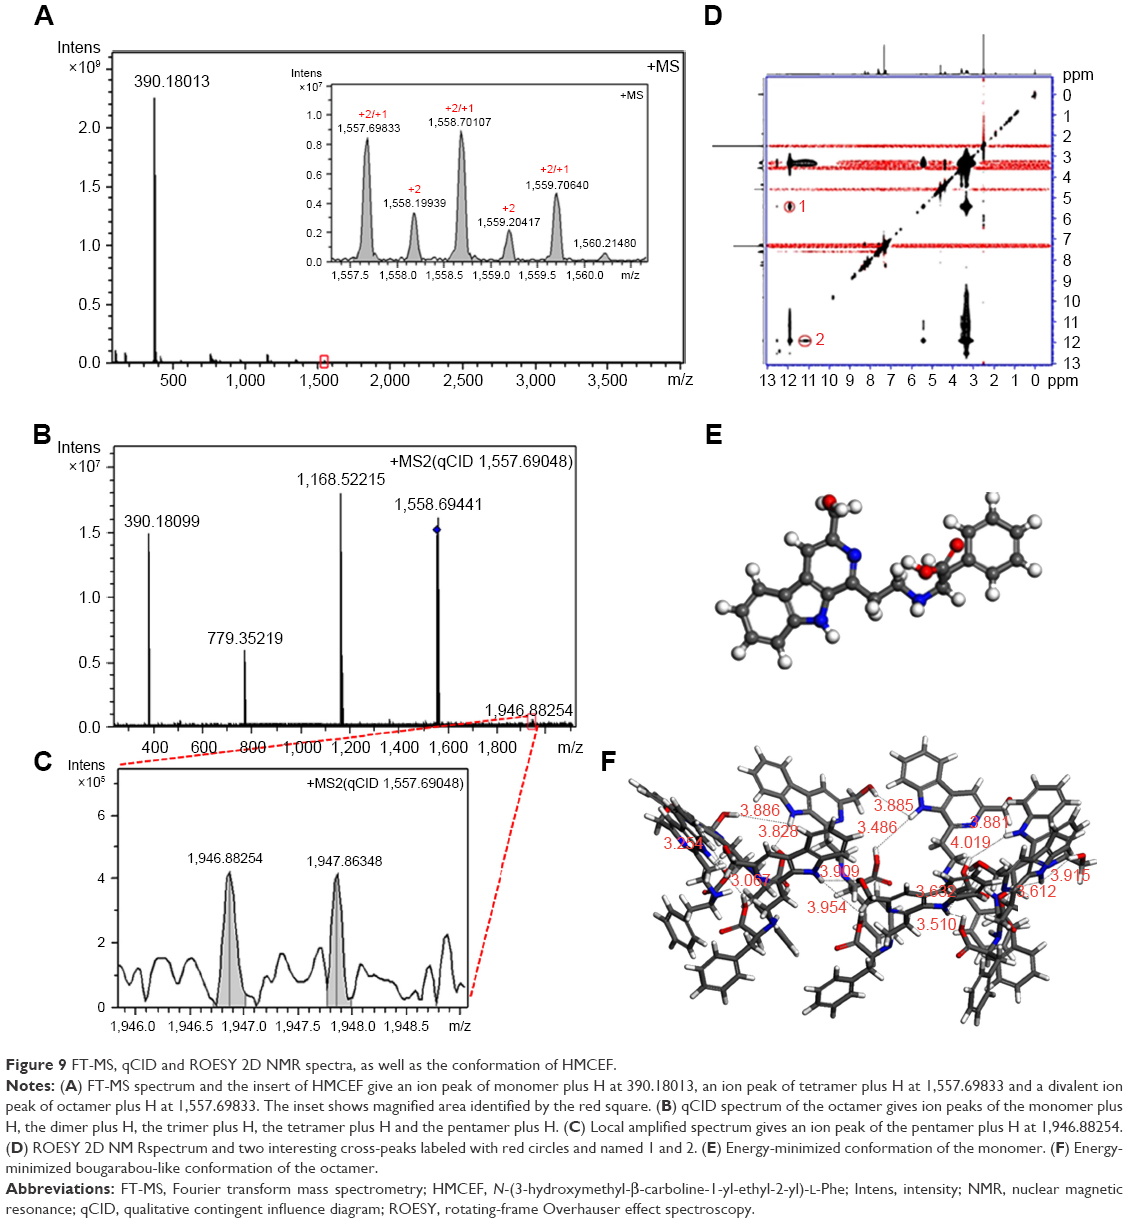
HMCEF forms octamer: evidence from FT-MS and qualitative contingent influence diagram (qCID) spectra
To explore the intermolecular association of HMCEF in ultrapure water, FT-MS tests were performed. Figure 9A indicates that the FT-MS spectrum of HMCEF gives an ion peak of monomer plus H at 390.18013 (exact value, 390.17394), an ion peak of tetramer plus H at 1,557.69833 (exact value, 1,557.69576), and a divalent ion peak of octamer plus H at 1,557.69833 (exact value, 1,557.69576). The qCID spectrum of the octamer (Figure 9B and C) gives an ion peak of monomer plus H at 390.18099 (exact mass, 390.17394), an ion peak of dimer plus H at 779.35219 (exact mass, 779.34788), an ion peak of trimer plus H at 1,168.52215 (exact mass, 1,168.52182) and an ion peak of pentamer plus H at 1,946.88254 (exact mass, 1,946.86970), suggesting the monomer, dimer, trimer and pentamer are from the octamer.
 | Figure 9 FT-MS, qCID and ROESY 2D NMR spectra, as well as the conformation of HMCEF. |
Approach of HMCEF forming octamer: evidence from nuclear Overhauser effect spectroscopy (NOESY) 2D 1H nuclear magnetic resonance (NMR) spectrum
To explore the form of octamer, the NOESY 2D 1H NMR spectrum of HMCEF was recorded at 800 MHz in deuterated DMSO. In Figure 9D, two interesting cross-peaks are labeled with red circles. Cross-peak 1 mirrors the interaction between the pyrrole H of the carboline moiety of one molecule with the hydroxyl H of another molecule. Cross-peak 2 mirrors the interaction between the pyrrole H of the carboline moiety of one molecule with the carboxyl H of the Phe moiety of another molecule.
Energy-minimized bougarabou-like conformation of HMCEF’s octamer
To visualize the feature of the octamer formed by molecular association, HMCEF was sketched with ChemDraw 12.0 and converted to 3D structure with Chem3D 12.0, then energy minimization was performed in Discovery Studio 2.1 (with a Merck molecular force field; Merck & Co.) to have the energy-minimized conformation of a monomer (Figure 9E). This conformation was used as a structure unit, and in total eight energy-minimized conformations were manually approached based on two cross-peaks of rotating-frame Overhauser effect spectroscopy (ROESY) 2D NMR of HMCEF, so that the distances between two protons in each cross-peak could be <4 Å. As a result of the manual association, the octamer gets the energy-minimized bougarabou-like conformation as shown in Figure 9F.
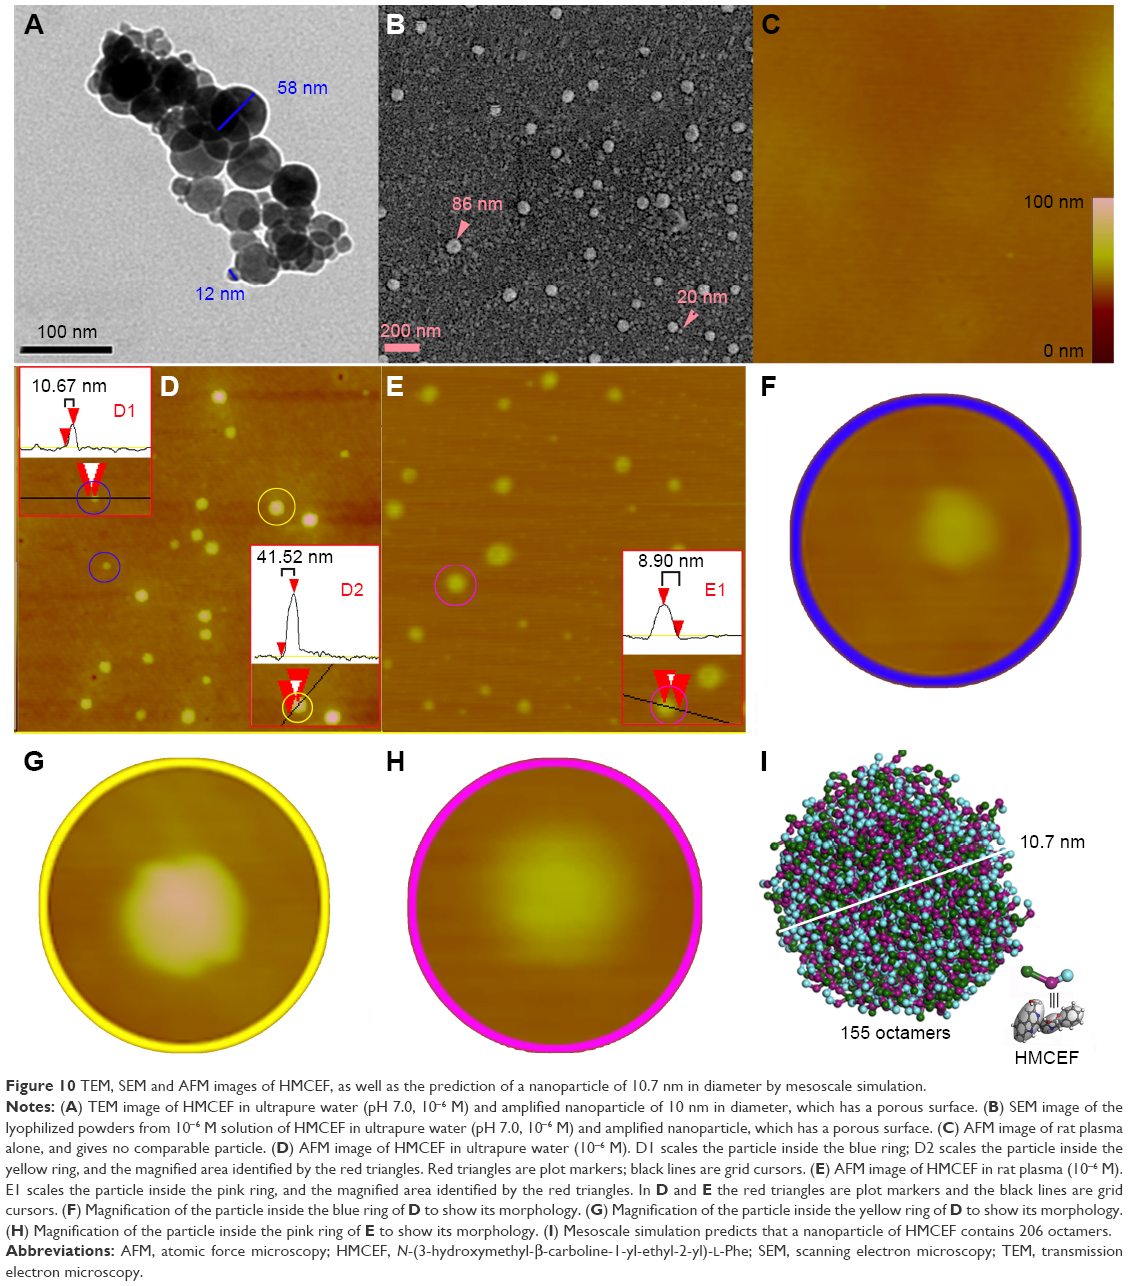
HMCEF forms nanoparticles: evidence from TEM, SEM and AFM images
The nano-feature of HMCEF was visualized using TEM, SEM and AFM images. TEM image, as shown in Figure 10A, is characterized by the nanoparticles of 12–58 nm in diameter. SEM image, as shown in Figure 10B, is characterized by the nanoparticles of 20–83 nm in diameter. As shown in Figure 10A and B, on the surfaces of the nanoparticles, there are numerous holes, and both the amplified particles indicate that the diameter of the hole is 4.1–4.8 nm. AFM images, as shown in Figure 10C–H, are characterized by the nanoparticles of 8.9–41.5 nm height and 68.4–117.2 nm in width. Thus, TEM, SEM and AFM images consistently visualize that in aqueous solution, in solid state and in the plasma HMCEF forms nanoparticles of <120 nm in diameter.
 | Figure 10 TEM, SEM and AFM images of HMCEF, as well as the prediction of a nanoparticle of 10.7 nm in diameter by mesoscale simulation. |
Mesoscale simulates a nanoparticle of 10.7 nm in diameter of HMCEF
To predict the molecular number in a nanoparticle of HMCEF, the Mesoscale Simulation software was used to perform the calculation. For this purpose, the molecule of HMCEF was divided into three beads according to the property of three moieties. The box in periodic boundary conditions was assigned to have a volume of 200×200×200 Å3. Inside this box, the packing density was 0.15 g/cm3 and the three molecules of HMCEF were placed for the calculation. Figure 10I predicts that in a nanoparticle of 10.7 nm in diameter, 155 octamers of HMCEF are involved.
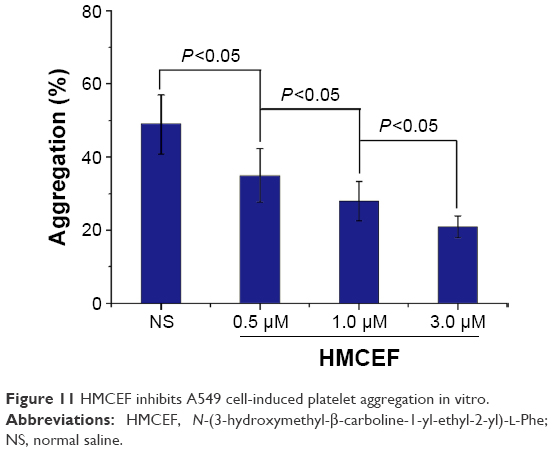
HMCEF inhibits A549 cell-induced platelet aggregation
The effect of HMCEF (0.5, 1.0 and 3.0 μM) on A549 cell-induced platelet aggregation was evaluated by following the standard procedure, and the results are shown in Figure 11. As seen, the %inhibitions of 0.5, 1.0 and 3.0 μM of HMCEF are significantly lower than that of NS, suggesting HMCEF effectively inhibits A549 cell-induced platelet aggregation. Figure 11 also demonstrates that HMCEF inhibits A549 cell-induced platelet aggregation in a concentration-dependent manner.
 | Figure 11 HMCEF inhibits A549 cell-induced platelet aggregation in vitro. |
HMCEF inhibits proliferation of cancer cells and reduces tumor growth in S180 mice
The in vitro antiproliferation of HMCEF against the carcinoma cells, Bel7402 (human hepatoma cell line), HeLa (human epithelial cervical cancer), HepG2 (human hepatocellular liver carcinoma cell line) and K562 (human immortalized myelogenous leukemia line), was evaluated by MTT method and represented with IC50 value. The study protocol and use of human cells lines and animals were approved by the Capital Medical University Ethics Committee. The committee ensured that animal procedures and the animals’ welfare were in accordance with the National Institutes of Health Guide for the Care and Use of Laboratory Animals and the Animal Welfare Act. Figure 12A shows that when the cells are exposed to serial concentrations (0.1–200 μM) of HMCEF or doxorubicin (positive control), the IC50 values range from 14.1 μM to >105.4 μM, ie, HMCEF efficiently inhibits the proliferation of four cell lines. Figure 12 also shows that for HMCEF, HepG2, K562 and Bel7402 cells are more sensitive than HeLa cells.
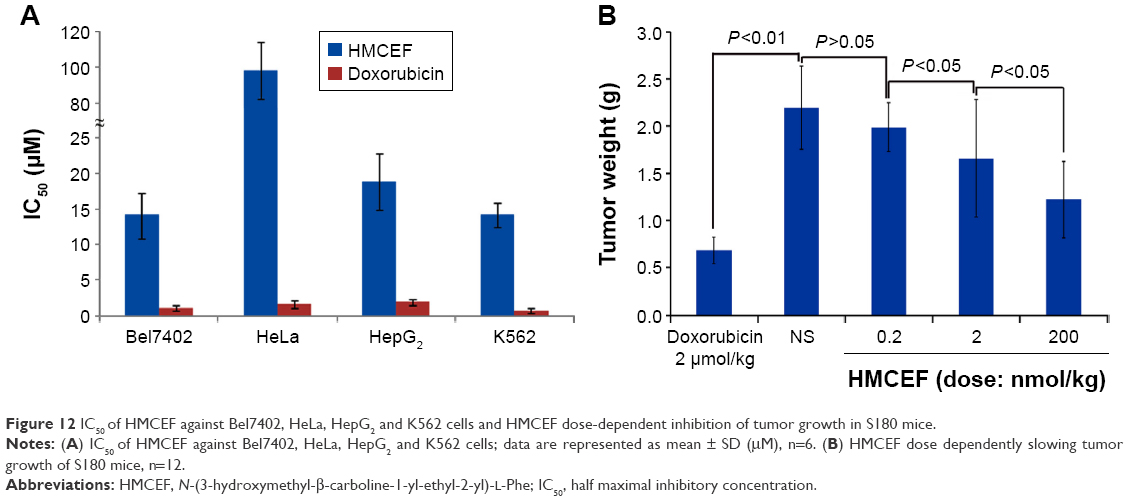 | Figure 12 IC50 of HMCEF against Bel7402, HeLa, HepG2 and K562 cells and HMCEF dose-dependent inhibition of tumor growth in S180 mice. |
To observe the in vivo antitumor action, the tumor weights of S180 mice receiving HMCEF were recorded. Figure 12B indicates that at the oral dose of 0.2, 2 and 200 nmol/kg per day, the 10 consecutive days’ therapy of HMCEF decreases the tumor weight of S180 mice, which is significantly lower than that of NS-treated S180 mice and HMCEF possesses a dose-dependent action. The minimal effective dose of HMCEF is 2 nmol/kg.
HMCEF exhibits no liver and kidney toxicity to both S180 and healthy ICR mice
The liver and kidney toxicities are represented with ALT/AST and Cr, respectively. The liver and kidney toxicities of HMCEF therapy were examined on both S180 mice and healthy ICR mice.
Figure 13A and B indicates that the serum ALT and AST of the S180 mice treated with 200 nmol/kg per day of HMCEF for 10 consecutive days are at the same level as that of the S180 mice treated with NS for 10 consecutive days. Figure 13C indicates that the serum Cr of the S180 mice treated with 200 nmol/kg per day of HMCEF for 10 consecutive days is at the same level as that of the S180 mice treated with NS for 10 consecutive days. Therefore, at the highest therapeutic dose, HMCEF therapy has no liver and kidney toxicity.
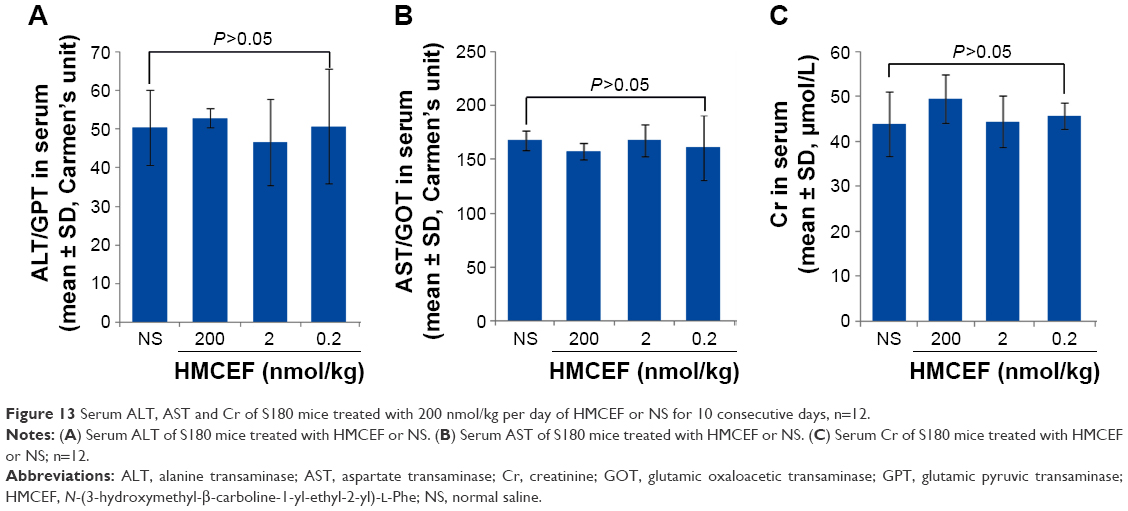 | Figure 13 Serum ALT, AST and Cr of S180 mice treated with 200 nmol/kg per day of HMCEF or NS for 10 consecutive days, n=12. |
Figure 14A and B indicates that the serum ALT and AST of healthy ICR mice treated with 20,000 nmol/kg of HMCEF are at the same level as that of healthy ICR mice treated with NS. Figure 14C indicates that the serum Cr of healthy ICR mice treated with 20,000 nmol/kg of HMCEF is at the same level as that of healthy ICR mice treated with NS. Two days after the treatment it was found that even the dose of HMCEF was equal to that of 100-folds of the highest dose; the healthy ICR mice did not exhibit neurotoxic behavior, and necropsy revealed no apparent changes in the fatal organs. Therefore, HMCEF is comparatively nontoxic, the median lethal dose value should be >20 μmol/kg and the safe window should be >10,000 μmol/kg.
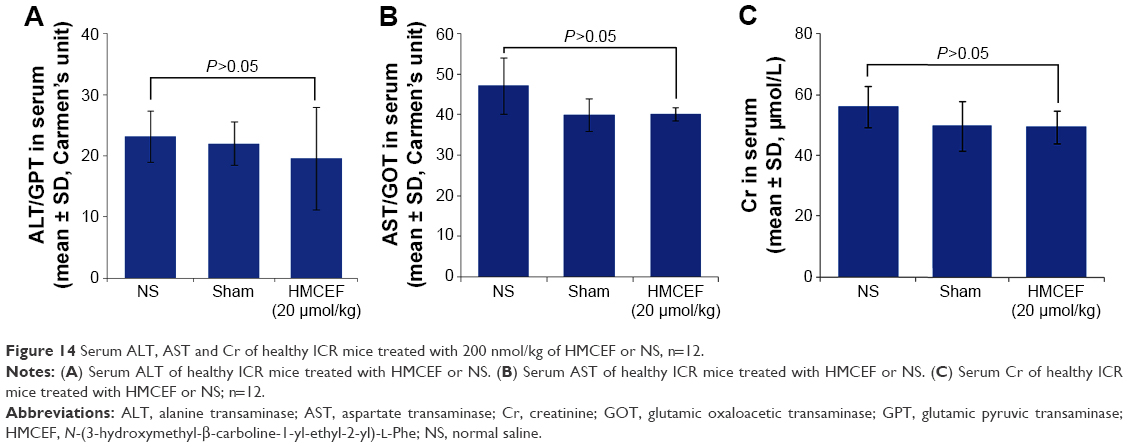 | Figure 14 Serum ALT, AST and Cr of healthy ICR mice treated with 200 nmol/kg of HMCEF or NS, n=12. |
Discussion
The interaction between small molecules and CT DNA has been characterized by physical chemistry identified intercalation. The UV spectra of HMCEF with various concentrations of CT DNA show hypochromic effect, thereby defining an intercalation of the aromatic moieties of HMCEF toward the stacking base pairs of CT DNA helix. The fluorescence spectra of HMCEF with various concentrations of CT DNA show a gradual decrease in the fluorescence intensity of HMCEF and reflect the intercalation of HMCEF toward CT DNA. While the fluorescence spectra of EB-binding CT DNA with various concentrations of HMCEF show a gradual decrease in the fluorescence intensity of EB-binding CT DNA, HMCEF can replace EB from CT DNA and reflect the intercalation of HMCEF toward CT DNA. The CD spectrum of CT DNA in B-form conformation is characterized by a positive band at 276 nm and a negative band at 245 nm of the UV region, of which the positive band is due to the base π-stacking and the negative band is due to polynucleotide helicity.35 The addition of HMCEF enhances the ellipticity of both positive band and negative band due to stabilizing the right-handed B-form conformation of CT DNA and reflects the intercalation of HMCEF toward CT DNA. The presence of HMCEF leads to an increase in Tm of CT DNA and evidences the intercalation of HMCEF toward CT DNA. The viscosity measurements indicate that increasing the ratio of (HMCEF)/(CT DNA) leads to the increase in the relative viscosity of CT DNA, suggest that the base pairs of CT DNA are pushed apart and show the intercalation of HMCEF toward CT DNA. The cleavage reaction of HMCEF and DNA pBR322 indicates that HMCEF concentration dependently leads the conversion of supercoiled DNA pBR322 (form I) to form II (nicked circular form), suggests that HMCEF can cut off supercoiled DNA pBR322 and shows the HMCEF-induced cleavage of supercoiled DNA pBR322. These in vitro actions of HMCEF on CT DNA and supercoiled DNA pBR322 with HMCEF directly binding P-selectin31 together lead to a hypothesis that by binding P-selectin on the surfaces of cancer cells, HMCEF enters into their cytoplasm, intercalates their DNA and cuts off their DNA.
FT-MS spectrum indicates that HMCEF forms octamer, while qCID spectrum of the octamer shows that in Fourier transform tandem mass spectrometry condition the monomer, dimer, trimer and pentamer are from the octamer. This means that, as its existing form, the octamer is formed by the association of one monomer, one dimer and one pentamer. NOESY 2D 1H NMR spectra provide the manual approach of forming the octamer36 and demonstrate that the octamer has energy-minimized bougarabou-like conformation. Mesoscale simulation predicts that 155 octamers of HMCEF could form a nanoparticle of 10.7 nm in diameter. TEM, SEM and AFM images experimentally confirm that in aqueous solution, in solid state and in rat plasma, HMCEF indeed forms nanoparticles of <120 nm in diameter. This size benefits the nanoparticles to avoid the macrophages’ entrapping in blood circulation.37
In vitro IC50 values of HMCEF against the proliferation of Bel7402, Hela, HepG2 and K562 cells range from 14.1 to 105.4 μM, suggesting an efficient inhibition. In vivo HMCEF dose dependently inhibits the tumor growth of S180 mice, and the minimal effective dose is 2 nmol/kg per day, suggesting an efficient inhibition. These data with the nanoparticle size, P-selectin inhibition, antithrombotic action and anti-inflammatory action suggest that HMCEF can be considered a nanoscaled antitumor drug capable of also treating complicated thrombosis and inflammation.
In S180 mouse model, 200 nmol/kg per day of HMCEF induces no toxic reaction in the liver and kidney, and in healthy ICR mouse model 20,000 nmol/kg of HMCEF still induces no toxic reaction in the liver and kidney. Therefore, HMCEF is considered a safe nanomedicine.
Conclusion
Nanoscaled HMCEF, capable of downregulating P-selectin expression, inhibiting thrombosis and blocking inflammatory response, was developed toward antitumor drug. By directly binding P-selectin, HMCEF enters into the cytoplasm, intercalates the DNA and cuts off the DNA of cancer cells. This chain-like action leads to the benefits of HMCEF dose dependently slowing the tumor growth of S180 mice in vivo and having a minimal effective dose of 2 nmol/kg per day. At 200 nmol/kg per day, HMCEF does not affect the liver and the kidney of the treated S180 mice. At 20,000 nmol/kg, HMCEF does not affect the liver and the kidney of the treated healthy ICR mice. Thus, HMCEF is a promising antitumor drug, which is characterized by its high safety and efficacy of preventing the patients from the complications of thrombosis and inflammation.
Acknowledgments
The authors thank the BMSTC (Z141100002114049), TJSHG (201310025008), the Project of Construction of Innovative Teams and Teacher Career Development for Universities and Colleges under Beijing Municipality, NSFC (81270046, 81273379, 81373264, and 81373265), BNSF (7162025), CMUZR (2015ZR15), CMUZR (2016ZR16), and the 863 Program (AA 2015020902) for financial support.
Disclosure
The authors report no conflicts of interest in this work.
References
Abu Saadeh F, Norris L, O’Toole S, et al. Tumour expression of tissue factor and tissue factor pathway inhibitor in ovarian cancer-relationship with venous thrombosis risk. Thromb Res. 2013;132(5):627–634. | ||
Rickles FR, Falanga A. Molecular basis for the relationship between thrombosis and cancer. Thromb Res. 2001;102(6):V215–V224. | ||
Pesic M, Greten FR. Inflammation and cancer: tissue regeneration gone awry. Curr Opin Cell Biol. 2016;43:55–61. | ||
Kidane D, Chae WJ, Czochor J, et al. Interplay between DNA repair and inflammation, and the link to cancer. Crit Rev Biochem Mol Biol. 2014;49(2):116–139. | ||
Balkwill F, Mantovani A. Cancer and inflammation: implications for pharmacology and therapeutics. Clin Pharmacol Ther. 2010;87(4):401–406. | ||
Balkwill FR, Mantovani A. Cancer-related inflammation: common themes and therapeutic opportunities. Semin Cancer Biol. 2012;22(1):33–40. | ||
Mantovani A, Allavena P, Sica A, Balkwill F. Cancer-related inflammation. Nature. 2008;454(7203):436–444. | ||
Polek A, Sobiczewski W, Matowicka-Karna J. P-selectin and its role in some diseases. Postepy Hig Med Dosw. 2009;63:465–470. | ||
Harrison P, Cramer EM. Platelet alpha-granules. Blood Rev. 1993;7(1):52–62. | ||
Mayadas TN, Johnson RC, Rayburn H, Hynes RO, Wagner DD. Leukocyte rolling and extravasation are severely compromised in P selectin-deficient mice. Cell. 1993;74(3):541–554. | ||
Kim YJ, Borsig L, Varki NM, Varki A. P-selectin deficiency attenuates tumor growth and metastasis. Proc Natl Acad Sci U S A. 1998;95(16):9325–9330. | ||
Geng Y, Takatani T, Yeh K, Hsu JW, King MR. Targeting underglycosylated MUC1 for the selective capture of highly metastatic breast cancer cells under flow. Cell Mol Bioeng. 2013;6(2):148–159. | ||
Borsig L, Wong R, Hynes RO, Varki NM, Varki A. Synergistic effects of L- and P-selectin in facilitating tumor metastasis can involve non-mucin ligands and implicate leukocytes as enhancers of metastasis. Proc Natl Acad Sci U S A. 2002;99(4):2193–2198. | ||
Laubli H, Stevenson JL, Varki A, Varki NM, Borsig L. L-selectin facilitation of metastasis involves temporal induction of Fut7-dependent ligands at sites of tumor cell arrest. Cancer Res. 2006;66(3):1536–1542. | ||
Laubli H, Borsig L. Selectins as mediators of lung metastasis. Cancer Microenviron. 2010;3(1):97–105. | ||
Biancone L, Araki M, Araki K, Vassalli P, Stamenkovic I. Redirection of tumor metastasis by expression of E-selectin in vivo. J Exp Med. 1996;183(2):581–587. | ||
Ferroni P, Roselli M, Martini F, et al. Prognostic value of soluble P-selectin levels in colorectal cancer. Int J Cancer. 2004;111(3):404–408. | ||
Haznedaroglu IC, Benekli M, Ozcebe O, et al. Serum L-selectin and P-selectin levels in lymphomas. Haematologia (Budap). 2000;30(1):27–30. | ||
Schadendorf D, Diehl S, Zuberbier T, Schadendorf C, Henz BM. Quantitative detection of soluble adhesion molecules in sera of melanoma patients correlates with clinical stage. Dermatology. 1996;192(2):89–93. | ||
Blann AD, Gurney D, Wadley M, Bareford D, Stonelake P, Lip GY. Increased soluble P-selectin in patients with haematological and breast cancer: a comparison with fibrinogen, plasminogen activator inhibitor and von Willebrand factor. Blood Coagul Fibrinolysis. 2001;12(1):43–50. | ||
Roselli M, Mineo TC, Martini F, et al. Soluble selectin levels in patients with lung cancer. Int J Biol Markers. 2002;17(1):56–62. | ||
Lazo-Langner A, Goss GD, Spaans JN, Rodger MA. The effect of low-molecular-weight heparin on cancer survival. A systematic review and meta-analysis of randomized trials. J Thromb Haemost. 2007;5(4):729–737. | ||
Borsig L, Vlodavsky I, Ishai-Michaeli R, Torri G, Vismara E. Sulfated hexasaccharides attenuate metastasis by inhibition of P-selectin and heparanase. Neoplasia. 2011;13(5):445–452. | ||
Wu JH, Cui GH, Zhao M, Cui CY, Peng SQ. Novel N-(3-carboxyl-9-benzylcarboline-1-yl) ethylamino acids: synthesis, anti-proliferation activity and two-step-course of intercalation with calf thymus DNA. Mol Biosyst. 2007;3(12):855–861. | ||
Wu JH, Zhao M, Qian KD, Lee KH, Morris-Natschke S, Peng SQ. Novel N-(3-carboxyl-9-benzyl-beta-carboline-1-yl)ethylamino acids: synthesis, anti-tumor evaluation, intercalating determination, 3D QSAR analysis and docking investigation. Eur J Med Chem. 2009;44(10):4153–4161. | ||
Wu JH, Li CY, Zhao M, Wang WJ, Wang YJ, Peng SQ. A class of novel carboline intercalators: their synthesis, in vitro anti-proliferation, in vivo anti-tumor action, and 3D QSAR analysis. Bioorg Med Chem. 2010;18(17):6220–6229. | ||
Wu JH, Wei L, Zhao M, Wang YJ, Kang GF, Peng SQ. N-[2(3-Carboxyl-9-benzyl-carboline-1-yl)ethyl-1-yl]-amino acids: correlation of spectral property with in vivo anti-tumor activity. Med Chem Res. 2012;21(1):116–123. | ||
Li S, Wang YJ, Zhao M, Wu JH, Peng SQ. BPIC: a novel anti-tumor lead capable of inhibiting inflammation and scavenging free radicals. Bioorg Med Chem Lett. 2015;25(5):1146–1150. | ||
Li S, Wang Y, Wang F, et al. Small molecule PZL318: forming fluorescent nanoparticles capable of tracing their interactions with cancer cells and activated platelets, slowing tumor growth and inhibiting thrombosis. Int J Nanomedicine. 2015;10:5273–5292. | ||
Xu W, Zhao M, Wang Y, et al. Design, synthesis, and in vivo evaluations of benzyl Nω-nitro-Nα-(9H-pyrido[3,4-b]indole-3-carbonyl)-l-argininate as an apoptosis inducer capable of decreasing the serum concentration of P-selectin. Med Chem Commun. 2016;7(9):1730–1737. | ||
Wu J, Zhao M, Wang Y, et al. A novel lead of P-selectin inhibitor: discovery, synthesis, bioassays and action mechanism. Bioorg Med Chem Lett. 2016;26(19):4631–4636. | ||
Gan T, Wang Y, Zhao M, Wu J, Yang J, Peng S. 5-(Bis(3-(2-hydroxyethyl)-1H-indol-2-yl)methyl)-2-hydroxybenzoic acid (BHIMHA): showing a strategy of designing drug to block lung metastasis of tumors. Drug Des Devel Ther. 2016;10:711–721. | ||
Kumar N, Kumar R, Nemaysh V, Lal N, Luthra PM. Bis((1,4-dimethyl-9H-carbazol-3-yl)methyl)amine-mediated anticancer effect triggered by sequence-specific cleavage of DNA leading to programmed cell death in the human U87 cell line. RSC Adv. 2016;6(72):67925–67940. | ||
Reichmann ME, Rice SA, Thomas CA, Doty PA. Further examination of the molecular weight and size of desoxypentose nucleic acid. J Am Chem Soc. 1954;76(11):3047–3053. | ||
Nafisi S, Saboury AA, Keramat N, Neault J-F, Tajmir-Riahi H-A. Stability and structural features of DNA intercalation with ethidium bromide, acridine orange and methylene blue. J Mol Struct. 2007;827(1–3):35–43. | ||
Vijayalakshmi R, Kanthimathi M, Subramanian V, Nair BU. Interaction of DNA with [Cr(Schiff base)(H2O)2]ClO4. Biochim Biophys Acta. 2000;1475(2):157–162. | ||
Jin SM, Wang YN, Zhu HM, et al. Nanosized aspirin-Arg-Gly-Asp-Val: delivery of aspirin to thrombus by the target carrier Arg-Gly-Asp-Val tetrapeptide. ACS Nano. 2013;7(9):7664–7673. | ||
Fujita Y, Mie M, Kobatake E. Construction of nanoscale protein particle using temperature-sensitive elastin-like peptide and polyaspartic acid chain. Biomaterials. 2009;30(20):3450–3457. |
 © 2017 The Author(s). This work is published and licensed by Dove Medical Press Limited. The
full terms of this license are available at https://www.dovepress.com/terms
and incorporate the Creative Commons Attribution
- Non Commercial (unported, 3.0) License.
By accessing the work you hereby accept the Terms. Non-commercial uses of the work are permitted
without any further permission from Dove Medical Press Limited, provided the work is properly
attributed. For permission for commercial use of this work, please see paragraphs 4.2 and 5 of our Terms.
© 2017 The Author(s). This work is published and licensed by Dove Medical Press Limited. The
full terms of this license are available at https://www.dovepress.com/terms
and incorporate the Creative Commons Attribution
- Non Commercial (unported, 3.0) License.
By accessing the work you hereby accept the Terms. Non-commercial uses of the work are permitted
without any further permission from Dove Medical Press Limited, provided the work is properly
attributed. For permission for commercial use of this work, please see paragraphs 4.2 and 5 of our Terms.