Back to Journals » Clinical Ophthalmology » Volume 17
Myopic (Peri)papillary Changes and Visual Field Defects
Authors Ehongo A ![]() , Dugauquier A
, Dugauquier A ![]() , Kisma N, De Maertelaer V
, Kisma N, De Maertelaer V ![]() , Nana Wandji B, Tchatchou Tomy W, Alaoui Mhammedi Y, Coppens K, Leroy K
, Nana Wandji B, Tchatchou Tomy W, Alaoui Mhammedi Y, Coppens K, Leroy K ![]() , Bremer F
, Bremer F
Received 9 January 2023
Accepted for publication 9 October 2023
Published 1 November 2023 Volume 2023:17 Pages 3295—3306
DOI https://doi.org/10.2147/OPTH.S404167
Checked for plagiarism Yes
Review by Single anonymous peer review
Peer reviewer comments 2
Editor who approved publication: Dr Scott Fraser
Adèle Ehongo,1 Artémise Dugauquier,1 Nacima Kisma,1 Viviane De Maertelaer,2 Brenda Nana Wandji,1 Wilfried Tchatchou Tomy,1 Yassir Alaoui Mhammedi,1 Kevin Coppens,3 Karelle Leroy,4 Francoise Bremer1
1Ophthalmology Department, Erasmus Hospital, Brussels, 1070, Belgium; 2Biostatistics, IRIBHM Université Libre de Bruxelles, Bruxelles, 1070, Belgium; 3Cosma consulting Sijsjesdreef 13, Enghien, 7850, Belgium; 4Laboratory of Histology, Université Libre de Bruxelles, Bruxelles, 1070, Belgium
Correspondence: Adèle Ehongo, Ophthalmology Department, Erasmus Hospital, Route de Lennik 808, Brussels, 1070, Belgium, Tel +3225553114, Fax +3225556737, Email [email protected]
Purpose: Myopic eyes combining gamma peripapillary atrophy and peripapillary staphyloma were sorted according to the presence of intrachoroidal cavitation (PICCs) or its absence (combinations). Visual field defects (VFDs) and factors discriminating these groups were analyzed.
Methods: These groups were sorted by optical coherence tomography. VFDs were assessed using the Humphrey® Field Analyzer 3, SITA standard. Ovality index (OI) was the ratio between the shortest and longest diameters of the disc. The proportions of PICCs, lamina cribrosa defects (LCDs) and clusters in each Garway-Heath’s sector (A—F) were analyzed. All variables were compared between PICCs and combinations. A multivariate logistic regression analysis was performed ultimately.
Results: Of the 93 eyes, we obtained, 20 PICCs and 73 combinations. The prevalence of VFDs and LCDs in PICCs were 65% (13/20) and 30% (6/20), respectively. PICCs 85% (17/20) and LCDs 12% (11/93) predominated in sector B (inferotemporal) and clusters 9.7% (9/93) in the corresponding sector. The proportion of VFDs was significantly higher in PICCs than combinations (p < 0.001). In sector B, the proportion of LCDs was significantly higher in PICCs than combinations (p = 0.011). The mean OI was significantly lower (p < 0.001) in PICCs than combinations. Multivariate logistic regression analysis concluded that mean OI (p < 0.001) was the only statistically significant factor discriminating PICCs and combinations.
Conclusion: Mean OI discriminating PICCs from combinations is further evidence of a gradation of structural changes between them. It could be related to the higher proportion of VFDs in PICCs. The predominant distribution of PICCs infero-temporally supports PICC as a cause of uncertainty in glaucoma diagnosis in high myopia. Furthermore, the highest proportion of PICCs and LCDs in this sector highlights its vulnerability to damage in myopic eyes and deserves further investigation as it is also primarily involved in glaucoma.
Keywords: peripapillary intrachoroidal cavitation, visual field defects, peripapillary staphyloma, gamma peripapillary atrophy, ovality index, lamina cribrosa defects, glaucoma, myopic complications
Introduction
Interest in peripapillary intrachoroidal cavitation (PICC) stems from the visual field defects (VFDs) it might induce.1,2 PICC is a yellow-orange lesion, situated at the outer border of the conus1,3 in up to 22% of eyes with high myopia (HM).4 Previously considered intrachoroidal,5 the location of PICC has recently been established at the suprachoroidal level,6,7 thanks to advances in optical coherence tomography (OCT).
Although the pathogenesis of PICC is unclear, it has recently been suggested that gamma peripapillary atrophy (γPPA) and peripapillary staphyloma (PPS) are two critical factors for its presence.7,8 However, less than 25% of eyes combining γPPA and PPS exhibit a PICC.8 Therefore, the factors discriminating eyes combining γPPA and PPS depending on whether PICC is present (PICC-group) or absent (combination-group) still need to be studied.
VFDs are reported in up to 73.3% of PICCs and are similar to those in glaucoma,9 leading to diagnostic uncertainty. They result from the full-thickness defects observed at the PICC-conus junction.6 As these full-thickness defects are not found in all eyes with PICCs,1 other mechanisms of ganglion cells injury are likely at play, warranting further investigation.
Of note, low ovality index (OI), an indicator of optic disc (OD) tilt,10 is related to VFD in highly myopic eyes. A low OI has been disclosed in eyes with PICC8,11 and might be related to some VFDs in PICC. Therefore, if the mean OI in the PICC-group is lower than that in the combination-group, it could lead to a difference in the prevalence of VFD between these groups. This has not yet been analyzed.
Interestingly, it has been suggested that γPPA, PPS, and PICC are all promoted by the traction forces of the optic nerve (ON) sheaths.7,12,13 Additionally, peripapillary deformations were found to be more prevalent in PICC-group than in combination-group,7 reflecting a gradation of structural changes between these groups. Eyes with PICCs might then be more susceptible to these traction forces and VFDs might be more prevalent in PICC-group than in combination-group. The comparison of VFDs between these two groups has not been reported to date.
Furthermore, ON sheaths traction forces have been shown to induce significant shear deformations of the lamina cribrosa (LC) during eye movements,14 which might contribute to the occurrence of LC defects (LCDs) in HM.15 Thus, LCDs and PICCs could coexist in eyes with HM. However, the prevalence of LCDs in highly myopic eyes with PICC is poorly reported.16
Taking into account all these considerations, we therefore aimed to compare the proportions of VFDs between the PICC and combination groups and to analyze factors likely to discriminate between the PICC and combination groups.
Materials and Methods
Study Sample, Investigations
This retrospective monocentric study led in our institution complies with the Declaration of Helsinki and was approved by the ethics committee (A2020/211).
Data were extracted from those of subjects previously evaluated in our study on the OCT analysis of deep peripapillary structures and their implications in the pathogenesis of PICC (P2019/281 and A2019/138, ethics committee Erasme-ULB 021/406).7,8 The majority of them were approached during their routine check. Written informed consent was obtained from all subjects.
In brief, all recruited adult subjects (≥18 years old) underwent a comprehensive ophthalmological evaluation including refractive error (RE), visual acuity (VA, logMAR), pachymetry with the Pentacam® (OCULUS Optikgeräte GmbH, Wetzlar, Germany), axial length (AL) with the IOL master® 700 (Carl Zeiss Meditec AG, Jena, Germany), slit-lamp examination. The other exams as mentioned below.
Visual Field (VF) testing using the Humphrey® Field Analyzer 3 (Carl Zeiss Meditec AG, Jena, Germany) with the SITA standard central 24–2 program.
As we wanted a contactless procedure as much as possible, intraocular pressure (IOP) was measured by air puff (Nidek TONOREF2 RKT 2014, Japan) and rechecked by Goldmann applanation only if >21 mmHg in order not to lose any candidates.
Fundus pictures were obtained with both Clarus® 700 and Visucam® 224 (Carl Zeiss Meditec AG, Jena, Germany, for both devices) non-mydriatic cameras. Visucam® allowed to better appreciate the details of the ON while thanks to Clarus®, we accessed the peripheral fundus without dilation.
Using the Spectralis® OCT model S3300 (Heidelberg Engineering GmbH, Heidelberg, Germany), papillary radial scans were performed with the Glaucoma Premium Edition module. They were completed by vertical and horizontal linear scans of at least 49 slices centered on the OD. For tilted disc (TD), we also performed slices parallel and perpendicular to the main axis of the disc.
OCT Analysis
Of the 48 radial scans provided by our OCT module, twelve spokes were analyzed (one in every four sections, starting from the 12 o’clock position). Using these scans, and based on previously reported criteria, γPPA17 and PPS18,19 were identified; γPPA was the atrophic area between the end of Bruch membrane and the border of the OD17 (Figure 1A). PPS was characterized by a posterior bowing of the sclera around the ON head with the local curvature steeper than that of the adjacent region.18 In addition, the choroid had to show a thinning at the edge of the PPS, followed by a rethickening towards the ON head. The diagnosis of PPS18 (Figure 1B) and PICC5,6 (Figure 2a and b) was refined using linear scans. These were particularly helpful in case of spindlelike TD as the reference points of the radial scans are then disrupted.20
 |
Figure 1 OCT features of gamma peripapillary atrophy and peripapillary staphyloma (PPS). (A) Gamma peripapillary atrophy is the area free of Bruch’s membrane located between the red arrows, extending from the optic nerve edge to the end of Bruch’s membrane. (B) PPS is characterized by a posterior bowing of the sclera around the optic nerve head with a local curvature steeper than that of the adjacent region, with the choroid showing thinning at the edge of the PPS (yellow arrows), followed by a rethickening towards the optic nerve head. |
 |
Figure 2 OCT features of a peripapillary intrachoroidal cavitation (PICC) (first raw) and the stepwise procedure of localization of PICC according to Garway-Heath mapping (second raw). (a) Radial section centered on the optic nerve head. Gamma peripapillary atrophy: between the dashed red arrows. (a-b) The yellow arrows highlight the anterior elevations of the posterior choroidal wall at the edge of a posterior protrusion (blue arrow), hallmark of a peripapillary staphyloma. Red star = PICC. It has the two entities essential to its presence: gamma peripapillary atrophy and peripapillary staphyloma. (b) Linear section at the peripapillary zone along the green arrow in the infrared image. (c) Reading of each in every four OCT sections, starting from the 12 o’clock position. (d) Translation to the six peripapillary sectors (a-f) corresponding to the course of the nerve fiber bundles according to Garway-Heath et al21 (e). The corresponding VF sectors. Adapted from Ophthalmology; 107(10), Garway-Heath DF, Poinoosawmy D, Fitzke FW, Hitchings RA. Mapping the visual field to the optic disc in normal tension glaucoma eyes. Ophthalmology. 1809–15, Copyright 2000, with permission from Elsevier.21 |
Inclusion Criteria
Any variable identified on at least four of the 12 clock-hours positions of the radial scans and confirmed by the interpretation of the linear scans allowed us to sort the eyes into two groups: eyes combining γPPA and PPS with the presence of PICC (PICC-group) and eyes combining γPPA and PPS in the absence of PICC (combination-group). These eyes were included.
Exclusion Criteria
Eyes with poor image quality, history of ocular trauma or posterior segment surgery were excluded.
Based on OCT sorting, eyes with γPPA without PPS, eyes with PPS without γPPA and eyes with none of these entities were excluded. Eyes with doubtful diagnosis for one of these entities and therefore not allowing them to be classified into one or the other group were also excluded.
Based on VF, eyes with >20% fixation loss, >15% false positive, and/or >15% false-negative errors were excluded after a second VF attempt.
Based on IOP, eyes with an IOP >21 mmHg using Goldmann applanation tonometer or with a history of IOP >21 mmHg were excluded.
Based on ophthalmoscopy, eyes with fundus abnormalities other than PICC, potentially responsible for VFDs were excluded.
Assessment of PICCs
The location of PICCs was assessed following Garway-Heath (GH) method.21 Knowing the limits in degrees established by GH, we used the 12 clock-hours division of the radial papillary OCT slices (Figure 2a) to delineate six peripapillary areas (A–F) (Figure 2c and d) corresponding to VF (Figure 2e). When a PICC spanned several sectors, it was scored in each of them. We classified the PICCs into 3 grades according to the extent around the OD or myopic conus as previously indicated:1 grade 1 (less than a semicircle), grade 2 (more than a semicircle but less than three-fourth of a circle), grade 3 (more than three fourths).1 We also looked for full-thickness defects characterized by no retina and retinal pigment epithelium layers at the PICC-conus junction6 (Figure 3).
 |
Figure 3 Illustration of a peripapillary intrachoroidal cavitation (PICC) with a full thickness defect. (A) Infra-red image showing a spindle-like tilted disc (yellow star). The green arrow indicates the location of section (B), along the peripapillary area and through gamma peripapillary atrophy (= conus), a full-thickness defect (white dot) and the PICC (red star). (B) Linear OCT section along the green arrow in the infra-red image. The full-thickness defect (white dot) is identified as an area showing disappearance of the inner layers of the retina at the PICC-conus junction. Gamma peripapillary atrophy (between the red arrows) is the peripapillary zone devoid of Bruch’s membrane. Red arrows = ends of Bruch’s membrane. Red star = PICC. The steep excavation of the conus is emphasized by the curvature of the sclera (S). |
Assessment of the Optic Disc
We used infrared OCT images to assess disc OI, calculated as the ratio between the shortest and longest diameters of the disc, measured using the built-in software provided by Spectralis®. OI, an indicator of OD tilt10 is low when it is ≤0.8.
Using serial OCT slices, LCDs were searched for. An LCD was defined as an irregularity violating the normal U or W shaped contour of the anterior LC surface, of at least 100 µm in diameter and 30 µm in depth as previously defined.22,23 It had to be detected on at least two different OCT scans. Caution was taken not to confuse LCDs with vessel shadows (Figure 4). The distribution and proportions of LCDs on each GH sectors were scored.
 |
Figure 4 Illustration of a lamina cribrosa defect. Highly myopic eye. Refraction: - 8.6 D, Axial Length: 28.34 mm. Adjacent serial OCT sections (A and B) of the optic nerve head illustrating a lamina cribrosa defect (blue arrows). We were careful not to confuse lamina cribrosa defect with shadows (red arrows) of the vessels (red dots). |
VF Assessments
VFDs were assessed according to Anderson criteria.24 The positive rate of each criterion (abnormal clusters – abnormal glaucoma hemifield test (GHT) – pattern standard deviation (PSD) < 5%) was assessed and scored. Abnormal clusters in the pattern deviation plot were defined as 3 or more non-edge points with p < 5% and at least one of them with p < 1% in expected VF location. The distribution of abnormal clusters provided by the VF report and displayed according to GH sectors21 (Figure 2e) was scored and the proportion of abnormal clusters for each sector assessed.
Analysis Procedure
All fundus pictures, OCT features and VF parameters were analyzed by two investigators (EA; DA). They independently recorded their results on a paper chart specially designed for this study and a third investigator (TTW) browsed them looking for discrepancies.
Every mismatch was re-evaluated collegially to keep the most accurate and consensus-based results. When no consensus was reached, the eye was excluded.
Statistical Analyses
Inter-observer agreement was assessed by Kappa coefficients between three observers (EA; DA; YA) for PPS, γPPA and PICC. There was good agreement between graders (Table S1).
Statistical analyses were made using Excel, STATA SE 17, IBM-SPSS V28.0 and MedCalc® V 22.009 (MedCal SoftwareLtd, Ostend, Belgium). The characteristics of the study sample were described using the mean and standard deviation for continuous variables, proportions, and percentages for discrete variables. Student’s or Welch’s t-test were used to compare the means between 2 groups for continuous variables and Chi-squared test or Fisher exact test to compare proportions for discrete variables. A multivariate logistic regression analysis was performed to assess the relative contribution of each variable for discriminating PICC-group and combination-group. All the variables with a statistically significant univariate difference between PICC and combination groups were included into the model. The significance threshold was defined as p <0.05.
Results
We obtained 93 eyes from 70 participants (20 PICCs and 73 combinations), 23 males and 47 females aged between 18 and 83 years (mean age ± standard deviation of 57±19 years). Table 1 shows that there was a statistically significant difference between PICC and combination groups for: refractive error, axial length, mean OI, PSD, mean deviation, and VF index.
 |
Table 1 Characteristics of the Study Sample |
PICCs Analysis and Their Distribution in GH Sectors
Of 20 PICCs included, the proportion based on the extent around the OD or conus was as follows: 80% (16/20) of eyes had grade 1 involvement, 15% (3/20) of eyes had grade 2 involvement and 5% (1/20) of eyes had grade 3 involvement. Of the included PICCs, no full thickness defects were detected in any eye at the PICC-conus junction. Table 2 shows the distribution of the 20 PICCs in each GH sector. The highest prevalence (85%;17/20) of PICC was in the inferotemporal sector (B), followed by the inferonasal (A) sector (70%;14/20), then temporal (C) (35%; 7/20).
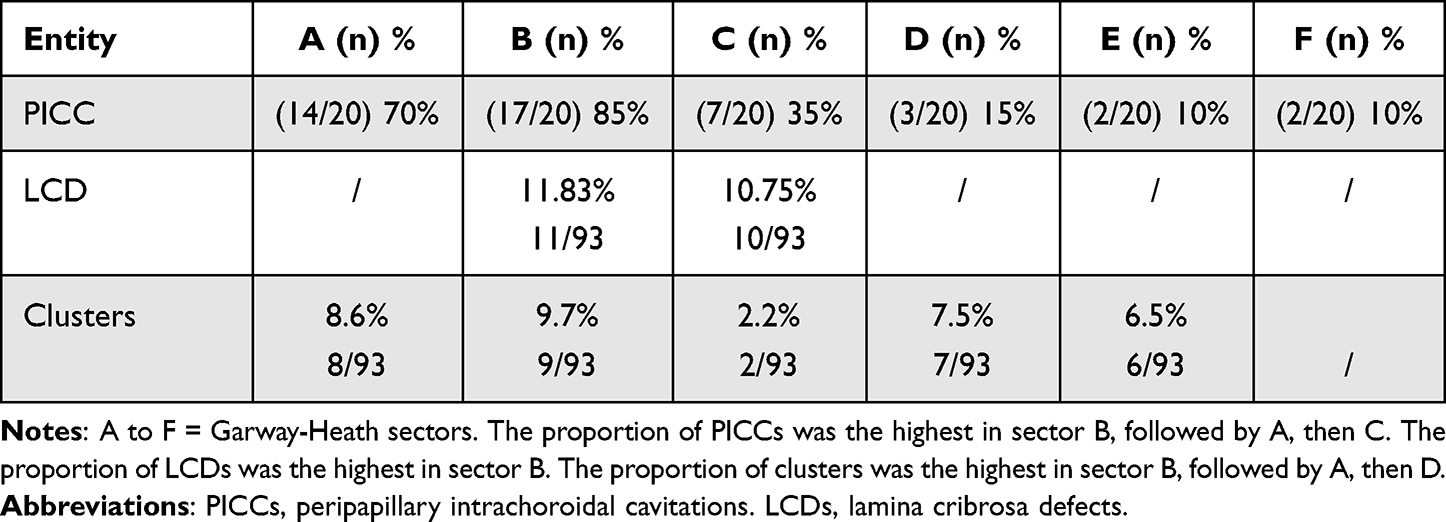 |
Table 2 Distribution of PICCs, LCDs, and Clusters According to Garway-Heath’s Sectors |
Prevalence of LCDs and Their Distribution in GH Sectors
In the whole sample, 21 LCDs were found, and 14 eyes were involved. The prevalence of eyes with LCDs in the whole sample was 15.05% (14/93 of eyes). The prevalence of eyes with LCDs was 30% (6/20) and 10.96% (8/73) in the PICC and combination groups, respectively. The number of LCDs per eye ranged from 0 to 3.
LCDs were found in the inferotemporal (B) and temporal (C) sectors and their highest prevalence (11.83%; 11/93) was in sector B (Table 2).
Visual Field Analysis and Distribution of Abnormal Clusters in GH Sectors
Overall, VFDs were found in 27.96% (26/93) of eyes and respectively in 65% (13/20) of PICCs and 17.81% (13/73) of combinations (Table 3).
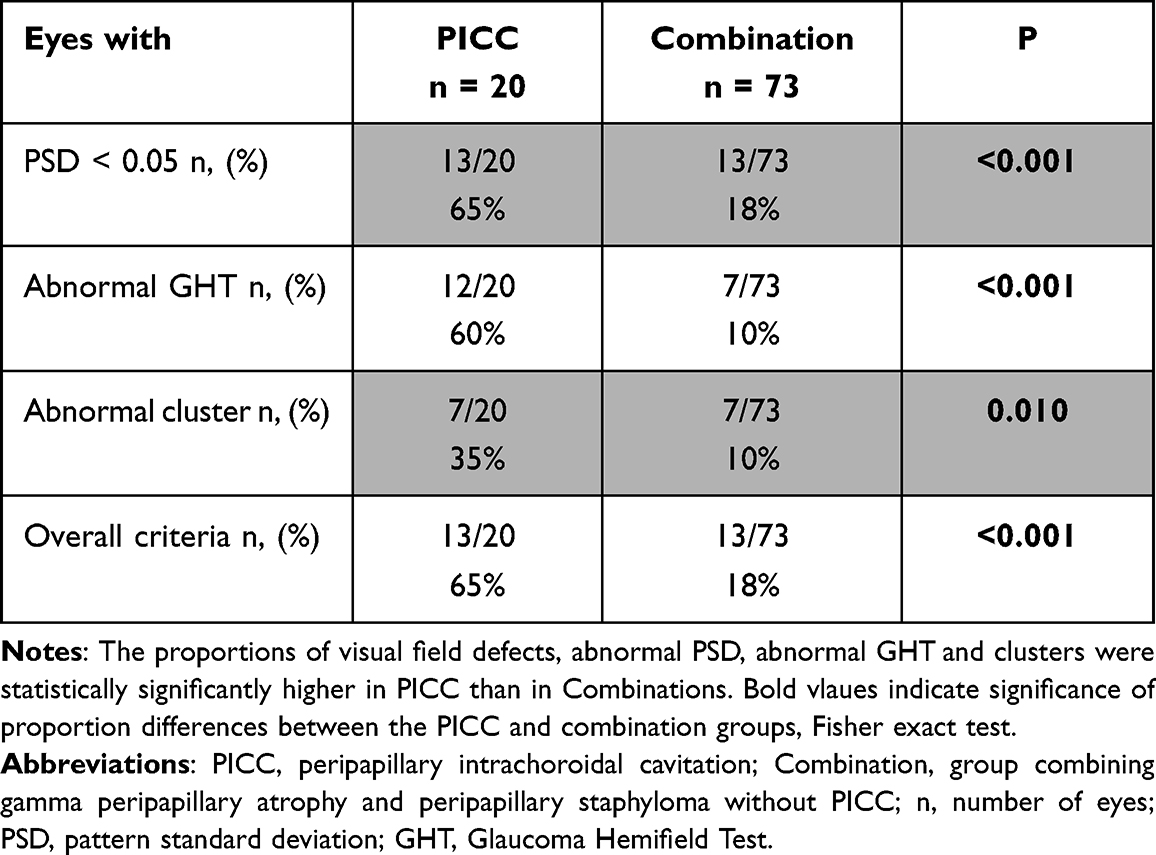 |
Table 3 Comparative Rate of Positivity of Each Anderson Criterion in PICC and Combination Groups |
Anderson’s criteria showed a positivity as follows. PSD <5 %: 27.96% (26/93) of eyes, GHT abnormal: 20.43% (19/93) of eyes, and abnormal clusters: 15.05% (14/93) of eyes.
The prevalence of abnormal clusters was the highest in sector B (9.7%;9/93), followed by sector A (8.6%;8/93) (Table 2).
Figure 5 illustrates a distorted myopic eye combining a PICC (5a and 5b), and an LCD (5c and 5d). The PICC extends from 4 to 8:00 (5e to 5g) and the corresponding VFDs (5h) are in the upper visual field.
 |
Figure 5 Illustration of a case with correspondence between the locations of Peripapillary intrachoroidal cavitation (PICC), lamina cribrosa defect (LCD), and visual fields defects (VFDs). (a, b, f and g) Red star = PICC. (a) Fundus image showing a severely distorted optic nerve head (ONH). The green arrow indicates the location of section (b). PICC is characterized by the yellow circumscribed appearance at the lower edge of the conus. (b). Horizontal section in the peripapillary zone, along the arrow in (a). (c and d) Vertical (c) and horizontal (d) sections through the ONH along the corresponding green arrows, crossing the same LCD (yellow arrows). (e-g) Radial sections showing the extent of the PICC. Reading clockwise. (e) From 9:00 to 3:00, no PICC. f. PICC disclosed at 5:00. (g) PICC disclosed at 8:00. This PICC extends from 4 to 8:00 clockwise, encompassing the inferonasal and inferotemporal sectors. (h) The corresponding visual field with defects mainly in the upper part of visual field. |
Comparative Analyses Between PICC and Combination Groups
The proportion of eyes with LCDs was higher in PICC (30%, 6/20) than in combinations (10.98%, 8/73). But this difference was not statistically significant (p = 0.070).
In sector B, the proportion of LCDs was statistically significantly higher in the PICC-group compared to the combination-group (Table 4).
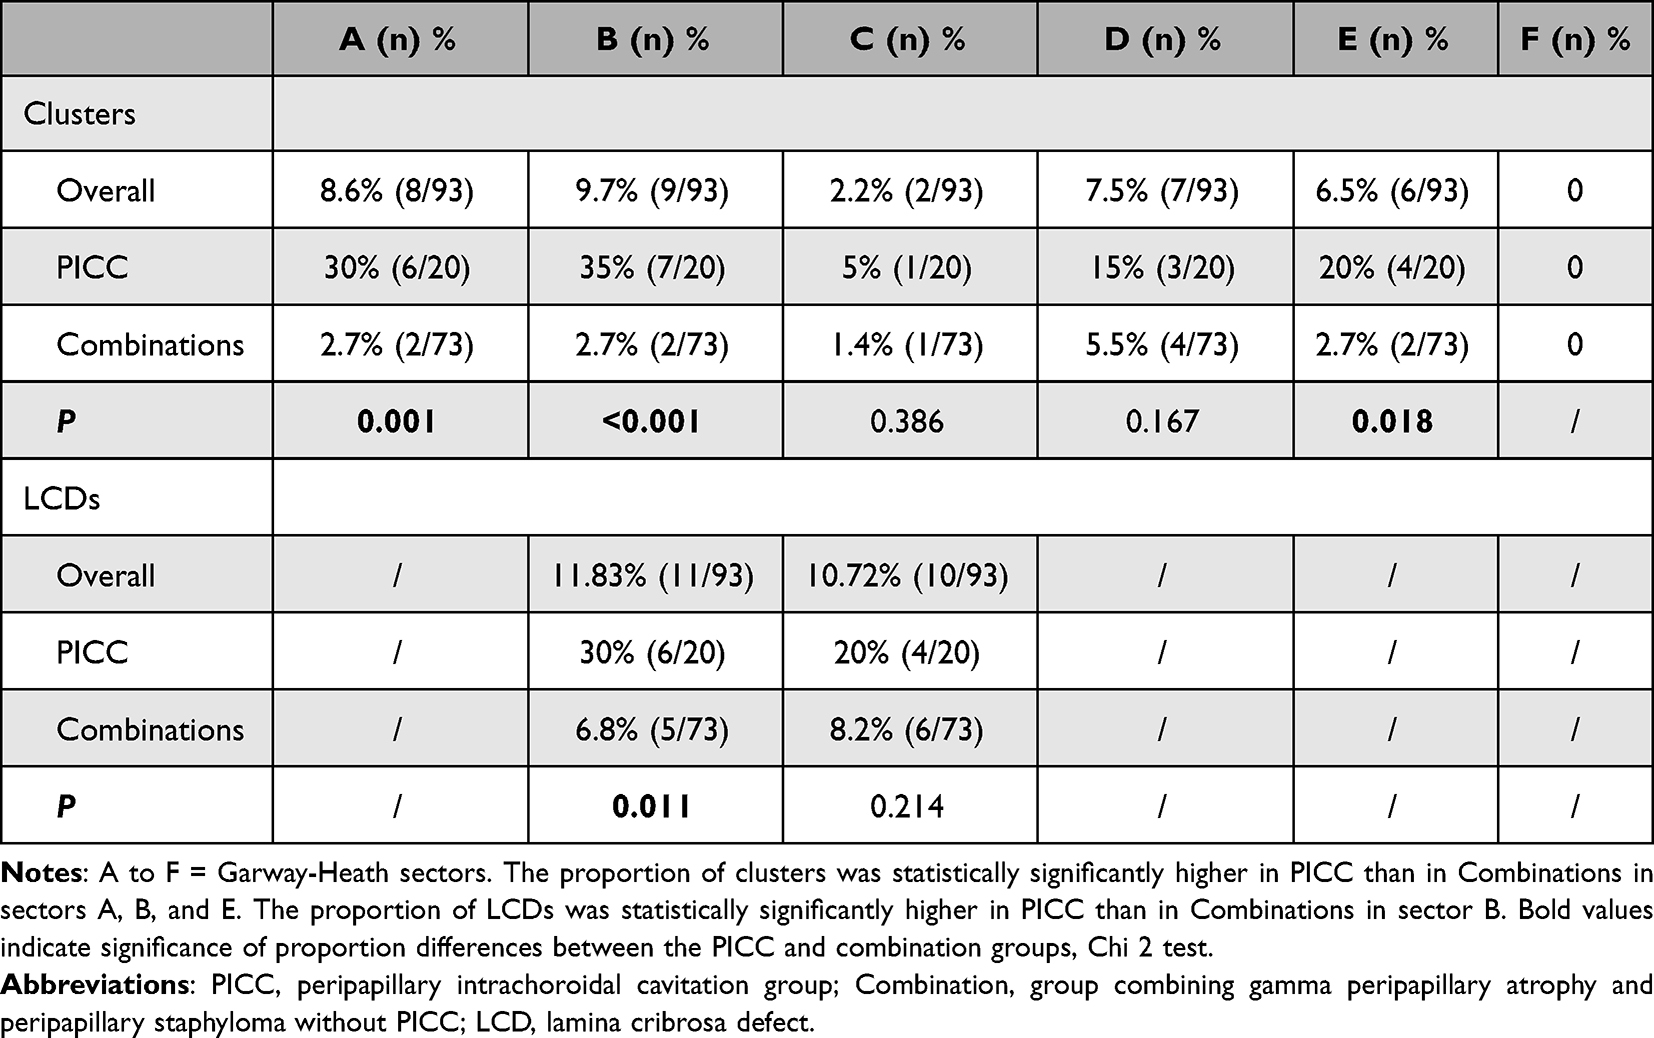 |
Table 4 Comparison of Distribution Sectors of LCDs and Clusters Between PICC and Combination Groups |
The proportion of VFDs was statistically significantly higher in the PICC-group than in the combination-group for all Anderson’s criteria: (p < 0.001) for abnormal PSD and GHT; p = 0.010 for abnormal clusters (Table 3).
The proportion of clusters was statistically significantly higher in GH sectors A, B and E in the PICC-group compared to the combination-group (Table 4).
All the variables with a statistically significant univariate difference between PICC and combination groups (refractive error, axial length, mean OI, PSD, mean deviation, and VF index) were included in a multivariate regression analysis to assess the relative contribution of each of them for discriminating PICC-group and combination-group. The main and only significant variable discriminating PICC-group (0.69±0.04) and combination-group (0.84±0.01) was the mean OI (p < 0.001).
Discussion
The recent dramatic increase in the prevalence of myopia25 may be followed by that of HM. Therefore, clinicians would increasingly face structural and functional complications of HM, including VFDs.
To date, three series including the present study have analyzed VFDs in PICC using Humphrey VF systematically in all included eyes.9,26 Among them, our series managed to compile the largest number of PICCs.9,26 The prevalence of VFDs in PICC (65%) that we observed was between that of Fujimoto et al (54%) and that of Okuma et al (74%).9,26 This discrepancy in prevalence could be related to the grade of the PICC: the more the PICC extends around the OD or the conus, the more likely it is that the eye is affected by VFD.
In this regard, compared to Shimada et al1 who reported 71% VFD in PICC, when analyzing the extent of PICC around the OD or the conus, we found mainly small PICCs (80% vs 64.5%) with grade 1 involvement. The proportion of large PICCs (grades 2 and 3) was lower in our series than in theirs, respectively (15% vs 22.6%) with grade 2 involvement and (5% vs 12.9%) of grade 3 involvement. More recently, Fujimoto26 et al explored the relationship between PICC volume and VFDs. Using a combination of three-dimensional swept source OCT volume rendering and deep learning-based noise reduction, they revealed a correlation between three-dimensional PICC volume and VF sensitivity, supporting our hypothesis. Okuma et al9 did not document the size of PICC while Shimada et al1 did not analyze the correlation between this size and the prevalence of VFD. This correlation could be clinically relevant to discriminate the origin of VFDs in myopic eyes with PICCs.
The reason we found mainly small PICCs might be related to advances in OCT that we used for PICC screening, providing high-resolution images, and allowing detection of small PICCs. Shimada et al1 first identified PICC on fundus and then performed OCT analysis and therefore would have missed small PICCs, because 50% of PICCs detected on OCT are not evident on fundus.27
We aimed to analyze whether the proportion of VFD in eyes belonging to the PICC-group was different from that of the combination-group. Our results showed that the proportion of VFD was statistically significantly higher in the PICC-group than in the combination-group which is unprecedented. This first functional comparison between PICC and combination groups shows that beyond structural deformations,7 the difference between PICC and combination groups extends to function. Comparing myopic eyes with and without PICC, Shimada et al1 found significantly more VFDs in those with PICC. Our results thus underline that, even between PICC-group and the group combining the two critical characteristics for the presence of PICCs (PPS and γPPA),7,8 the clinical implications are quite different.
We found that clusters distributed mainly in GH sectors corresponding spatially to the highest proportion of PICCs (sectors B and A). This is consistent with a previous series.9 Therefore, these VFDs lead to an uncertainty in glaucoma diagnosis, particularly when the PICC is not obvious in the fundus and should prompt to search for PICCs on OCT in highly myopic eyes with VFDs suggestive of glaucoma. The hallmark of glaucoma is the irremediable progression of ON damage with corresponding VFDs, whereas myopic VFDs tend to be nonprogressive. Therefore, the differential diagnosis between VF alterations due to pathologic myopia and early glaucomatous defects is essential to make a timely diagnosis of glaucoma and offer patients appropriate management to preserve their visual function while avoiding overtreating subjects with only myopic VFDs.
We did not find full-thickness defects in eyes with PICC in our series, supporting that the majority of VFDs in PICCs would result from other mechanisms.1 Besides full-thickness defects at the PICC-conus junction,6 damage to the retinal nerve fiber layers crossing the edge of the excavated myopic conus1 or ocular stretching taking place during the process of myopic elongation could account for VFDs in PICC. Also, OD deformations14 and direct scleral compression or stretching at the peripapillary region may lead to VFDs.13 The pathogenesis underpinning the development of nonprogressive glaucomatous VFDs in eyes with PICC remains thus to clarify.
We found 30% of LCDs in the PICC-group. This prevalence is close to that found by Miki et al28 in highly myopic eyes without glaucoma. Investigating whether LCDs were associated with OD morphology in myopic glaucomatous eyes, Kimura et al16 found that PICCs were detected more frequently in eyes with LCDs than those without LCDs. Their results also support the association between myopic deformations and LCDs as they found eyes with LCDs to show a lower OI.16 Furthermore, Sawada et al29 showed that eyes with LCDs and stable VFDs had greater myopic OD deformations.
In our series, the inferotemporal sector (B), which had the highest proportion of PICCs, also compiled the highest proportion of LCDs. In addition, the proportion of LCDs in this sector was statistically significantly higher in the PICC-group than in the combination-group, which is a new finding. This finding highlights the vulnerability of the inferotemporal sector to the promoting forces of LCDs and PICCs. Beyond that, this result suggests that these forces may be more marked in PICC-group than in combination-group. This needs to be confirmed and warrants further investigation.
All variables that were statistically significantly different between PICC and combination groups were included in a logistic multivariate regression analysis which concluded that the mean OI is the only factor discriminating PICC and combination groups. Our results thus revealed the impact of the OI which is systematically highlighted during the analysis of the determinants of PICC: You et al27 performed multivariate regression analysis and showed that in addition to PPS, the mean OI was the only factor associated with PICC; Dai et al11 intra-individually compared the papillae of subjects with unilateral PICC and showed that eyes with PICC had a significantly lower mean OI than those without PICC. Once again, in our inter-group comparison, the OI emerges as the main factor discriminating the PICC-group from the combination-group.
The IO is an indicator of the OD tilt.10 Our results therefore revealed that the OD of eyes with PICC are more tilted than those with combinations. Interestingly, our results highlighted that these 2 groups of eyes that share the similarity of combining the presence of PPS and γPPA nevertheless exhibit a difference in the degree of tilt. This suggests that the mechanisms promoting the appearance of myopic TD could be more marked in eyes with PICCs than eyes with combinations.
It has been suggested that TD results from long-term fixation of intermittent OD deformations induced by traction forces of the ON sheaths on their peripapillary insertion.12 In addition, it has recently been suggested that PICC and PPS arise from these same forces.7,13 Furthermore, peripapillary deformations were observed with a higher prevalence in eyes with PICCs than in eyes with combinations.7 Thus, the promoting forces would lead to more deformations in PICCs than in combinations over time. As our results showed that the PICC and combination groups did not have a statistically significant difference in mean age, the traction forces of the ON sheaths would likely be stronger in the PICC-group, or this group would be more sensitive to these forces. Further studies are warranted to clarify these aspects.
Limitations-Perspectives
First, this was a monocentric and retrospective study. Second, Garway-Heath mapping was developed for the analysis of the correspondence between the location of the VFD and the ON head. Its use that we carried out for the sectoral classification of LCDs and PICCs in order to analyze their correspondence with the location of VFDs could therefore lead to variability. Third, for subjects not followed up in our department, we relied on a single but reliable VF. Fourth, potential IOP peaks were not excluded by a diurnal curve. However, since the study was comparative, this applies to both PICCs and combinations. Ultimately, we lost fifty percent of eyes with PICC after applying the exclusion criteria. These figures should be kept in mind when performing a similar analysis.
Conclusion
The proportion of VFD was significantly higher in the PICC-group than in the combination-group. The OI was the only statistically significant factor discriminating the PICC and combination groups, which could be related to the difference in proportion of VFDs between these groups. We reaffirm that PICC is a cause of uncertainty in glaucoma diagnosis in highly myopic eyes. The highest proportion of PICCs and LCDs in the inferotemporal sector highlights the vulnerability of this sector in myopic eyes. This deserves further investigation as this sector is also primarily involved in glaucoma.
Acknowledgments
The authors are grateful to all the technicians of the department, who contributed to the data acquisition part of this study as well as to all others who provided input during the preparation of the manuscript.
Funding
No funding was received for this research.
Disclosure
The authors report no conflicts of interest in this work.
References
1. Shimada N, Ohno-Matsui K, Yoshida T, et al. Characteristics of peripapillary detachment in pathologic myopia. Arch Ophthalmol. 2006;124(1):46–52. doi:10.1001/archopht.124.1.46
2. Forte R, Pascotto F, Cennamo G, de Crecchio G. Evaluation of peripapillary detachment in pathologic myopia with en face optical coherence tomography. Eye. 2008;22(1):158–161. doi:10.1038/sj.eye.6702666
3. Chen Y, Ma X, Hua R. Multi-modality imaging findings of huge intrachoroidal cavitation and myopic peripapillary sinkhole. BMC Ophthalmol. 2018;18(24). doi:10.1186/s12886-018-0681-x
4. Choudhury F, Meuer SM, Klein R; Chinese American Eye Study Group, et al. Prevalence and Characteristics of Myopic Degeneration in an Adult Chinese American Population: the Chinese American Eye Study. Am J Ophthalmol. 2018;187:34–42. doi:10.1016/j.ajo.2017.12.010
5. Toranzo J, Cohen SY, Erginay A, Gaudric A. Peripapillary intrachoroidal cavitation in myopia. Am J Ophthalmol. 2005;140(4):731–732. doi:10.1016/j.ajo.2005.03.063
6. Spaide RF, Akiba M, Ohno-Matsui K. Evaluation of peripapillary intrachoroidal cavitation with swept source and enhanced depth imaging optical coherence tomography. Retina. 2012;32(6):1037–1044. doi:10.1097/IAE.0b013e318242b9c0
7. Ehongo A, Bacq N, Kisma N, et al. Analysis of Peripapillary Intrachoroidal Cavitation and Myopic Peripapillary Distortions in Polar Regions by Optical Coherence Tomography. Clin Ophthalmol. 2022;16:2617–2629. doi:10.2147/OPTH.S376597
8. Ehongo A, Hasnaoui Z, Kisma N, et al. Peripapillary Intrachoroidal Cavitation at the crossroads of peripapillary myopic changes. Int J Ophthalmol. 2023.
9. Okuma S, Mizoue S, Ohashi Y. Visual field defects and changes in macular retinal ganglion cell complex thickness in eyes with intrachoroidal cavitation are similar to those in early glaucoma. Clin Ophthalmol. 2016;10:1217–1222. doi:10.2147/OPTH.S102130
10. Tay E, Seah SK, Chan SP, et al. Optic Disk Ovality as an Index of Tilt and Its Relationship to Myopia and Perimetry. Am J Ophthalmol. 2005;139(2):247–252. doi:10.1016/j.ajo.2004.08.076
11. Dai Y, Jonas JB, Ling Z, Wang X, Sun X. Unilateral peripapillary intrachoroidal cavitation and optic disk rotation. Retina. 2015;35(4):655–659. doi:10.1097/IAE.0000000000000358
12. Chang MY, Shin A, Park J, et al. Deformation of Optic Nerve Head and Peripapillary Tissues by Horizontal Duction. Am J Ophthalmol. 2017;174:85–94. doi:10.1016/j.ajo.2016.10.001
13. Wang X, Rumpel H, Lim WE, et al. Finite Element Analysis Predicts Large Optic Nerve Head Strains During Horizontal Eye Movements. Invest Ophthalmol Vis Sci. 2016;57(6):2452–2462. doi:10.1167/iovs.15-18986
14. Wang X, Beotra MR, Tun TA, et al. In Vivo 3-Dimensional Strain Mapping Confirms Large Optic Nerve Head Deformations Following Horizontal Eye Movements. Invest Ophthalmol Vis Sci. 2016;57(13):5825–5833. doi:10.1167/iovs.16-20560
15. Ohno-Matsui K, Akiba M, Moriyama M, et al. Acquired optic nerve and peripapillary pits in pathologic myopia. Ophthalmology. 2012;119(8):1685–1692. doi:10.1016/j.ophtha.2012.01.047
16. Kimura Y, Akagi T, Hangai M, et al. Lamina cribrosa defects and optic disc morphology in primary open angle glaucoma with high myopia. PLoS One. 2014;9(12):e115313. doi:10.1371/journal.pone.0115313
17. Vianna JR, Malik R, Danthurebandara VM, et al. Beta and Gamma Peripapillary Atrophy in Myopic Eyes with and Without Glaucoma. Invest Ophthalmol Vis Sci. 2016;57(7):3103–3111. doi:10.1167/iovs.16-19646
18. Shinohara K, Moriyama M, Shimada N, Yoshida T, Ohno-Matsui K. Characteristics of Peripapillary Staphylomas Associated with High Myopia Determined by Swept-Source Optical Coherence Tomography. Am J Ophthalmol. 2016;169:138–144. doi:10.1016/j.ajo.2016.06.033
19. Tanaka N, Shinohara K, Yokoi T, et al. Posterior staphylomas and scleral curvature in highly myopic children and adolescents investigated by ultra-widefield optical coherence tomography. PLoS One. 2019;14(6):e0218107. doi:10.1371/journal.pone.0218107
20. Nakanishi H, Suda K, Yoshikawa M, et al. Association of Bruch’s membrane opening and optic disc morphology to axial length and visual field defects in eyes with primary open-angle glaucoma. Graefes Arch Clin Exp Ophthalmol. 2018;256(3):599–610. doi:10.1007/s00417-017-3874-8
21. Garway-Heath DF, Poinoosawmy D, Fitzke FW, Hitchings RA. Mapping the visual field to the optic disc in normal tension glaucoma eyes. Ophthalmology. 2000;107(10):1809–1815. doi:10.1016/s0161-6420(00)00284-0
22. Sawada Y, Araie M, Ishikawa M, Yoshitomi T. Multiple Temporal Lamina Cribrosa Defects in Myopic Eyes with Glaucoma and Their Association with Visual Field Defects. Ophthalmology. 2017;124(11):1600–1611. doi:10.1016/j.ophtha.2017.04.027
23. Tatham AJ, Miki A, Weinreb RN, Zangwill LM, Medeiros FA. Defects of the lamina cribrosa in eyes with localized retinal nerve fiber layer loss. Ophthalmology. 2014;121(1):110–118. doi:10.1016/j.ophtha.2013.08.018
24. Hodapp E, Parrish RK II, Anderson DR. Clinical Decisions in Glaucoma. St Louis: The CV Mosby Co; 1993:52–61.
25. Holden BA, Fricke TR, Wilson DA, et al. Global Prevalence of Myopia and High Myopia and Temporal Trends from 2000 through 2050. Ophthalmology. 2016;123(5):1036–1042. doi:10.1016/j.ophtha.2016.01.006
26. Fujimoto S, Miki A, Maruyama K, et al. Three-Dimensional Volume Calculation of Intrachoroidal Cavitation Using Deep-Learning-Based Noise Reduction of Optical Coherence Tomography. Transl Vis Sci Technol. 2022;11(7):1. doi:10.1167/tvst.11.7.1
27. You QS, Peng XY, Chen CX, Xu L, Jonas JB. Peripapillary intrachoroidal cavitations. The Beijing eye study. PLoS One. 2013;8(10):e78743. doi:10.1371/journal.pone.0078743
28. Miki A, Ikuno Y, Asai T, Usui S, Nishida K. Defects of the Lamina Cribrosa in High Myopia and Glaucoma. PLoS One. 2015;10(9):e0137909. doi:10.1371/journal.pone.0137909
29. Sawada Y, Araie M, Kasuga H, et al. Focal Lamina Cribrosa Defect in Myopic Eyes with Nonprogressive Glaucomatous Visual Field Defect. Am J Ophthalmol. 2018;190:34–49. doi:10.1016/j.ajo.2018.03.018
 © 2023 The Author(s). This work is published and licensed by Dove Medical Press Limited. The
full terms of this license are available at https://www.dovepress.com/terms
and incorporate the Creative Commons Attribution
- Non Commercial (unported, 3.0) License.
By accessing the work you hereby accept the Terms. Non-commercial uses of the work are permitted
without any further permission from Dove Medical Press Limited, provided the work is properly
attributed. For permission for commercial use of this work, please see paragraphs 4.2 and 5 of our Terms.
© 2023 The Author(s). This work is published and licensed by Dove Medical Press Limited. The
full terms of this license are available at https://www.dovepress.com/terms
and incorporate the Creative Commons Attribution
- Non Commercial (unported, 3.0) License.
By accessing the work you hereby accept the Terms. Non-commercial uses of the work are permitted
without any further permission from Dove Medical Press Limited, provided the work is properly
attributed. For permission for commercial use of this work, please see paragraphs 4.2 and 5 of our Terms.
Recommended articles
Analysis of Peripapillary Intrachoroidal Cavitation and Myopic Peripapillary Distortions in Polar Regions by Optical Coherence Tomography
Ehongo A, Bacq N, Kisma N, Dugauquier A, Alaoui Mhammedi Y, Coppens K, Bremer F, Leroy K
Clinical Ophthalmology 2022, 16:2617-2629
Published Date: 13 August 2022