")
Back to Journals » International Journal of General Medicine » Volume 16
Musculoskeletal Ultrasound for the Diagnosis of Plantar Fasciitis: An Accuracy and Diagnostic Yield Study
Authors Wang X, Xu L, Hu X, Zhao H, Yin J
Received 1 September 2023
Accepted for publication 16 October 2023
Published 25 October 2023 Volume 2023:16 Pages 4765—4771
DOI https://doi.org/10.2147/IJGM.S434182
Checked for plagiarism Yes
Review by Single anonymous peer review
Peer reviewer comments 2
Editor who approved publication: Prof. Dr. Luca Testarelli
Xuan Wang,1,2 Lei Xu,3 Xinglu Hu,4 Hongmou Zhao,2 Jichao Yin1
1First Clinical Medical College, Shaanxi University of Chinese Medicine, Xianyang, People’s Republic of China; 2Foot and Ankle Surgery Department, Honghui Hospital of Xi’an Jiaotong University, Xi’an, People’s Republic of China; 3Functional Department, Xi’an Hospital of Traditional Chinese Medicine, Xi’an, People’s Republic of China; 4Spine Surgery Department, Xi’an Hospital of Traditional Chinese Medicine, Xi’an, People’s Republic of China
Correspondence: Jichao Yin; Hongmou Zhao, Email [email protected]; [email protected]
Objective: To evaluate the accuracy of musculoskeletal ultrasound measurement of plantar fascia thickness and shear wave elastography (SWE) calculation of Young’s modulus in the diagnosis of plantar fasciitis (PFis), and to explore whether it will have any impact on clinical decision-making, rather than just using established diagnostic methods of clinical symptoms and signs.
Methods: A diagnostic single-center study was conducted in 60 patients with PFis and 64 patients with other types of heel pain. The sensitivity and specificity of musculoskeletal ultrasound in the diagnosis of PFis were calculated according to the diagnostic criteria for PFis recommended by the Clinical Practice Guide for PFis of the American Physical Therapy Association (APTA) Orthopaedic Branch. The analysis of the receiver operating characteristic curve of the subjects was used to study the accuracy of the diagnosis of PFis by two indicators alone and two indicators jointly.
Results: The thickness of plantar fascia measured by musculoskeletal ultrasound and the area under the curve (AUCs) calculated by shear wave elastography for diagnosing PFis were 0.925 and 0.917, respectively, and the optimal cutoff values were 3.15 mm (sensitivity: 100.0%, specificity: 81.3%) and 63.24 kPa (sensitivity: 78.3%, specificity: 92.2%), respectively. The area under the curve (AUCs) for the combined diagnosis of the two is 0.973 (sensitivity: 93.3%, specificity: 93.8%).
Conclusion: The thickness of plantar fascia measured by musculoskeletal ultrasound and Young’s modulus calculated by SWE have high accuracy in diagnosing PFis, and the combined diagnosis of the two can improve the diagnostic accuracy of patients with PFis.
Keywords: plantar fasciitis, shear wave elastography, musculoskeletal ultrasound, diagnosis, accuracy
Introduction
PFis is a kind of disease that causes repeated micro trauma due to biomechanical overuse of the plantar fascia, which leads to degeneration of the plantar fascia and pain in the patient’s foot.1 At present, the diagnostic method of PFis is mainly clinical diagnosis. Imaging examination can confirm or exclude other causes of heel pain,2,3 but imaging, especially ultrasonic diagnosis, lacks evidence. Therefore, there is an urgent need for effective imaging indicators to diagnose PFis.
Musculoskeletal ultrasound examination, as a safe, efficient, and low-cost examination method, is increasingly being applied to the diagnosis of orthopedic diseases.4 The current understanding of PFis by ultrasound includes hypoechoic areas within the fascia, fluid accumulation around the fascia, and plantar fascia thickening.1 Previous studies by some scholars have suggested that plantar fascia thickness >4mm is considered abnormal.5 However, in PFis patients, ultrasound may not always observe this phenomenon.6,7 SWE can provide changes in tissue elasticity indicators, and this technology has developed rapidly and is increasingly being used for evaluating the elasticity of musculoskeletal tissue.8 SWE can calculate the Young’s modulus of tissues, which can provide information on elasticity and stiffness. Its clinical application has been widely recognized.9,10
The purpose of this study was to evaluate the accuracy of musculoskeletal ultrasound measurement of plantar fascia thickness and SWE calculation of Young’s modulus in the diagnosis of Plantar fasciitis in an extensive prospective study.
Materials and Methods
This study was a single center prospective study. This study was conducted according to the ethical principles of the Declaration of Helsinki and approved by the Medical Research Ethics Committee of First Clinical Medical College, Shaanxi University of Chinese Medicine (NO: XAZYYLS2019-26), and all enrolled members had informed consent.
Study Design and Objects
We included heel pain patients aged ≥18 y who visited our outpatient clinic from January 2023 to May 2023. We excluded patients with foot injuries, previous foot surgeries, and treatment within 3 months (such as local injection, shock wave therapy, stretching, local drug therapy, etc.).
Two experienced clinicians divided the patients into PFis patients group and non-PFis patients group according to the following diagnostic criteria for Plantar fasciitis of the American Physical Therapy Association (APTA) Orthopaedic Branch.11 Diagnostic criteria: (1) Pain in the medial sole and heel of the foot: most pronounced in the initial steps after a period of inactivity, but also worsens after prolonged weight bearing; (2) Heel pain caused by recent increase in weight-bearing activities; (3) Pain during palpation and compression of the proximal plantar fascia; (4) Limited range of motion in active and passive ankle dorsiflexion; (5) Windlass test positive; (6) Tarsal tunnel test negative, patients were divided into PFis patients group and non-PFis patients group. Subsequently, ultrasound physicians performed musculoskeletal ultrasound examinations on both groups of patients.
Measurement of Plantar Fascia Thickness and Young’s Modulus
Using an ultrasound diagnostic instrument (GE LOGIQ E9) with a probe frequency range of 7–15 MHz for examination. Two professional technicians with over 5 years of ultrasound work experience will conduct the examination separately, and the two inspectors are unaware of each other’s examination results. Measurement position: at the insertion point of the plantar fascia and calcaneus. During the examination, instruct the subject to lie prone, expose the soles of the feet, keep the ankle joint in a neutral position, and ensure that the tested area is exposed under the probe. Perform a two-dimensional ultrasound examination first and measure the thickness of the plantar fascia. Enable SWE mode, adjust the size and depth of the measured target area appropriately, freeze the image after it stabilizes, activate the elastic function provided by the instrument, measure the Young’s modulus value of the plantar fascia, and repeat the measurement three times to calculate the average value.
Accuracy of Musculoskeletal Ultrasound in the Diagnosis of Plantar Fasciitis
We evaluated the accuracy of detecting PFis using the receiver operating characteristic curves (ROCs). In addition, we calculated the area under the curves (AUCs) to compare the accuracy of plantar fascia thickness and Young’s modulus in diagnosing PFis.
Relationships Between the Visual Analog Scale for Pain and Plantar Fascia Thickness or Young’s Modulus
Pain assessment was assessed using the visual analog scale (VAS) for pain (with 0 indicating no pain and 10, the worst pain that the patient can imagine). And we evaluated the relationship between VAS for pain and plantar fascia thickness or Young’s modulus.
Statistical Analysis
Using SPSS 22.0 software, a homogeneity of variance test was conducted on the continuous variables of two groups of patients. Chi-squared test was used to compare the statistical differences between the two groups. The age, height, weight, plantar fascia thickness, and Young’s modulus of the two groups of patients were compared using independent sample T-tests. The working characteristic curve of the subject is used to determine the rationality of the diagnosis. Youden’s index is used to determine the critical value of plantar fascia thickness and Young’s modulus that may have diagnostic value. To investigate the relationship between VAS for pain and plantar fascia thickness or Young’s modulus, we used Pearson correlation analysis. The difference of P<0.05 is considered statistically significant.
Power Analysis
The effect size for the difference in the plantar fascia thickness between the PFis and non-PFis groups was 2.069, which is calculated using the means and standard deviations of plantar fascia thickness in both groups (4.05 ± 0.74 degrees and 2.61 ± 0.64 degrees in both groups, respectively). The effect size of 2.069 indicated that a minimum sample size of 5 in each group would be required to detect the difference with 80% power at a 5% significance level. Similarly, the effect size for the difference in the plantar fascia thickness between the PFis and non-PFis groups was 1.055, which is calculated using the means and standard deviations of Young’s modulus in both groups (55.92 ± 11.13 degrees and 100.29 ± 58.44 degrees in both groups, respectively). The effect size of 1.055 indicated that a minimum sample size of 17 in each group would be required to detect the difference with 80% power at a 5% significance level. Therefore, the sample size in our study is sufficient to demonstrate the existence of such differences.
Results
The Number of Patients and Patients’ Characteristics
We screened 167 patients with heel pain, of which 43 were excluded because they met the exclusion criteria, and ultimately included 124 patients with heel pain. According to the clinical diagnostic criteria, 60 patients were diagnosed as PFis, 64 patients were diagnosed as non PFis, and all patients had unilateral heel pain (Figure 1). And the diagnostic grouping results of the two physicians are consistent. There was no statistically significant difference in gender, age, weight, and height between the two groups (P>0.05), indicating comparability (Table 1).
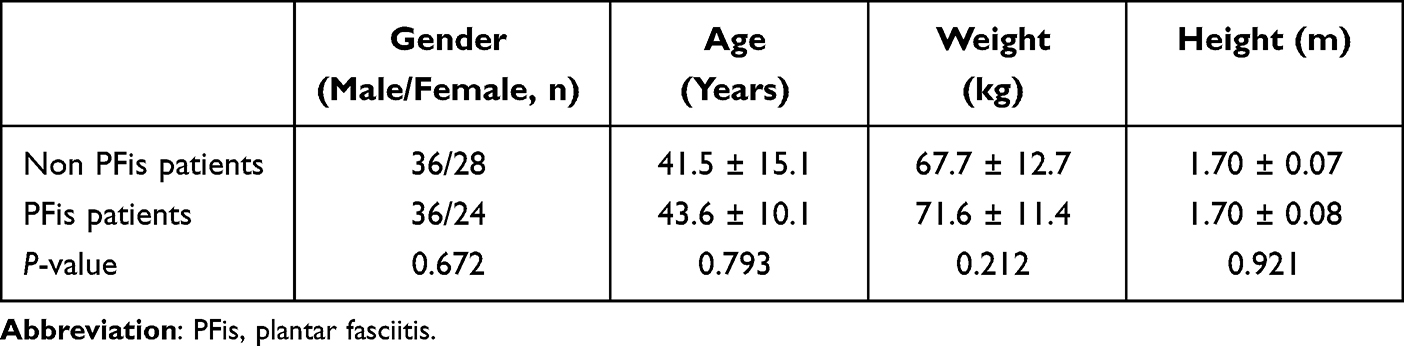 |
Table 1 Characteristics of Patients with Heel Pain |
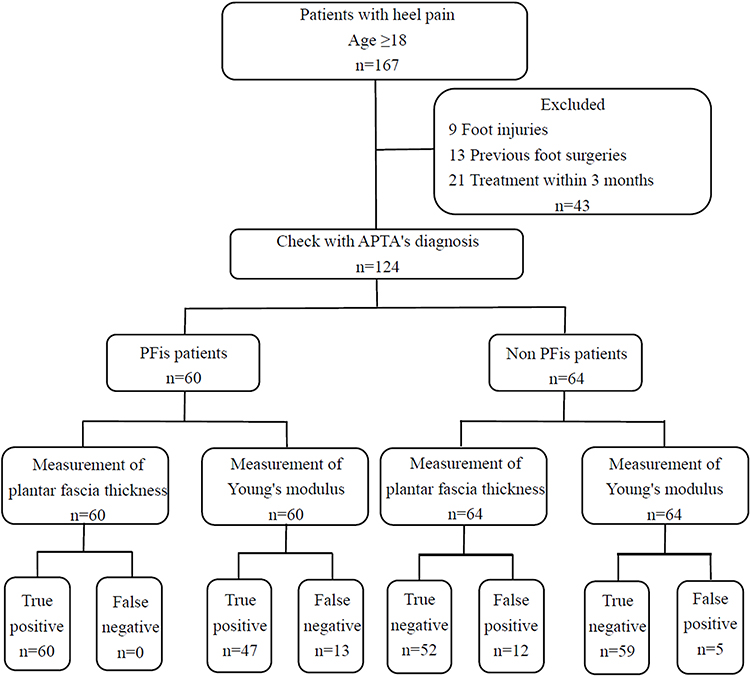 |
Figure 1 Patient flow. Abbreviations: APTA, American Physical Therapy Association; PFis, plantar fasciitis. |
Comparison of Plantar Fascia Thickness and Young’s Modulus Between the PFis and Non PFis Patient Groups
Compared with the non-PFis group, the PFis group has a significantly larger plantar fascia thickness and a significantly smaller Young’s modulus, with statistically significant differences (Table 2). The consistency between the plantar fascia thickness and Young’s modulus measured by two ultrasound physicians is high, as shown in Table 3.
 |
Table 2 Comparison of Plantar Fascia Thickness and Young’s Modulus Between Two Groups of Patients |
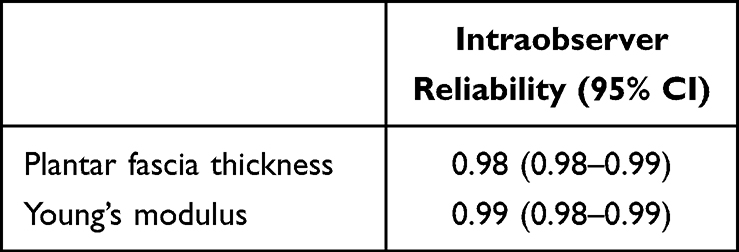 |
Table 3 Intraobserver Reliability of Ultrasound Examination. CI, Confidence Interval |
Accuracy of Diagnosis of Plantar Fasciitis
In the diagnosis of various indicators, the optimal cutoff value, area under the curve, sensitivity, and specificity of the plantar fascia thickness measurement method are 3.15, 0.925, 100% and 81.3% (95% CI: 0.877–0.973), respectively. The optimal cutoff value, area under curve, sensitivity, and specificity of the plantar fascia Young’s modulus method are 63.24, 0.917, 78.3% and 92.2% (95% CI: 0.871–0.963), respectively. The area under the curve, sensitivity, and specificity for the combined diagnosis of the two were 0.973, 93.3%, and 93.8% (95% CI: 0.947–1.000), respectively (Table 4). The receiver operating characteristic curves are shown in Figure 2.
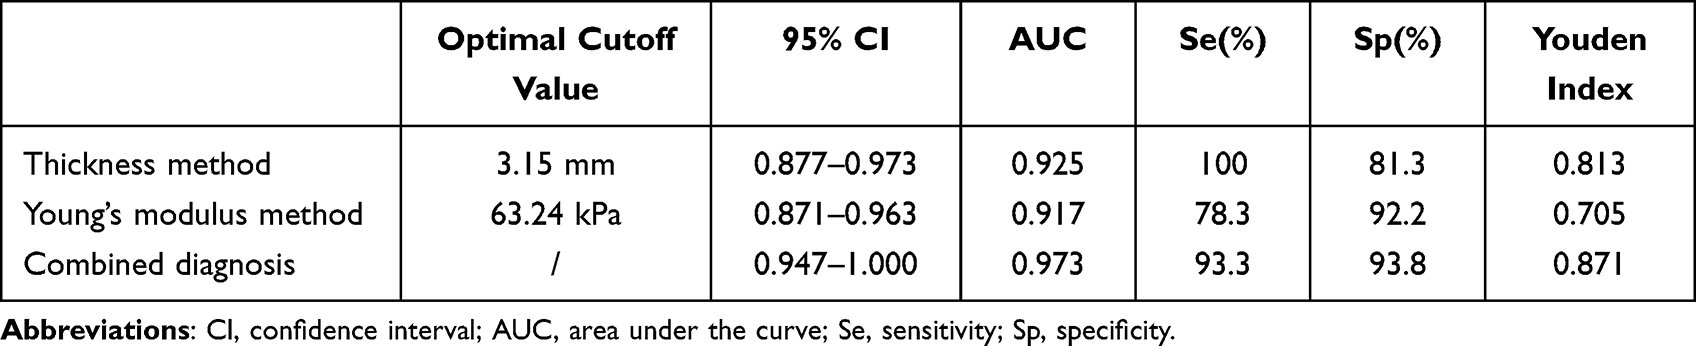 |
Table 4 The Accuracy of Diagnosing Plantar Fasciitis Based on Musculoskeletal Ultrasound |
 |
Figure 2 Receiver-operating characteristic curves in the non plantar fasciitis and plantar fasciitis groups. |
Relationships Between Visual Analog Scale for Pain and Plantar Fascia Thickness or Young’s Modulus
The results of the Pearson correlation analysis are shown in Table 5. VAS for pain is significantly correlated with plantar fascia thickness and Young’s modulus. And VAS for pain increases with the increase of plantar fascia thickness. On the contrary, vas decreases with the increase of Young’s modulus.
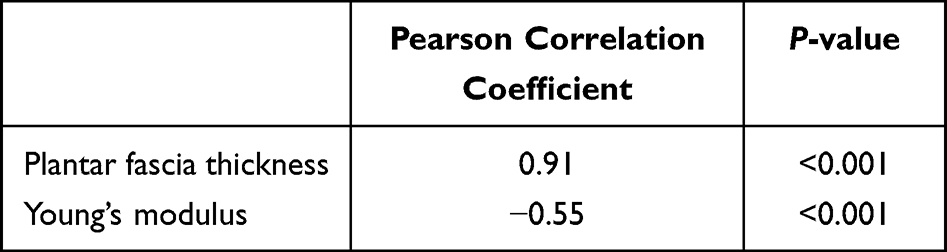 |
Table 5 Pearson Correlation Analysis Between Vas and Plantar Fascia Thickness or Young’s Modulus |
Discussion
PFis is a chronic disease characterized by pain in the anterior medial aspect of the calcaneus during morning or rest weight-bearing, exacerbated by palpation of the anterior medial aspect of the calcaneus and passive dorsiflexion of the first toe.11 At present, the diagnosis of Plantar fasciitis is mainly based on clinical symptoms and physical examination. Imaging examination is usually introduced as a differential diagnosis, and quantitative indicators, especially diagnostic indicators, are relatively lacking. Ultrasound technology can provide tissue biological information and is increasingly being applied in the diagnosis of PF with advantages such as objectivity, economy, and real-time.
The normal plantar fascia is a dense and tough tissue that contains a large amount of collagen fibers.12 Its function is to support the arch of the foot and is a fibrous aponeurosis. The ultrasound characteristics of PFis mainly include thickening of the fascia and decreased echo. However, there are many factors that affect the echo of the plantar fascia, including factors such as excessively keratinized skin that can easily cause ultrasound attenuation. Therefore, current research suggests that the thickening of the plantar fascia under ultrasound examination has important value in the diagnosis of PF.13 The thickness of the normal plantar fascia is approximately 2.20–2.50 mm, and previous studies have suggested that it is abnormal when it thickens to greater than 4.0 mm.14 However, in our previous clinical observations, the thickness of the plantar fascia in many patients with PFis did not reach 4.00mm. In this study, the plantar fascia thickness of the PFis group was significantly greater than that of the normal, and significantly thicker than that of the non-PFis group (p < 0.001). The optimal cutoff value of the plantar fascia thickness calculated by the receiver operating characteristic was 3.15 mm (sensitivity: 100.0%, specificity: 81.3%), and the area under the curve was 0.925. There is a certain difference between the optimal cutoff value and previous studies, which may be due to differences in physical factors between the local population and the previous study population. However, this result shows that ultrasound measurement of plantar fascia thickness has good diagnostic accuracy and value, and we need to consider the lower plantar fascia thickness to diagnose Plantar fasciitis in this area.
The hardness of the plantar fascia can reflect its biomechanical characteristics, and to some extent, it can also further understand the functional characteristics of the ankle. The decrease in muscle strength in the ankle region leads to an increase in local mechanical stress, thickening and fibrosis of the plantar fascia. Under SWE, the manifestation is a decrease in elasticity, which may be due to a decrease in fibrin content in the plantar fascia and hypertrophy of fibroblasts. Many studies have confirmed the application value of SWE in soft tissues, ligaments, and tendons.15–20 Alviti et al21 found that the plantar fascia, which reflects pain, is less elastic and softer. Due to the difficulty in objectively quantifying the hardness of the plantar fascia in patients with PFis through methods such as palpation and physical examination, objective indicators are needed to provide a basis for evaluating the condition of the plantar fascia. In this study, the Young’s modulus of the plantar fascia in the PFis group was significantly lower than that in the non-PFis group (p < 0.001), indicating that the plantar fascia in the diseased group was softer, which is consistent with previous studies. The optimal cutoff value of Young’s modulus calculated by receiver operating characteristic is 63.24 kPa (sensitivity: 78.3%, specificity: 92.2%), and the area under the curve was 0.917. This result shows that the Young’s modulus calculated by shear wave elastography has good diagnostic accuracy and value.
At the same time, when the plantar fascia thickness measurement method and the Young’s modulus method are combined for diagnosis, the area under the curve is 0.973 (sensitivity: 93.3%, specificity: 93.8%), and the diagnostic accuracy is higher than when the two methods are diagnosed separately.
The Pearson correlation analysis of this study shows that there is a strong correlation between the patient’s VAS for pain and plantar fascia thickness and Young’s modulus, and there is a certain linear relationship. This result suggests that the plantar fascia thickness and Young’s modulus of the patient may have a certain impact on the severity of the patient’s symptoms. This suggests that in clinical work, we can quantify these indicators to choose whether to take active intervention measures for patients.
There are several limitations worth considering in the research. Firstly, this experiment used a small sample size, single-center study. Secondly, we could not examine the etiologies of PFis.
Conclusions
This study showed that the method of measuring the thickness of plantar fascia by ultrasound and the Young’s modulus calculated by shear wave elastography has a high diagnostic value for PFis, and the combined diagnosis of the two is more accurate than the separate diagnosis of the two.
Disclosure
The authors report no conflicts of interest in this work.
References
1. Trojian T, Tucker AK. Plantar Fasciitis. Am Fam Physician. 2019;99(12):744–750.
2. Luffy L, Grosel J, Thomas R, So E. Plantar fasciitis: a review of treatments. JAAPA. 2018;31(1):20–24. doi:10.1097/01.JAA.0000527695.76041.99
3. Muth CC. Plantar Fasciitis. JAMA. 2017;318(4):400. doi:10.1001/jama.2017.5806
4. Innes S, Jackson J. Musculoskeletal ultrasound imaging - an exploration of physiotherapists’ interests and use in practice. Musculoskelet Sci Pract. 2019;44:102068. doi:10.1016/j.msksp.2019.102068
5. Radwan A, Wyland M, Applequist L, et al. Ultrasonography, an effective tool in diagnosing plantar fasciitis: a systematic review of diagnostic trials. Int J Sports Phys Ther. 2016;11(5):663–671.
6. Tsai WC, Chiu MF, Wang CL, Tang FT, Wong MK. Ultrasound evaluation of plantar fasciitis. Scand J Rheumatol. 2000;29(4):255–259. doi:10.1080/030097400750041415
7. McMillan AM, Landorf KB, Barrett JT, Menz HB, Bird AR. Diagnostic imaging for chronic plantar heel pain: a systematic review and meta-analysis. J Foot Ankle Res. 2009;2(1):32. doi:10.1186/1757-1146-2-32
8. Prado-Costa R, Rebelo J, Monteiro-Barroso J, Preto AS. Ultrasound elastography: compression elastography and shear-wave elastography in the assessment of tendon injury. Insights Imaging. 2018;9(5):791–814. doi:10.1007/s13244-018-0642-1
9. Piskin FC, Yavuz S, Kose S, et al. A comparative study of the pancreas in pediatric patients with cystic fibrosis and healthy children using two-dimensional shear wave elastography. J Ultrasound. 2020;23(4):535–542. doi:10.1007/s40477-020-00432-3
10. Saftoiu A, Gilja OH, Sidhu PS, et al. The EFSUMB guidelines and recommendations for the clinical practice of elastography in non-hepatic applications: update 2018. Ultraschall Med. 2019;40:425–453. doi:10.1055/a-0838-9937
11. Martin RL, Davenport TE, Reischl SF, et al. Heel pain-plantar fasciitis: revision 2014. J Orthop Sports Phys Ther. 2014;44(11):A1–33. doi:10.2519/jospt.2014.0303
12. Hahn S, Lee YH, Lee SH, Suh JS. Value of the strain ratio on ultrasonic elastography for differentiation of benign and malignant soft tissue tumors. J Ultrasound Med. 2017;36(1):121–127. doi:10.7863/ultra.16.01054
13. Aggarwal P, Jirankali V, Garg SK. Evaluation of plantar fascia using high-resolution ultrasonography in clinically diagnosed cases of plantar fasciitis. Pol J Radiol. 2020;85(1):e375–e380. doi:10.5114/pjr.2020.97955
14. Wu J, Zhang YZ, Gao Y, Luo TY. Assessment the reliability of ultrasonography in the imaging of the plantar fascia: a comparative study. BMC Med Imaging. 2019;19(1):62. doi:10.1186/s12880-019-0361-1
15. Taljanovic MS, Gimber LH, Becker GW, et al. Shear-wave elastography: basic physics and musculoskeletal applications. Radiographics. 2017;37(3):855–870. doi:10.1148/rg.2017160116
16. Phan A, Lee J, Gao J. Ultrasound shear wave elastography in assessment of skeletal muscle stiffness in senior volunteers. Clin Imaging. 2019;58:22–26. doi:10.1016/j.clinimag.2019.06.006
17. Davis LC, Baumer TG, Bey MJ, Holsbeeck MV. Clinical utilization of shear wave elastography in the musculoskeletal system. Ultrasonography. 2019;38(1):2–12. doi:10.14366/usg.18039
18. Hobson-Webb LD. Emerging technologies in neuromuscular ultrasound. Muscle Nerve. 2020;61(6):719–725. doi:10.1002/mus.26819
19. Ryu J, Jeong WK. Current status of musculoskeletal application of shear wave elastography. Ultrasonography. 2017;36(3):185–197. doi:10.14366/usg.16053
20. Paluch Ł, Nawrocka-Laskus E, Wieczorek J, et al. Use of ultrasound elastography in the assessment of the musculoskeletal system. Pol J Radiol. 2016;81:240–246. doi:10.12659/PJR.896099
21. Alviti F, D’Ercole C, Schillizzi G, et al. Elastosonographic evaluation after extracorporeal shockwave treatment in plantar fasciopathy. Med Ultrason. 2019;21(4):399–404. doi:10.11152/mu-1976
 © 2023 The Author(s). This work is published and licensed by Dove Medical Press Limited. The full terms of this license are available at https://www.dovepress.com/terms.php and incorporate the Creative Commons Attribution - Non Commercial (unported, v3.0) License.
By accessing the work you hereby accept the Terms. Non-commercial uses of the work are permitted without any further permission from Dove Medical Press Limited, provided the work is properly attributed. For permission for commercial use of this work, please see paragraphs 4.2 and 5 of our Terms.
© 2023 The Author(s). This work is published and licensed by Dove Medical Press Limited. The full terms of this license are available at https://www.dovepress.com/terms.php and incorporate the Creative Commons Attribution - Non Commercial (unported, v3.0) License.
By accessing the work you hereby accept the Terms. Non-commercial uses of the work are permitted without any further permission from Dove Medical Press Limited, provided the work is properly attributed. For permission for commercial use of this work, please see paragraphs 4.2 and 5 of our Terms.