Back to Journals » Diabetes, Metabolic Syndrome and Obesity » Volume 12
Multivariable Logistic Regression And Back Propagation Artificial Neural Network To Predict Diabetic Retinopathy
Authors Yao L, Zhong Y, Wu J, Zhang G ![]() , Chen L, Guan P
, Chen L, Guan P ![]() , Huang D
, Huang D ![]() , Liu L
, Liu L ![]()
Received 18 June 2019
Accepted for publication 16 September 2019
Published 25 September 2019 Volume 2019:12 Pages 1943—1951
DOI https://doi.org/10.2147/DMSO.S219842
Checked for plagiarism Yes
Review by Single anonymous peer review
Peer reviewer comments 3
Editor who approved publication: Dr Konstantinos Tziomalos
Litong Yao,1,* Yifan Zhong,2,* Jingyang Wu,2 Guisen Zhang,3 Lei Chen,2 Peng Guan,4 Desheng Huang,4,5 Lei Liu2,6
1Department of Breast Surgery, The First Affiliated Hospital of China Medical University, Shenyang 110001, People’s Republic of China; 2Department of Ophthalmology, The First Affiliated Hospital of China Medical University, Shenyang 110001, People’s Republic of China; 3Department of Ophthalmology, Hohhot Chao Ju Eye Hospital, Hohhot 010000, People’s Republic of China; 4Department of Epidemiology, School of Public Health, China Medical University, Shenyang 110122, People’s Republic of China; 5Department of Mathematics, School of Fundamental Sciences, China Medical University, Shenyang 110122, People’s Republic of China; 6Department of Public Service, The First Affiliated Hospital of China Medical University, Shenyang 110001, People’s Republic of China
*These authors contributed equally to this work
Correspondence: Desheng Huang
Department of Epidemiology, School of Public Health, China Medical University, Shenyang 110122, People’s Republic of China
Email [email protected]
Lei Liu
Department of Ophthalmology, The First Affiliated Hospital of China Medical University, Shenyang 110001, People’s Republic of China
Tel/fax +86-24-83282277
Email [email protected]
Background: Monitoring and prediction of diabetic retinopathy (DR) is necessary in patients with diabetes for early discovery and timely treatment of disease. We aimed to analyze the association between DR and biochemical and metabolic parameters, and develop a predictive model for DR.
Methods: A total of 530 Chinese residents including 423 with type 2 diabetes (T2D) aged 18 years or older participated in this study. The association between DR and biochemical and metabolic parameters was analyzed by the univariate and multivariable logistic regression (MLR). According to the MLR results, we developed a back propagation artificial neural network (BP-ANN) model by selecting tan-sigmoid as the transfer function of the hidden layers nodes, and pure-line of the output layer nodes, with training goal of 0.5×10⁻⁵.
Results: There were 51 (9.6%) diabetic participants with DR. After univariate and MLR analysis, duration of diabetes, waist to hip ratio, HbA1c and family history of diabetes were independently associated with the presence of DR (all P < 0.05). Based on these parameters, the area under the receiver operating characteristic (ROC) curve for the BP-ANN model was significantly higher than that by MLR (0.84 vs. 0.77, P < 0.001).
Conclusion: Our evaluation demonstrated the potential role of BP-ANN model to identify DR in screening practice. The presence of DR was well predictable using the proposed BP-ANN model based on four related parameters (duration of diabetes, waist to hip ratio, HbA1c and family history of diabetes).
Keywords: diabetic retinopathy, type 2 diabetes, regression, BP-ANN
Introduction
The number of patients who suffer from diabetes and related complications is continuously rising in China. The effective control and prevention strategies are urgently needed. Especially, diabetic retinopathy (DR), the most common and serious complication triggered by diabetes, has become a wide-spread disease that leads to visual impairment for adults.1 Therefore, investigation on DR is becoming a hot topic in the medical science world.
According to the first dissertation, early screening and follow-up study, the most effective methods to detect DR were sorted out from related studies established by national and international institutions including Diabetes Control and Complications Trial (DCCT), UK Prospective Diabetes Study (UKPDS) and Wisconsin Epidemiologic Study of Diabetic Retinopathy (WESDR). These institutions all draw up the same conclusion: a higher systolic blood pressure, blood glucose and serum lipid could induce DR easily.2–4 Nevertheless, there are still some ongoing issues on preventing DR, even though many national and international studies come to the same results. For instance, many patients with diabetes missed the best timing for DR treatment, because those endocrinologists failed to warn their patients to take medical checkup on DR in advance.5
In order to prevent DR comprehensively, it is essential to explore the influence of risk factors and develop an early artificial intelligence (AI) warning system for lesion related to retinopathy. Currently, there are some studies based on AI to detect DR, while the specificity or sensitivity is still limited, and the algorithms remain controversial.6,7 Further, there is no prediction model established based on factors affecting DR. Back propagation artificial neural network (BP-ANN) algorithm is a multi-layer feed forward network trained according to error back propagation algorithm and is one of the most widely applied neural network models.8 However, there is still no report on the prediction model for DR using BP-ANN. This study aimed to establish a prediction model of DR based on physiological and biochemical indicators by using BP-ANN, and to provide a basis for predicting presence of DR.
Materials And Methods
Participants And Measurements
The participants for this study are residents in Fengyutan community whose health documents were recorded into the database of local health center in August, 2011. The methodology of the sampling has been detailed in previous publication and this was a part of previous investigation with cross-sectional study design.9 Briefly, a total of 595 Chinese Han adults aged ≥18 years were recruited from Fengyutan Street, Shenyang from August to October 2011 according to their health files at Fengyutan Health Center. Considering that retinopathy was common among Chinese adults without diabetes,10 current study included participants with or without diabetes. Those participants without diabetes were randomized selected from their health files of Fengyutan community and the sample size was twice of participants with DR. We used questionnaires to investigate their personal information such as age, gender, as well as smoking, drinking status and medical history.
All participants underwent comprehensive physical examinations. The physical examination data included height, weight, waist circumference, hip circumference (waist to hip ratio), systolic blood pressure (SBP) and diastolic blood pressure (DBP). Body mass index (BMI) was calculated as the body weight in kilograms divided by squared height in meters. The average of two different physical measurements was taken as the final recorded value. Fasting (≥8 hrs) venous blood samples were obtained to measure biochemical index. Biochemical indicators measured included fasting plasma glucose (FPG), glycosylated hemoglobin (HbA1c), total cholesterol (TC) and triglyceride (TG) levels. All laboratory examinations were performed at the Endocrinology Laboratory, China Medical University.
DM was defined as FPG greater than or equal to 7.0 mmol/L, HbA1c greater than or equal to 6.5%, self-reported use of anti-diabetic medication or physician-diagnosed diabetes. Hypertension was defined as a SBP greater than or equal to 140 mmHg or DBP greater than or equal to 90 mmHg or any use of anti-hypertensive medications. Smoking was defined as those currently smoking any number of cigarettes. Drinking was defined as those who reported currently drinking five or more drinks for males and four or more for females at least once.
After pupillary dilation, the presence of DR was graded from 2-field (one centered on the optic disc; and the other centered on the fovea) fundus photographs (Canon CR6-45NM; Canon, Inc., Tokyo, Japan) according to the Early Treatment for Diabetic Retinopathy Study (ETDRS) standards.11 Fundus photographs were read in a blind manner. DR was diagnosed if any characteristic lesion was present: microaneurysms, hemorrhages, cotton wool spots, intraretinal microvascular abnormalities, hard exudates, venous bleeding and new vessels. Data from the worst eye were used in current analyses. This study was in compliance with the Helsinki Declaration and approved by the ethics Committee of the First Affiliated Hospital of China Medical University. All the participants signed an informed consent form.
Algorithm Of BP-ANN
We used BP-ANN to mimic the relationship between risk factors and DR. BP is shorthand for “the backward propagation of errors,” since an error is computed at the output and distributed backwards throughout the network’s layers by using the chain rule to iteratively calculate gradients for each layer.
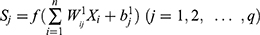
The back propagation algorithm is provided with a set of network behavior: {Xi,Yi}, where Xi(i=1,2, …, n) is the input, and Yi(i=1,2, …, n) is the corresponding target output. W1ij is the weight from the input layer to hidden layer, and W2jk is the weight from the hidden layer to output layer. b1j(j=1,2, …, q) is the threshold of hidden layer, and b2k(k=1,2, …, m) is the threshold of output layer.
The hidden layer function value, as formula 1,
(1)
where transfer function f may be a linear or nonlinear function, such as log-sigmoid function  .
.
The output layer function value, as formula 2,
(2)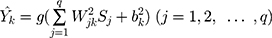
where g is a transfer function.
BP algorithm adjusts the network parameters in order to minimize the mean square error as formulas 3–5.
(3)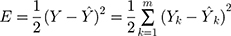

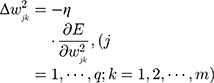
where η is a learning rate.
Implementation Of BP Artificial Neural Network
- Initialization of BP network

where P is the input vector, T is the target vector, Si is the size of the ith layer, TFi is the transfer function of the ith layer, BTF is the BP network training function (default = “trainlm”), BLF is the BP weight/bias learning function (default = “learngdm”), PF is the Performance function (Default = “mse”), IPF is the row cell array of input processing functions (Default = {“fixunknowns”, “removeconstantrows”, “mapminmax”}), OPF is the row cell array of output processing functions (Default = {“removeconstantrows”, “mapminmax”}), and DDF is the data division function (default = “dividerand”)

where Pi is the initial input delay conditions (default = zeros), Ai is the initial layer delay conditions (default = zeros)
Statistical Analysis
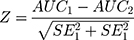
Statistical Program for Social Sciences (SPSS, Version 20.0, IBM) for windows was used for statistical analysis. BP-ANN model was established by the neural network toolbox in MATLAB 2010 alpha software. Continuous variables were analyzed by one-way ANOVA or rank sum test, and categorical variables were analyzed by chi-square test or rank sum test. Univariate analysis was performed with DR as the dependent variable. Multivariable regression model was constructed based on the training data for extrapolation of new data using the maximum likelihood estimation. The odds ratio (OR) value of each factor with the corresponding 95% confidence interval (95% CI) was calculated. The probability threshold is set to 0.5, ie, when P > 0.5, DR is considered to occur. For all the tests, a P-value less than 0.05 was considered to be significant. Adjusted receiver operating characteristic (ROC) analyses were conducted to evaluate the prediction performance. The area under a ROC curve is compared by the Z test as formula 6.
(6)
Results
Statistical Description Of The Characteristics Of The Study Population
A total of 530 (response rate: 89.1%) patients were enrolled in the study. The study population can be divided into three subgroups, including 107 (20.2%) non-diabetic health control individuals, 372 (70.2%) diabetic participants without DR and 51 (9.6%) diabetic participants with DR (Table 1). Analysis of variance showed that there were significant differences in the genetic history of diabetes, history of hypertension and HbA1c levels between three subgroups (P < 0.05). The use of insulin to control blood glucose and diabetes duration is much longer in the diabetic patients with DR compared to those without DR (P < 0.05). The HbA1c levels and waist-to-hip ratio between non-diabetic subgroup and patients with DR subgroup were significantly different (P < 0.05). The HbA1c levels were higher in the non-DR diabetic patients than those in non-diabetic patients (P < 0.05), while no difference was found in age, gender, smoking, drinking, BMI, waist circumference, hip circumference, waist-to-hip ratio, SBP, DBP, FPG, TG, TC among three subgroups (P > 0.05).
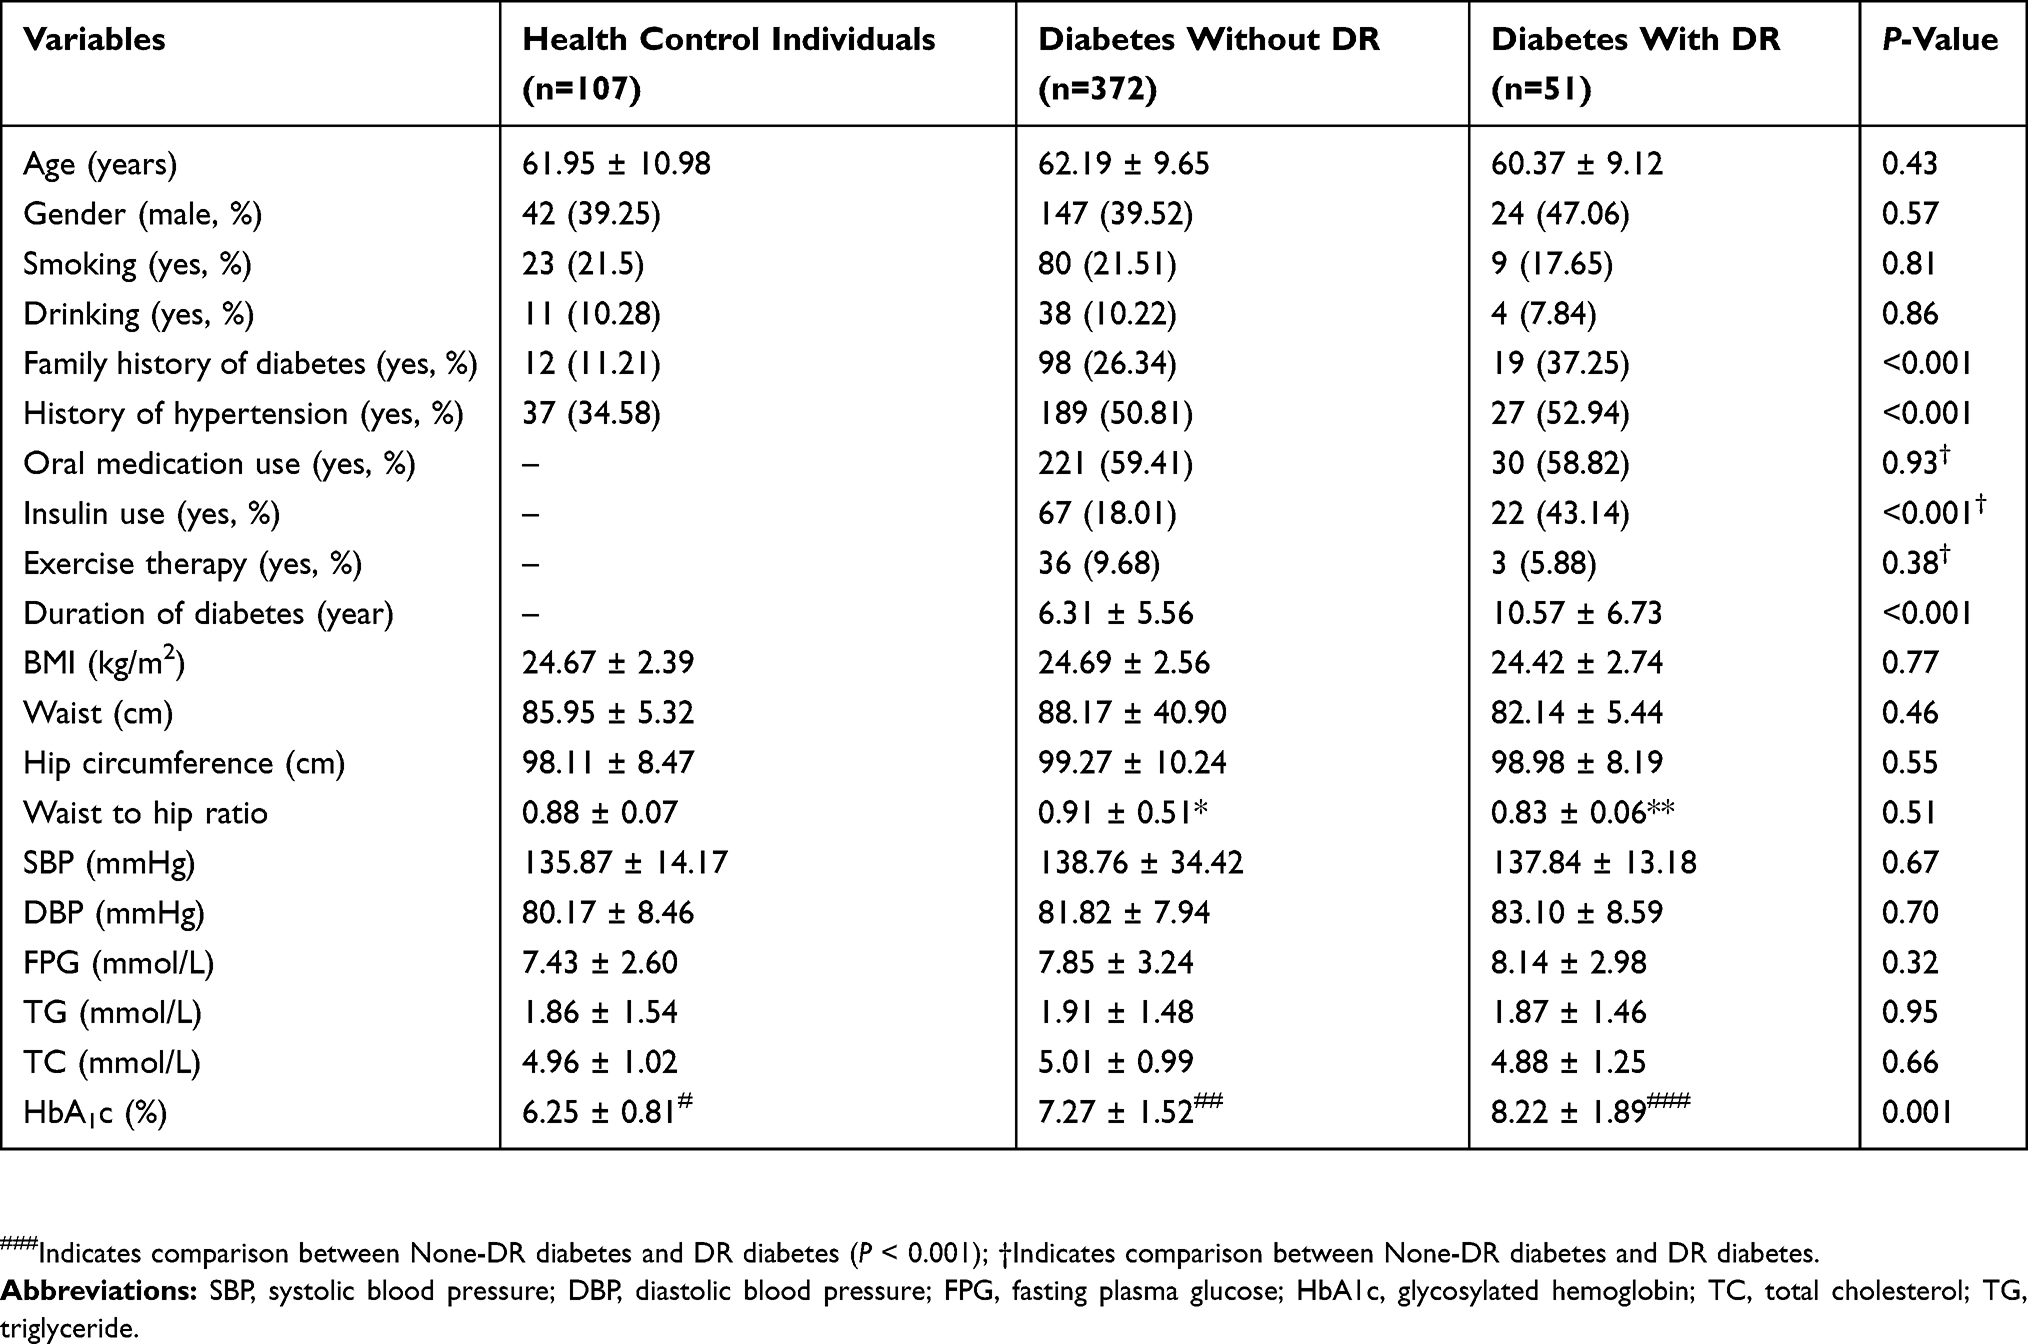 |
Table 1 Characteristics Of Participants |
Unconditional Binary Logistic Regression Analysis
After univariate logistic regression for DR (all participants without DR were analysed as the comparison group), duration of diabetes, HbA1c levels, waist-to-hip ratio and family history of diabetes may be related to DR (Table 2).
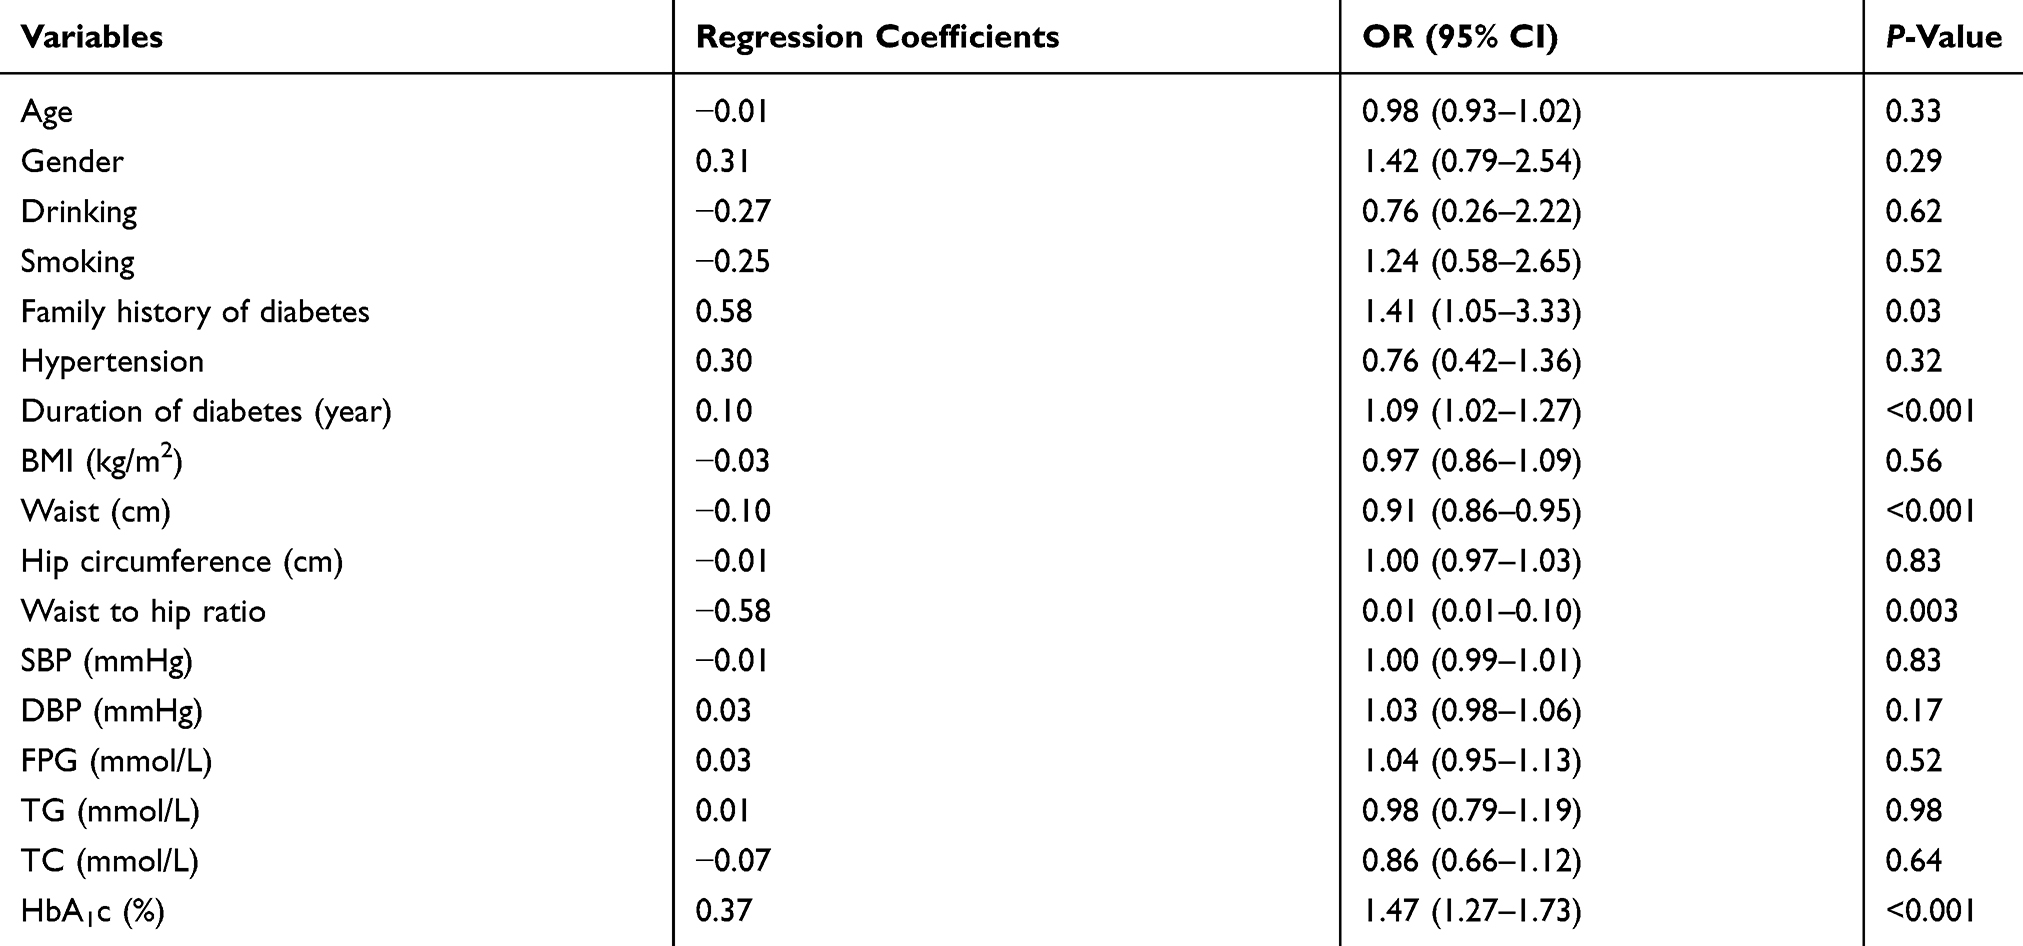 |
Table 2 Factors Associated With The Development Of Diabetic Retinopathy |
Multivariable Logistic Regression
After multivariable logistic regression model, duration of diabetes, waist to hip ratio, HbA1c levels and family history of diabetes were independently associated with the presence of DR. The results are shown in Table 3. The ROC curve was plotted according to the probability values obtained by logistic regression (Figure 1). The adjusted area under the ROC curve was 0.77 (95% CI: 0.69–0.85). When the cutoff value was 0.11, the Youden index had a maximum value of 0.48 with sensitivity 0.70 and specificity 0.79.
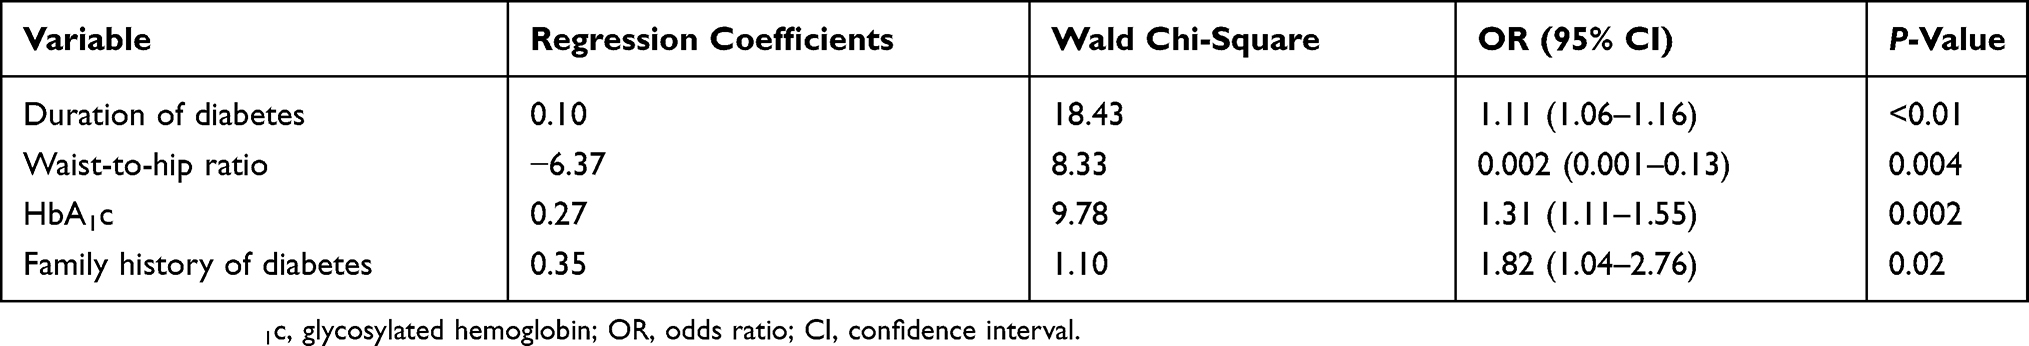 |
Table 3 Multivariable Logistic Regression Analysis Results Of DR Related Factors |
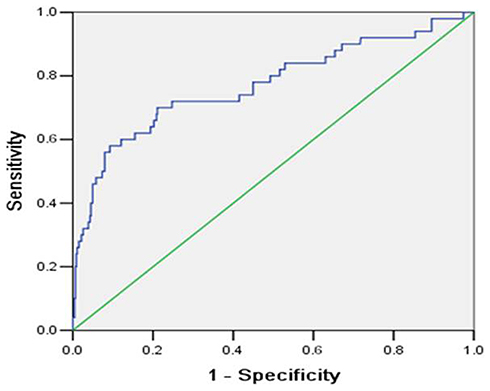 |
Figure 1 The covariate-adjusted ROC curve by logistic regression model to predict DR. |
BP-ANN Model
BP-ANN model was built using the neural network toolbox (Matlab 2010α version). The input variables include HbA1c (normalized value), waist-to-hip ratio (normalized value), duration of diabetes (value 1 was assigned when duration was greater than or equal to 10, 0 was assigned for others) and family history of diabetes (value 1 was assigned for subjects with family history, 0 for was assigned for others). The data were divided into the raining set, validation set and test set according to a ratio of 3:1:1. Stopping criteria was employed in network training in order to eliminate over fitting. That was, the training set was used for training, and the performance of validation set was computed simultaneously. When the validation set was found to have a significant degradation in performance (which may be a correlation coefficient, a squared error or some equivalent energy index), the training process would be stopped. The number of neurons in the input layer, hidden layer and output layer was set to 4-n-1. That was, four input variables (duration of diabetes, HbA1c level, family history of diabetes, waist-to-hip ratio), n neurons for hidden layer (varied from 1 to 13) and one neuron for output layer (DR or not). Internal random sampling was performed by setting a random number randomly. The transfer functions of the hidden layer and the output layer were tan-sigmoid and pure-line, respectively. The optimal number of nodes was selected according to the largest correlation coefficient between the observed and the predicted values. When the number of hidden layer nodes was 10, the maximum correlation coefficient 0.55 was obtained (Table 4).
 |
Table 4 Correlation Coefficient Varies With The Number Of Nodes |
Matlab synaxes were as follows (Figure 2):
 |
Figure 2 The BP-ANN training process. (A) Training of the BP-ANN (10 nodes hidden layer); (B) fitting performance of the BP-ANN (10 nodes hidden layer); (C) changes in parameters of the BP-ANN (10 nodes hidden layer); (D) regression performance of BP-ANN (10 nodes hidden layer). |
myseeds=[2];
rand(‘seed’,myseeds);
NodeNum=n;
for NodeNum=1:13
tpnet=newff(pn1,tn1,[NodeNum],{‘tansig’,‘purelin’},’ trainlm’); % Initialization of network, %% Transfer function are tansigmoid and pureline, Iteration method is trainlm
tpnet.trainParam.show=1; %Training epoch shown
tpnet.trainParam.epochs=10,000;%Maximum training time
tpnet.trainParam.goal=1e-5;%Minimum mean square error
tpnet.trainParam.lr=0.01; %Leaning rate
tpnet=train(tpnet,p,t); %Training of network
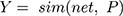
tpY=sim(tpnet,pn1); %Simulation
end
The Levenberg-Marquardt method was used for iteration of parameter, and mean square error was used to measure the performance when using the stopping criterion. The network training process is shown in Figure 2. In step 16 of the total 22 iterations, the best results were obtained. The correlation coefficients for training, validation and test sets were 0.63, 0.35 and 0.36, respectively.
As shown in Figure 3 adjusted with both four variables (duration of diabetes, HbA1c levels, waist-to-hip ratio and family history of diabetes), the ROC curve was plotted based on all data to predicted values of the BP-ANN model. The adjusted area under the ROC curve was 0.84 (95% CI: 0.78–0.91), which was higher than that of the logistic regression (Z = 3017, P < 0.001). When the cutoff value was 0.11, the sensitivity was 0.73, the specificity was 0.83 and the Youden index was 0.55, which was higher than those of the logistic regression (0.48), indicating that the constructed neural network had a good performance on DR prediction in this community-based population.
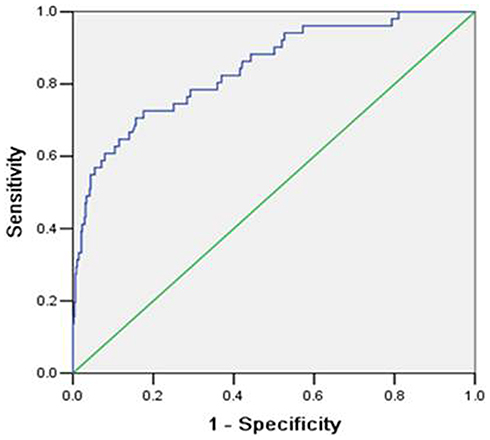 |
Figure 3 The covariate-adjusted ROC curve (including duration of diabetes, HbA1c levels, waist-to-hip ratio and family history of diabetes) by BP-ANN model to predict DR. |
Discussion
In the current study, we investigated the factors for DR among Chinese community residents and found that duration of diabetes, waist-to-hip ratio, HbA1c level and family history of diabetes were associated with DR. Further, according to these factors, we established the prediction models for DR using the multivariable logistic regression (area of ROC: 0.77) and the BP-ANN with Matalab software (area of ROC: 0.84). The prediction model based on BP-ANN with higher area under curve is clearly superior to the traditional model from the multivariate logistic regression. It is of great importance to establish a model for predicting DR risk and to carry out early DR screening. Taken together, it may help the screening and management of community residents in future.7
By 2040, it might be projected that 600 million people will suffer from diabetes worldwide, and one-third of them are expected to have DR. Screening for DR is a universally accepted strategy for detection and prevention of blindness due to disease. Recently, the American Diabetes Association (ADA), the US Centers for Disease Control and Prevention (US CDC) and the American Academy of Ophthalmology (AAO) recommended that patients with diabetes must have a regular dilated examination of the fundus.12,13 In China, despite increasing awareness of DR screening in recent years, the overall attention to early screening of DR remains insufficient, especially in rural or underdeveloped regions or countries with few ophthalmologists. Although there are some machine learning technologies, such as Deep learning system (DLS) under the broad term of artificial intelligence (AI), to detect referable DR and related eye diseases14,15 by evaluating retinal images, these programs for screening DR are still challenged by issues related to implementation (Fundus Camera), availability of human assessors (taking photos), especially in rural or underdeveloped regions or countries. Therefore, the establishment of an ANN-based DR predicting model can not only calculate the high-risk signals of DR in some patients, but also detect DR early with potential risk, so that the timely referral and treatment can be carried out, improving the prognosis of patients with DR.
In recent years, ANN has been widely used in many fields such as informatics and medicine. With its unique integrity, independence, non-linearity and adaptive learning, ANN has been recognized in many scientific research fields such as risk factor screening, information analysis and decision-making, and has become a powerful tool for dealing with nonlinear problems.16–18
This study exploits the powerful classification and prediction capabilities of ANN to develop an early-warning model for detecting the risk of DR, addressing the key issues of predicting the presence of DR and providing a scientific and rational solution for community health management. At present, there are still limited studies concerning the DR early predicting model. Gardner et al confirmed that the use of ANN can diagnose DR based on fundus photographs of 147 patients with DR and 32 normal images of control.19 However, their study only focused on the diagnosis of DR, and did not establish a corresponding early predicting model based on the biochemical indicators. This study established an ANN model of DR on the basis of risk factors by using baseline data such as general conditions, biochemical indicators and fundus photographs of an epidemiological investigation of DR in community population. The area under the ROC curve for BP-ANN was 0.84 (95% CI: 0.78–0.90), which was higher than that of the logistic regression 0.77 (95% CI: 0.69–0.85). It showed that the BP-ANN had good ability to deal with nonlinear problems compared to the traditional methods.
Interestingly, our findings revealed the inverse association between waist-to-hip ratio and DR in Chinese adults. The risk of DR was reduced when the waist-to-hip ratio was high, which was contrary to the literature report. This inverse association has been labeled as the “obesity paradox”.20 On the other hand, it may not be true that higher waist-to-hip ratio protects diabetic participants against DR, but that subjects with a lower waist-to-hip ratio are more likely to be more severe DM (causing weight loss), and thus, have an increased risk of DR. In addition, long-term duration of diabetes is associated with DR.21 Moreover, due to a lesser capacity for insulin secretion, people with long-term duration of diabetes tend to have a lower waist-to-hip ratio as compared to those with shorter diabetes duration. This could be a key factor in explaining the inverse association of waist-to-hip ratio and DR.
Nevertheless, several potential limitations should be taken into account. One was that the sample size was small and that only 51 patients had clinically significant DR. The other is the generalizability of participants. Current study was limited to a community practice in Northeast China and used a single level of DR. The third limitation of this study is the lacking of an independent population to validate the performance of the BP-ANN model. Although the authors divided their samples into training set, validation set and test set, the generalizability of this model should be cautious. Last but not least, although the model has higher predictive ability than traditional logistic regression, the sensitivity remains unsatisfactory, and this may be caused by few indicators and non-deterministic factors. This means that it is necessary to explore more specific indicators related to DR in the future.
Conclusion
Our investigation demonstrated the promise of using BP-ANN model to identify DR in screening practice. The presence of DR was well predictable using the proposed BP-ANN model based on four related parameters (duration of diabetes, waist-to-hip ratio, HbA1c and family history of diabetes) in Chinese community residents. It is considered as a novel model to predict the presence of DR rather than logistic regression, and a supplementary to DLS and AI especially in less developed regions or countries.
Data Availability
The data used to support the findings of this study are included within the article.
Acknowledgments
This work is supported by the National Natural Science Foundation of China (No. 81300783), Department of Education of Liaoning Province (No. LQNK201703), LiaoNing Revitalization Talents Program (No. XLYC1807082) and the China Postdoctoral Science Foundation (No. 2019TQ0358). The funders had no involvement in the study design, data collection and analysis, decision to publish, or preparation of the manuscript.
Disclosure
The authors report no conflicts of interest in this work.
References
1. Cheung N, Mitchell P, Wong TY. Diabetic retinopathy. Lancet. 2010;376:124–136. doi:10.1016/S0140-6736(09)62124-3
2. Nathan DM, Genuth S, Lachin J, et al.; Diabetes C, Complications Trial Research G. The effect of intensive treatment of diabetes on the development and progression of long-term complications in insulin-dependent diabetes mellitus. N Engl J Med. 1993;329:977–986. doi:10.1056/NEJM199309303291401
3. Diabetes Control and Complications Trial Research Group. Progression of retinopathy with intensive versus conventional treatment in the diabetes control and complications trial. Ophthalmology. 1995;102:647–661. doi:10.1016/s0161-6420(95)30973-6
4. UK Prospective Diabetes Study (UKPDS) Group. Intensive blood-glucose control with sulphonylureas or insulin compared with conventional treatment and risk of complications in patients with type 2 diabetes (UKPDS 33). Lancet. 1998;352:837–853.
5. Xiao D, Vignarajan J, Chen T, et al. Content design and system implementation of a teleophthalmology system for eye disease diagnosis and treatment and its preliminary practice in Guangdong, China. Telemed J E Health. 2017;23:964–975. doi:10.1089/tmj.2016.0266
6. Li Z, Keel S, Liu C, He M. Can artificial intelligence make screening faster, more accurate, and more accessible? Asia Pac J Ophthalmol. 2018;7:436–441. doi:10.22608/APO.2018438
7. Kanagasingam Y, Xiao D, Vignarajan J, Preetham A, Tay-Kearney ML, Mehrotra A. Evaluation of artificial intelligence-based grading of diabetic retinopathy in primary care. JAMA Netw Open. 2018;1:e182665. doi:10.1001/jamanetworkopen.2018.2665
8. Lyu J, Zhang J. BP neural network prediction model for suicide attempt among Chinese rural residents. J Affect Disord. 2019;246:465–473. doi:10.1016/j.jad.2018.12.111
9. Liu L, Wu J, Yue S, et al. Incidence density and risk factors of diabetic retinopathy within type 2 diabetes: a five-year cohort study in China (report 1). Int J Environ Res Public Health. 2015;12:7899–7909. doi:10.3390/ijerph120707899
10. Peng XY, Wang FH, Liang YB, et al. Retinopathy in persons without diabetes: the handan eye study. Ophthalmology. 2010;117:
11. Wilkinson CP, Ferris FL
12. Solomon SD, Chew E, Duh EJ, et al. Diabetic retinopathy: a position statement by the American Diabetes Association. Diabetes Care. 2017;40:412–418. doi:10.2337/dc16-2641
13. Zhang X, Williams DE, Beckles GL, et al.; Project DESG. Diabetic retinopathy, dilated eye examination, and eye care education among African Americans, 1997 and 2004. J Natl Med Assoc. 2009;101:1015–1021. doi:10.1016/s0027-9684(15)31068-3
14. Ting DSW, Cheung CY, Lim G, et al. Development and validation of a deep learning system for diabetic retinopathy and related eye diseases using retinal images from multiethnic populations with diabetes. Jama. 2017;318:2211–2223. doi:10.1001/jama.2017.18152
15. Li Z, Keel S, Liu C, et al. An automated grading system for detection of vision-threatening referable diabetic retinopathy on the basis of color fundus photographs. Diabetes Care. 2018;41:2509–2516. doi:10.2337/dc18-0147
16. Dong N, Lu WC, Chen NY, Zhu YC, Chen KX. Using support vector classification for SAR of fentanyl derivatives. Acta Pharmacol Sin. 2005;26:107–112. doi:10.1111/j.1745-7254.2005.00014.x
17. Freedman MT, Osicka T. Heat maps: an aid for data analysis and understanding of ROC CAD experiments. Acad Radiol. 2008;15:249–259. doi:10.1016/j.acra.2007.07.010
18. Zhao B, Zhang Z, Jin J, Pan WP. Modeling mercury speciation in combustion flue gases using support vector machine: prediction and evaluation. J Hazard Mater. 2010;174:244–250. doi:10.1016/j.jhazmat.2009.09.042
19. Gardner GG, Keating D, Williamson TH, Elliott AT. Automatic detection of diabetic retinopathy using an artificial neural network: a screening tool. Br J Ophthalmol. 1996;80:940–944. doi:10.1136/bjo.80.11.940
20. Carnethon MR, Rasmussen-Torvik LJ, Palaniappan L. The obesity paradox in diabetes. Curr Cardiol Rep. 2014;16:446. doi:10.1007/s11886-013-0446-3
21. Tan GS, Gan A, Sabanayagam C, et al. Ethnic differences in the prevalence and risk factors of diabetic retinopathy: the Singapore epidemiology of eye diseases study. Ophthalmology. 2018;125:529–536. doi:10.1016/j.ophtha.2017.10.026
 © 2019 The Author(s). This work is published and licensed by Dove Medical Press Limited. The
full terms of this license are available at https://www.dovepress.com/terms
and incorporate the Creative Commons Attribution
- Non Commercial (unported, 3.0) License.
By accessing the work you hereby accept the Terms. Non-commercial uses of the work are permitted
without any further permission from Dove Medical Press Limited, provided the work is properly
attributed. For permission for commercial use of this work, please see paragraphs 4.2 and 5 of our Terms.
© 2019 The Author(s). This work is published and licensed by Dove Medical Press Limited. The
full terms of this license are available at https://www.dovepress.com/terms
and incorporate the Creative Commons Attribution
- Non Commercial (unported, 3.0) License.
By accessing the work you hereby accept the Terms. Non-commercial uses of the work are permitted
without any further permission from Dove Medical Press Limited, provided the work is properly
attributed. For permission for commercial use of this work, please see paragraphs 4.2 and 5 of our Terms.