Back to Journals » Cancer Management and Research » Volume 13
Multiphase Contrast-Enhanced CT-Based Machine Learning Models to Predict the Fuhrman Nuclear Grade of Clear Cell Renal Cell Carcinoma
Authors Lai S, Sun L, Wu J, Wei R ![]() , Luo S
, Luo S ![]() , Ding W, Liu X, Yang R
, Ding W, Liu X, Yang R ![]() , Zhen X
, Zhen X ![]()
Received 8 November 2020
Accepted for publication 8 January 2021
Published 4 February 2021 Volume 2021:13 Pages 999—1008
DOI https://doi.org/10.2147/CMAR.S290327
Checked for plagiarism Yes
Review by Single anonymous peer review
Peer reviewer comments 2
Editor who approved publication: Dr Eileen O'Reilly
Shengsheng Lai,1,* Lei Sun,2,* Jialiang Wu,3 Ruili Wei,4 Shiwei Luo,4 Wenshuang Ding,5 Xilong Liu,6 Ruimeng Yang,4 Xin Zhen2
1School of Medical Equipment, Guangdong Food and Drug Vocational College, Guangzhou, Guangdong, 510520, People’s Republic of China; 2School of Biomedical Engineering, Southern Medical University, Guangzhou, Guangdong, 510515, People’s Republic of China; 3Department of Radiology, The University of Hong Kong Shenzhen Hospital, Shenzhen, Guangdong, 518000, People’s Republic of China; 4Department of Radiology, Guangzhou First People’s Hospital, School of Medicine, South China University of Technology, Guangzhou, Guangdong, 510180, People’s Republic of China; 5Department of Pathology, Guangzhou First People’s Hospital, School of Medicine, South China University of Technology, Guangzhou, Guangdong, 510180, People’s Republic of China; 6Department of Radiology, Nanfang Hospital, Southern Medical University, Guangzhou, Guangdong, 510515, People’s Republic of China
*These authors contributed equally to this work
Correspondence: Ruimeng Yang
Department of Radiology, Guangzhou First People’s Hospital, School of Medicine, South China University of Technology, Guangzhou, Guangdong, 510180, People’s Republic of China
Tel +86-20-81048873
Email [email protected]
Xin Zhen
School of Biomedical Engineering, Southern Medical University, Guangzhou, Guangdong, 510515, People’s Republic of China
Tel +86-20-62789323
Email [email protected]
Objective: To investigate the predictive performance of different machine learning models for the discrimination of low and high nuclear grade clear cell renal cell carcinoma (ccRCC) by using multiphase computed tomography (CT)-based radiomic features.
Materials and Methods: A total of 137 consecutive patients with pathologically proven ccRCC (including 96 low-grade [grade 1 or 2] and 41 high-grade [grade 3 or 4] ccRCC) from January 2011 to January 2019 were enrolled in this retrospective study. Target region of interest (ROI) delineation followed by texture extraction was performed on a representative slice with the largest section of the tumor on the four-phase (unenhanced phase [UP], corticomedullary phase [CMP], nephrographic phase [NP] and excretory phase [EP]) CT images. Fifteen concatenations of the four-phase features were fed into 176 classification models (built with 8 classifiers and 22 feature selection methods), the classification performances of the 2640 resultant discriminative models were compared, and the top-ranked features were analyzed.
Results: Image features extracted from the unenhanced phase (UP) CT images demonstrated a dominant classification performance over features from the other three phases. The discriminative model “Bagging + CMIM” achieved the highest classification AUC of 0.75. The top-ranked features from the UP included one shape-based feature and five first-order statistical features.
Conclusion: Image features extracted from the UP are more effective than other CT phases in differentiating low and high nuclear grade ccRCC based on machine learning–based classification modeling.
Keywords: clear cell renal cell carcinoma, Fuhrman nuclear grade, computed tomography, machine learning, classification
Introduction
Renal cell carcinoma (RCC) is the most common primary malignant tumor of the kidney in adults, accounting for approximately 90–95% of renal tumors, with clear cell renal cell carcinoma (ccRCC) being the predominant subtype that portends a worse prognosis than other subtypes.1 Histopathologic grade has been shown to be an independent prognostic factor of survival2–4 and is critical in selecting individualized treatment strategies, such as radical nephrectomy (RN) for aggressive RCC cases, partial nephrectomy (PN) for non-aggressive cases, or more conservative ablation or active surveillance for selective patients who have extensive comorbidities or are unwilling to undergo surgery.5,6 To date, several systems have been employed to grade RCC, where the Fuhrman grading system7 is the most widely used and highly recommended grading scheme.8
For evaluating the ccRCC Fuhrman nuclear grade, preoperative percutaneous biopsy of renal mass is controversial because although it is the optimal alternative due to the high spatial and temporal heterogeneity of ccRCC, it is an invasive approach and has potential sampling bias.9 Several pioneer investigative efforts have been made to predict the Fuhrman grade of ccRCC by analyzing morphological or/and dynamic contrast-enhanced medical imaging features based on conventional CT, dual-energy spectral CT,10–15 CT/MR perfusion16,17 or diffusion-weighted imaging (DWI).18,19 However, most of these aforementioned strategies are limited by the subjective preference of features, leading to unsatisfactory discriminative efficacy and model generalization capability.
Recently, radiomics has emerged as a promising noninvasive biomarker in assessing histopathological characterization and predicting biological aggressiveness in oncology. Several investigations have been reported in quantitatively analyzing CT-based radiomic features in an attempt to differentiate low and high Fuhrman nuclear grades.20–27 However, these reviewed studies are confined by the limitations that either texture features were usually extracted from a single CT phase or classification modeling was built upon a randomly selected classifier. To the best of our knowledge, no comprehensive investigations have been reported in determining which phase(s), classifier(s) or their possible combinations could be more discriminative.
The purpose of this study was to investigate the discriminative power of different classification models built with assorted combinations of classifiers and feature selection approaches in differentiating low vs high Fuhrman grades. Features were extracted from unenhanced renal CT images and different postcontrast-enhanced CT phases, alone or in combination. The top-ranked features discriminating low vs high Fuhrman grade were extracted and analyzed.
Materials and Methods
Patients
This study was approved by the Ethics Committee of Guangzhou First People’s Hospital and Nanfang Hospital and complied with the Declaration of Helsinki. The patient consent to review their medical records was waived because our study was a retrospective non-interventive study, which did not harm patients. The data were obtained through an electronic search of the picture archiving and communication system (PACS) from January 2011 to January 2019. The inclusion criteria were as follows: 1) patients with pathologically proven ccRCC and with defined Fuhrman grade; and 2) patients who had undergone preoperative four-phase contrast-enhanced CT (CECT) scans. The exclusion criteria were as follows: 1) patients with purely cystic ccRCC; 2) ccRCC without Fuhrman grade; and 3) prominent artifacts on CT.
Fuhrman Stage and Image Acquisition
To improve the reproducibility of pathologists and reduce the intra/inter-observer variability, the traditional 4-tier Fuhrman grading system was re-categorized into a simplified Fuhrman grading system with low-grade (grades 1 and 2) and high-grade (grades 3 and 4). Fuhrman grading was accomplished by a subspecialized genitourinary pathologist (W.S. Ding) with 8 years of diagnostic experience.
Preoperative CECT images were obtained on multiple scanners: Toshiba Aquilion One, Siemens Somatom Definition, GE HiSpeed 16 and Philips Brilliance 64. The acquisition parameters were as follows: tube voltage, 120–140 kV; automated tube current modulation and varied milliampere-second settings; and reconstruction slice thickness, 5 mm. All patients were injected with nonionic intravenous contrast material via the antecubital vein with mechanical power injectors according to their weight (1 mL/kg body weight, with a maximum of 150 mL). All patients underwent preoperative four-phase CT scans: Phase 1, unenhanced (UP); Phase 2, postcontrast corticomedullary phase (CMP), Phase 3, postcontrast nephrographic phase (NP); and Phase 4, postcontrast excretory phase (EP).
Feature Extraction and Representation
All CT images retrieved from PACS were stored in anonymized DICOM format. ITK-SNAP software (http://www.itksnap.org) was used for the delineation of the target region of interest (ROI) on the CT slice with the largest cross-sectional area of the tumor in phases 1~4 for tumor segmentation. A lesion ROI was first delineated on the CMP and then applied to the other three phases with a slight adjustment to acquire the tailored ROIs for each phase. This procedure was conducted by two investigators (J. L. Wu and R. M. Yang with 4 and 15 years of experience in radiological diagnosis, respectively) together without prior knowledge of the lesion pathology.
Texture feature extraction was accomplished (with Pyradiomics28) on the delineated ROIs in each phase. The extracted features from each phase included 102 candidate features, which could be categorized into three subtypes, including shape features, first-order statistical features (histogram analysis), and second-order statistical features (or “texture features”). The features extracted from each of the four phases were termed  ,
,  ,
,  , and
, and  (each with 102 features). The concatenation of features from any two phases were termed
  ,
,  ,
,  ,
,  ,
,  , and
, and  (each with 204 features), and the concatenation of features from any three phases were termed
  ,
,  ,
,  , and
, and  (each with 306 features). Similarly, the concatenated features from all four phases were termed
  (with 408 features). Discriminative capabilities were compared using the above 15 types of features as input for a specific discrimination model.
Modeling and Comparisons
In this study, we built particular discrimination models based on a feature selection strategy from a pool of 22 feature selection methods, as well as a classifier from a pool of eight classification algorithms (refer to Table S1 in the Supplement), thus resulting in a total of 176 different discrimination models. The 15 types of features were fed into each of the 176 discriminative models, resulting in 2640 (15 x 176) combinations in total to be compared. We evaluated each of these models with five-fold cross-validation, in each of which an optimal subset of features (a fixed size of 20 features was empirically selected to balance both sample size and feature numbers) was first estimated by a specific feature selection method, and these prescreened features were further fed into a classifier for discrimination modeling. To ease the data imbalance of the patient cohort, the synthetic minority oversampling technique (SMOTE)29 was used to oversample the minority high-grade ccRCC feature group by introducing synthetic feature samples. The discriminative powers of the models were quantified by the area under the receiver operating characteristic (ROC) curve (AUC).
Statistical Analysis
The randomized frequency matching method was employed for adjusting tumor sizes, specifically, the tumor sizes in the two groups were first, respectively, ranked in a descending order; then, a case with a particular tumor size was selected in one group, and its counterpart in the other group was randomly selected among those cases with a similar tumor size. Continuous variables are reported as the means (±standard deviations), and categorical variables are reported as numbers (proportions). The normality of the data distribution was assessed for continuous variables (Kolmogorov–Smirnov test for >50 patients and Shapiro–Wilk test for ≤50 patients). Comparisons between groups were performed using the following statistical tests: the chi-square test for categorical variables, independent t-test for normally distributed continuous variables, and the Mann–Whitney U-test for nonnormally distributed continuous variables. Discriminative comparisons between the 15 types of features were conducted using the independent samples Kruskal–Wallis test with Bonferroni correction for adjusting the significance level in pairwise comparisons.
All statistical analyses were performed using SPSS version 20 (IBM Corporation, Armonk, NY, USA). A two-tailed significance level of p < 0.05 was considered statistically significant.
Results
Demographics
This study comprised 96 low-grade [grade 1 (n=15, 10.9%) and 2 (n=81, 59.1%)] ccRCC patients and 41 high-grade [grade 3 (n=32, 23.4%) and 4 (n=9, 6.6%)] ccRCC patients who met the selection criteria and had complete imaging examinations. The patient characteristics of the two groups and the whole data set are provided in Table 1. There were no significant differences in patient age, sex or lesion diameter between the two groups (p > 0.05).
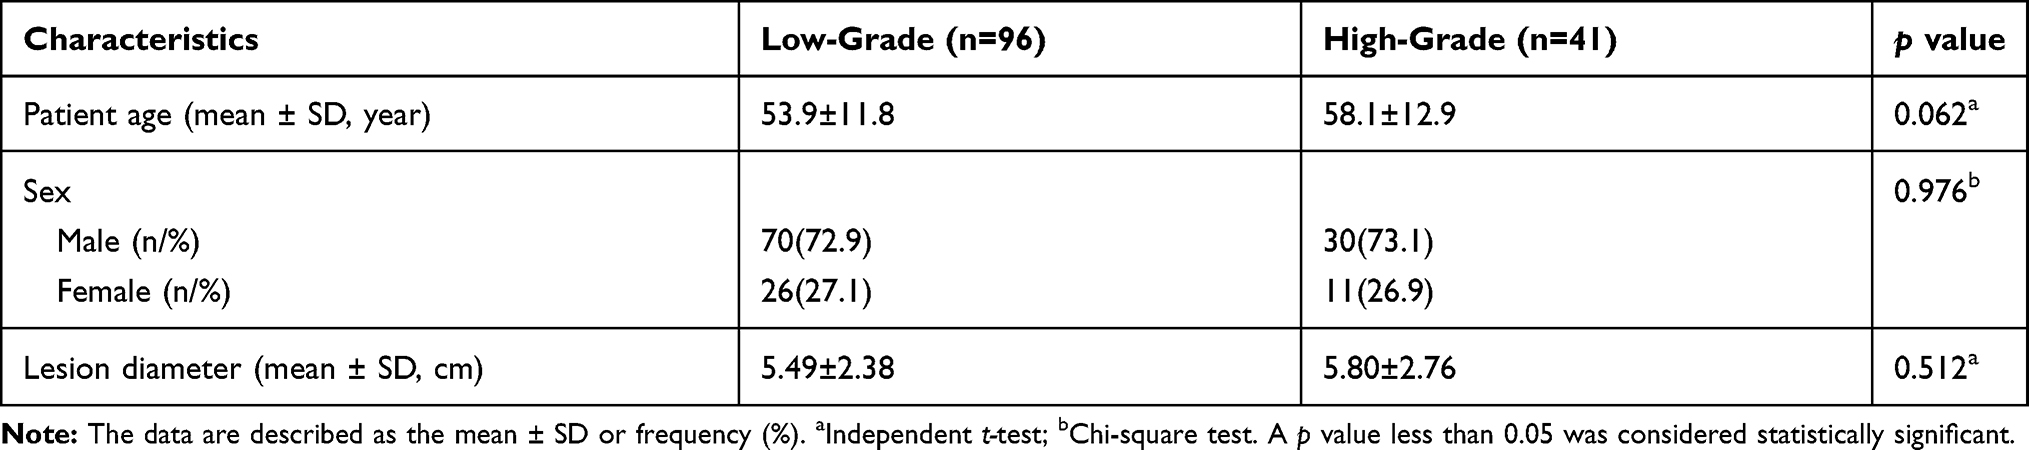 |
Table 1 Demographics and Characteristics of the Study Population |
Discriminative Capabilities of Different Feature Types
The 15 feature types were compared by being fed to each of the 176 discrimination models. The feature type with the highest AUC among the 15 feature types was marked with a dedicated color and shown as a color map, while the number of times this feature was ranked as the best feature type was also counted (Figure 1). We can see that Phase 1 ( ) had the most (62 times) best-performing features, followed by
  (39 times). Other leading phases were
  (22 times) and
  (21 times). It seems that those combinations including features from Phase 1 (
 ) generally had a better discriminative performance, suggesting that Phase 1 was a superior feature representation for ccRCC Fuhrman grade classification.
 |
Figure 1 Each colored circle represents a specific discriminative model (176 models in total) with different combinations of classifier and feature selection methods. A dedicated color is assigned to each circle with respect to the feature type that has the highest AUC value among all the 15 feature types for the corresponding discriminative model. |
The boxplot of the AUC distributions for all 15 feature types is illustrated in Figure 2. The superiority of Phase 1 over the other phases can also be verified by statistical comparisons. The models built on  performed significantly better than the other 14 feature types, while the phase combinations including Phase 1, eg,
  ,
,  , and
, and  , significantly outperformed the combinations without Phase 1, eg,
  ,
,  ,
,  and
and  . Similarly,
  ,
,  ,
,  and
and  achieved significantly better performance outcomes than
  ,
,  ,
,  and
and  .
.
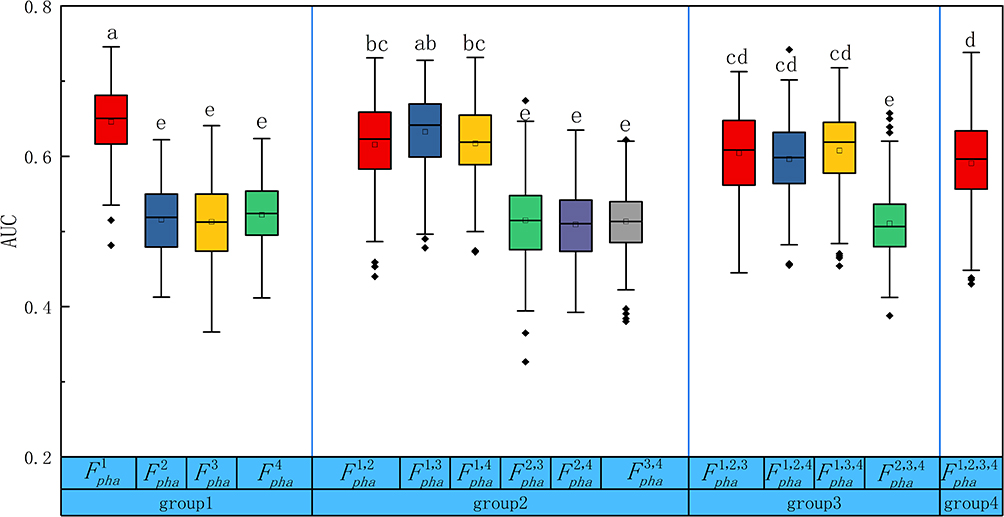 |
Figure 2 Boxplots of the AUC distributions for all the 15 feature types. The boxes run from the 25th percentile to the 75th percentile; the two ends of the whiskers represent the 5% and 95% percentiles of the data, and the horizontal line and the square in the box represent the median and mean values, respectively. The diamonds represent outliers. The letters above each box indicate whether a statistically significant difference (by Kruskal–Wallis test with Bonferroni correction) exists between any two feature types. No common letters indicate that the two feature types are significantly different. |
Key Feature Analysis
The AUC values achieved by all 176 discriminative models using features from Phase1  are shown as a heatmap in Figure 3. The highest AUC of 0.75 was achieved by the discriminative model with the combination of the classifier “Bagging” and the feature selection method “CMIM”. In the five-fold cross-validation, the feature selection method embedded in each discriminative model selected 20 key features for further classification. We counted the number of times each feature in
  was selected as the top-20 features (only for those models with AUCs >0.6), and the corresponding percentage is summarized and shown as a pie chart in Figure 4. The top-10 most frequently selected features in
  are highlighted in Figure 4, including five shape features and five first-order statistical features. No texture features were among the top-10 features.
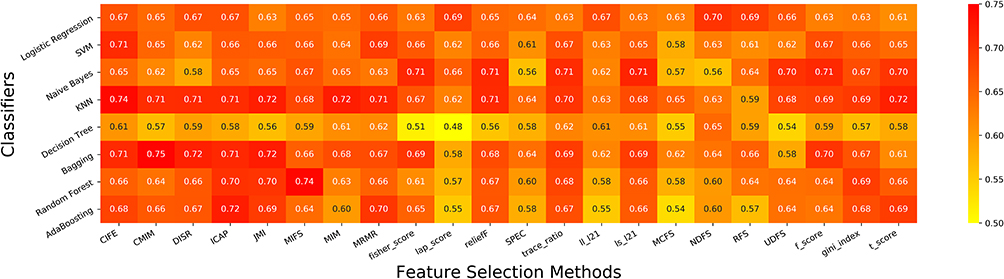 |
Figure 3 A heatmap representation of the AUC values obtained by the 176 discriminative models (F_pha^1 as feature input) built with different combinations of classifiers and feature selection methods. |
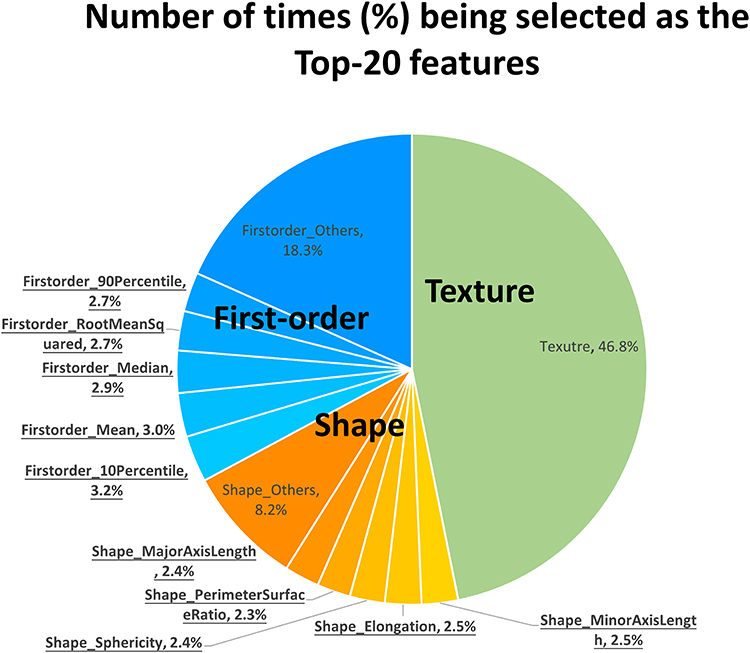 |
Figure 4 A pie chart showing the number of times (%) the features in F_pha^1 were selected into the top-20 features in the five-fold cross-validation of all discriminative models with AUCs >0.6. The most frequent 10 features are highlighted with underlined font. |
The top-10 most frequently selected features are summarized in Table 2. All the top-5 first-order statistical features (four with p<10−3 and one with p<10−2) and one shape feature (elongation, with p=0.023) were statistically significant features. We estimated the capability of using the mean of the mean feature values of the two groups (ie, “M” in Table 2) as the threshold to differentiate the two groups. It was observed that the top-5 first-order statistical features, ie, the 10th percentile, the 90th percentile, the mean, the median and the root mean squared, demonstrated discriminative capabilities in which ~60% of the high-grade group (~40% of the low-grade group) had larger feature values, while comparatively ~60% of the low-grade group (~40% of the high-grade group) had smaller feature values.
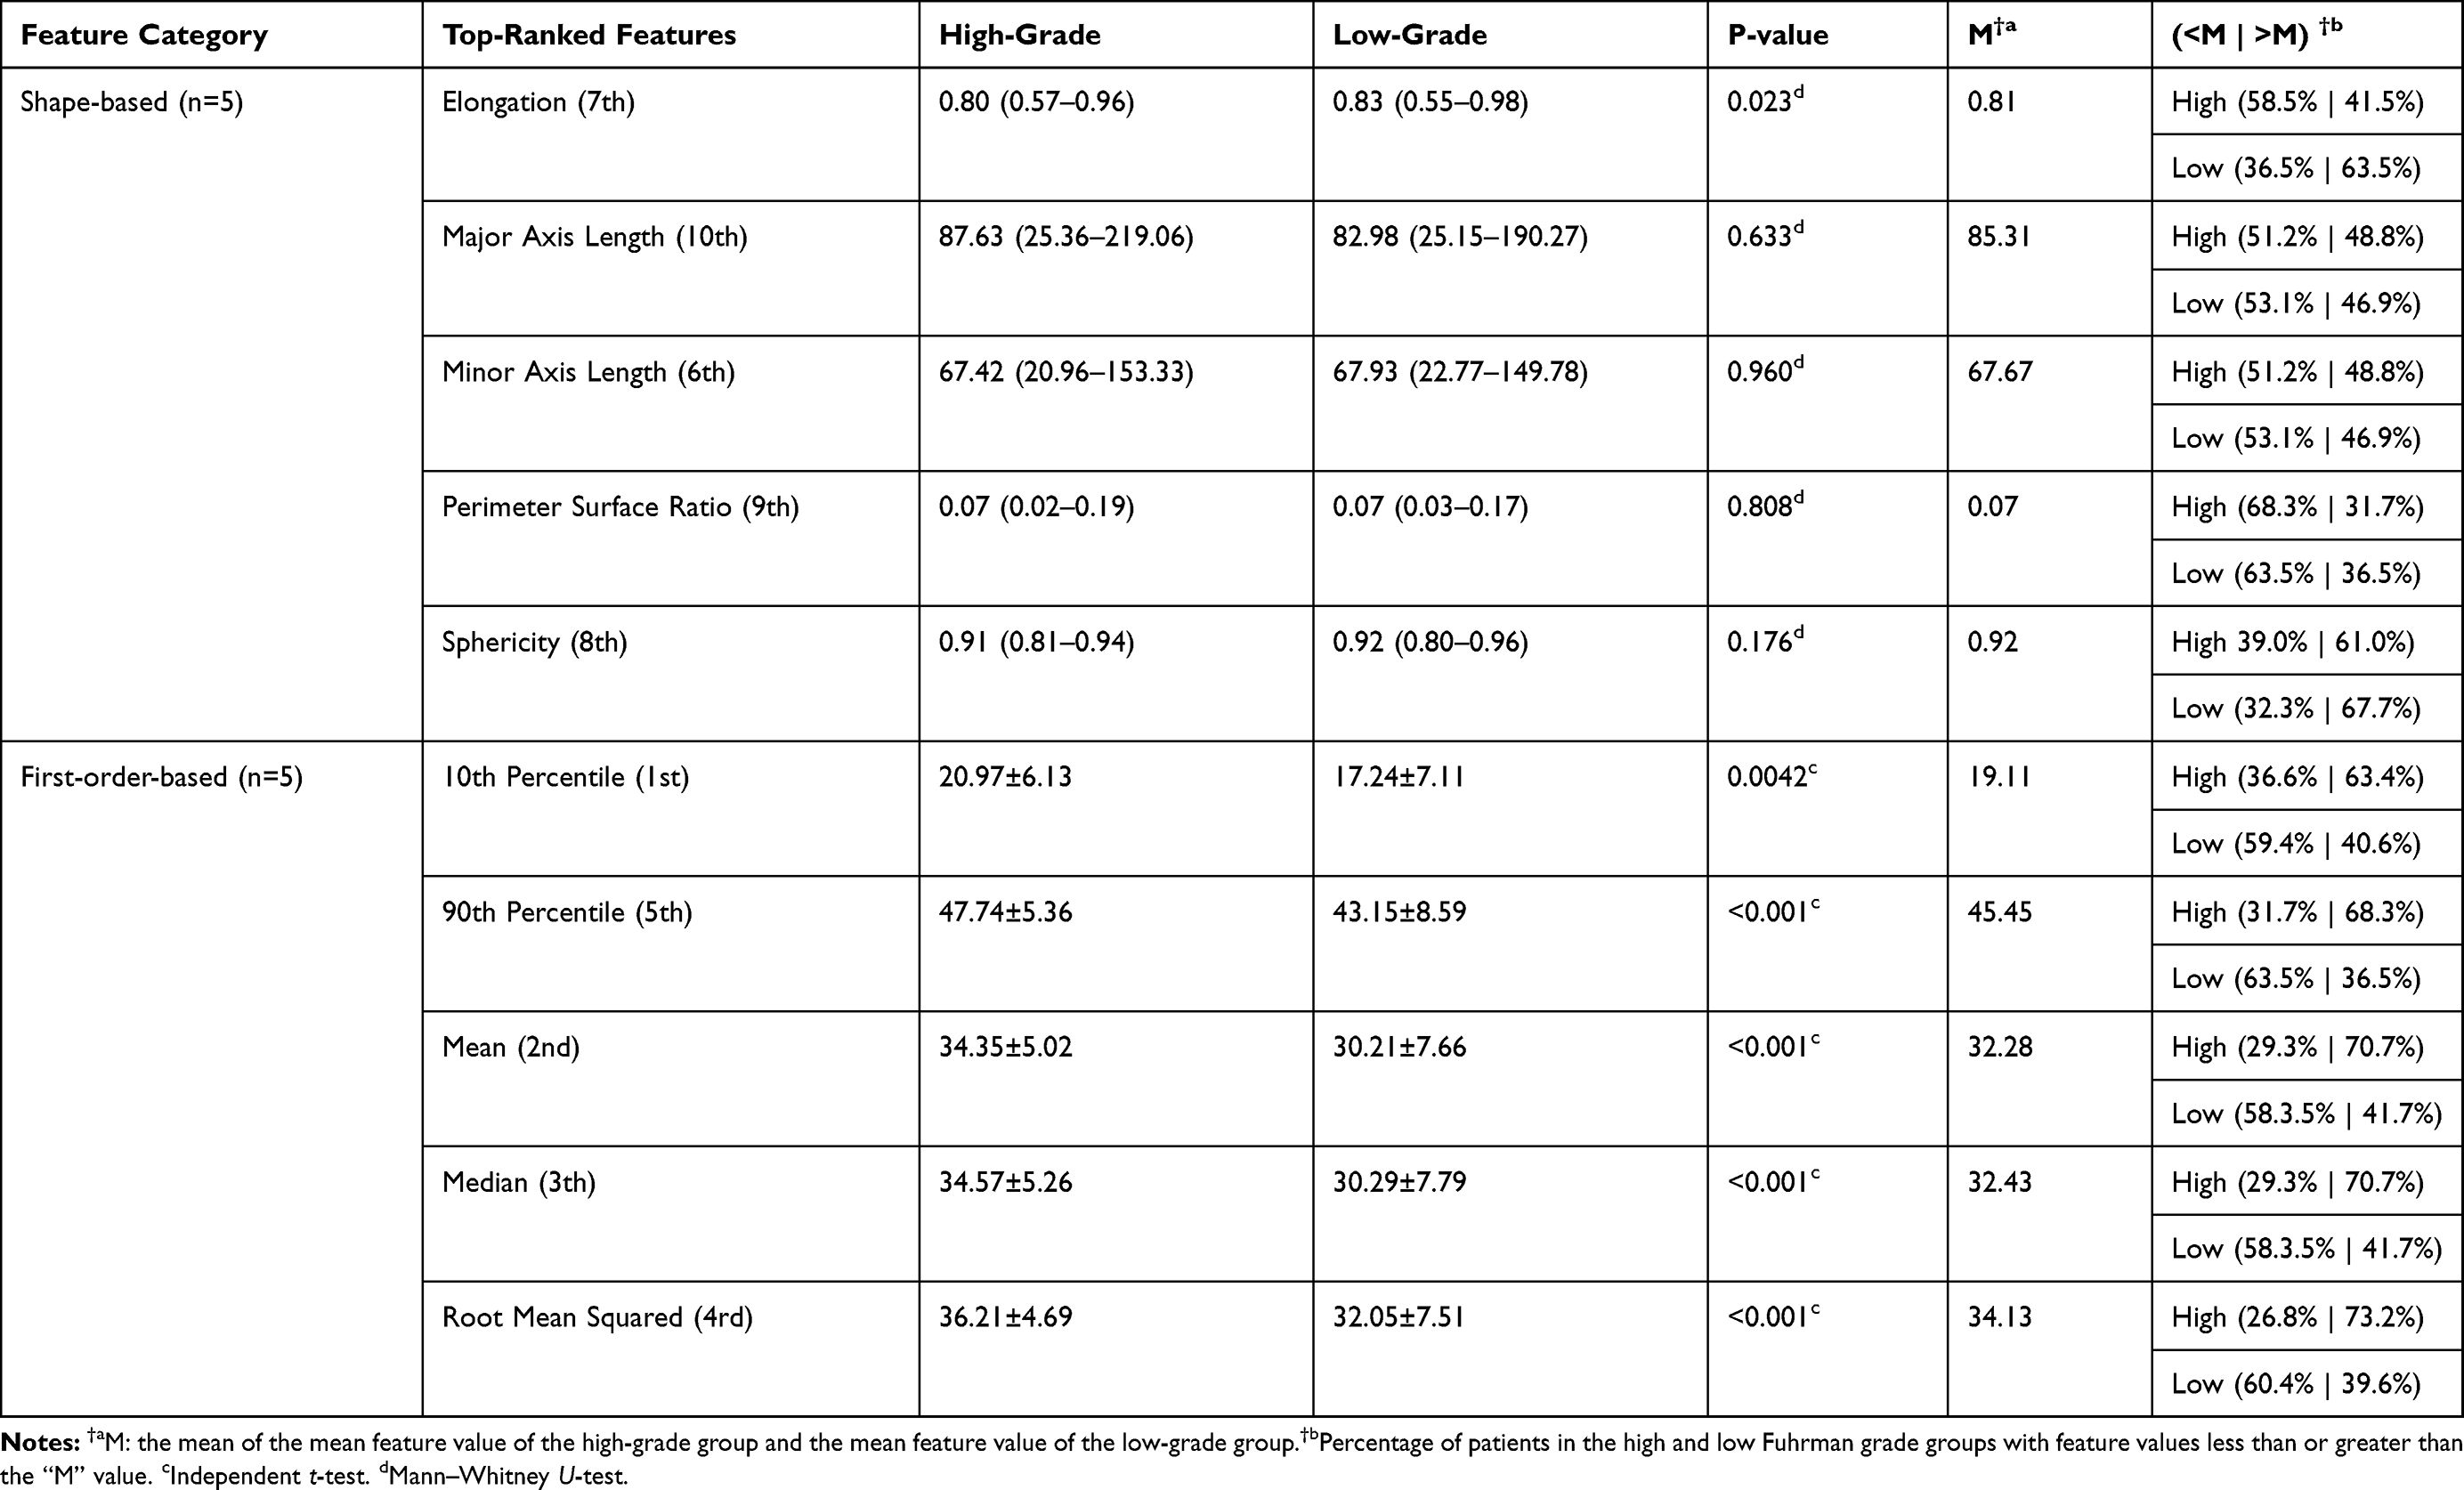 |
Table 2 The Top-10 Most Frequently Selected Features in |

Discussion
The originality of this multicenter retrospective study is that it comprehensively explores the optimal source of CT images from multiple CT phases (unenhanced phase and three dynamic enhanced phases) and the most ideal discriminative scheme among different classification models for the differentiation of low and high Fuhrman nuclear grade ccRCC. After thorough comparisons, the discriminative model composed of “CMIM” and “Bagging” yielded satisfactory performance with radiomics features extracted from the unenhanced phase (UP). Additionally, the shape- and first-order-based features were found to be more prominent over the texture features.
In terms of radiomics analysis-based predictions of the Fuhrman grade of ccRCC, most of the previous radiomics-based studies focused on features extracted from a single dynamic enhanced CT phase20,23 or multiple postcontrast CT phases without including the UP and the excretory phase [EP].22,25,26 Only two previous investigations included the UP, eg, Lin et al21 reported that they employed a machine learning model based on three-phase [precontrast phase (PCP, equal to UP in our study), CMP and NP] CT images and claimed to achieve superior diagnostic performance to those based on single-phase CT images in differentiating low- from high-grade ccRCC. Kocak’s study24 acknowledged the role of the UP, and they stated that machine learning-based unenhanced CT texture analysis could be a promising noninvasive method with favorable accuracy. Our finding is consistent with the previous study, such that the UP phase seems to be more suitable for texture analysis in differentiating the nuclear grade. This may be ascribed to the theoretical ground that there is no direct association between the Furhman nuclear grade and microscopic tumor vascularity.
In addition, several previous studies25,30 have demonstrated that tumor size was associated with the Fuhrman grade of ccRCC such that larger tumors tend to be scored with higher grades. Tumor size is readily accessible in clinics; however, small (<4 cm) ccRCCs are still occasionally detected in our routine clinical practices. In this study, we intentionally excluded this factor for unbiased evaluation while recruiting the validation patient cohort by matching the sizes (as well as other factors such as age and sex, see Table 1) of the two groups, since we sought to confirm whether hidden image patterns other than the tumor size exists and can be utilized for nuclear grades stratification. It would be more meaningful to predict the ccRCCs grades regardless of its tumor size but purely depending on the CT radiomics features barely captured by the naked eye. This strict inclusion criterion for patient enrollment might partially explain the relatively lower accuracies witnessed in the current study when compared with those reported results25,26 where tumor sizes were not paired.
It was also interesting to find that the top-10 features were shape-based features (n=5) and first-order features (n=5). The shape-based features were consistent in all four different CT phases, and only the elongation feature exhibited a statistically meaningful difference (p=0.023) between the two groups, where the low-grade group showed higher values than the high-grade group, indicating that tumors in the low-grade group tended to be more circle-like (non-elongated). For the first-order features, all five top-10 features, ie, the 10th percentile, 90th percentile, mean, median, and root mean squared, in the high-grade group had significantly higher values (all p<10−3). This finding suggested that the CT HUs, notably the high-intensity HUs (eg, the 90th percentile, with p<10−4), were critical in differentiating low-grade vs high-grade HUs. Interestingly, this macroscopic phenotype coincided with the microscopic nuclear grading based on the nucleus size and prominence of the high-density nucleolus in the tumor cells.7 Nuclear grading also depends on the assessment of the morphological nuclear characteristics; however, at the macro scale, this microscopic heterogeneity might not necessarily be reflected in CT morphologically but instead is more likely to be presented as CT image intensity fluctuations.
We found that no texture features were high-scored as the top-10 features in this study, although previous investigations have shown potential in some texture features, eg, entropy was claimed to be a good biomarker in differentiating low-grade vs high-grade.22,23,26 However, these results were not conclusive but instead contradictory in these pioneer studies, eg, Shu et al26 and Deng et al23 both found that high entropy is associated with high-grade renal cancer; in contrast, Feng et al22 claimed that the entropy of low-grade tumors is higher than that of high-grade tumors. We speculate that this inconsistency may be attributed to various internal heterogenetic histological components (eg, intratumoral necrosis and vasculature) of ccRCC that might be disproportionately distributed between the low- and high-grade ccRCC cases from the abovementioned studies.
There were several limitations that need to be acknowledged for this retrospective study. First, the enrolled patient cohort was relatively small, and an independent testing set was not available. We did not reserve an independent testing set from the whole patient cohort because of the small sample size. Subdividing the patient data into a training/validation set and an independent testing set would further deteriorate the data scarcity problem since fewer data would be reserved for training. This study investigated which phasic CT features are more suitable for nuclear grading modeling; though building a classification model with possibly high classification accuracy was not our intention, evaluation on a larger patient scale is of greater interest and would definitely further confirm the findings here. Second, the radiomics features were only extracted from a representative axial slice rather than from the three-dimensional (3D) whole tumor. The 3D volumetric analysis may theoretically include more tumor information; however, it is also time-consuming, and manual identification of all volumetric tumor slices may potentially increase the measurement errors. Third, Fuhrman grading was employed in this study instead of the WHO/International Society of Urologic Pathology (ISUP) grading system, which is currently widely used and has a stricter magnification requirement for pathological image quality, eg, requiring 400× magnification for scoring Grade 1 and 2. However, some of the collected digital pathological images in this study were only with low magnification, and their corresponding original histological sections were either lost during patient data sources preservation and relocation, or were not accessible since the patient data were collected from the other institution. We have reevaluated all the ccRCC cases that had pathological images qualified for both the Fuhrman and WHO/ISUP systems and found consistent grading results for most (129/137, 94%) of the cases.
Conclusion
In conclusion, the current comprehensive study demonstrated the feasibility of applying machine learning-based quantitative CT texture analysis in the differential diagnosis of low-grade from high-grade ccRCC. Of all four dynamic enhanced CT phases, radiomics features extracted from the UP contribute most to differentiation, and one shape-based and five first-order-based features of the top-10 features from the UP may be used as potential quantitative imaging biomarkers.
Acknowledgment(s)
We gratefully acknowledge all the members of Guangzhou First People’s Hospital, for continuous assistance.
Funding
This study has received funding from the National Natural Science Foundation of China (81971574, 81874216), the National Key Research and Development Program of China (2017YFC0112900), the Natural Science Foundation of Guangdong Province, P.R. China (2018A030313282), the Fundamental Research Funds for the Central Universities, SCUT (2018MS23), the Guangzhou Science and Technology Project, P.R. China (202002030268), Medical Science and Technology Research Project of Guangdong Province (A2019465).
Disclosure
The authors report no conflicts of interest in this work.
References
1. Leibovich BC, Lohse CM, Crispen PL, et al. Histological subtype is an independent predictor of outcome for patients with renal cell carcinoma. J Urol. 2010;183(4):1309–1316. doi:10.1016/j.juro.2009.12.035
2. Rioux-Leclercq N, Karakiewicz PI, Trinh QD, et al. Prognostic ability of simplified nuclear grading of renal cell carcinoma. Am Cancer Soc. 2007;109(5):868–874. doi:10.1002/cncr.22463
3. Novara G, Martignoni G, Artibani W, Ficarra V. Grading systems in renal cell carcinoma. J Urol. 2007;177(2):430–436. doi:10.1016/j.juro.2006.09.034
4. Zisman A, Pantuck AJ, Dorey F, et al. Improved prognostication of renal cell carcinoma using an integrated staging system. J Clin Oncol. 2001;19(6):1649–1657. doi:10.1200/JCO.2001.19.6.1649
5. Ljungberg B, Bensalah K, Canfield S, et al. EAU guidelines on renal cell carcinoma: 2014 update. Eur Urol. 2015;67(5):913–924. doi:10.1016/j.eururo.2015.01.005
6. Silverman SG, Israel GM, Trinh QD. Incompletely characterized incidental renal masses: emerging data support conservative management. Radiology. 2015;275(1):28–42. doi:10.1148/radiol.14141144
7. Fuhrman SA, Lasky LC, Limas C. Prognostic significance of morphologic parameters in renal cell carcinoma. Am J Surg Pathol. 1982;6(7):655–664. doi:10.1097/00000478-198210000-00007
8. Rini BI, Campbell SC, Escudier B. Renal cell carcinoma. Lancet. 2009;373(9669):1119–1132. doi:10.1016/S0140-6736(09)60229-4
9. Lane BR, Samplaski MK, Herts BR, Zhou M, Novick AC, Campbell SC. Renal mass biopsy–a renaissance? J Urol. 2008;179(1):20–27. doi:10.1016/j.juro.2007.08.124
10. Coy H, Young JR, Pantuck AJ, et al. Association of tumor grade, enhancement on multiphasic CT and microvessel density in patients with clear cell renal cell carcinoma. Abdom Radiol. 2019;44(1):180–189. doi:10.1007/s00261-018-1688-8
11. Zhu YH, Wang X, Zhang J, Chen YH, Kong W, Huang YR. Low enhancement on multiphase contrast-enhanced CT images: an independent predictor of the presence of high tumor grade of clear cell renal cell carcinoma. AJR Am J Roentgenol. 2014;203(3):W295–300. doi:10.2214/AJR.13.12297
12. Wei J, Zhao J, Zhang X, et al. Analysis of dual energy spectral CT and pathological grading of clear cell renal cell carcinoma (ccRCC). PLoS One. 2018;13(5):e0195699. doi:10.1371/journal.pone.0195699
13. Zhang X, Wang Y, Yang L, et al. Delayed enhancement of the peritumoural cortex in clear cell renal cell carcinoma: correlation with Fuhrman grade. Clin Radiol. 2018;73(11):
14. Oh S, Sung DJ, Yang KS, et al. Correlation of CT imaging features and tumor size with Fuhrman grade of clear cell renal cell carcinoma. Acta Radiol. 2017;58(3):376–384. doi:10.1177/0284185116649795
15. Choi SY, Sung DJ, Yang KS, et al. Small (<4 cm) clear cell renal cell carcinoma: correlation between CT findings and histologic grade. Abdom Radiol. 2016;41(6):1160–1169. doi:10.1007/s00261-016-0732-9
16. Chen C, Kang Q, Wei Q, et al. Correlation between CT perfusion parameters and Fuhrman grade in pTlb renal cell carcinoma. Abdom Radiol (NY). 2017;42(5):1464–1471. doi:10.1007/s00261-016-1009-z
17. Palmowski M, Schifferdecker I, Zwick S, et al. Tumor perfusion assessed by dynamic contrast-enhanced MRI correlates to the grading of renal cell carcinoma: initial results. Eur J Radiol. 2010;74(3):e176–80. doi:10.1016/j.ejrad.2009.05.042
18. Woo S, Suh CH, Kim SY, Cho JY, Kim SH. Diagnostic performance of DWI for differentiating high- from low-grade clear cell renal cell carcinoma: a systematic review and meta-analysis. AJR Am J Roentgenol. 2017;209(6):W374–W381. doi:10.2214/AJR.17.18283
19. Mytsyk Y, Dutka I, Borys Y, et al. Renal cell carcinoma: applicability of the apparent coefficient of the diffusion-weighted estimated by MRI for improving their differential diagnosis, histologic subtyping, and differentiation grade. Int Urol Nephrol. 2017;49(2):215–224. doi:10.1007/s11255-016-1460-3
20. Bektas CT, Kocak B, Yardimci AH, et al. Clear cell renal cell carcinoma: machine learning-based quantitative computed tomography texture analysis for prediction of Fuhrman nuclear grade. Eur Radiol. 2019;29(3):1153–1163. doi:10.1007/s00330-018-5698-2
21. Lin F, Cui E, Lei Y, Luo L. CT-based machine learning model to predict the Fuhrman nuclear grade of clear cell renal cell carcinoma. Abdom Radiol. 2019;44(7):2528–2534. doi:10.1007/s00261-019-01992-7
22. Feng Z, Shen Q, Li Y, Hu Z. CT texture analysis: a potential tool for predicting the Fuhrman grade of clear-cell renal carcinoma. Cancer Imaging. 2019;19(1):6. doi:10.1186/s40644-019-0195-7
23. Deng Y, Soule E, Samuel A, et al. CT texture analysis in the differentiation of major renal cell carcinoma subtypes and correlation with Fuhrman grade. Eur Radiol. 2019;29(12):6922–6929. doi:10.1007/s00330-019-06260-2
24. Kocak B, Durmaz ES, Ates E, Kaya OK, Kilickesmez O. Unenhanced CT texture analysis of clear cell renal cell carcinomas: a machine learning-based study for predicting histopathologic nuclear grade. AJR Am J Roentgenol. 2019;W1–W8. doi:10.2214/AJR.18.20742
25. Ding J, Xing Z, Jiang Z, et al. CT-based radiomic model predicts high grade of clear cell renal cell carcinoma. Eur J Radiol. 2018;103:51–56. doi:10.1016/j.ejrad.2018.04.013
26. Shu J, Tang Y, Cui J, et al. Clear cell renal cell carcinoma: CT-based radiomics features for the prediction of Fuhrman grade. Eur J Radiol. 2018;109:8–12. doi:10.1016/j.ejrad.2018.10.005
27. Huhdanpaa H, Hwang D, Cen S, et al. CT prediction of the Fuhrman grade of clear cell renal cell carcinoma (RCC): towards the development of computer-assisted diagnostic method. Abdom Imaging. 2015;40(8):3168–3174. doi:10.1007/s00261-015-0531-8
28. van Griethuysen J, Fedorov A, Parmar C, et al. Computational radiomics system to decode the radiographic phenotype. Cancer Res. 2017;77(21):e104–e107. doi:10.1158/0008-5472.CAN-17-0339
29. Chawla NV, Bowyer KW, Hall LO, Kegelmeyer WP. SMOTE: synthetic minority over-sampling technique. J Artif Intell Res. 2002;16(16):321–357. doi:10.1613/jair.953
30. Ishigami K, Leite LV, Pakalniskis MG, Lee DK, Holanda DG, Kuehn DM. Tumor grade of clear cell renal cell carcinoma assessed by contrast-enhanced computed tomography. Springerplus. 2014;3(1):694. doi:10.1186/2193-1801-3-694
 © 2021 The Author(s). This work is published and licensed by Dove Medical Press Limited. The
full terms of this license are available at https://www.dovepress.com/terms
and incorporate the Creative Commons Attribution
- Non Commercial (unported, 3.0) License.
By accessing the work you hereby accept the Terms. Non-commercial uses of the work are permitted
without any further permission from Dove Medical Press Limited, provided the work is properly
attributed. For permission for commercial use of this work, please see paragraphs 4.2 and 5 of our Terms.
© 2021 The Author(s). This work is published and licensed by Dove Medical Press Limited. The
full terms of this license are available at https://www.dovepress.com/terms
and incorporate the Creative Commons Attribution
- Non Commercial (unported, 3.0) License.
By accessing the work you hereby accept the Terms. Non-commercial uses of the work are permitted
without any further permission from Dove Medical Press Limited, provided the work is properly
attributed. For permission for commercial use of this work, please see paragraphs 4.2 and 5 of our Terms.