Back to Journals » Clinical Ophthalmology » Volume 20
Multimodal Imaging of Yellow-White Transformation in Chorioretinal Hemorrhages: Structural and Biochemical Insights
Authors Tanaka T, Muraoka Y ![]() , Kogo T, Hama Y, Akiyama Y, Kadomoto S, Hata M, Ooto S, Tsujikawa A
, Kogo T, Hama Y, Akiyama Y, Kadomoto S, Hata M, Ooto S, Tsujikawa A ![]()
Received 16 October 2025
Accepted for publication 4 February 2026
Published 21 March 2026 Volume 2026:20 571106
DOI https://doi.org/10.2147/OPTH.S571106
Checked for plagiarism Yes
Review by Single anonymous peer review
Peer reviewer comments 2
Editor who approved publication: Dr Yousef Fouad
Tomotaro Tanaka, Yuki Muraoka, Takahiro Kogo, Yuki Hama, Yuki Akiyama, Shin Kadomoto, Masayuki Hata, Sotaro Ooto, Akitaka Tsujikawa
Department of Ophthalmology and Visual Sciences, Kyoto University Graduate School of Medicine, Kyoto, Japan
Correspondence: Yuki Muraoka, Department of Ophthalmology, Kyoto University Graduate School of Medicine, Sakyo-ku, Kyoto, 606-8507, Japan, Tel +011 81 75 751 3248, Fax +011 81 75 752 0933, Email [email protected]
Purpose: To investigate clinical and multimodal imaging characteristics of chorioretinal hemorrhages that undergo yellow-white transformation, focusing on optical coherence tomography (OCT) reflectivity and fundus autofluorescence (FAF).
Patients and Methods: Sixty-five eyes with acute hemorrhage due to polypoidal choroidal vasculopathy (n=30), ruptured retinal arterial macroaneurysm (n=30), or retinal vein occlusion (n=5), which were followed monthly until resolution or transformation at Kyoto University Hospital between 2015 and 2016, were retrospectively reviewed. Lesion depth was classified on OCT as preretinal, subinternal limiting membrane, intraretinal, subretinal, or subretinal pigment epithelium. Reflectivity and FAF intensity were normalized against internal references and compared between red and yellow-white lesions.
Results: Yellow-white transformation occurred most frequently in subretinal hemorrhages (18/47; 38.3%) and never within the neural retina. The mean time to transformation was 30– 40 days. Compared with red lesions, yellow-white lesions showed significantly higher OCT reflectivity (1.15 ± 0.33 vs 0.71 ± 0.29) and higher FAF intensity (1.13 ± 0.46 vs − 0.01 ± 0.24; both P < 0.001).
Conclusion: Yellow-white transformation reflects structural and biochemical remodeling occurring outside the sensory retina, most often in the subretinal compartment. The consistent OCT and FAF signatures likely reflect accumulation of hemoglobin degradation products or phagocyte-derived material, and may assist in distinguishing hemorrhagic remodeling from other clinically white-appearing fundus lesions.
Keywords: hemorrhagic remodeling, subretinal compartment, hemoglobin degradation, autofluorescence signature, reflectivity quantification
Introduction
Hemorrhagic lesions are a common manifestation of chorioretinal disease and are typically observed as red lesions on ophthalmoscopy.1–3 However, in some cases, they gradually change color from red to yellow-white.4,5 Such changes have previously been described using terms such as “dehemoglobinized”,6,7 “organized”,8 or “devitalized blood”,9 however, these expressions remain descriptive and lack precise clinicopathological correlations. The mechanisms underlying this color transformation, its anatomical predilection within the retinal and choroidal layers, and its clinical significance remain to be fully elucidated.
Advances in multimodal retinal imaging, particularly non-invasive optical coherence tomography (OCT) and fundus autofluorescence (FAF), now enable high-resolution characterization of the structural and biochemical properties of hemorrhagic lesions in vivo.10–12 FAF’s biochemical sensitivity combined with OCT’s structural detail is particularly suited for studying hemorrhagic remodeling. Therefore, the systematic evaluation of lesions that undergo yellow-white transformation may provide new insights into the remodeling process of extravasated blood and its interaction with retinal tissue. Furthermore, distinguishing these transformations from fibrosis and other pathological white lesions is clinically essential for accurate diagnosis and management. It may also provide prognostic information regarding the chronicity and remodeling stage of chorioretinal hemorrhage.
This study aimed to investigate the clinical and imaging characteristics of yellow-white hemorrhagic lesions associated with various chorioretinal diseases, focusing on their temporal course, anatomical distribution, OCT reflectivity, and FAF properties compared with red hemorrhagic lesions.
Materials and Methods
Patients
The Institutional Review Board of Kyoto University Graduate School of Medicine (Kyoto, Japan) (approval number: 0532) approved this retrospective observational study, and it adhered to the tenets of the Declaration of Helsinki. Written informed consent was obtained from all participants. We reviewed consecutive patients who presented to Kyoto University Hospital between January 2015 and December 2016 with acute-onset red chorioretinal hemorrhagic lesions detected on color fundus photography. Eligible cases were those with hemorrhages secondary to polypoidal choroidal vasculopathy (PCV), ruptured retinal arterial macroaneurysm (RAM), or retinal vein occlusion (RVO). Only treatment-naïve patients at the onset of hemorrhage were included, and the eyes were required to be followed up monthly until the hemorrhage had completely resolved or transformed into a yellow-white lesion and ultimately disappeared on color fundus photography. Eyes that required pars plana vitrectomy during follow-up were excluded. Eyes with other chorioretinal or retinal vascular diseases, inferior posterior staphyloma, pit-macular syndrome, uveitis, scleritis, ocular hypertension > 21 mmHg or hypotension < 5 mmHg, or a history of intraocular surgery other than uncomplicated cataract surgery were also excluded. Additional exclusion criteria included keratoconus, high myopia (spherical equivalent < −6.0 D), hyperopia (> +4.0 D), astigmatism (> ±3.0 D), pregnancy, and poor-quality OCT images (signal strength index < 5) due to unstable fixation, eye movement, or media opacity.
At baseline, all patients underwent a comprehensive ophthalmic evaluation that included refraction, best-corrected visual acuity (BCVA) measured using a 5-m Landolt C chart, intraocular pressure, axial length, slit-lamp biomicroscopy, color fundus photography, OCT, and FAF. Follow-up examinations were performed monthly and included color fundus photography, OCT, and FAF. Refractive error was measured with an autorefractor (ARK-530A; NIDEK, Gamagori, Japan), and the spherical equivalent was calculated as the spherical power plus half of the cylindrical power. Axial length was measured using an optical biometer (IOLMaster 700; Carl Zeiss Meditec, Dublin, CA, USA). Color fundus photographs were obtained using a fundus camera (TRC-50LX; Topcon, Tokyo, Japan), and spectral-domain OCT and FAF images were acquired using the Spectralis HRA+OCT system (Heidelberg Engineering, Heidelberg, Germany).
Classification of Hemorrhagic Lesions
To determine the depth of the hemorrhagic lesions, a horizontal OCT B-scan within the 30° × 30° macular cube that traversed the widest horizontal diameter of each lesion was selected. Based on this scan, the lesions were classified into five categories: preretinal (anterior to the internal limiting membrane [ILM]), sub-ILM (between the ILM and the inner border of the retinal nerve fiber layer [RNFL]), intraretinal (between the RNFL and the outer retina), subretinal (between the outer retina and the retinal pigment epithelium [RPE]), and sub-RPE (beneath the RPE).
Quantification of Hemorrhagic Lesion Reflectivity on OCT
For quantitative assessment, the reflectivity of each lesion was measured according to previously published methods,13–16 with the vitreous body and RNFL used as internal references (Figure 1). The vitreous body was defined as reference level 0 and RNFL as reference level 1, based on their mean reflectivity. The normalized reflectivity of a lesion was calculated as follows: (lesion reflectivity – vitreous body reflectivity)/(RNFL reflectivity – vitreous body reflectivity). All measurements were independently performed by two masked retinal specialists (TT and SK), and any discrepancies were resolved by consensus with a third senior grader (YM).
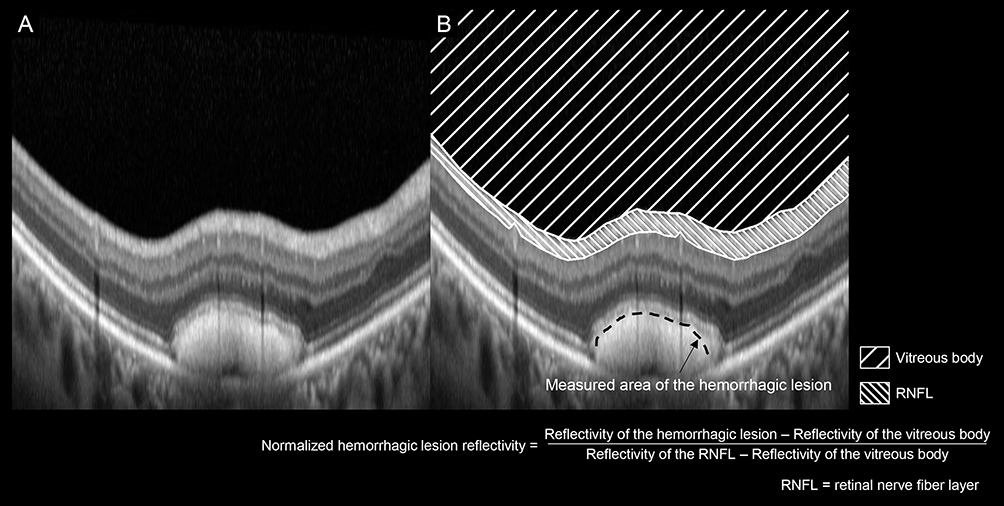 |
Figure 1 Evaluation of optical coherence tomography (OCT) reflectivity in hemorrhagic lesions. (A) A horizontal OCT B-scan within the 30° × 30° macular cube that traversed the widest horizontal diameter of each hemorrhagic lesion was selected. (B) The reflectivity of the lesion surface was measured. The mean reflectivities of the vitreous body and retinal nerve fiber layer (RNFL) in each image were used as internal references, with the vitreous body defined as level 0 and the RNFL as level 1. |
Quantification of Hemorrhagic Lesion Intensity on Fundus Autofluorescence
FAF images were analyzed to compare the autofluorescence characteristics between red and yellow-white lesions (Figure 2). The optic disc, which exhibits minimal autofluorescence,17 was defined as reference level 0, and the normal extrafoveal retina, located > 3 mm from the fovea and free of vessels or hemorrhage, was defined as reference level 1. For each lesion, three circular regions of interest with a diameter of 200 μm were randomly placed within the hemorrhage, and the mean intensity values were recorded. Reference intensities were also obtained from the optic disc and five randomly selected regions in the extrafoveal retina. The normalized FAF intensity of each lesion was calculated as follows: (lesion intensity – disc intensity)/(extrafoveal retinal intensity – disc intensity).
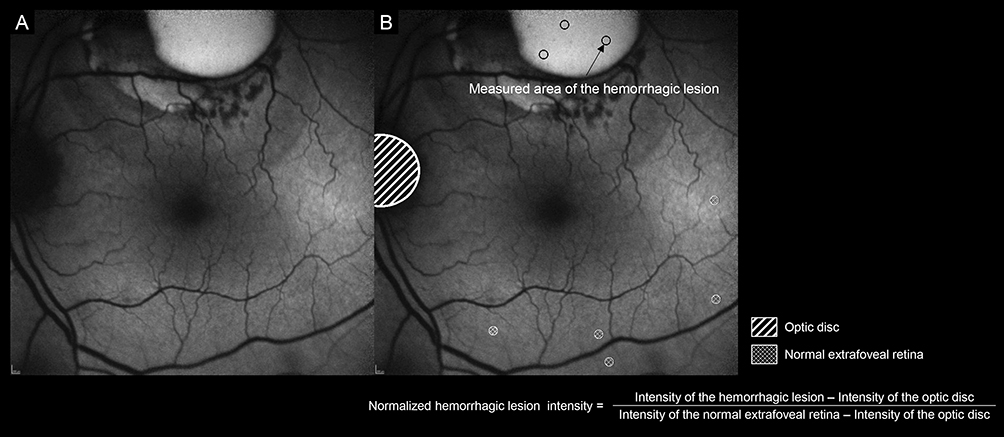 |
Figure 2 Evaluation of fundus autofluorescence (FAF) intensity in hemorrhagic lesions. (A) An FAF image was obtained within the 30° × 30° area centered on the fovea. (B) For each lesion, the mean intensity of three randomly placed circular regions of interest (diameter, 200 μm) was measured. The mean intensity of the optic disc and five randomly selected regions in the normal extrafoveal retina (located >3 mm from the fovea and free of vessels or hemorrhage) were also measured. The optic disc was defined as level 0 and the extrafoveal retina as level 1. |
Statistical Analysis
Images were quantitatively analyzed using ImageJ software (version 1.51, National Institutes of Health, Bethesda, MD, USA). All statistical analyses were performed using JMP Pro version 16.0 (SAS Institute Inc., Cary, NC, USA). Data are presented as mean ± standard deviation: BCVA was converted to the logarithm of the minimum angle of resolution (logMAR). Paired comparisons between red and yellow-white hemorrhagic lesions were performed using the Wilcoxon signed-rank test. A two-tailed P-value < 0.05 was considered statistically significant.
Results
Sixty-five eyes of 65 patients (32 men and 33 women; mean age 74.1 ± 8.2 years) with acute red hemorrhagic lesions were analyzed (Table 1). The cohort included 30 eyes with PCV, 30 with RAM, and 5 with RVO. Based on OCT classification, hemorrhages were located in the preretinal, sub-ILM, intraretinal, subretinal, and sub-RPE spaces in 7, 17, 40, 47, and 24 eyes, respectively. All hemorrhagic lesions resolved within 3 months, either by complete absorption or by transformation into yellow-white lesions.
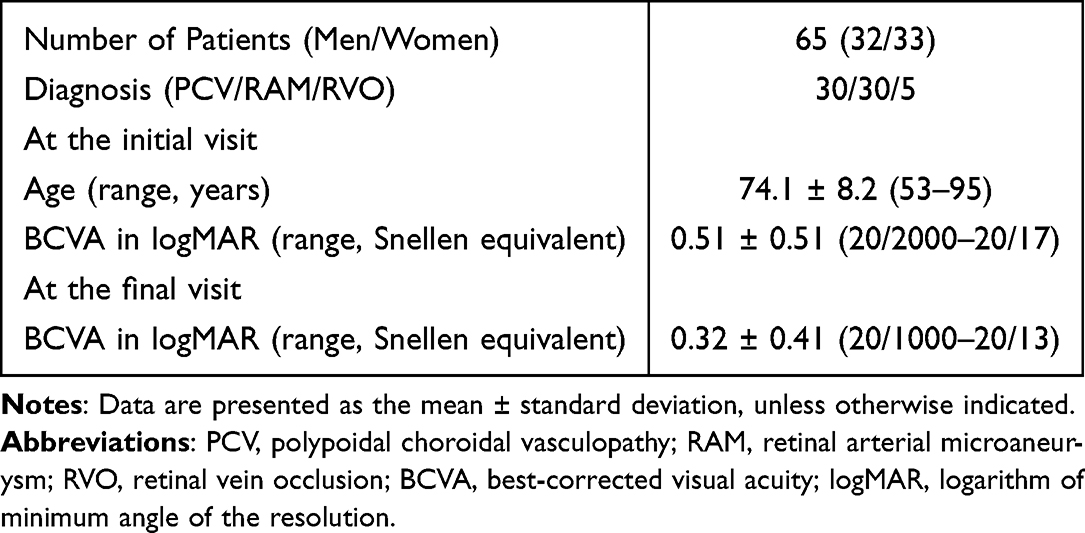 |
Table 1 Characteristics of Patients with Red Hemorrhagic Lesions |
The clinical course differed according to hemorrhage depth (Figure 3). Subretinal hemorrhages most frequently transformed into yellow-white lesions (18/47 eyes, 38.3%), whereas intraretinal hemorrhages resolved exclusively by absorption without transformation.
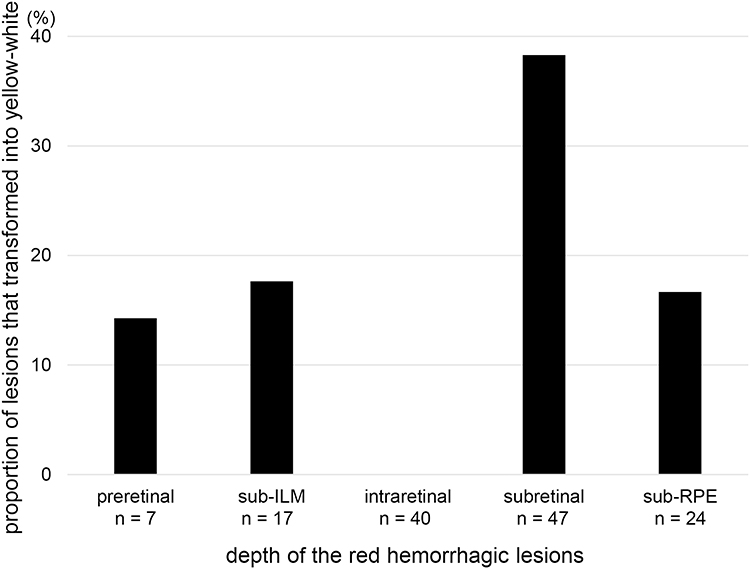 |
Figure 3 Transformation rate of hemorrhagic lesions according to depth. Proportion of red hemorrhagic lesions that transformed into yellow-white lesions stratified by OCT depth classification. Subretinal hemorrhages showed the highest transformation rate (18/47 eyes, 38.3%), whereas intraretinal hemorrhages resolved exclusively by absorption without transformation. Preretinal, sub-ILM, and sub-RPE hemorrhages demonstrated lower transformation rates. Abbreviations: OCT, optical coherence tomography; ILM, internal limiting membrane; RPE, retinal pigment epithelium. |
Quantitative image analysis demonstrated consistent changes after transformation. On OCT, lesion reflectivity was significantly higher in yellow-white lesions than in red lesions (1.15 ± 0.33 vs 0.71 ± 0.29; P < 0.001; Figure 4). Similarly, on FAF, normalized lesion intensity increased significantly after transformation (−0.01 ± 0.24 vs. 1.13 ± 0.46; P < 0.001; Figure 5).
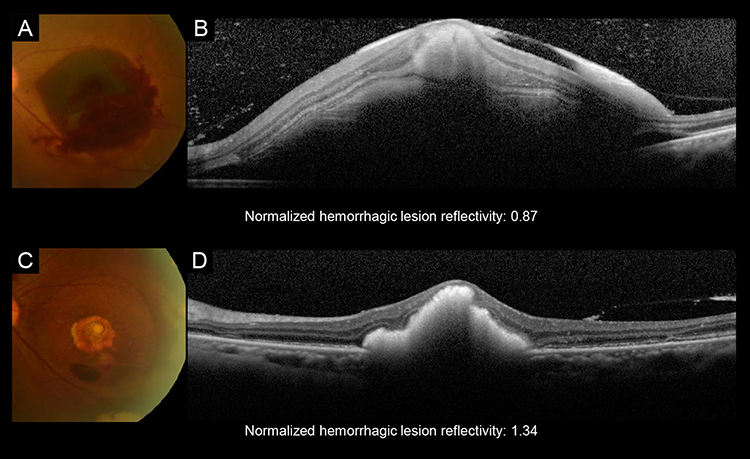 |
Figure 4 Representative case showing changes in optical coherence tomography (OCT) reflectivity after transformation of a hemorrhagic lesion. (A and B) Color fundus photograph and OCT image of a red hemorrhagic lesion at baseline. The normalized lesion reflectivity was 0.87. (C and D) Follow-up images of the same eye after transformation to a yellow-white lesion. The normalized lesion reflectivity increased to 1.34. These findings illustrate the significant increase in OCT reflectivity accompanying the transformation from a red hemorrhagic lesion to a yellow-white lesion. |
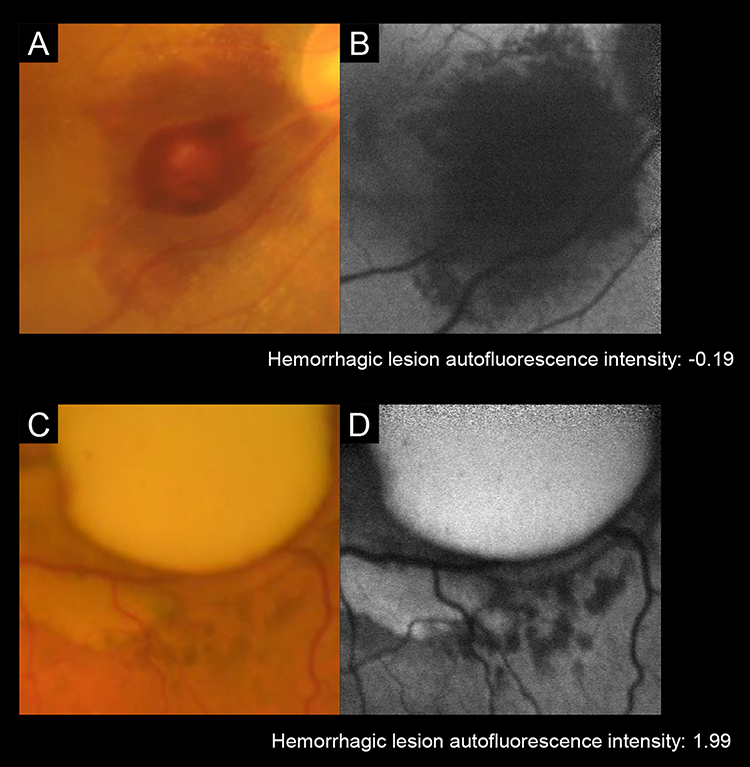 |
Figure 5 Representative cases showing changes in fundus autofluorescence (FAF) intensity after transformation of a hemorrhagic lesion. (A and B) Color fundus photograph and FAF image of a red hemorrhagic lesion at baseline. The normalized lesion autofluorescence intensity was −0.19. (C and D) Follow-up images of a different case after transformation into a yellow-white lesion. The autofluorescence intensity of the normalized lesion increased to 1.99. These findings demonstrate the marked increase in the FAF signal accompanying the transformation from a red hemorrhagic lesion to a yellow-white lesion. |
Discussion
This study aimed to characterize the yellow-white transformation of chorioretinal hemorrhages using OCT and FAF. We observed that this transformation was confined to sites outside the sensory retina, most frequently in the subretinal space, and was generally accompanied by increases in OCT reflectivity and FAF hyperautofluorescence. These findings indicate that the yellow-white appearance of hemorrhagic lesions may reflect underlying structural and biochemical changes rather than mere ophthalmoscopic color perception.
Although previous studies used descriptive terms such as “dehemoglobinized” or “organized” hemorrhage, the precise mechanisms remain uncertain. In the present series, intraretinal hemorrhages resolved solely by absorption without yellow-white transformation, suggesting that the local environment influences this process. More efficient clearance mechanisms, potentially facilitated by closer proximity to the retinal vasculature, may prevent the accumulation of hemoglobin degradation products that lead to yellow-white changes. Compartments such as the subretinal and sub-RPE spaces may provide conditions that allow blood to accumulate, undergo gradual degradation, and interact with resident phagocytic cells. Experimental studies have demonstrated macrophage uptake of subretinal erythrocytes beginning approximately 2 weeks after hemorrhage,18 a timeline that is broadly consistent with our clinical observation of transformation within approximately 1 month. The accompanying increase in the FAF signal may be explained by hemoglobin degradation products or lipid-laden macrophages, both of which have been reported to exhibit autofluorescence.19,20
Clinically, white fundus lesions are generally expected to appear hyperautofluorescent. However, this is not always the case; cotton-wool spots and fibrotic scars, for example, often demonstrate hypoautofluorescence.21,22 Therefore, the relatively consistent hyperautofluorescence observed in the present cohort may represent a characteristic—though not exclusive—feature of hemorrhagic remodeling. Recognition of this pattern may assist in distinguishing evolving hemorrhagic lesions from other white-appearing abnormalities of the fundus. Furthermore, as these imaging changes indicate chronicity, they may provide valuable guidance in determining the optimal timing for acute-phase interventions, such as anti-VEGF therapy.
Some limitations of this study merit further consideration. First, the retrospective design and the exclusion of eyes requiring vitrectomy may have introduced selection bias, potentially limiting the external validity of the findings. Second, although the overall cohort included 65 eyes, the sample size was modest and unevenly distributed across disease entities, with a particularly small number of RVO cases. This limited statistical power precluded reliable disease-specific subgroup analyses and may have reduced the ability to detect subtle but clinically relevant differences.
Nevertheless, importantly, this study was not designed to compare hemorrhagic characteristics among different diseases, but to evaluate layer-specific color transformation of chorioretinal hemorrhages using multimodal imaging. From this perspective, the consistent OCT and FAF findings observed across retinal layers support the internal validity of the results. Future prospective studies with larger and more balanced cohorts are needed to confirm these findings and further explore disease-specific differences.
Although the optic disc was used as a reference region for fundus autofluorescence due to its generally low autofluorescence signal, pathological changes of the optic nerve head could have potentially influenced the reference values. Future studies should therefore explore alternative reference regions to further validate this approach. Nonetheless, the internally consistent findings across multimodal imaging modalities support the robustness of the present results.
Conclusion
In summary, the yellow-white transformation of chorioretinal hemorrhage appears to reflect a sequence of structural and biochemical changes occurring outside the sensory retina, most often in the subretinal compartment. This process was generally accompanied by increased OCT reflectivity and FAF hyperautofluorescence, features that are not uniformly shared by other white-appearing fundus lesions. Awareness of this pattern may be clinically useful for differentiating hemorrhagic lesions in evolution and may provide further insight into the remodeling of extravasated blood in chorioretinal disease.
Data Sharing Statement
The datasets generated and/or analyzed during the current study are available from the corresponding author on reasonable request.
Ethics Approval and Consent to Participate
The current observational study was approved by the Institutional Review Board of Kyoto University Graduate School of Medicine (Kyoto, Japan) (approval number: 0532) and adhered to the tenets of the Declaration of Helsinki. Written informed consent was obtained from all patients.
Author Contributions
All authors made a significant contribution to the work reported, either in the conception, study design, execution, acquisition of data, analysis and interpretation, or in all these areas; took part in drafting, revising or critically reviewing the article; gave final approval of the version to be published; have agreed on the journal to which the article has been submitted; and agree to be accountable for all aspects of the work.
Funding
There is no funding to report.
Disclosure
None of the authors has proprietary interest in any product described in the article. Y. Muraoka: Alcon Japan, Novartis Pharma, Bayer Yakuhin, Senju Pharmaceutical, Canon, Santen Pharmaceutical, AMO Japan, HOYA, Johnson & Johnson; T. Kogo: Canon; M. Hata: Alcon Research Institute, Bayer Yakuhin, Chugai Pharmaceutical, Takeda Science Foundation, Shimadzu Corporation, BrightFocus Foundation, Senju Pharmaceutical, Novartis Pharma, Boehringer Ingelheim, Santen Pharmaceutical; S. Ooto: Bayer Yakuhin, Novartis Pharma, Janssen Pharmaceutical, Kowa Pharmaceutical, AMO Japan, Santen Pharmaceutical, Alcon Japan, Senju Pharmaceutical, Chugai Pharmaceutical, HOYA; A. Tsujikawa: Canon, Findex, Santen Pharmaceutical, Sumitomo Pharma, Astellas, Otsuka Pharmaceutical, Senju Pharmaceutical, Alcon Japan, Wakamoto Pharmaceutical, Chugai Pharmaceutical, HOYA, ROHTO NITTEN, Novartis Pharma, Bayer Yakuhin, AMO Japan, Kowa Company, MSD, Kowa Pharmaceutical, Johnson & Johnson, ROHTO Pharmaceutical, Boehringer Ingelheim, Janssen Pharmaceutical, Kyowa Kirin. The authors report no other conflicts of interest in this work.
References
1. Ueda-Arakawa N, Tsujikawa A, Yamashiro K, Ooto S, Tamura H, Yoshimura N. Visual prognosis of eyes with submacular hemorrhage associated with exudative age-related macular degeneration. Jpn J Ophthalmol. 2012;56(6):589–8. doi:10.1007/s10384-012-0191-y
2. Kitagawa Y, Kawamorita A, Shimada H, Nakashizuka H. Treatment of macular hemorrhage in retinal arterial microaneurysm: anatomic site-oriented therapy. Jpn J Ophthalmol. 2019;63(2):186–196. doi:10.1007/s10384-019-00653-y
3. Muraoka Y, Tsujikawa A, Murakami T, Ogino K, Miyamoto K, Yoshimura N. Branch retinal vein occlusion-associated subretinal hemorrhage. Jpn J Ophthalmol. 2013;57(3):275–282. doi:10.1007/s10384-013-0236-x
4. Yokoyama S, Kaga T, Kojima T, Orellana-Rios J, Smith RT, Ichikawa K. Treatment of old submacular hemorrhage by subretinal endoscopic surgery and intraoperative subretinal endoscopic findings. Am J Ophthalmol Case Rep. 2022;25:101393. doi:10.1016/j.ajoc.2022.101393
5. Hussnain SA, Dolz-Marco R, Dunaief JL, Curcio CA, Freund KB. Speckled hypoautofluorescence as a sign of resolved subretinal hemorrhage in neovascular age-related macular degeneration. Retina. 2019;39(10):1925–1935. doi:10.1097/IAE.0000000000002367
6. Hochman MA, Seery CM, Zarbin MA. Pathophysiology and management of subretinal hemorrhage. Surv Ophthalmol. 1997;42(3):195–213. doi:10.1016/s0039-6257(97)00089-1
7. Li M, Dolz-Marco R, Messinger JD, Ferrara D, Freund KB, Curcio CA. Neurodegeneration, gliosis, and resolution of haemorrhage in neovascular age-related macular degeneration, a clinicopathologic correlation. Eye. 2021;35(2):548–558. doi:10.1038/s41433-020-0896-y
8. Schmitz-Valckenberg S, Pfau M, Fleckenstein M, et al. Fundus autofluorescence imaging. Prog Retin Eye Res. 2021;81:100893. doi:10.1016/j.preteyeres.2020.100893
9. Sawa M, Ober MD, Spaide RF. Autofluorescence and retinal pigment epithelial atrophy after subretinal hemorrhage. Retina. 2006;26(1):119–120. doi:10.1097/00006982-200601000-00025
10. Hayamizu R, Totsuka K, Azuma K, et al. Optical coherence tomography findings after surgery for sub-inner limiting membrane hemorrhage due to ruptured retinal arterial macroaneurysm. Sci Rep. 2022;12(1):16321. doi:10.1038/s41598-022-20949-3
11. Fukuda Y, Nakao S, Kohno RI, et al. Postoperative follow-up of submacular hemorrhage displacement treated with vitrectomy and subretinal injection of tissue plasminogen activator: ultrawide-field fundus autofluorescence imaging in gas-filled eyes. Jpn J Ophthalmol. 2022;66(3):264–270. doi:10.1007/s10384-022-00910-7
12. Bae K, Cho GE, Yoon JM, Kang SW. Optical coherence tomographic features and prognosis of pneumatic displacement for submacular hemorrhage. PLoS One. 2016;11(12):e0168474. doi:10.1371/journal.pone.0168474
13. Hirota Y, Muraoka Y, Kogo T, et al. Association of retinal pigment epithelium reflectivity on optical coherence tomography with recurrence of Vogt-Koyanagi-Harada disease: a retrospective observational study. Clin Ophthalmol. 2023;17:2071–2079. doi:10.2147/OPTH.S419546
14. Xiang R, Muraoka Y, Kogo T, et al. OCT-based retinal vasculature analysis: age, sex, and body mass index associations in the Nagahama study, a Large Japanese cohort. Ophthalmol Sci. 2025;5(4):100740. doi:10.1016/j.xops.2025.100740
15. Horii T, Murakami T, Nishijima K, et al. Relationship between fluorescein pooling and optical coherence tomographic reflectivity of cystoid spaces in diabetic macular edema. Ophthalmology. 2012;119(5):1047–1055. doi:10.1016/j.ophtha.2011.10.030
16. Murakami T, Nishijima K, Akagi T, et al. Optical coherence tomographic reflectivity of photoreceptors beneath cystoid spaces in diabetic macular edema. Invest Ophthalmol Vis Sci. 2012;53(3):1506–1511. doi:10.1167/iovs.11-9231
17. Samy A, Lightman S, Ismetova F, Talat L, Tomkins-Netzer O. Role of autofluorescence in inflammatory/infective diseases of the retina and choroid. J Ophthalmol. 2014;2014:418193. doi:10.1155/2014/418193
18. Koshibu A. Ultrastructural studies on absorption of experimentally produced subretinal hemorrhage. I. Erythrophagocytosis at the early stage (author’s transl). Nippon Ganka Gakkai Zasshi. 1978;82(6):428–441.
19. Htun NM, Chen YC, Lim B, et al. Near-infrared autofluorescence induced by intraplaque hemorrhage and heme degradation as marker for high-risk atherosclerotic plaques. Nat Commun. 2017;8(1):75. doi:10.1038/s41467-017-00138-x
20. Knab A, Giardina C, Grey ST, Goldys EM, Campbell JM. Illuminating immunity: a systematic review of immune cell autofluorescence. J Biophotonics. 2025;18(6):e202400576. doi:10.1002/jbio.202400576
21. Tsukikawa M, Stacey AW. A review of hypertensive retinopathy and chorioretinopathy. Clin Optom. 2020;12:67–73. doi:10.2147/OPTO.S183492
22. Chen L, Messinger JD, Ferrara D, Freund KB, Curcio CA. Fundus autofluorescence in neovascular age-related macular degeneration: a clinicopathologic correlation relevant to macular atrophy. Ophthalmol Retina. 2021;5(11):1085–1096. doi:10.1016/j.oret.2021.01.012
 © 2026 The Author(s). This work is published and licensed by Dove Medical Press Limited. The
full terms of this license are available at https://www.dovepress.com/terms
and incorporate the Creative Commons Attribution
- Non Commercial (unported, 4.0) License.
By accessing the work you hereby accept the Terms. Non-commercial uses of the work are permitted
without any further permission from Dove Medical Press Limited, provided the work is properly
attributed. For permission for commercial use of this work, please see paragraphs 4.2 and 5 of our Terms.
© 2026 The Author(s). This work is published and licensed by Dove Medical Press Limited. The
full terms of this license are available at https://www.dovepress.com/terms
and incorporate the Creative Commons Attribution
- Non Commercial (unported, 4.0) License.
By accessing the work you hereby accept the Terms. Non-commercial uses of the work are permitted
without any further permission from Dove Medical Press Limited, provided the work is properly
attributed. For permission for commercial use of this work, please see paragraphs 4.2 and 5 of our Terms.
Recommended articles
Spotlight on Lattice Degeneration Imaging Techniques
Maltsev DS, Kulikov AN, Shaimova VA, Burnasheva MA, Vasiliev AS
Clinical Ophthalmology 2023, 17:2383-2395
Published Date: 16 August 2023
Idiopathic Acute Exudative Polymorphous Vitelliform Maculopathy: A Case Report
Faria Pereira A, Tavares-Ferreira J, Santos-Silva R, Oliveira-Ferreira C
International Medical Case Reports Journal 2025, 18:255-263
Published Date: 17 February 2025
Central Corneal Thickness Measurement in Patients with Glaucoma and Glaucoma Suspects by Spectral-Domain and Swept-Source Optical Coherence Tomography Compared with the Standard Ultrasonic Method
Machado Luz P, Lubisco VM, Leivas Lindenmeyer R, Swarovsky AP, Back da Silva A, D´Azevedo Silveira V, Silva MO, Schopf C, Lavinsky J, Lavinsky D, Pakter HM, Lavinsky F
Clinical Ophthalmology 2025, 19:819-825
Published Date: 10 March 2025