Back to Journals » Clinical Ophthalmology » Volume 17
Spotlight on Lattice Degeneration Imaging Techniques
Authors Maltsev DS ![]() , Kulikov AN, Shaimova VA, Burnasheva MA, Vasiliev AS
, Kulikov AN, Shaimova VA, Burnasheva MA, Vasiliev AS
Received 31 May 2023
Accepted for publication 10 August 2023
Published 16 August 2023 Volume 2023:17 Pages 2383—2395
DOI https://doi.org/10.2147/OPTH.S405200
Checked for plagiarism Yes
Review by Single anonymous peer review
Peer reviewer comments 3
Editor who approved publication: Dr Scott Fraser
Supplementary video of "Lattice degeneration imaging techniques" [ID 405200].
Views: 972
Dmitrii S Maltsev,1 Alexei N Kulikov,1 Venera A Shaimova,2,3 Maria A Burnasheva,1 Alexander S Vasiliev1
1Department of Ophthalmology, Military Medical Academy, St. Petersburg, Russia; 2Academy of Postgraduate Education of the Federal Scientific and Clinical Center of Specialized Medical Care and Medical Technologies, Moscow, Russia; 3“Center Zreniya”, Chelyabinsk, Russia
Correspondence: Dmitrii S Maltsev, Department of Ophthalmology, Military Medical Academy, 21, Botkinskaya Street, St. Petersburg, 194044, Russia, Email [email protected]
Abstract: Lattice degeneration (LD), routinely diagnosed with indirect ophthalmoscopy, is one of the most common and clinically significant peripheral retinal findings. In this review, we have summarized the data on currently available imaging techniques which help to improve diagnosis and our understanding of LD pathogenesis. Ultra-wide field imaging provides reliable color fundus capturing for the primary diagnosis of LD and may also be used as a screening tool. Wide-field imaging can be used for targeted documentation of LD lesions using true colors and with minimal optical distortions. Information on the status of the vitreoretinal interface, including detection of retinal holes, detachments, and vitreous tractions, can be obtained with peripheral structural optical coherence tomography (OCT) or scanning laser ophthalmoscopy in retro-mode. These techniques clarify the associated risks of rhegmatogenous retinal detachment. Fundus autofluorescence can provide details on atrophic changes. However, the risk of retinal detachment by means of this technique requires further investigation. OCT angiography may be successfully performed for some lesions. Taken together, OCT and OCT angiography demonstrate thinning of the choroid, alteration of local choroidal microcirculation, and, in severe lesions, involvement of the sclera. OCT angiography confirms loss of retinal microcirculation within LD lesion, which was previously shown with fluorescein angiography. In conclusion, despite relatively simple primary diagnosis, imaging of LD lesions remains challenging due to their peripheral localization. However, several new strategies, including ultra-wide field imaging, peripheral OCT, and scanning laser ophthalmoscopy, make LD imaging possible on a routine basis, improving diagnosis and understanding of LD pathogenesis.
Keywords: lattice degeneration, ultra-wide field imaging, scanning laser ophthalmoscopy, optical coherence tomography angiography, optical coherence tomography, choroid, peripheral retinal degeneration, multimodal imaging, retinal detachment
Introduction
Lattice degeneration (LD) appears as circumscribed peripheral lesions exposing glinting flecks, white vessels, pigmentary clusters, and atrophy in various combinations. The prevalence of LD in the population is estimated to be around 10%.1
The pattern of lesions varies. Typically, they appear as multiple concentric lesions, while, in some cases, demonstrate perivascular distribution. Their borders may be sharp or blurred, with vitreous adhesion and liquified vitreous above the lesion. The extent of the lesions varies from tiny lesions to those extending over the entire quadrant. For elongated lesions, the width measures from ¼ to 1 optic disc diameter. Typical distribution appears as a patching pattern within the equatorial area, rarely affecting the central region or the ora serrata. The lesions mostly occupy temporal quadrants with a tendency to localize close to vertical meridians.2
The clinical significance of LD results from the increased risk of rhegmatogenous retinal detachment (RRD) in eyes with LD. Among several features of LD, vitreous adhesion at the borders of the lesion likely plays the most important role followed by retinal thinning. Both together lead to retinal breaks formation. This explains the relatively low risk of RRD from other forms of peripheral retinal degenerations not associated with vitreous changes, such as snail track degeneration. The population prevalence of LD is in high contrast with the annual rate of RRD which does not exceed 0.01–0.02%.3–5 This raises the discussion as to the need for laser prophylaxis for asymptomatic LD. However, the cumulation of other risk factors, including axial myopia, age-related vitreous changes, and intraocular surgery may substantially increase the risk of RRD in eyes with LD.6 This explains why the rate of occurrence of RRD in eyes with LD may be as much as 0.7%, and why up to 40% of RRD cases may have LD lesions as the basic cause of the detachment.1
Histopathological examination reveals neurosensory retina thinning, intraretinal pigmentary granules, hyalinized vessels, and U-shaped vitreous adhesion within the lesion with liquefied vitreous above it.1,7
Traditionally, indirect ophthalmoscopy is considered to be sufficient for a reliable diagnosis of LD so other imaging techniques, such as color photography or optical coherence tomography (OCT), are not routinely used to display LD lesions. At the same time, recent advances in posterior eye segment imaging may reveal more information on this condition.8 The role of multimodal imaging in evaluating LD lesions can be considered in two ways. Firstly, its clinical value is defined by an opportunity for precise stratification of risks of RRD from previously diagnosed lesions and an improved detection rate of lesions unrevealed by conventional diagnostics. Secondly, multimodal imaging with a large study population may shed light on the pathogenesis of LD which remains understudied.
In this review, we have summarized data on different imaging techniques in LD, their clinical utility, and the impact on our understanding of LD etiology.
Imaging Techniques
Wide-Field Imaging
Color fundus photography may be an appropriate tool for documentation and follow-up of LD lesions. However, conventional color fundus photography is not appropriate for the primary diagnosis of LD lesions since it can capture only those previously detected with indirect ophthalmoscopy. Moreover, it provides no additional diagnostic information and is not able to capture lesions at the extreme periphery. In contrast, ultra-wide field (UWF) photography is able to capture retinal periphery and can be used as a part of multimodal diagnosing since it displays the majority of LD lesions and may be used as a screening tool instead of conventional ophthalmoscopy. The utility of such approach is still under research.
In particular, Liu and coauthors have shown that, as a part of the screening, UWF may reveal up to 89% of LD lesions diagnosed with three-mirror lens (p > 0.05) in a cohort of LASIK candidates. This detection rate was higher than that of mydriatic slit-lamp examination with 90 D lens, at 56% a statistically significant difference (p = 0.03).9
Yang using UWF showed somewhat different results. They showed high specificity (99.5%) and moderate sensitivity (65.9%) in identifying and recording peripheral LD lesions in high myopes during preoperative examination as compared with Goldmann three-mirror contact lens examination. Analysis of UWF images by two graders showed high agreement at 96.3%.10
However, the weakness of UWF images obtained with scanning laser ophthalmoscopy (SLO) the distortion of the retinal periphery and unnatural colors. Also, with a broader field of view some details of the lesion structure might be indistinguishable. At the same time, the detection rate for the lesions with breaks is the same for UWF images obtained with SLO and true color WFI fundus camera.11
Artificial Intelligence in the Diagnosis of Lattice Degeneration
Since LD is highly distributed in the population, screening approaches for the detection of these lesions could be useful for candidates for intraocular or refractive surgery. Artificial intelligence may therefore be a useful tool for reducing the clinical burden of preoperative examination.
The potential of artificial intelligence in diagnosis of LD has been demonstrated using UWF images. The dataset consisted of 2622 UWF images, containing 22,601 retinal lesions, 90% of which were organized in training sets. In this study, the improved YOLOX, a SOTA object detection model, was used to locate and classify peripheral retinal lesions. Accuracy, sensitivity, specificity, precision, F1 measure, and average precision in detection of LD lesions was as high as 96.0%, 82.7%, 96.7%, 85.6%, 84.1%, and 83.3%, respectively. High-quality images are required for this approach, however.12
Another study based on a deep learning algorithm with a multilabel classifier using UWF images showed average accuracy, sensitivity, specificity, the area under the ROC curve (AUROC), and F1 score in detection of LD lesions as high as 90.1%, 88.1%, 90.5%, 95.5%, and 73.2, respectively. In general, due to their notable morphological characteristics, including pigmentary changes and white lines, LD lesions have one of the highest AUROC following retinal detachment.13
One more feasible deep learning system based on Optos Daytona images had AUROC of 0.888, 0.953 and 1.000 for detection of LD, retinal breaks, and retinal detachment, respectively. The referral accuracy was 79.8% compared to the reference standard.14
In the test set, one of the best deep learning systems for identifying LD lesions and retinal breaks cumulatively achieved AUROC of 0.999 with a sensitivity and specificity of 98.7% and 99.2%, respectively. The best preprocessing method was the application of original image augmentation which showed AUROC of 0.996 in LD detection.15
In general, UWFI, with or without artificial intelligence, is a clinically relevant tool in diagnosing and documenting LD lesions.
Fundus Autofluorescence
Since fundus autofluorescence (FAF) mostly provides information on the status of retinal pigment epithelium (RPE), the clinical significance of LD imaging with FAF seems limited. However, a few studies report autofluorescence pattern in LD eyes. Due to the loss of RPE and the appearance of RPE deposits, LD lesion may demonstrate hypoautofluorescent signals which allows them to be more easily detected with FAF compared to color WFI.16 In addition to inner hypointense signals, the neighboring retina reveals some hyperintense autofluorescence. With FAF, the exact borders of the lesion are less apparent since they have relatively intact RPE. Mild lesions demonstrate mostly hyperintense signal.17 In general, FAF seems to demonstrate atrophic and pigmentary changes associated with some LD lesion (Figure 1). Further study may clarify the risks of retinal detachment from LD lesions of various FAF patterns.
 |
Figure 1 Wide-field color fundus photography and green-light fundus autofluorescence in lattice degeneration. (A) Color fundus photography of a highly pigmented perivascular lesion (arrowhead). (B) Color fundus photography of a moderately pigmented concentrical LD lesion (arrowhead) with chorioretinal atrophy (asterisk). (C) Color fundus photography of a mildly pigmented concentrical lesion (arrowhead). (D) Fundus autofluorescence shows hypointense signal from a highly pigmented perivascular lesion in (A). (E) Fundus autofluorescence shows hypointense signal from pigmented (arrowhead) and atrophic (asterisk) areas within the lesion in (B). (F) Fundus autofluorescence shows hypointense signal from the central part of the lesion in (C), while borders of the lesion are slightly hyperintense (asterisk). |
Fluorescein Angiography
Although fluorescein angiography (FA) is not applied routinely in LD diagnosis, some data has been obtained from early studies. FA is not able to provide clinically relevant information on LD lesions because does not display vitreoretinal interface status.
Mild LD lesions show no significant changes on FA. Moderate and severe lesions demonstrate decreased retinal perfusion or non-perfusion within the lesion; retinal arterioles were visible before posterior border of the lesion and were narrow and poorly differentiated within the lesion (Figure 2). In severe lesion, arterioles were completely obstructed along the posterior border of the lesion. Arteriolar branches supplying undamaged retina around the lesion demonstrated normal filling that suggests only local involvement of the vessels. Retinal venules in general showed similar changes with no perfused vessels within the lesion and maintained perfusion around the lesion. No dye leakage was observed within the lesion.18
 |
Figure 2 Multimodal imaging in lattice degeneration. (A) Color fundus photography demonstrates multiple concentrical mildly pigmented (white arrowheads) and nonpigmented (black arrowhead) lesions. (B) Green-light fundus autofluorescence shows hypointense signal from mildly pigmented lesions (white arrowheads) and hyperintense signal (black arrowhead) from nonpigmented lesion. (C) Wide-field fluorescein angiography shows granular fluorescence of multiple lesions. White box indicates position of image in (D). Dashed box indicates position of the image in (E). (D) High-magnification image captured in early phase of fluorescein angiography shows loss of terminal vessels (arrowheads) and peripheral retinal nonperfusion behind the lesions (asterisks). (E) High-magnification image captured in early phase of fluorescein angiography shows peripheral retinal nonperfusion behind the lesions (asterisks). |
Some authors reported microaneurysms, leakage from borderline vessels, and arterio-venous shunts.19–21 In the regions of RPE loss FA was able to display choroidal pattern which was undistinguishable in hyperpigmented areas. The masking effect was mostly seen in the choriocapillaris filling during arterial and venous phases followed by a reduction of choroidal fluorescence. No dye leakage from the choroid was observed.18
Background granular hyperfluorescence was observed in all lesions. The extent of the granular hyperfluorescence agreed with the lesion area by means of ophthalmoscopy. Dyeing of the vessels and leakage from the vessels within the lesion were observed in 41.2% and 17.6% of cases, respectively. Among the lesions that had sheathing and whitening of the vessels, 27.3% had perfused vessels. Some lesions (17.6%) showed leakage, not only within the lesions, but also around the lesions. Formation of microaneurysms was found in a single lesion.22
Optical Coherence Tomography
The role of optical coherence tomography (OCT) for LD imaging lies in both clinical and scientific areas. From a clinical perspective, OCT in LD diagnosis looks attractive since it can be performed for the majority of lesions, excluding those located in the far periphery, in patients with a small pupil, and in incompliant patients. At the same time, OCT provides details on vitreoretinal interface status around the lesion, presence of subclinical retinal detachment, and retinal holes, and may affect the strategy for laser prophylaxis. From a scientific point of view, OCT is the only modality which can provide pathology-like information on a large cohort of otherwise healthy individuals with diverse clinical and demographical characteristics, which is hardly possible in postmortem studies.
In order to perform peripheral OCT imaging, the patient should be seated in front of the OCT device as usual and instructed to look in the direction of the quadrant of interest. Some tilt of the head in the direction of the region of interest may be required. Focusing is applied to obtain the clearest image possible in the fundus image window. A scan is then taken. This allows to display the lesion with an adequate quality and with a reliable correspondence to the scan location in the majority of cases. In fact, live OCT imaging of retinal periphery is easier than capturing cross-sectional scan since stable gaze fixation is not needed. Several features of an OCT device are desirable to visualize LD lesions: 1) manual control of the device head for quick positioning of the device aperture against the pupil; 2) simultaneous live fundus image (analog infrared camera) for positioning the scan within the region of interest; 3) options for manual adjustment of a scan (initially by the axial axis to position the scan in the scanning window); 4) a tracking system to obtain high-resolution images; 5) external fixation to maintain gaze direction. Peripheral OCT imaging is easier with a high depth scan since it allows to reduce the tilt of the retinal image and to capture a wider area of the lesion. However, various OCT devices are used for LD imaging including SD Cirrus HD-OCT, Spectralis, and a series of RTVue devices.23–26
The inversion of the OCT image, which occurs in more than half of eyes examined, is one of the most significant limitations of peripheral OCT imaging. The proportion of inverted images is lower with mid-peripheral lesions and higher with far-peripheral lesions where it exceeds 70%. Since there is no significant difference in the mean axial length between eyes producing inverted and non-inverted scans, it seems that the location of lesions is the most important factor determining the inversion of the scan.27
Peripheral OCT of LD lesions has revealed retinal thinning (92%), vitreoretinal adhesion (72%), retinoschisis (44%), vitreous membrane with deposits (36%), and retinal break with subretinal fluid (4%)28 (Figure 3).
 |
Figure 3 Optical coherence tomography findings in lattice degeneration. (A) Cross-sectional scan passing the lesion crosswise demonstrates U-shaped vitreous adhesion and liquification (arrows), retinal and choroidal thinning (asterisk), and dome-shaped scleral indentation (arrowhead). (B) Corresponding infrared image shows perivascular moderately pigmented lesion (black arrowheads) (position of the scan is indicated by the red line). (C) Cross-sectional scan passing along the lesion demonstrates retinal and choroidal thinning (asterisks) and retinal separation (arrow). (D) Corresponding infrared image shows concentrical highly pigmented lesion (black arrowheads) (position of the scan is indicated by the red line). (E) Cross-sectional scan passing along the lesion demonstrates retinal and choroidal thinning (asterisks) and vitreous traction (arrow). (F) Corresponding infrared image shows concentrical mildly pigmented lesion with chorioretinal atrophy (black arrowheads) (position of the scan is indicated by the red line). (G) Cross-sectional scan passing the lesion crosswise demonstrates chorioretinal scars after laser photocoagulation (asterisks), “blunted” vitreous traction (arrow), and dome-shaped scleral indentation (arrowhead). (H) Corresponding infrared image shows mildly pigmented lesion surrounded by chorioretinal scars after laser photocoagulation (black arrowheads) (position of the scan is indicated by the red line). |
Vitreous liquification is typically seen over the area of LD with condensation at the edges of the lesion giving it a U-shaped appearance.24 The process behind these vitreous changes may result from underlying vascular abnormalities. The dense vitreous reflects tight vitreous adhesion with hyperreflective membranous structures attaching the edges of the lesion in some cases. Another characteristic feature of LD lesions is thinning of the neurosensory retina with fragmentary loss of retinal tissue (Figures 3 and 4). LD may demonstrate secondary peripheral atrophic holes not associated with operculum or posterior vitreous detachment.
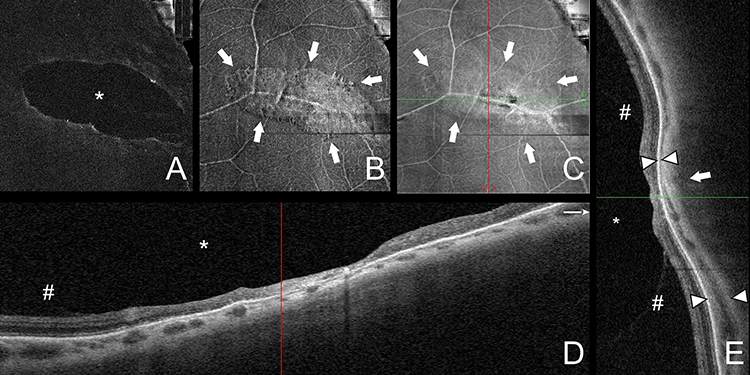 |
Figure 4 Optical coherence tomography in lattice degeneration. (A) Structural en face projection of a 10-µm preretinal slab showing vitreous liquification (asterisk) over the lesion. (B) Structural en face projection of a 10-µm epiretinal slab showing vitreous adhesions (arrows) within the lesion. (C) Structural en face projection of inner retina slab vitreous showing the lesion (arrows). Green and red line show position of cross-sectional scans in (D and E). (D) Cross-sectional scan passing along the lesions shows vitreous liquification (asterisk), vitreous adhesions (number sign) at the borders of the lesions, and retinal thinning (E). (D) Cross-sectional scan passing the lesions crosswise shows vitreous liquification (asterisk), vitreous adhesions (number sign) at the borders of the lesions, and retinal thinning. Arrowheads show choroidal thinning at the lesion compared to an unaffected region. Arrow indicates dome-shaped scleral indentation beneath the lesion. |
OCT clarified the potential risks associated with specific types of lesions: pigmented LD lesions tended to have thinner retinal layers and clinically unrecognizable breaks when compared to nonpigmented lesions.29 Similarly, full thickness retinal holes were found in pigmented LD lesions while, in another study, non-pigmented lesions did not demonstrate thinning or holes.16 However, the exact risks of RRD associated with particular OCT finding is not known and still require further studies to be established.
OCT has also been used to reveal blunting of the vitreous tractions after prophylaxis laser treatment. The blunting effect was observed 2–3 months after laser photocoagulation. In areas of LD vitreous tractions did not release or progress further after laser photocoagulation.28
The scleral profile beneath the lesions may demonstrate a local dome-shaped indentation which follows the shape of the lesion. In other words, the indentation is seen on a scan passing perpendicularly to the lesion’s largest dimension (in concentrical lesions) and is not detectable when the scan passes along the largest dimension of the lesion (Figure 4).
Another structural finding is the thinning of the choroid which is notable within the central part of the lesion compared to adjacent unaffected regions of the eye fundus. Loss of the RPE may lead to contact between the thinned neurosensory retina and the sclera. When the choroid is preserved, it consists mostly of large vessels with highly reflective stromal tissue.25 Together with the loss of RPE, this leads to deep penetration of OCT scanning beam which produces hypertransmission bands behind the vessels. This pattern corresponds to the dark areas on infrared images.
The scan pattern chosen for analysis varies between studies and is dependent on the particular OCT device and the preferences of specialists.23,29–31 Taking into account the potential difficulties of gaze fixation, standard three-dimensional patterns are not appropriate for capturing LD lesions although they would provide comprehensive information on the structure of a lesion. Instead of three-dimensional scans, raster patterns are typically used to obtain adequate cross-sectional image. However, the whole pattern is rarely successful. Nevertheless, individual cross-sectional scans allow to obtain information on the presence of vitreous tractions, thinning, holes, and retinal detachment. A line pattern is easier to obtain than a raster pattern. Although a line pattern is sufficient to detect retinal detachment, holes and some small details of a lesion may be missed. One non-conventional approach which allows us to evaluate the lesion comprehensively is structural OCT in live mode, which is available in the devices where scan pattern can be manually moved across the live fundus image. In such cases, examination can be performed in a way similar to ultrasound examination and critical features can be noted by the specialist. To document these changes, screen image can be recorded and then reevaluated (Supplementary Video) (Figure 5).
 |
Figure 5 Live optical coherence tomography in lattice degeneration. A series of snapshots showing of characteristic findings of lattice degeneration including retinal detachment (asterisk), retinal hole (arrowhead), and vitreous traction (arrow) in different positions of cross-sectional scans. |
In general, modern OCT devices seem to be able to capture the majority of LD lesions. However, the exact success rate, as well as the proportion of clinically valuable images able to be obtained in routine practice remains unknown.
Optical Coherence Tomography Angiography
Although optical coherence tomography angiography (OCTA) is conventionally considered as a tool for the assessment of the central retina, the latest OCT devices allow to obtain OCTA images of the equatorial regions including the LD lesions in those areas. This imaging can be performed with various patterns, but the 3-mm patten generates more consistent images without cutting the scan edges. No data exists on the application of wide field OCTA on LD imaging. In this respect, some concern might be caused by the low resolution of wide-file OCTA scans. OCTA produces readable images in a significant proportion of LD eyes, mostly in those with midperiphery lesions.25,32 Although this helps in evaluation of some details of anatomical relationships within the lesion, the clinical significance of this imaging is less important than structural OCT, due to the complexity OCTA in retinal periphery.
OCTA confirmed the previously known fact that retinal non-perfusion accompanies LD lesions. Typically, only a few vessels are visible within the lesion when a full-retina slab is taken. At the same time, large white vessels are still perfused by means of OCTA.25 This fact, as well as the scattered pattern of vessel loss around the lesion, suggests that vascular changes could have secondary character since even on high-resolution images no regularity in the distribution of retinal non-perfusion is observed (Figure 6). Due to the loss of RPE, visualization of the choriocapillaris is enhanced within the LD region. OCTA reveals rarefication of the choriocapillaris meshwork and at the same time the presence of choroidal venous collectors beneath lesions.25,32 There is a possibility that due to their relatively large area, LD lesions may coincidentally include choroidal venous collectors. However, this would also suggest that lesions follow the choriocapillaris vascular pattern rather than the retinal one.32
 |
Figure 6 Optical coherence tomography angiography in lattice degeneration. (A) Optical coherence tomography angiography projection of full retina slab showing retinal capillary nonperfusion (asterisk) within the lesion. (B) Optical coherence tomography angiography projection of choriocapillaris slab showing choriocapillaris rarefication within the lesion (number sign). (C) Optical coherence tomography angiography projection of full retina slab showing retinal capillary nonperfusion (asterisk) within the lesion. (D) Optical coherence tomography angiography projection of choriocapillaris slab showing choriocapillaris rarefication within the lesion (number sign). (E) Wide-field color fundus photography showing lesions captured with optical coherence tomography angiography. Black box 1 shows position of the scan in (A and B). Black box 2 shows position of the scan in (C and D). |
A difference in choriocapillaris circulation might be noted in the macular region, where LD eyes demonstrate a higher perfusion area of the choriocapillaris, and a lower number of flow voids compared to healthy age-matched controls.32 This difference was found between healthy and LD eyes matched by axial length. From this point of view eyes of LD patients can be placed on the opposite end of the line which includes central serous chorioretinopathy (CSCR) eyes with impaired choriocapillaris perfusion, normal eyes with normal choriocapillaris perfusion and LD eyes with increased perfusion.32 Although these preliminary findings require further confirmation, they may indicate the role of choroidal microcirculation in the pathophysiology of LD.
A substantial proportion of LD lesions seems to follow individual retinal vessels. Analysis of a set of color fundus photographs indicates that these lesions occur in association with venous vessels and typically demonstrate pigmentary changes more significant than those of peripheral lesions. These paravenous lesions require further investigation in terms of their role in rhegmatogenous retinal detachment.
Combined UWF and OCT Imaging
Another approach to visualizing LD with OCT is based on single-capture UWF confocal SLO with integrated swept-source OCT. With this device, the location of peripheral retinal degenerations is determined on UWF fundus images which enables simultaneous observation of retinal tomography by horizontal 23-mm or 6.0×3.5 mm volume scan. This approach provides a correlation between clinical and morphological data and allows identification of subretinal fluid, detached retina, and vitreous tractions associated with LD.27
Spectral Imaging and Scanning Laser Ophthalmoscopy
Red-free and green-free imaging suggests that the internal hyperpigmentation is located in the RPE layer with no choroidal involvement. Infrared imaging demonstrates irregular reflectivity in the region of degeneration and shows the orientation of the lesion to be largely parallel to the ora serrata.2
Evaluation of peripheral lesions with infrared SLO may be beneficial since it provides imaging similar to conventional ophthalmoscopy but without intense light illumination. This makes peripheral retina easily available for evaluation even in light-sensitive patients. While confocal SLO seems to provide relatively limited new information mostly on the status of the vitreous floaters overlying an area of lattice degeneration,33 it facilitates diagnosis and imaging in cases with decreased optical media transparency, such as cataract and vitreous hemorrhage. However, two more SLO options, so-called dark-field SLO and retro-mode SLO, may provide additional information on LD morphology. Retro-mode SLO is a modification of SLO which visualizes a wide range of retinal lesions of the far periphery. Retro-mode SLO operates with 790 nm laser source and a specific diaphragm with a side-deviated aperture. This technique creates pseudo three-dimensional images and highlights retinal lesions, including retinal holes, neuroepithelial detachments, retinoschisis, and RPE alterations (Figure 7). The individuals with subclinical asymptomatic retinal detachments, breaks, or retinal degenerations previously revealed by indirect ophthalmoscopy demonstrated 31.5–55.0% more peripheral findings with retro-mode SLO. This includes extra lesions and new findings, such as retinal holes or vitreous tractions, within already established lesions.34
 |
Figure 7 Multimodal imaging in lattice degeneration. (A) Snapshots of live cross-sectional optical coherence tomography showing holes (arrows) and retinal detachment (asterisk). (B) Wide-field color fundus photography shows moderately pigmented lattice degeneration lesion (arrowhead). (D) Wide-field fundus autofluorescence showing hypointense signal within the lesion (arrowhead). (C) Retro-mode scanning laser ophthalmoscopy shows retinal holes (arrows), retinal detachment (asterisk), and hyporeflective region within the central part of the lesion (arrowhead). |
Dark-field SLO has a confocal aperture with a central stop that produces images based on backscattering of infrared light from the sclera. Therefore, with the dark-field SLO image pigmentary changes can be clearly displayed due to blockage or hypertransmission of backscattered light.35,36 This method resembles analogue infrared-illumination incorporated in some multimodal diagnostic devices and OCT systems. Dark-field SLO demonstrates regional hypo-/hyperintense signal within LD lesion and hypointense signal around the lesion (Figure 8). This pattern taken together with OCT findings may indicate involvement of the sclera beneath the lesion.
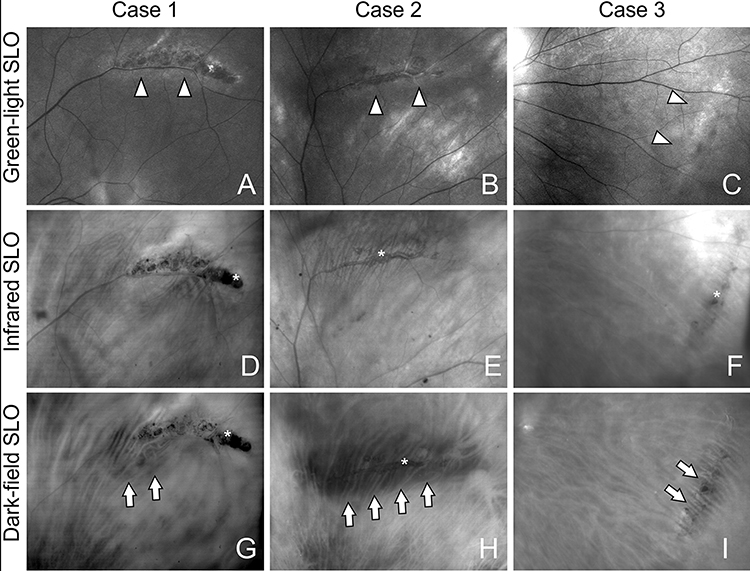 |
Figure 8 Scanning laser ophthalmoscopy in lattice degeneration. (A) Green-light scanning laser ophthalmoscopy (SLO) shows moderately pigmented perivascular lattice degeneration lesion (arrowheads). (B) Green-light SLO shows mildly pigmented perivascular lattice degeneration lesion (arrowheads). (C) Green-light SLO shows non-pigmented concentrical lattice degeneration lesion (arrowheads). (D) Infrared SLO shows pigmentary clusters (asterisk) in moderately pigmented perivascular lattice degeneration lesion. (E) Infrared SLO shows mild pigmentary clusters (asterisk) in mildly pigmented perivascular lattice degeneration lesion. (F) Infrared SLO shows a few pigmented granules in concentrical lattice degeneration lesion (arrowheads). (G) Dark-field SLO shows mild dark region around perivascular lesion (arrows). (H) Dark-field SLO shows large dark region beneath the lesion (arrows). (I) Dark-field SLO shows subtle dark region within concentrical lattice degeneration lesion (arrows). |
Clinical and Scientific Implication of Imaging Techniques
Several new imaging techniques are able to enhance or partially substitute conventional LD imaging from a clinical point view. All these techniques are able to reach the retinal periphery, either in a single capture or by focusing on individual lesions.
UWFI can simplify and standardize diagnosis of LD since it does not depend on skills of the examinator which, with 90 D or Goldman three-mirrors lenses, play a key role in the evaluation of retinal periphery. However, in contrast to ophthalmoscopy, with UWFI there may be a lack of information on the status of the vitreoretinal interface, such as subclinical retinal detachments, retinal holes, and vitreous tractions. The clinical application of UWFI can therefore play a basic diagnostic or documenting role, but details defining the risk of RRD and the need for laser prophylaxis should be evaluated with peripheral OCT or/and retro-mode SLO.26,34 Since, in contrast to structural OCT, SLO is able to display whole lesion area, it seems to be less dependent on the examiner, but it is also inferior compared to peripheral OCT in displaying vitreous tractions. Thus, peripheral OCT seems to be the most precise technique for detailed examination of LD lesion but is limited to the examiner evaluation of previously captured scans only.26 In such cases, live video OCT may be an appropriate strategy to capture and document the data.
In previous studies, the risks of RRD were estimated for all types of LD lesions in general.1 However, further stratification of the risks of RRD is needed on specific subtypes of lesions, such as pavascular versus concentrical, or specific findings, such as asymptomatic retinal holes or detachment. This would further help with targeting laser prophylaxis of LD. In general, taking into account recent advances in multimodal imaging, it could be considered not as a screening tool but rather as an instrument for clarifying risks of previously diagnosed lesions.
From a scientific point of view, new imaging techniques may shed light on the etiology of LD and improve our understanding of this phenomenon in general. Indeed, despite its high prevalence and easy diagnosis, mostly based on indirect ophthalmoscopy, the exact cause of LD is still unknown. However, inflammatory, vascular, and anatomical nature may be postulated. Unfortunately, none of these stands up to critical analysis. Although phenotypically LD lesions may resemble postinflammatory scars due to a combination of atrophic and pigmentary changes, to the best of our knowledge, no features of active inflammation in LD eyes have been described. A vascular origin may be proposed based on involvement of retinal vessels in the lesion,24 but in the majority of cases LD lesions do not follow the pattern of a particular vessel and do not belong to an area supplied by an individual vessel. Finally, it is proposed that mechanical stress as a result of eye elongation leads to retinal stretching and tearing.37 That suggestion is supported by the greater prevalence of LD in myopic eyes. However, the highest LD frequency is observed in eyes with moderate axial elongation rather than in extremely long eyes.38,39
Taking into consideration the vascular nature of LD lesion we see that typically they randomly occur among peripheral retinal vessels and are not limited by watersheds between distinct retinal vessels. Moreover, the role of microcirculation in maintaining the normal retinal anatomy at the periphery of the eye fundus seems to be less important compared to that of the central region. This is also supported by the data on lower oxygen saturation levels in peripheral regions40 and by the complete absence of anatomical changes of peripheral retina in ischemic retinal vascular occlusions, including central retinal artery occlusion and severe ischemic central retinal vein occlusion. This agrees with the very low vessel density displayed by OCTA in extramacular regions which is obviously even lower on the retinal periphery.41,42 It is therefore unlikely that primary alteration of retinal microcirculation is responsible for LD.
In contrast to retinal non-perfusion, choroidal infarction results in neurosensory retina degeneration appearing as loss of retinal layers. These changes were observed after occlusion of arteria ophthalmica or regional infarction of the choroid had taken place.43,44 Changes of retinal vessels within the LD lesions may therefore be a part of retinal atrophy due to choroidal circulatory malfunctioning.
This agrees with OCTA and OCT data, indicating involvement of the choroid, not only at the lesion but also at a global level.32 Although the exact mechanisms controlling choroidal circulation are not fully understood, the status of the sclera may play an important role in regulating venous outflow.45 Accordingly, the prevalence of myopia and altered synthesis of collagen in LD eyes may reflect involvement of the sclera in LD pathophysiology.46,47
Conclusion
In conclusion, new imaging modalities are able to provide a deep insight to the retinal periphery. In terms of LD, it allows precise documenting, better stratification of risks of RRD, and further understanding of the etiology of this condition. Ultra-wide field imaging may be considered as a basis for diagnosing and documenting LD lesions followed by peripheral retro-mode SLO and/or structural OCT providing details on vitreoretinal interface abnormalities. Preoperative peripheral retinal evaluation using UWFI devices and OCT may reduce potential risks of rhegmatogenous retinal detachment and seems to be especially valuable among candidates for intraocular surgery.
Funding
There is no funding to report.
Disclosure
The authors report no conflicts of interest in this work.
References
1. Byer NE. Lattice degeneration of the retina. Surv Ophthalmol. 1979;23:213–248. doi:10.1016/0039-6257(79)90048-1
2. Cheung R, Ly A, Katalinic P, et al. Visualisation of peripheral retinal degenerations and anomalies with ocular imaging. Semin Ophthalmol. 2022;37:554–582. doi:10.1080/08820538.2022.2039222
3. Haimann MH, Burton TC, Brown CK. Epidemiology of retinal detachment. Arch Ophthalmol. 1982;100:289–292. doi:10.1001/archopht.1982.01030030291012
4. Laatikainen L, Tolppanen EM, Harju H. Epidemiology of rhegmatogenous retinal detachment in a Finnish population. Acta Ophthalmol. 1985;63:59–64. doi:10.1111/j.1755-3768.1985.tb05216.x
5. El-Abiary M, Shams F, Goudie C, Yorston D. The Scottish RD survey 10 years on: the increasing incidence of retinal detachments. Eye. 2023;37:1320–1324. doi:10.1038/s41433-022-02123-1
6. Ripandelli G, Coppé AM, Parisi V, et al. Posterior vitreous detachment and retinal detachment after cataract surgery. Ophthalmology. 2007;114:692–697. doi:10.1016/j.ophtha.2006.08.045
7. Straatsma BR, Zeegen PD, Foos RY, Feman SS, Shabo AL. Lattice degeneration of the retina. XXX Edward Jackson Memorial Lecture. Am J Ophthalmol. 1974;77(5):619–649. doi:10.1016/0002-9394(74)90525-x
8. Quinn N, Csincsik L, Flynn E, et al. The clinical relevance of visualising the peripheral retina. Prog Retin Eye Res. 2019;68:83–109. doi:10.1016/j.preteyeres.2018.10.001
9. Liu L, Wang F, Xu D, Xie C, Zou J. The application of wide-field laser ophthalmoscopy in fundus examination before myopic refractive surgery. BMC Ophthalmol. 2017;17:250. doi:10.1186/s12886-017-0647-4
10. Yang D, Li M, Wei R, Xu Y, Shang J, Zhou X. Optomap ultrawide field imaging for detecting peripheral retinal lesions in 1725 high myopic eyes before implantable collamer lens surgery. Clin Exp Ophthalmol. 2020;48:895–902. doi:10.1111/ceo.13809
11. Kumar J, Kohli P, Babu N, Krishnakumar K, Arthur D, Ramasamy K. Comparison of two ultra-widefield imaging for detecting peripheral retinal breaks requiring treatment. Graefes Arch Clin Exp Ophthalmol. 2021;259:1427–1434. doi:10.1007/s00417-020-04938-8
12. Wang T, Liao G, Chen L, et al. Intelligent diagnosis of multiple peripheral retinal lesions in ultra-widefield fundus images based on Deep Learning. Ophthalmol Ther. 2023;12:1081–1095. doi:10.1007/s40123-023-00651-x
13. Tang YW, Ji J, Lin JW, et al. Automatic detection of peripheral retinal lesions from ultrawide-field fundus images using Deep Learning. Asia Pac J Ophthalmol. 2023. doi:10.1097/APO.0000000000000599
14. Zhang C, He F, Li B, et al. Development of a deep-learning system for detection of lattice degeneration, retinal breaks, and retinal detachment in tessellated eyes using ultra-wide-field fundus images: a pilot study. Graefes Arch Clin Exp Ophthalmol. 2021;259:2225–2234. doi:10.1007/s00417-021-05105-3
15. Li Z, Guo C, Nie D, et al. A deep learning system for identifying lattice degeneration and retinal breaks using ultra-widefield fundus images. Ann Transl Med. 2019;7:618. doi:10.21037/atm.2019.11.28
16. Fujikawa A, Suzuma K, Yamada K, Inoue D, Kitaoka T. Optical coherence tomography and ultra-wide-field autofluorescence imaging are the useful tools to understand the changes in peripheral retinal lesions. Invest Ophthalmol Vis Sci. 2013;54:3596.
17. Ideyama M, Muraoka Y, Kawai K, et al. Pigmentary lesions in eyes with rhegmatogenous retinal detachment with flap tears: a retrospective observational study. Sci Rep. 2022;12:12470. doi:10.1038/s41598-022-16508-5
18. Tolentino FI, Lapus JV, Novalis G, et al. Fluorescein angiography of degenerative lesions of the peripheral fundus and rhegmatogenous retinal detachment. Int Ophthalmol Clin. 1976;16:13–29. doi:10.1097/00004397-197601610-00005
19. Sato K. Shunt formation in lattice degeneration and retinal detachment. A fluorescein angiographic study. Mod Probl Ophthalmol. 1972;10:133–134.
20. Sato K, Tsunakawa N, Yanagisawa Y. Fluorescein angiography on retinal detachment and lattice degeneration. II. Lattice degeneration with retinal detachment. Nippon Ganka Gakkai Zasshi. 1971;75:1873–1883.
21. Sato K, Tsunakawa N, Inaba K, Yanagisawa Y. Fluorescein angiography on retinal detachment and lattice degeneration. I. Equatorial degeneration with idiopathic retinal detachment. Nippon Ganka Gakkai Zasshi. 1971;75:635–642.
22. Yura T. The relationship between the types of axial elongation and the prevalence of lattice degeneration of the retina. Acta Ophthalmol. 1998;76(1):90–95. doi:10.1034/j.1600-0420.1998.760117.x
23. Chu RL, Pannullo NA, Adam CR, Rafieetary MR, Sigler EJ. Morphology of peripheral vitreoretinal interface abnormalities imaged with spectral domain optical coherence tomography. J Ophthalmology. 2019;2019:1–5. doi:10.1155/2019/3839168
24. Manjunath V, Taha M, Fujimoto JG, Duker JS. Posterior lattice degeneration characterized by spectral domain optical coherence tomography. Retina. 2011;31(3):492–496. doi:10.1097/IAE.0b013e3181ed8dc9
25. Maltsev D, Kulikov A, Burnasheva M. Lattice degeneration imaging with optical coherence tomography angiography. J Curr Ophthalmol. 2022;34:379. doi:10.4103/joco.joco_94_22
26. Shaimova VA, ed. Peripheral Retinal Degenerations: Optical Coherence Tomography and Retinal Laser Coagulation.Springer International Publishing; 2017. doi:10.1007/978-3-319-48995-7
27. Kurobe R, Hirano Y, Ogura S, Yasukawa T, Ogura Y. Ultra-Widefield swept-source optical coherence tomography findings of peripheral retinal degenerations and breaks. Clin Opthalm. 2021;15:4739–4745. doi:10.2147/OPTH.S350080
28. Tsai CY, Hung KC, Wang SW, Chen MS, Ho TC. Spectral-domain optical coherence tomography of peripheral lattice degeneration of myopic eyes before and after laser photocoagulation. J Formos Med Assoc. 2019;118:679–685. doi:10.1016/j.jfma.2018.08.005
29. Kothari A, Narendran V, Saravanan VR. In vivo sectional imaging of the retinal periphery using conventional optical coherence tomography systems. Indian J Ophthalmol. 2012;60:235–239. doi:10.4103/0301-4738.95885
30. Shaimova VA, Pozdeeva OG, Shaimov TB, et al. Optical coherent tomography in diagnosis of peripheral retinal breaks. Vestn Oftalmol. 2013;129(6):51–56.
31. Pozdeyeva OG, Shaimov TB, Galin A, et al. Optical coherence tomography in diagnosis of peripheral retinal degenerations. Ophthalmol Russia. 2013;10(4):32–40.
32. Burnasheva MA, Maltsev DS, Kulikov AN. Retinal and choroidal circulation in patients with lattice retinal degeneration: optical coherence tomography-angiography study. Ophthalmol Rep. 2022;15:39–45. doi:10.17816/OV110752
33. Garcia-Aguirre G, Henaine-Berra A, Salcedo-Villanueva G. Visualization and grading of vitreous floaters using dynamic ultra-widefield infrared confocal scanning laser ophthalmoscopy: a pilot study. JCM. 2022;11(5502). doi:10.3390/jcm11195502
34. Maltsev DS, Kulikov AN, Burnasheva MA, Chhablani J. Retro-mode scanning laser ophthalmoscopy in evaluation of peripheral retinal lesions. Graefes Arch Clin Exp Ophthalmol. 2021;259:301–306. doi:10.1007/s00417-020-04872-9
35. Kulikov AN, Maltsev DS, Burnasheva MA, Chhablani J. Characterization of choroidal nevi with dark-field infrared scanning laser ophthalmoscopy. Ophthalmol Retina. 2019;3:703–708. doi:10.1016/j.oret.2019.03.011
36. Kulikov AN, Maltsev DS, Burnasheva MA, Chhablani J. Dark-Field scanning laser ophthalmoscopy for prediction of central serous chorioretinopathy responsiveness to laser therapy. J Curr Ophthalmol. 2021;33:461–467. doi:10.4103/joco.joco_257_21
37. Pierro L, Camesasca FI, Mischi M, Brancato R. Peripheral retinal changes and axial myopia. Retina. 1992;12(1):12–17. doi:10.1097/00006982-199212010-00003
38. Celorio JM, Pruett RC. Prevalence of lattice degeneration and its relation to axial length in severe myopia. Am J Ophthalmol. 1991;111:20–23. doi:10.1016/s0002-9394(14)76891-6
39. Chen DZ, Koh V, Tan M, et al. Peripheral retinal changes in highly myopic young Asian eyes. Acta Ophthalmol. 2018;96:e846–e851. doi:10.1111/aos.13752
40. Heitmar R, Safeen S. Regional differences in oxygen saturation in retinal arterioles and venules. Graefes Arch Clin Exp Ophthalmol. 2012;250:1429–1434. doi:10.1007/s00417-012-1980-1
41. Zhang Q, Lee CS, Chao J, et al. Wide-field optical coherence tomography based microangiography for retinal imaging. Sci Rep. 2016;6:22017. doi:10.1038/srep22017
42. Campbell JP, Zhang M, Hwang TS, et al. Detailed vascular anatomy of the human retina by projection-resolved optical coherence tomography angiography. Sci Rep. 2017;7:42201. doi:10.1038/srep42201
43. Davidova P, Müller M, Wenner Y, et al. Ophthalmic artery occlusion after glabellar hyaluronic acid filler injection. Am J Ophthalmol Case Rep. 2022;26:101407. doi:10.1016/j.ajoc.2022.101407
44. Hayreh SS, Baines JA. Occlusion of the posterior ciliary artery. II. Chorio-retinal lesions. Br J Ophthalmol. 1972;56(10):736–753. doi:10.1136/bjo.56.10.736
45. Keidel LF, Schworm B, Langer J, et al. Scleral thickness as a risk factor for central serous chorioretinopathy and pachychoroid neovasculopathy. J Clin Med. 2023;12(3102). doi:10.3390/jcm12093102
46. Nash BM, Watson CJG, Hughes E, et al. Heterozygous COL9A3 variants cause severe peripheral vitreoretinal degeneration and retinal detachment. Eur J Hum Genet. 2021;29:881–886. doi:10.1038/s41431-021-00820-1
47. Okazaki S, Meguro A, Ideta R, et al. Common variants in the COL2A1 gene are associated with lattice degeneration of the retina in a Japanese population. Mol Vis. 2019;25:843–850.
 © 2023 The Author(s). This work is published and licensed by Dove Medical Press Limited. The
full terms of this license are available at https://www.dovepress.com/terms
and incorporate the Creative Commons Attribution
- Non Commercial (unported, 3.0) License.
By accessing the work you hereby accept the Terms. Non-commercial uses of the work are permitted
without any further permission from Dove Medical Press Limited, provided the work is properly
attributed. For permission for commercial use of this work, please see paragraphs 4.2 and 5 of our Terms.
© 2023 The Author(s). This work is published and licensed by Dove Medical Press Limited. The
full terms of this license are available at https://www.dovepress.com/terms
and incorporate the Creative Commons Attribution
- Non Commercial (unported, 3.0) License.
By accessing the work you hereby accept the Terms. Non-commercial uses of the work are permitted
without any further permission from Dove Medical Press Limited, provided the work is properly
attributed. For permission for commercial use of this work, please see paragraphs 4.2 and 5 of our Terms.
Recommended articles
Intravitreal Injections for Macular Edema in Silicone Oil Filled Eyes
Safadi K, Eshel Y, Levy J, Tiosano L, Jaouni T, Khateb S
Clinical Ophthalmology 2024, 18:3405-3416
Published Date: 22 November 2024
Central Corneal Thickness Measurement in Patients with Glaucoma and Glaucoma Suspects by Spectral-Domain and Swept-Source Optical Coherence Tomography Compared with the Standard Ultrasonic Method
Machado Luz P, Lubisco VM, Leivas Lindenmeyer R, Swarovsky AP, Back da Silva A, D´Azevedo Silveira V, Silva MO, Schopf C, Lavinsky J, Lavinsky D, Pakter HM, Lavinsky F
Clinical Ophthalmology 2025, 19:819-825
Published Date: 10 March 2025
Subfoveal Choroidal Thickness After Successful Retinal Detachment Repair with Persistent Subretinal Fluid at the Macula
Mansour AM, Parodi MB, Uwaydat SH, Lima LH, Charbaji S, Casella AM, López-Guajardo L, Belotto S, Wu L, Schwartz SG, Smiddy WE, Hassoun MM, Pérez-Salvador García E, Mansour HA, Elnahry AG, Hamam RN
Clinical Ophthalmology 2025, 19:1847-1854
Published Date: 11 June 2025
Serum Apolipoprotein B and B/A1 Ratio as Early Negative Biomarkers for OCT- and OCTA-Detected Retinal Changes in Diabetic Macular Edema
Soedarman S, Julia M, Gondhowiardjo TD, Kurnia KH, Prasetya ADB, Triyoga IF, Sasongko MB
Clinical Ophthalmology 2025, 19:2165-2178
Published Date: 9 July 2025
The Acute Effects of Caffeine on OCT and OCTA Parameters: A Systematic Review and Meta-Analysis
Veiga DM, Ivanov YA, Júnior AYF, Rebolho MEF, Gerente BGDSM, Amaral DC, Jacometti R, Guedes J, Monteiro ML, Louzada RN
Clinical Ophthalmology 2026, 20:568498
Published Date: 11 April 2026