Back to Journals » International Journal of Nanomedicine » Volume 18
Multifunctional Phase-Transition Nanoparticles for Effective Targeted Sonodynamic-Gene Therapy Against Thyroid Papillary Carcinoma
Authors Guan S, Teng D, Wang H ![]() , Wang Q, Zhen X, Sui G, Wang Y, Zhu L
, Wang Q, Zhen X, Sui G, Wang Y, Zhu L ![]() , Lin Y, Jiao D, Guo F
, Lin Y, Jiao D, Guo F
Received 22 October 2022
Accepted for publication 23 April 2023
Published 2 May 2023 Volume 2023:18 Pages 2275—2293
DOI https://doi.org/10.2147/IJN.S394504
Checked for plagiarism Yes
Review by Single anonymous peer review
Peer reviewer comments 2
Editor who approved publication: Professor Farooq A. Shiekh
Shihui Guan, Dengke Teng, Hui Wang,* Qimeihui Wang,* Xi Zhen, Guoqing Sui, Yang Wang, Lingyu Zhu, Yuanqiang Lin, Dan Jiao, Feng Guo
Department of Ultrasound, China-Japan Union Hospital of Jilin University, Changchun, Jilin Province, 130033, People’s Republic of China
*These authors contributed equally to this work
Correspondence: Hui Wang; Qimeihui Wang, Email [email protected]; [email protected]
Introduction: In order to diagnose and treat papillary thyroid carcinoma (PTC) accurately, phase-transition nanoparticles, P@IP-miRNA (PFP@IR780/PLGA-bPEI-miRNA338-3p), was engineered. The nanoparticles (NPs) can target the tumor cells, realize the multimodal imaging, and provide sonodynamic-gene therapy for PTC.
Methods: P@IP-miRNA NPs were synthesized through double emulsification method, and miRNA338-3p was attached to the surface of the NPs by electrostatic adsorption. The characterization of NPs was detected to screen out qualified nanoparticles. In vitro, laser confocal microscopy and flow cytometry were used to detect the targeting and subcellular localization of NPs. Western blot, qRT-PCR, and immunofluorescence were used to detect the ability to transfect miRNA. CCK8 kit, laser confocal microscopy and flow cytometry were used to detect the inhibition on TPC-1 cells. In vivo experiments were performed based on tumor-bearing nude mice. The efficacy of combined treatment by NPs was comprehensively evaluated, and the multimodal imaging ability of NPs in vivo and in vitro was detected.
Results: P@IP-miRNA NPs were successfully synthesized which have spherical shape, uniform size, good dispersion and positive potential. The encapsulation rate of IR780 was (82.58± 3.92) %, the drug loading rate was (6.60± 0.32) %, and the adsorption capacity of miRNA338-3p was 41.78 μg/mg. NPs have excellent tumor targeting ability, miRNA transfection ability, ROS production ability and multimodal imaging ability in vivo and in vitro. The antitumor effect of combined treatment group was the best, and the efficacy was better than that of single factor treatment group, and the difference was statistically significant.
Conclusion: P@IP-miRNA NPs can realize multimodal imaging and sonodynamic-gene therapy, providing a new idea for accurate diagnosis and treatment of PTC.
Keywords: papillary thyroid carcinoma, miRNA338-3P, sonodynamic therapy, nanoparticles, multimodal imaging
Introduction
Papillary thyroid carcinoma (PTC) accounts for 80–90% of all thyroid cancers, and its incidence continues to increase year by year. Although the majority of PTC is well differentiated and has a good prognosis, its biological characteristics are very diverse, ranging from non-progressive/very indolent lesions to aggressive, metastatic lesions.1–3 Some PTC metastases occur early, but the clinical symptoms are not obvious, which usually cannot be detected in time, affecting the early assessment of lesions, and increasing the mortality rate of PTC patients to a certain extent.4–7 on the other hand, because the early diagnosis is not obvious, a large number of patients underwent biopsy and surgery, and the ensuing complications such as recurrent laryngeal nerve injury have led to discussions on the overdiagnosis and treatment of PTC.8–11 Therefore, precision diagnosis and treatment are of vital importance and also a research hotspot. At present, there are limitations in the comprehensive realization of precision diagnosis and treatment.12–14 Therefore, this study hopes to achieve accurate diagnosis and treatment of PTC by using the new integrated diagnosis and treatment nanoplatform.
Studies over the years have confirmed the abnormal expression of miRNAs in a variety of malignant tumor cells, and it is closely related to biological behaviors such as tumor genesis, invasion and metastasis.15–17 Using miRNA mimics or antagonists to target tumors is a new direction of treatment in the future.18–20 miRNA338-3p is a nucleic acid sequence located in apoptosis-associated protein tyrosine kinase. It has been proved that its expression can be significantly down-regulated in the occurrence and development of nasopharyngeal carcinoma, gastric cancer, hepatocellular carcinoma, neuroblastoma and other malignant tumors. Studies have found that miRNA338-3p is under expressed in PTC tissues and cell lines, which significantly promotes tumor proliferation and invasion, and its expression level is negatively correlated with lymph node metastasis of PTC.21–24 In addition, experiments have confirmed that overexpression of miRNA338-3p in TPC-1 cells can significantly inhibit tumor proliferation. Through bioinformatics analysis, it is known that the regulatory target of miRNA338-3p in TPC-1 cells is AKT3.25,26
As a new drug/gene delivery system, perfluorocabon nanoparticles (PFC NPs) are composed of lipid, polymer composite materials shell membrane, liquid fluorocarbon core package, preparation of variant nanoparticles, can under the condition of light, sound, magnetism and so on, by the liquid into gas phase, not only can achieve the goal of imaging, can also cause a series of biological effects, for tumor diagnosis and integration of the idea. Among them, acoustic droplet vaporization (ADV) refers to the process in which liquid fluorocarbon overcomes surface tension and produces liquid-gas transformation under the mechanical action of ultrasonic waves.27 Based on this principle, ADV PFC NPs can achieve multimodal imaging of target lesions and targeted gene release through molecular modification.
Sonodynamic therapy (SDT) is a new non-invasive treatment method. The main principle is to activate the sonosensitive agent by ultrasound to generate reactive oxygen (ROS) with cytotoxicity, which damages tumor tissues and achieves the purpose of treatment.28,29 IR780, a cyanine fluorescent dye, has good biocompatibility at a dose of 1.9 mg/kg, and is targeted to broad-spectrum tumors. It can also achieve fluorescence imaging and photoacoustic imaging under certain conditions, which is a relatively superior acoustic sensitizing agent. However, due to the poor water solubility and optical stability of traditional acoustic sensitizers such as IR780, their application in vivo is limited. In addition, the ROS produced by SDT has a short diffusion distance and a short lifetime. Studies have found that SDT alone often cannot achieve satisfactory therapeutic effects. The combination of nanomaterials such as liposomes and organic polymers with acoustic sensitizer such as IR780, on the one hand, can effectively improve its physical and chemical properties and improve the efficacy of SDT; on the other hand, SDT can be combined with other therapies and play a synergistic effect.30–32
In this study, cationic polymer compound PLGA-bPEI was used as a spherical shell, IR780 was loaded on the shell, and the core was wrapped in Perfluoropentane (PFP). Tumor targeted nanoparticles were synthesized by double emulsification method, and miRNA-338-3p was connected to the surface of the nanoparticles by electrostatic adsorption. On one hand, the nanoparticles can selectively aggregate in tumor tissues to achieve photoacoustic, fluorescence and ultrasonic multimodal imaging, providing more information for tumor diagnosis and evaluation. On the other hand, the nanoparticles can transfect miRNA338-3p, inhibit tumor proliferation, and produce sonodynamic effects under low intensity focused ultrasound (LIFU) excitation in a targeted way. The design idea is shown in Figure 1.
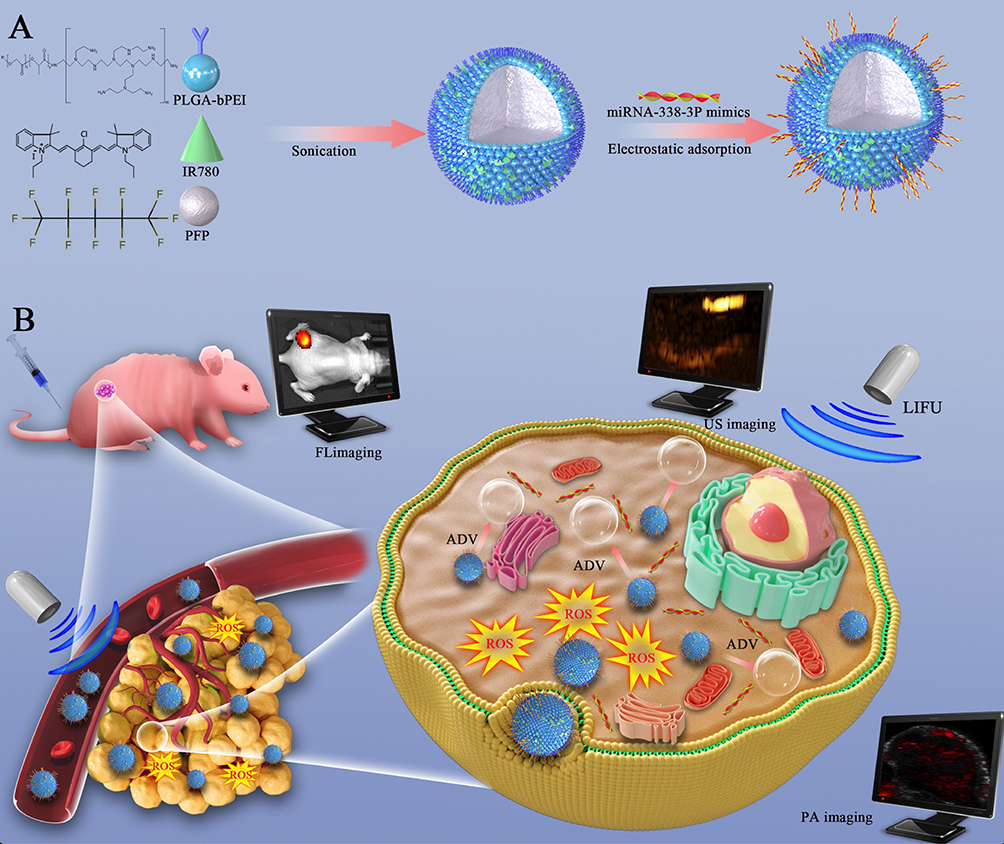 |
Figure 1 Schematic Illustration of the synthesis and function of P@IP-miRNA nanoparticles. (A) The synthesis procedure of P@IP-miRNA nanoparticles. (B) The process of P@IP-miRNA nanoparticles targeting tumor cells and mediating multimodal imaging and sonodynamic-gene therapy. |
Materials and Methods
Materials
Poly(lactic-co-glycolic acid)-Polyethylenimine (branched, Mw≈25000), was obtained from Ruixi (Xi’an, China). Trichloromethane, methanol, and dimethyl sulfoxide (DMSO) were provided by Aladdin. Lipofectamine 2000 Reagent was purchased from Invitrogen (Thermo Fisher Scientific, USA). IR780 iodide was purchased from Alfa Aesar (product of Ukraine). miR338-3p mimics was obtained from Ribo (Guangzhou, China). Cell Counting Kit 8 (CCK8), Gel-Red, DAPI, DiI were purchased from Beyotime Technology.
Preparation of Nanoparticles
2 mg IR780 and 25 mg PLGA-bPEI were placed into two EP tubes labeled A and B, respectively, and 0.5 mL methanol was added to tube A and 1 mL trichloromethane and 300 μL methanol was added to tube B. After A and B were fully dissolved, the liquid in tube A was poured into tube B, and was fully mixed and dissolved in an ultrasonic cleaning machine. We add PFP 100 μL to the mixture of tube B slowly in ice bath, and use a vibrometer for intermittent acoustic vibration, power 58.5W, time 5 min (ON:5 s, OFF:5 s). 6 mL PVA solution (4%) was added to the resulting solution, and the acoustic vibration was interrupted again with a power of 39 W and a time of 5 min (ON:5 s, OFF:5 s). 6 mL isopropyl alcohol (2%) was added to the resulting solution and stirred at low temperature for 3 hours. In the same way, P@P nanoparticles can be synthesized without adding IR780. H@IP nanoparticles can be synthesized by replacing PFP with equal amount of double steam water. P@I/PLGA nanoparticles can be synthesized by substituting PLGA-bPEI with PLGA. A suitable amount of DiI fluorescent dye was added into the liquid before acoustic shock to produce red fluorescent nanoparticles. The P@IP nanoparticles were mixed with miR338-3p mimics solution and incubated at room temperature to obtain P@IP-miRNA nanoparticles.
Characterization of P@IP-miRNA Nanoparticles
The size, morphology and dispersion of P@IP-miRNA NPs were observed by inverted fluorescence microscope, scanning electron microscope and transmission electron microscope. The particle size and Zeta potential of nanoparticles in conventional state were measured by Malvern instrument. IR780 solutions of different concentrations were prepared and their UV absorption peaks were measured. The standard curve was made by Graphpad prism 7. The encapsulation rate and drug loading rate of IR780 in P@IP nanoparticles were calculated by the following equations: The loading content (LC) and loading efficiency (LE) were calculated in the following manner: LC (%) = M(loaded drug)/M(NPs) × 100%; LE (%) = M(loaded drug)/M(initially added drug) × 100%.
Verify the Connection Between P@IP Nanoparticles and miRNA338-3p
Take 200 μL dii-P@IP nanoparticles at a concentration of 1 mg/mL, add 200 μL FAM modified miRNA338-3p (5 nmol), mix well, and stand for 30 min at room temperature. Then, centrifugation was performed at 8000 RPM for 5 min. The precipitation was gently suspended with double steam water, 10 μL of mixed liquid was absorbed, and the fluorescence distribution was observed under CLSM. The control group was P@I/PLGA nanoparticles, and other conditions were the same as the experimental group.
Detection of Adsorption Efficiency of miRNA338-3p
P@IP nanoparticles were 200 μL in each group and the concentration was 1 mg/mL. They were divided into 4 groups. Group 1 was blank control group, and groups 2, 3 and 4 were experimental groups. 200 μL FAM modified miRNA338-3p (5 nmol) was added to the samples in groups 2, 3 and 4, and mixed, and incubated at room temperature for 10 min, 30 min and 60 min, respectively. Add 200 μL double steam water to group 1. After each group was centrifuged at 8000 RPM for 5 min. Finally, the fluorescence distribution of each liquid was detected by CytoFLEX flow cytometry. The supernatant of each group was retained and the content of miRNA was detected by UV spectrophotometer.
Phase Transition of P@IP-miRNA Nanoparticles
P@IP-miRNA NPs (1 mg/mL) were added into 12-well plates and divided into 3 groups. Group 1 was the control group, and groups 2 and 3 were irradiated with LIFU for 1 min and 5 min (pulse mode, interval 1 s, power 2 W), respectively. Finally, it was observed and photographed with a light microscope.
ROS Production Capacity of P@IP-miRNA Nanoparticles
Add P@IP-miRNA nanoparticle solution to 96-well plate, 200 μL per well (IR780 concentration 15 μg/mL). Oxygen Sensor Green Reagent (SOSG) for 500 μM methanol solution, adding 1 μL SOSG solution to each well, irradiated by LIFU for 30s, 1 min, 2 min, 5 min (pulse mode, interval 1 s, power 2 W), respectively. The absorption peak of SOSG (λ excitation/λ emission = 504 nm/525 nm) was measured immediately with a multifunctional microplate meter.
In vitro Targeting of Nanoparticles
diI-P@IP-miRNA nanoparticles were prepared as experimental group and diI-P@P-miRNA nanoparticles as control group. Tpc-1 cells at logarithmic growth stage were inoculated into petri dishes (the number of cells in each dish was about 1×10⁵) for 24 h post-treatment. The experimental group and control group were labeled as 1 h group, 2 h group and 3 h group, respectively. After centrifugation, the precipitation was diluted to 0.1 mg/mL with RPMI 1640 medium. 100 μL corresponding NPs suspension was added to each confocal dish. Each group was incubated in the incubator for the corresponding time as planned. The free NPs were washed out with PBS from multiple angles, and the nuclei were stained with DAPI for 30 min. The residual dye was washed away with PBS, and 4% paraformaldehyde was added for full fixation. CLSM was used to observe the fluorescence distribution of cells in each group under the same parameters, and the uptake of nanoparticles in each group was compared. The cells in the 6-well plate were incubated and treated with the same grouping and experimental procedures, and detected by flow cytometry.
Subcellular Localization of Nanoparticles
DiI-P@IP-miRNA nanoparticles were prepared as experimental group and DiI-P@P-miRNA nanoparticles as control group. Tpc-1 cells at logarithmic growth stage were inoculated into petri dishes (the number of cells in each dish was about 1×10⁵) for 24 h post-treatment. The two kinds of nanoparticles were added to the petri dish and incubated for 2 h, respectively. The free nanoparticles were washed with PBS from multiple angles, and then LysoTracker (λ excitation/λ emission = 504 nm/511 nm) was added, respectively. The excess dyes were washed after 30 min of incubation. Finally, CLSM was used to observe and compare the fluorescence distribution of different groups.
Reactive Oxygen Species Produced by Nanoparticles in Cells
P@IP-miRNA nanoparticles (1 mg/mL) were added into the TPC-1 cell culture dish for incubation for 3 h, and the free NPs were washed with PBS, and then appropriate amount of ROS-ID® Oxidative Stress Detection Kit was added, and the excess dye was washed after incubation for 30 min. After LIFU irradiation (2 W, 3 min), CLSM was used to observe the fluorescence status immediately. Control group was not treated, and single P@IP-miRNA group was not treated with LIFU irradiation.
Gene Transfection Ability of Nanoparticles
Groups were as follows: blank control group, experimental group (P@P-miRNA group, P@IP-miRNA group). The incubation procedures and LIFU conditions were the same as above. After transfection of miRNA, the cells were cultured for 24 h, and then collected for qRT-PCR, Western blot and immunofluorescence detection.
Effects of Nanoparticles on Cell Activity
The cells were divided into 6 groups, which were blank control group and experimental group (single LIFU, P@IP, P@IP+LIFU, P@IP-miRNA, P@IP-miRNA+LIFU). The apoptosis rate was measured by CCK-8 assay, the relative cell survival rate was normalized, and the average of each group was obtained. In addition, cells in different states were stained with CAM (surviving cells) and PI (dead cells) and observed using CLSM.
Cell Culture and Tumor-Bearing Nude Mice Model
TPC-1 cells were purchased from the Institute of Ultrasound Imaging, Chongqing Medical University, and cultivated in an incubator (5% CO2, 37°C). The use of cells has been approved by the University Ethics Committee. The culture medium was RPMI 1640 medium containing 10% fetal bovine serum and 1% penicillin–streptomycin. Female nude mice and female BALB/c mice were purchased from the Laboratory Animal Center of Chongqing Medical University. All animal procedures were performed in accordance with the Guidelines for Care and Use of Laboratory Animals of Chongqing Medical University (Chongqing, China) and approved by the Animal Ethics Committee of Chongqing Medical University. Tumor cells were suspended in RPMI 1640 (100 μL) and implanted subcutaneously into the back of the mice to obtain tumor-bearing mice. The tumor volume was calculated by the following equation: Tumor volume (mm3) = 0.5 × Length × width × width.
Multimodal (Photoacoustic/Fluorescence/Ultrasonic) Imaging of Nanoparticles in vitro and in vivo
In vitro experiments, different concentrations of P@IP-miRNA NPs solution were selected for photoacoustic, fluorescence and ultrasonic imaging. In vivo experiment, tumor-bearing nude mice were injected with 200 μL P@IP-miRNA nanoparticles (5 mg/mL) via tail vein. Photoacoustic imaging (1 h, 2 h, 4 h, 6 h, 10 h, 24 h) and fluorescence imaging (2 h, 6 h, 10 h, 24 h) were performed on tumor-bearing mice at different time points before treatment and after nanoparticle injection, respectively, to analyze the intensity of photoacoustic signal, fluorescence signal of tumor tissues, and the distribution of fluorescence in different time. The recording time points of the control group and the experimental group were consistent. According to the experimental results of photoacoustic imaging and fluorescence imaging, the optimal therapeutic time window after the injection of P@IP-miRNA nanoparticles was selected and the tumor site was irradiated with LIFU (2 W, 3 min). B-mode ultrasound and contrast-enhanced ultrasound imaging were performed on the tumor site before and after LIFU irradiation.
In vivo Biosafety Analysis of Nanoparticles
Thirty BALB/C mice were randomly divided into 6 groups (5 mice in each group). The other 5 groups were all experimental groups, and P@IP-miRNA nanoparticles (5 mg/mL, 200 μL) were injected through the tail vein. At different times (1 d, 3 d, 7 d, 15 d, 30 d), the experimental group and control group were taken eyeballs for arterial blood. Total blood count (RBC, WBC, Lymph, PLT, HGB, HCT, MCV, MCHC), liver function (AST, ALT, ALP, TBIL), kidney function (BUN, CR) and cardiac enzyme (CK, LDH-L) were detected. Mice in each experimental group and control group were sacrificed randomly and their major organs (heart, liver, spleen, lung and kidney) were collected for H&E staining.
In vivo Combined Therapeutic Effects of Nanoparticles
Tpc-1 tumor-bearing nude mice were randomly divided into 7 groups with 5 mice in each group. Groups were: blank control; Single LIFU group; P @ IP group; P @ P – micrornas group; P @ IP – micrornas group; P @ IP + LIFU group; P @ IP – micrornas + LIFU group. The corresponding nanoparticles (5 mg/mL) were injected into the tail vein every 3 days, and body weight and tumor size were measured every 3 days. By monitoring the change of tumor relative volume, the anti-tumor effect of each treatment was analyzed. After 18 days of treatment, the tumor bearing mice were sacrificed, and tumors were collected for H&E staining, PCNA and TUNEL immunofluorescence detection, and AKT3 immunohistochemical detection. The proliferation and apoptosis of cells in tumor tissues and AKT3 expression in each group were analyzed.
Results and Discussion
Characterization of Nanoparticles
P@P nanoparticle suspension was milky white, and P@IP-miRNA nanoparticle suspension was light green to the naked eye (Figure 2A). Under the optical microscope, P@IP-miRNA nanoparticles were dotted (Figure 2B) and kept Brownian motion. Under SEM and TEM, P@IP-miRNA nanoparticles were uniform in size and regular in shape, with a hydrated particle size of about 180 nm and good dispersion (Figure 2C and D). Our study found that P@P nanoparticles had an average particle size of (164.70±11.39) nm, and our aggregate was 0.159±0.011, with an average potential of (14.56±3.35) mV. Our review also found that our gene flows with a high level of particle size (169.97±7.75) nm and our average potential (16.39±6.52) mV. The average particle size of P@IP-miRNA nanoparticles was (182.28±10.93) nm, and our aggregate was 0.174±0.029, with an average potential of (2.14±3.86) mV (Figure 2E–G). UV-vis spectra showed that the absorbance of IR780 at 780 nm increased with the increase of concentration (Figure 2H), and the corresponding standard curve. (R2=0.90) (Figure 2I). The UV-vis spectra of P@IP nanoparticles showed an obvious similar absorption peak at 780 nm (Figure 2J). Using the standard curve, the encapsulation rate of IR780 in P@IP nanoparticles was calculated to be (82.58±3.92) % and the drug loading rate was (6.60±0.32) %.
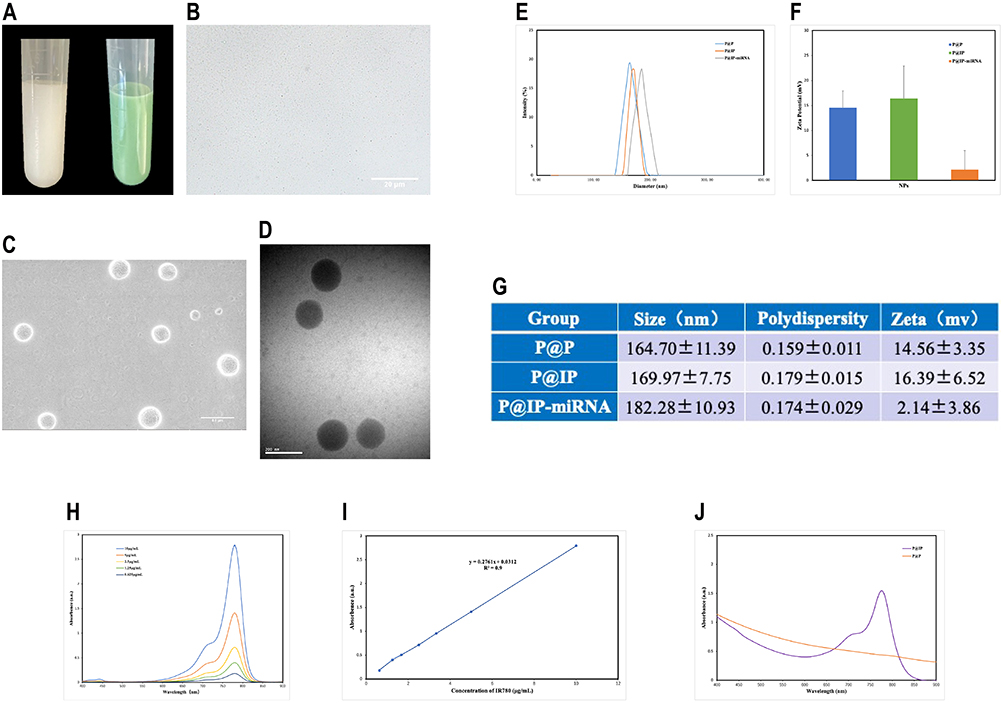 |
Figure 2 Morphology and physical characteristics of nanoparticles. (A) The appearance of P@P (left) and P@IP-miRNA (right) solutions. (B) The image of P@IP-miRNA nanoparticles under optical microscope. (C) SEM image and (D) TEM image of P@IP-miRNA nanoparticles. (E) The size distribution and (F) zeta-potential values of P@P, P@IP, P@IP-miRNA nanoparticles and (G) statistical data. (H) UV-vis spectra of free IR780 at different concentration and (I) the corresponding standard curve. (J) UV-vis spectra of different nanoparticles. |
Connection of P@IP Nanoparticles to miRNA338-3p
The CLSM images showed that P@IP nanoparticles labeled with DiI showed red fluorescence, while miRNA338-3p labeled with FAM showed green fluorescence. The two overlapped widely, and the fluorescence channels showed yellow fluorescence distribution after merging (Figure 3A). The fluorescence intensity curves of the two groups tended to be consistent, while the control group only had very few overlapped fluorescence signals. In addition, the fluorescence intensity curve trends differ greatly (Figure 3B). The results of flow cytometry showed that the proportion of fluorescent nanoparticles in experimental groups 2, 3 and 4 (incubated for 10 min, 30 min and 60 min) was 76.77%, 99.65% and 99.68%, respectively (Figure 3C–F). The adsorption of P@IP nanoparticles on miRNA was close to saturation when incubated for 30 min. The gene adsorption capacity of the nanoparticles was 41.78 μg/mg when the nanoparticles were incubated for 30 min.
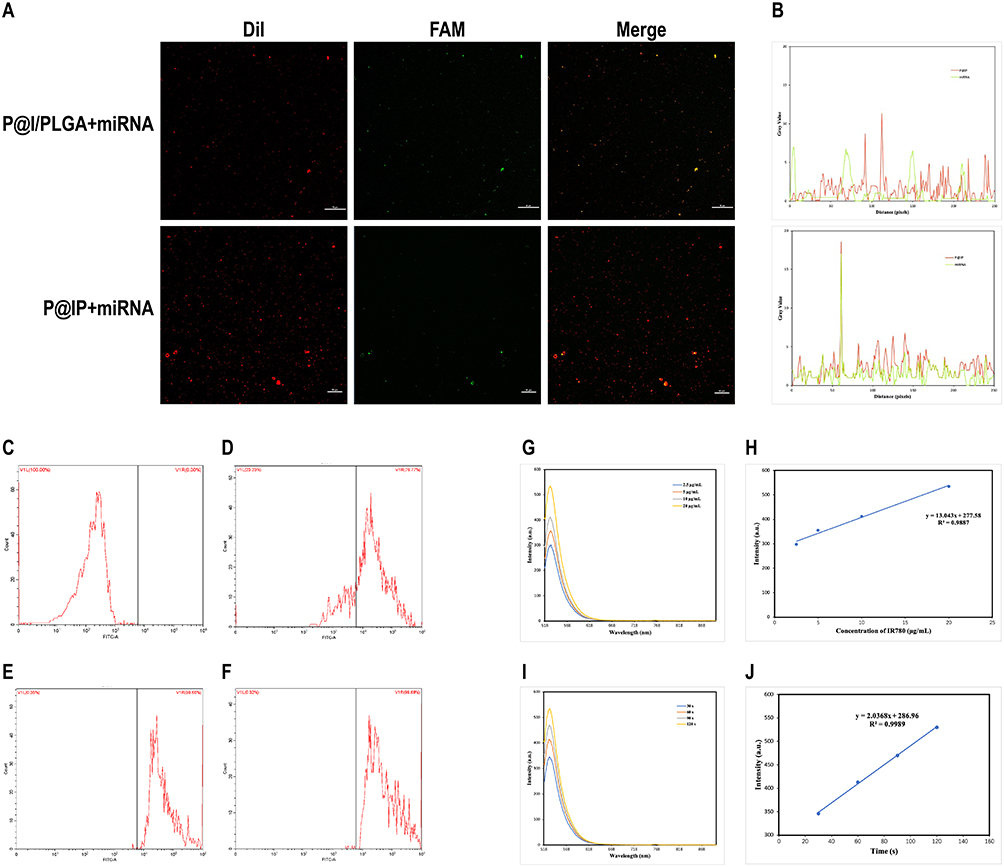 |
Figure 3 Verification of the connection between nanoparticles and miRNA and detection of ROS production capacity of nanoparticles. (A) CLSM images of DiI labeled nanoparticles and FAM labeled miRNA338-3p and (B) the fluorescence intensity curves of different nanoparticles. (C-F) Flow cytometry analysis of fluorescent nanoparticles with different incubation time (0 min, 10 min, 30 min and 60 min) of miRNA. (G) ROS production of P@IP-miRNA NPs with different concentrations of IR780 irradiated by LIFU (3 W, 120 s) and (H) its linear correlation. (I) ROS production of P@IP-miRNA NPs (the concentration of IR780 was 20 μg/mL) irradiated by LIFU (3 W) of different time and (J) its linear correlation. |
P@IP-miRNA Phase Transition of Nanoparticles
Before LIFU irradiation, P@IP-miRNA nanoparticles were spotted and kept Brownian motion under optical microscope. After LIFU irradiation, the nanoparticles changed into microbubbles. The number of phase change nanoparticles at 1 min was significantly less than that at 3 min.
ROS Production Capacity of Nanoparticles
The amount of ROS produced by P@IP-miRNA nanoparticles increases with the increase of the concentration of nanoparticles and the irradiation time of LIFU, and ROS is linearly correlated with the concentration of IR780 carried by P@IP-miRNA nanoparticles and the irradiation time of LIFU (Figure 3G–J).
In vitro Targeting of Nanoparticles
Under CLSM, red DiI fluorescence indicating the presence of nanoparticles near the nucleus represented by blue fluorescence in the cell. The fluorescence signal of the nanoparticles in the cells increased with the increase of incubation time. At the same time point, the fluorescence signal of the experimental group P@IP-miRNA was significantly higher than that of the control group P@P-miRNA (Figure 4D). The results of flow cytometry showed that the cell uptake efficiency of P@P-miRNA group was 2.49%, 29.19% and 51.98% at 1 h, 2 h and 3 h of incubation, respectively. The cell uptake efficiency of P@IP-miRNA group was 59.89%, 99.27% and 99.98% after incubation for 1 h, 2 h and 3 h, respectively (Figure 4E). In addition, the intracellular red DiI fluorescence representing P@IP-miRNA nanoparticles had a low coincidence degree with the green fluorescence of LysoTracker labeled lysosomes, and the yellow overlapping fluorescence signal was very rare. The analysis of the two fluorescence signals showed that there was almost no consistent trend in the fluorescence intensity curve and the fluorescence coincidence degree was low (Figure 4A–C).
 |
Figure 4 Detection of in vitro targeting of nanoparticles. (A) CLSM images of DiI labeled nanoparticles and Lysotracker labeled lysosomes. (B) The fluorescence intensity curve and (C) the fluorescence distribution analysis. (D) CLSM images of TPC-1 cells incubated with different nanoparticles for different time (DAPI labeled nuclei, DiI labeled nanoparticles) and (E) the flow cytometry analysis. |
Gene Transfection Ability of Nanoparticles
qRT-PCR results showed that the miRNA-338-3P content of TPC-1 cells in P@IP-miRNA group was significantly higher than that in P@P-miRNA group and blank control group, and the difference was statistically significant (**P<0.01, ***P<0.001). Western blot results showed that the expression of AKT3, the target protein of TPC-1 cells in P@IP-miRNA group was significantly lower than that in P@P-miRNA group and blank control group, and the difference in gray ratio was statistically significant (**P<0.01, ***P<0.001) (Figure 5A–C). Immunofluorescence test results showed that the red fluorescence signal representing AKT3 was significantly reduced in the P@IP-miRNA group, which was significantly lower than that in the P@P-miRNA group and the blank control group (Figure 5D). The experimental results proved that P@IP-miRNA nanoparticles successfully transfected miRNA338-3p into TPC-1 cells, and ensured that exogenous miRNA338-3p played a role in antagonizing AKT3 and reducing the intracellular expression of AKT3 protein.
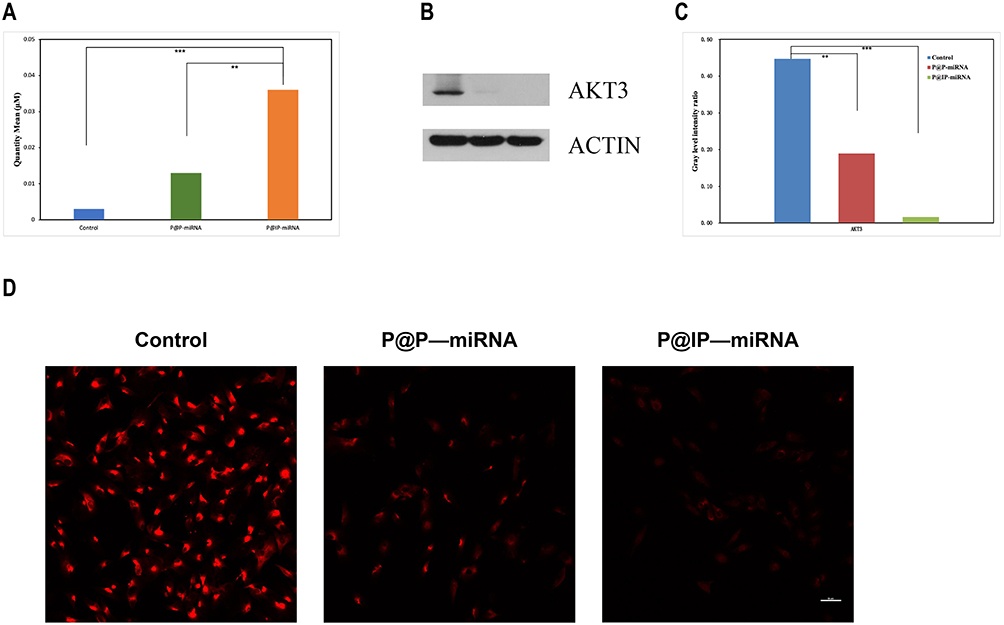 |
Figure 5 Validation of gene transfection capacity of nanoparticles. (A) Quantitative analysis of miRNA338-3p in TPC-1 cells incubated with P@P-miRNA, P@IP-miRNA by qRT-PCR. (B) Analysis of AKT3 expression in TPC-1 cells incubated with P@P-miRNA, P@IP-miRNA by Western blot and (C) Gray ratio of each group (**P < 0.01, ***P < 0.001). (D) Comparison of AKT3 expression in TPC-1 cells incubated with different nanoparticles by immunofluorescence assay. |
Effects of Nanoparticles on Cell Activity
When the concentration of nanoparticles was ≤1 mg/mL, the survival rate of cells did not change significantly. The biosafety of nanoparticles was proved. When the concentration of P@IP nanoparticles increased to 2 mg/mL, the cell survival rate decreased significantly (* P < 0.05) (Figure 6A), so the safe concentration of nanoparticles can be determined as 1 mg/mL. CCK8 test results showed that when the concentration of nanoparticles was 1 mg/mL, the cell activity of blank control group, single LIFU group and P@IP group was not significantly decreased. The cell activity of P@IP+LIFU, P@IP-miRNA and P@IP-miRNA+LIFU groups was significantly decreased, and the cell inhibition rate of P@IP-miRNA+LIFU group was the highest, which was significantly higher than that of The P@IP-miRNA+LIFU and The P@IP-miRNA group (*P < 0.05) (Figure 6B). Living cells with green fluorescence and dead cells with red fluorescence were observed under CLSM microscope, and the proportion trend of living cells to dead cells in each group was consistent with the results of CCK8 (Figure 6D). Flow cytometry showed that the apoptosis rates of each group were 4.85% in blank control group, 7.50% in single LIFU group, 5.61% in P@IP group, 33.50% in P@P-miRNA group, 66.29% in P@IP-miRNA group and 67.23% in P@IP+LIFU group, respectively. P@IP-miRNA+LIFU group 92.50% (Figure 6C). The experimental results demonstrated that P@IP-miRNA mediated sonodynamic and gene combination therapy had better antitumor effect on TPC-1 cells in vitro, and was significantly better than single factor therapy.
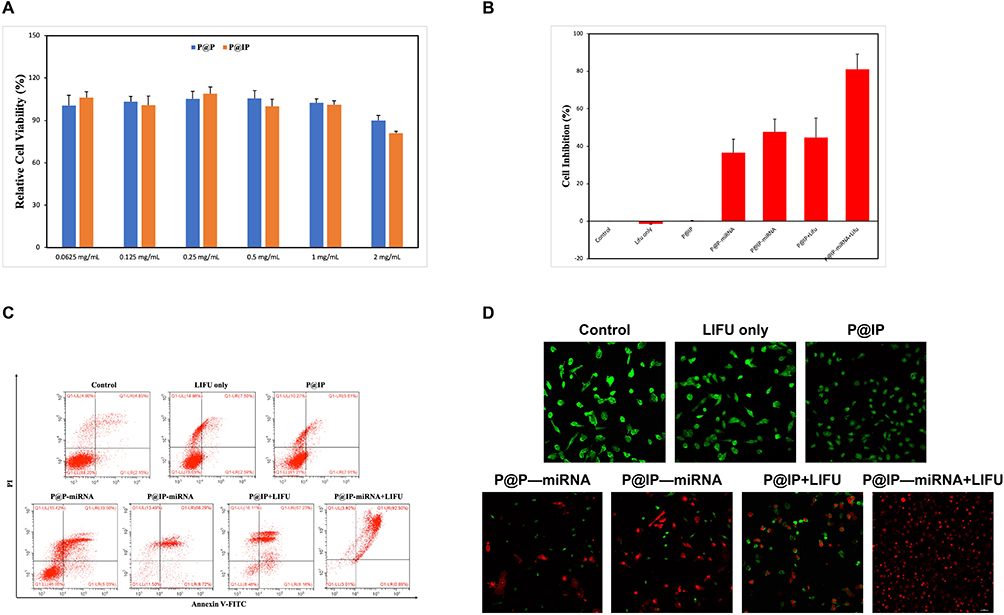 |
Figure 6 Effects of nanoparticles on cell activity. (A) Effects on the relative cell viability of P@P and P@IP nanoparticles at different concentrations (*P < 0.05). (B) Cell inhibition of TPC-1 after different treatments (*P < 0.05). (C) FCM analysis of cell apoptosis after different treatments. (D) CLSM images of TPC-1 cells stained with CAM/PI after different treatments. |
Multimodal Imaging of Nanoparticles in vitro and in vivo
P@IP-miRNA nanoparticles were scanned at full wavelength (680–980 nm) under the photoacoustic imaging system, and the obtained photoacoustic signal intensity was plotted as A curve, with the peak signal intensity at 780 nm (Figure 7A). 780 nm was selected as the excitation wavelength to detect the photoacoustic images of P@IP-miRNA nanoparticles with different concentrations (Figure 7B), and their photoacoustic signals increased with the increase of concentration. The average intensity of ROI of each group was analyzed and the results of P@IP-miRNA concentration showed a linear relationship (R2=0.98) (Figure 7C). The fluorescence imaging ability of P@IP-miRNA nanoparticles in vitro was detected by the fluorescence imaging system of small animals in vivo (Figure 7D), indicating that they had strong fluorescence signal in vitro. B-mode ultrasound and CEUS imaging were performed on P@IP-miRNA nanoparticles in the gel model under different LIFU irradiation conditions using ultrasound diagnostic instrument (Figure 7E). The image showed that the ultrasonic imaging signal was the strongest when the LIFU power was 2 W and the irradiation time was 3 min. The average gray value of the region of interest of each group of images was analyzed and compared, and the results were consistent with the image performance.
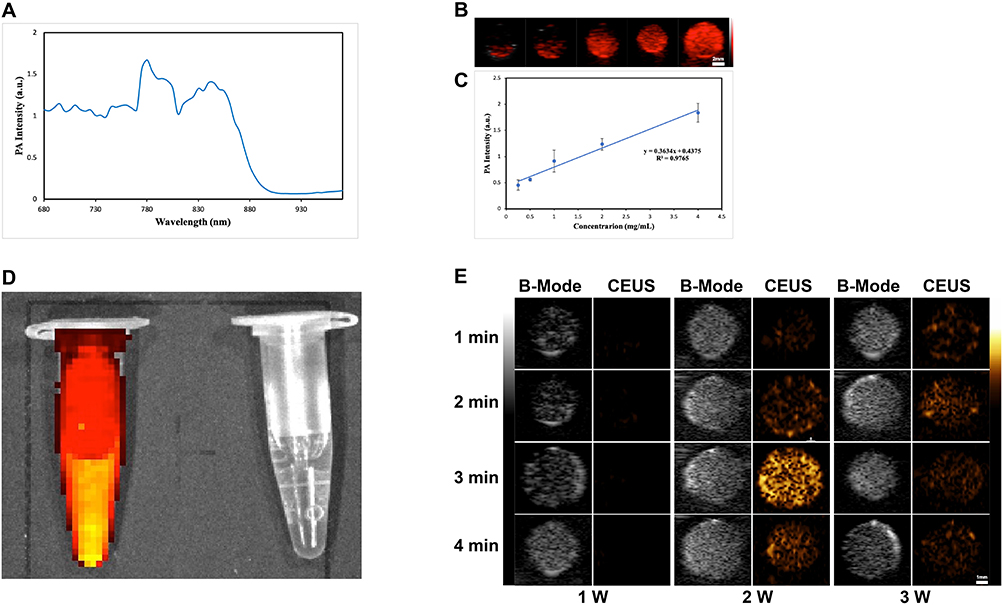 |
Figure 7 Multimodal imaging of nanoparticles in vitro. (A) The PA intensity curve of P@IP-miRNA in the wavelength range of 680–980 nm. (B) The PA images of P@IP-miRNA nanoparticles of different concentrations. (C) The linear relationship between P@IP-miRNA nanoparticle concentration and PA intensity. (D) In vitro fluorescence images of P@IP-miRNA nanoparticles (left) and water (right). (E) The US images (B-mode and CEUS-mode) of P@IP-miRNA nanoparticles irradiated by different power and time of LIFU. |
In the in vivo experiment, after P@IP-miRNA nanoparticles were injected into the tail vein of tumor bearing nude mice, the photoacoustic images collected at different time points (Figure 8A) showed that with the increase of time, the photoacoustic signals at the tumor site gradually increased, reaching A peak at 6h, and then slightly decreased. The control group had no photoacoustic signal. The mean photoacoustic signal intensity of tumor sites in photoacoustic images at each time point was quantitatively analyzed, and the results were consistent with the image (Figure 8B). In vivo small animal fluorescence imaging system, fluorescence images were collected at different time points on tumor-bearing nude mice injected with P@IP-miRNA nanoparticles intravenously (Figure 8C), and the fluorescence signals were obviously aggregated at the tumor site. The average intensity of fluorescence signal in the tumor area was analyzed, and the results showed that the fluorescence signal was strongest 6 h after injection (Figure 8D). Fluorescence imaging was performed on the tumor and the main organs of the tumor mice 24h after injection, and quantitative analysis was carried out. The results showed that the fluorescence signal of the tumor site was significantly higher than that of the main organs. However, in the control group without the involvement of targeted molecules, the fluorescence signal intensity of the tumor was weak throughout, and was significantly lower than that in the experimental group after 24 hours (**P<0.01) (Figure 8E and F). Based on the results of photoacoustic and fluorescence imaging, 6 h was selected as the optimal time window for the effect of LIFU in vivo. Six hours after the injection of nanoparticles into the tail vein of tumor-bearing nude mice, B-mode ultrasound and CEUS images before and after LIFU irradiation were collected by ultrasonic diagnostic instrument (Figure 8G), and the average gray value of each group of images was quantitatively analyzed (Figure 8H and I). B-mode ultrasound and CEUS imaging results of LIFU irradiation in P@IP-miRNA group were obvious. The average gray value of the image was significantly higher than that before LIFU irradiation, and the difference was statistically significant (*P<0.05, **P<0.01).
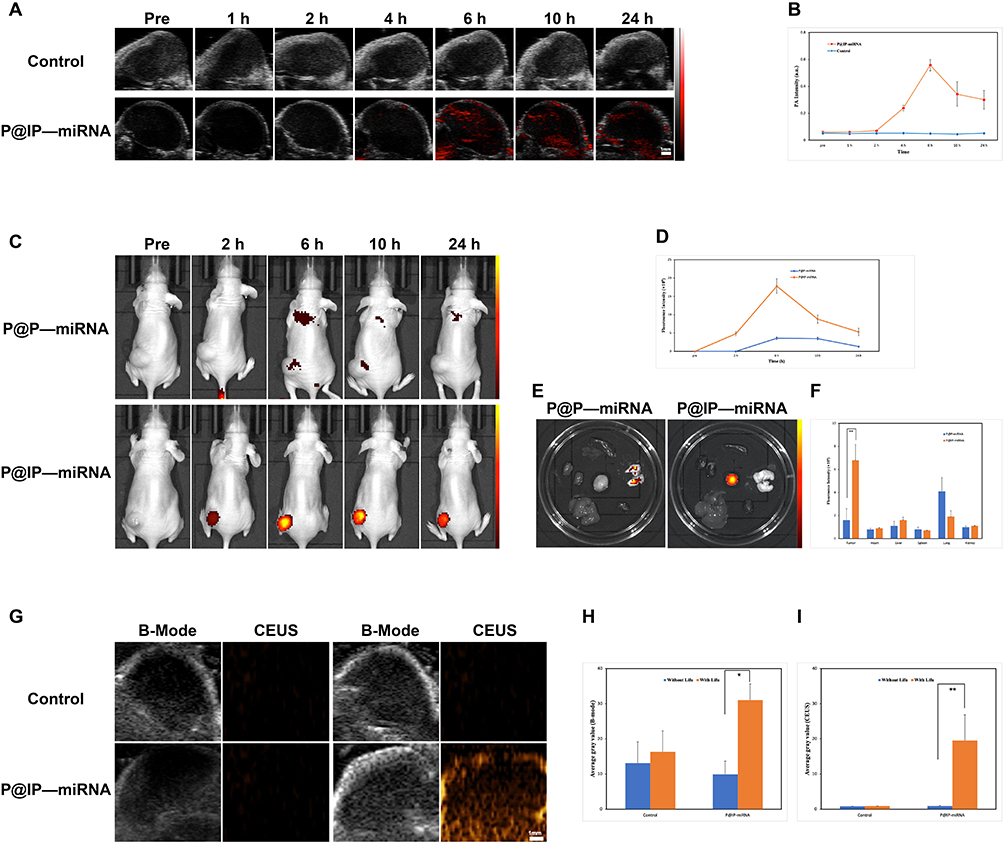 |
Figure 8 Multimodal imaging of nanoparticles in vivo. (A) The PA images of tumor at different time points after intravenous injection of P@IP-miRNA nanoparticles and normal saline and (B) the corresponding tumor PA intensity. (C) In vivo fluorescence images of tumor-bearing mice at different time points after intravenous injection of different nanoparticles and (D) the corresponding fluorescence signal intensity of tumors. (E) The fluorescence images and (F) signal intensity of tumors and major organs in Ex vivo (**P < 0.01). (G) The US images (B-mode and CEUS-mode) of tumor before and after LiFU. (H) The average grayscale values of US images (B-mode) (*P < 0.05). (I) The average grayscale values of US images (CEUS-mode) (**P < 0.01). |
The experimental results confirmed that P@IP-miRNA nanoparticles have good multimodal (photoacoustic, fluorescence, ultrasound) imaging ability in vivo and in vitro, verified the tumor targeting of nanoparticles in vivo, and clarified the optimal time window for in vivo combination therapy.
In vivo Biosafety of Nanoparticles
Blood samples and major organs of BALB/C mice were detected at different time points (1 d, 3 d, 7 d, 15 d and 30 d) after the injection of P@IP-miRNA nanoparticles through tail vein. The results showed that there were no significant differences in the total blood count, liver function, kidney function and myocardial enzymes between each group and the control group (Figure 9A–H). H&E staining of major organs showed no obvious abnormality (Figure 9I). These results indicate that P@IP-miRNA nanoparticles have good biosafety in mice, which is a prerequisite for future clinical application.
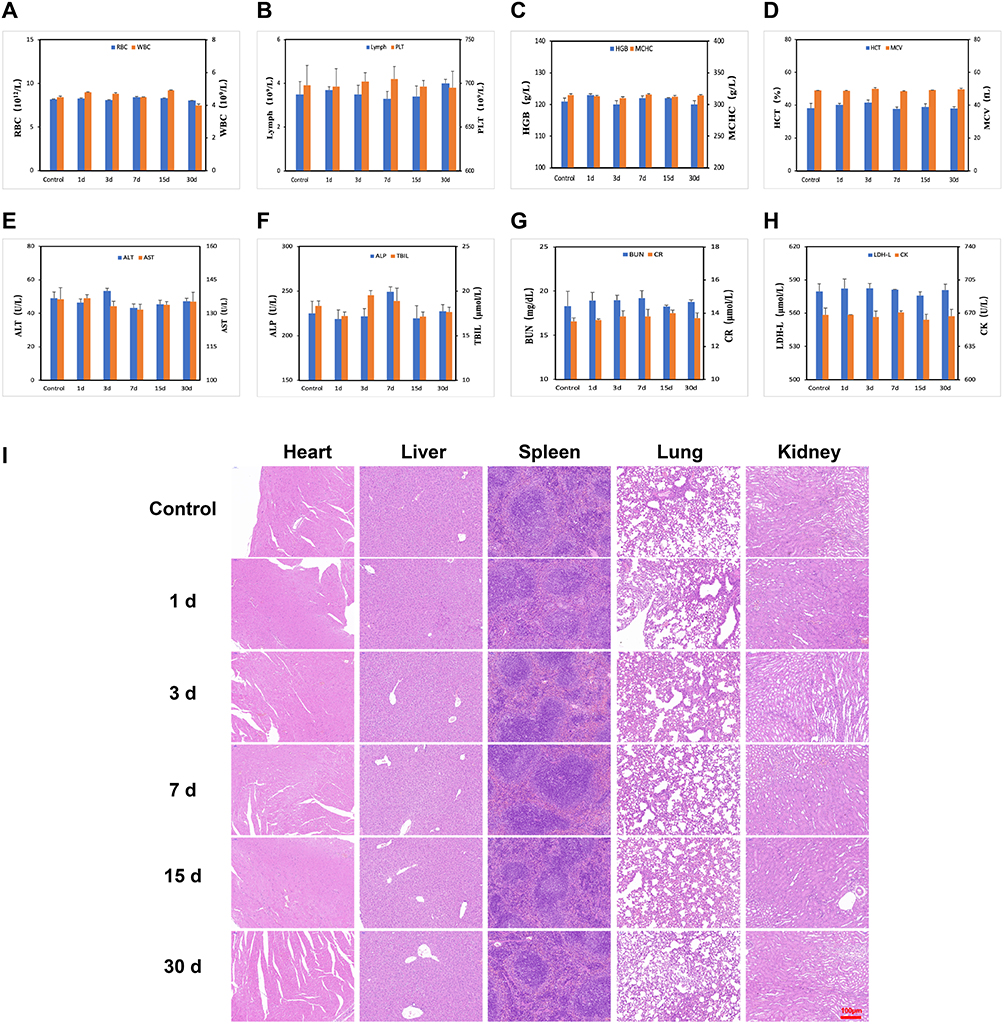 |
Figure 9 In vivo biosafety of nanoparticles. (A–H) The whole blood cell count and hematological assay of BALB/c mice at 1, 3, 7, 15, and 30 days following the intravenous injection of P@IP-miRNA nanoparticles and saline. (I) The H&E staining of major organs of BALB/c mice at 1, 3, 7, 15, and 30 days following the intravenous injection of P@IP-miRNA nanoparticles and saline. |
In vivo Combined Therapeutic Effects
After different treatments, all tumor-bearing nude mice were photographed to investigate the tumor growth every 3 days for 18 days (Figure 10D). The relative tumor volume during treatment and in vitro tumor weight at the end of treatment were analyzed to evaluate the tumor inhibition effect of treatment measures in each group (Figure 10A and B). Compared with the control group, the single LIFU group and the P@IP group had no significant tumor suppressive effect, while the P@P-miRNA, P@IP-miRNA, P@IP+LIFU and P@P-miRNA +LIFU groups had therapeutic effect. Among them, the tumor suppressive effect of P@IP-miRNA group was significantly better than that of P@P-miRNA group (*P < 0.05), proved the tumor targeting effect of P@IP-miRNA nanoparticles in vivo, which was consistent with the results of the previous sections. The tumor suppressive effect of P@IP-miRNA+LIFU group was the best, significantly better than that of P@IP-miRNA group and P@IP+LIFU group (**P<0.01), indicating that P@IP-miRNA nanoparticle mediated sonodynamic gene combination therapy can effectively inhibit PTC, with good therapeutic effect in vivo, and better efficacy than single factor therapy. There was no significant difference in body weight of the P@P-miRNA, P@IP-miRNA, P@IP+LIFU and P@IP-miRNA+LIFU groups before and after treatment (Figure 10C). The body weight of the blank control group, the single LIFU group and the P@IP group decreased significantly at the end of treatment, which may be due to the tumor progression causing cachexia in tumor-bearing mice under ineffective treatment, resulting in body weakness in tumor-bearing nude mice.
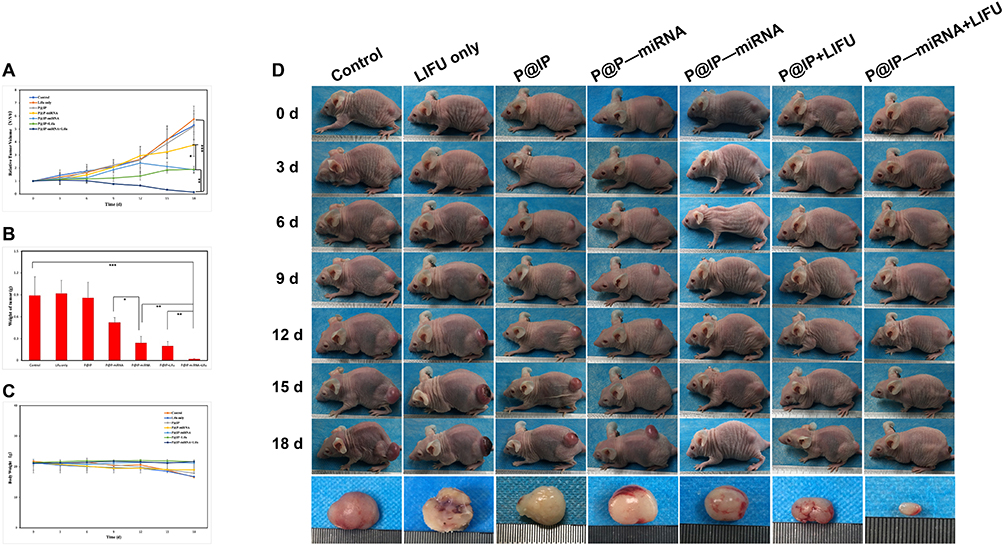 |
Figure 10 Antitumor effect in vivo of different groups. (A) The relative volume of tumors during the treatments. (B) The weight of isolated tumors after 18 days of treatments. (C) The body weight of tumor-bearing mice during the treatments. (D) Images of tumor-bearing mice within 0–18 days of treatments, and the last row of images shows isolated tumors after 18 days of treatments. (*P < 0.05, **P < 0.01, ***P < 0.001). |
Immunofluorescence results (Figure 11C) showed that the P@IP-miRNA+LIFU group showed the maximum range of green TUNEL fluorescence (apoptotic cells) and minimal red PCNA fluorescence (proliferating cells). Compared with other groups, the P@IP-miRNA+LIFU group had the largest proportion of apoptotic cells and the smallest proportion of proliferating cells. H&E staining results (Figure 11C) showed that the tumor cells in the P@IP-miRNA+LIFU group were the most damaged, and the tissue structure was almost completely destroyed. From the histological perspective, the antitumor effect of P@IP-miRNA nanoparticle mediated sonodynamic gene therapy on PTC was further demonstrated. In addition, H&E staining of the major organs of tumor mice showed no obvious pathological changes (Figure 11D).
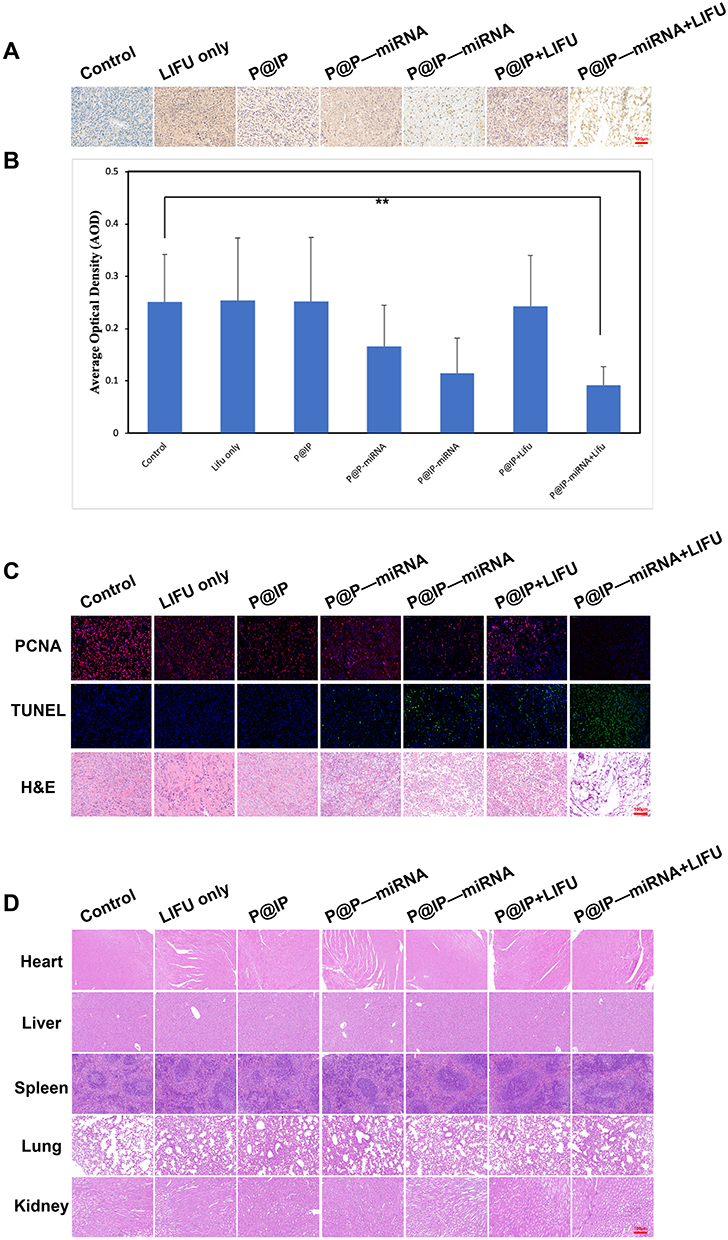 |
Figure 11 Immunohistochemical and pathological analysis of therapeutic effect in vivo. (A) The AKT3 immunohistochemical images of isolated tumors after 18 days of different treatments and (B) the average optical density values of immunohistochemical images (**P < 0.01). (C) From top to bottom: PCNA, TUNEL immunofluorescence, and H&E staining of isolated tumors after different treatments. (D) The H&E staining of major organs of tumor-bearing mice after 18 days of different treatments. |
Compared with the control group, the expression of AOD in the tumor tissues of P@IP-miRNA and P@IP-miRNA+LIFU groups was significantly down-regulated (**P < 0.01) (Figure 11A and B). These results demonstrate the targeted transfection ability of P@IP-miRNA nanoparticles to PTC tissue in vivo. The successfully transfected miRNA338-3p had an antagonistic effect on the target AKT3 and significantly inhibited the expression of AKT3 in tumor tissues, thus exerting an anti-tumor effect.
Experimental results showed that under the action of LIFU, P@IP-miRNA nanoparticle mediated sonodynamic and gene therapy could play a good therapeutic effect on PTC under the premise of maintaining biological safety in vivo, and the efficacy was significantly better than that of single factor therapy.
This study provides a new method for the treatment of PTC. At present, the treatment commonly used in clinical for PTC all have their own disadvantages. Among them, conventional surgery is the primary treatment, but the extent of surgical resection and the choice of lymph node dissection area need to be measured between reducing overtreatment and avoiding recurrence as much as possible, which is currently controversial. However, some complications following surgery, including injury of recurrent laryngeal nerve, reduced parathyroid function, anesthesia risk, etc., as well as social problems such as treatment cost, scar effect, and possible lifelong medication, are all factors that prevent patients from choosing surgical treatment. Endocrine therapy and radioiodine therapy are commonly used as postoperative adjuvant therapy. However, these treatments cannot avoid iatrogenic hypothyroidism or hyperthyroidism. In addition, the application of radioactive iodine dose is still controversial. The radiation generated by reaching a higher effective dose will cause damage to the body and the possibility of causing dedifferentiation of the lesion.33–35 Although thermal ablation has the advantages of less surgical trauma and less influence on thyroid function. However, in recent years, the discussion on thermal ablation therapy of PTC has not stopped. Although there has long been a consensus36 and several studies37–40 have demonstrated the clinical feasibility of thermal ablation for unresectable recurrent thyroid cancer, there is still insufficient evidence to support its use as a routine first-line treatment for PTC. Compared with existing conventional therapies, P@IP-miRNA nanoparticles can realize the integration of diagnosis and treatment, and have the advantages of less trauma and targeted precision therapy at the cellular level. Although the current research data are far from meeting the requirements of clinical application, we believe that its application and development are worth looking forward to.
There are still limitations to our study. Only TPC-1 was selected as the research object. However, the targeted molecule IR780 used in this study is targeted to broad-spectrum tumor cells, and miRNA338-3p is involved in the apoptosis process of most solid tumors. Therefore, P@IP-miRNA nanoparticle mediated multimodal imaging and combination therapy should theoretically be effective not only for TPC-1 cells, but also for other cell lines such as B-CPAP, KTC-1 or 8305C, and even for other types of solid tumor cells. This point will be worth exploring in future research.
Conclusions
In general, we have innovatively combined sonodynamic and gene therapy, using P@IP-miRNA NPs as vectors to promote each other. On one hand, P@IP-miRNA NPs can be targeted to the tumor region, enabling photoacoustic, fluorescence and ultrasound multimodal imaging, providing more information for the diagnosis and evaluation of PTC. On the other hand, P@IP-miRNA NPs can target PTC to transfect miRNA338-3p, significantly inhibit tumor proliferation, and produce ROS under LIFU irradiation, thereby realizing sonodynamic combined gene therapy of PTC. We have preliminarily verified the diagnostic and therapeutic capabilities of P@IP-miRNA NPs for PTC, and our study confirmed that the NPs have a good biological safety. Since the NPs are targeted to broad-spectrum tumors, our future studies will take full advantage of the superior properties of NPs to explore their effects on other types of tumors. At the same time, we will further study the mechanism of action of P@IP-miRNA NPs at the molecular level, so as to explore further improvement solutions. Compared with current clinical contrast agents which only have the function of imaging, it is expected that multifunctional nanoparticles, P@IP-miRNA, will have a broad application prospect in the diagnosis and treatment of cancer in the future.
Acknowledgments
The authors thank the Chongqing Key Laboratory of Ultrasound Molecular Imaging for providing the laboratory facilities, especially the laboratory leaders, Prof. Zhigang Wang and Prof. Haitao Ran. This work was supported by the Department of Finance of Jilin Province (grant nos. 2020SCZ08, 2021SCZ26).
Shihui Guan and Dengke Teng are co-first authors.
Disclosure
The authors declare no competing financial interest.
References
1. Andre´s Coca-Pelaz JP, Shah JC, Hernandez-Prera JC, et al. Papillary thyroid cancer—aggressive variants and impact on management: a narrative review. Adv Ther. 2020;37:3112–3128. doi:10.1007/s12325-020-01391-1
2. Affinito O, Orlandella FM, Luciano N, et al. Evolution of intra‑tumoral heterogeneity across different pathological stages in papillary thyroid carcinoma. Cancer Cell Int. 2022;22:263. doi:10.1186/s12935-022-02680-1
3. Chen J, Qingyuan H, Hou H, et al. Metabolite analysis-aided diagnosis of papillary thyroid cancer. Endocr Relat Cancer. 2019;26:829–841. doi:10.1530/ERC-19-0344
4. Zhan L, Feng H, Yu X, et al. Clinical and prognosis value of the number of metastatic lymph nodes in patients with papillary thyroid carcinoma. BMC Surg. 2022;22:235. doi:10.1186/s12893-022-01635-7
5. Dolidze DD, Shabunin AV, Mumladze RB, et al. A narrative review of preventive central lymph node dissection in patients with papillary thyroid cancer – a necessity or an excess. Front Oncol. 2022;12:906695. doi:10.3389/fonc.2022.906695
6. Alibakhshi A, Sheikhi S, Yazd SMM, et al. The incidence and features of Delphian lymph node involvement in patients with papillary thyroid carcinoma. BMC Surg. 2022;22:320. doi:10.1186/s12893-022-01742-5
7. Chang Q, Zhang J, Wang Y, et al. Nomogram model based on preoperative serum thyroglobulin and clinical characteristics of papillary thyroid carcinoma to predict cervical lymph node metastasis. Front Endocrinol. 2022;13:937049. doi:10.3389/fendo.2022.937049
8. McLeod DSA, Zhang L, Durante C, et al. Contemporary debates in adult papillary thyroid cancer management. Endocr Rev. 2019;40(6):1481–1499. doi:10.1210/er.2019-00085
9. Song JL, Li LR, Xu ZL, et al. Long-term survival in patients with papillary thyroid cancer who did not undergo prophylactic central lymph node dissection: a SEER-based study. World J Oncol. 2022;13(3):136–144. doi:10.14740/wjon1483
10. Bhangu JS, Bichler C, Altmeier J, et al. Papillary thyroid cancer: the value of bilateral diagnostic lymphadenectomy. Langenbecks Archiv Surg. 2022;407:2059–2066. doi:10.1007/s00423-022-02493-w
11. Zhou J, Da-xue L, Gao H, et al. Relationship between subgroups of central and lateral lymph node metastasis in clinically node-negative papillary thyroid carcinoma. World J Clin Cases. 2022;10(12):3709–3719. doi:10.12998/wjcc.v10.i12.3709
12. Zhang Y, Zhang X, Jie L, et al. Contrast-enhanced ultrasound: a valuable modality for extracapsular extension assessment in papillary thyroid cancer. Eur Radiol. 2021;1:1–8.
13. Yang J, Zhang F, Qiao Y. Diagnostic accuracy of ultrasound, CT and their combination in detecting cervical lymph node metastasis in patients with papillary thyroid cancer: a systematic review and meta-analysis. BMJ Open. 2022;12:e051568. doi:10.1136/bmjopen-2021-051568
14. Jung CK, Bychkov A, Kakudo K. Update from the 2022 World Health Organization classification of thyroid tumors: a standardize diagnostic approach. Endocrinol Metab. 2022;37:703–718. doi:10.3803/EnM.2022.1553
15. Catalanotto C, Cogoni C, Zardo G. MicroRNA in control of gene expression: an overview of nuclear functions. Int J Mol Sci. 2016;17:1712. doi:10.3390/ijms17101712
16. Szczepanek J, Skorupa M, Tretyn A. MicroRNA as a potential therapeutic molecule in cancer. Cells. 2022;11:1008. doi:10.3390/cells11061008
17. Kumar V, Gupta S, Varma K, et al. Diagnostic performance of microRNA-34a, let-7f and microRNA-31 in epithelial ovarian cancer prediction. J Gynecol Oncol. 2022;33(4):e49. doi:10.3802/jgo.2022.33.e49
18. Diao Y, Hongyu F, Wang Q. MiR-221 exacerbate cell proliferation and invasion by targeting TIMP3 in papillary thyroid carcinoma. Am J Ther. 2017;24:317–328. doi:10.1097/MJT.0000000000000420
19. Huang Y, Yu S, Cao S. MicroRNA-222 promotes invasion and metastasis of papillary thyroid cancer through targeting protein phosphatase 2 regulatory subunit B alpha expression. Thyroid. 2017;36:1607–1620.
20. Chou C-K, Yang KD, Chou F-F, et al. Prognostic implications of miR-146b expression and its functional role in papillary thyroid carcinoma. J Clin Endocrinol Metabt. 2013;98(2):E196–E205. doi:10.1210/jc.2012-2666
21. Albert DLC, Jazdzewski K. MicroRNAs in thyroid cancer. J Clin Endocrinol Metab. 2011;96(11):3326–3336. doi:10.1210/jc.2011-1004
22. Chengfeng X, Gengming C, Junjia Z, et al. MicroRNA signature predicts survival in papillary thyroid carcinoma. J Cell Biochem. 2019;120(10):17050–17058. doi:10.1002/jcb.28966
23. Colombol C, Minna E, Gargiuli C, et al. The molecular and gene/miRNA expression profiles of radioiodine resistant papillary thyroid cancer. J Exp Clin Cancer Res. 2020;39:245–259. doi:10.1186/s13046-020-01757-x
24. Abdullah MI, Junit SM, Ng KL, et al. Papillary thyroid cancer: genetic alterations and molecular biomarker investigations. Int J Med Sci. 2019;16(3):450–460. doi:10.7150/ijms.29935
25. Sui G-Q, Fei D, Guo F, et al. MicroRNA-338-3p inhibits thyroid cancer progression through targeting AKT3. Am J Cancer Res. 2017;7(5):1177–1187.
26. Liu X, Wang C, Zijian S, et al. Circ_0001658 regulates PI3K/AKT signaling via the miR-671-5p/ITGA2 axis and affects the progress of papillary thyroid carcinoma. Ann Transl Med. 2022;10(18):1001. doi:10.21037/atm-22-3650
27. Victor Choi MA, Rajora GZ. Activating drugs with sound: mechanisms behind sonodynamic therapy and the role of nanomedicine. Bioconjugate Chem. 2020;31:967–989.
28. Guo Q, Dai X, Yin M, et al. Nanosensitizers for sonodynamic therapy for glioblastoma multiforme: current progress and future perspectives. Military Med Res. 2022;9:26. doi:10.1186/s40779-022-00386-z
29. Wang C, Tian Y, Bolin W, et al. Recent progress toward imaging application of multifunction sonosensitizers in sonodynamic therapy. Int J Nanomedicine. 2022;17:3511–3529. doi:10.2147/IJN.S370767
30. Yekuo L, Zhou Q, Deng Z, et al. IR-780 dye as a sonosensitizer for sonodynamic therapy of breast tumor. Sci Rep. 2016;13(4):4742–4751.
31. Chang N, Qin D, Pengying W, et al. IR780 loaded perfluorohexane nanodroplets for efficient sonodynamic effect induced by short-pulsed focused ultrasound. Ultrason Sonochem. 2019;53:59–67. doi:10.1016/j.ultsonch.2018.12.021
32. Zhang E, Luo S, Tan X, et al. Mechanistic study of IR-780 dye as a potential tumor targeting and drug delivery agent. Biomaterialia. 2014;35:771–778. doi:10.1016/j.biomaterials.2013.10.033
33. Shangguan L, Zhang P, Fang S, et al. Preliminary study on the relationship of braf mutations with the outcome of the first 131I radiotherapy and malignant biological characteristics in papillary thyroid carcinoma. Int J Gen Med. 2021;14:8981–8989. doi:10.2147/IJGM.S337311
34. Jiang L, Zhan Y, Yusen G, et al. Changes of regulatory T and B cells in patients with papillary thyroid carcinoma after 131 I radioablation: a preliminary study. Biomed Res Int. 2013;2013:683768. doi:10.1155/2013/683768
35. Tuttle RM., Ahuja S, Avram AM., et al. Controversies, consensus and collaboration in the Use of I-131 therapy in differentiated thyroid cancer: a joint statement from the American Thyroid Association, the European Association of Nuclear Medicine, the Society of Nuclear Medicine and Molecular Imaging and the European Thyroid Association. Thyroid. 2018;5:1–37.
36. Na DG, Lee JH, Jung SL, et al. Radiofrequency ablation of benign thyroid nodules and recurrent thyroid cancers: consensus statement and recommendations. Korean J Radiol. 2012;13(2):117–125. doi:10.3348/kjr.2012.13.2.117
37. Lili J, Qin W, Jun G, et al. Ultrasound-guided percutaneous laser ablation for papillary thyroid microcarcinoma: a retrospective analysis of 37 patients. Cancer Imaging. 2019;19:1–8. doi:10.1186/s40644-018-0187-z
38. Cho SJ, Baek SM, Lim HK, et al. Long-term follow-up results of ultrasound-guided radiofrequency ablation for low-risk papillary thyroid microcarcinoma: more than 5 year follow-up for 84 tumors. Thyroid. 2020;11:1–22.
39. Teng D-K, Wen-Hui L, Jia-Rui D, et al. Effects of microwave ablation on papillary thyroid microcarcinoma: a 5-year follow-up report. Thyroid. 2020;10:1–25.
40. Choi Y, Jung S-L. Efficacy and safety of thermal ablation techniques for the treatment of primary papillary thyroid microcarcinoma: a systematic review and meta-analysis. Thyroid. 2019;7:1–36.
 © 2023 The Author(s). This work is published and licensed by Dove Medical Press Limited. The
full terms of this license are available at https://www.dovepress.com/terms
and incorporate the Creative Commons Attribution
- Non Commercial (unported, 3.0) License.
By accessing the work you hereby accept the Terms. Non-commercial uses of the work are permitted
without any further permission from Dove Medical Press Limited, provided the work is properly
attributed. For permission for commercial use of this work, please see paragraphs 4.2 and 5 of our Terms.
© 2023 The Author(s). This work is published and licensed by Dove Medical Press Limited. The
full terms of this license are available at https://www.dovepress.com/terms
and incorporate the Creative Commons Attribution
- Non Commercial (unported, 3.0) License.
By accessing the work you hereby accept the Terms. Non-commercial uses of the work are permitted
without any further permission from Dove Medical Press Limited, provided the work is properly
attributed. For permission for commercial use of this work, please see paragraphs 4.2 and 5 of our Terms.
Recommended articles
An Experimental Study into the Photodynamic/Sonodynamic Therapy of Triple-Negative Breast Cancer Mediated by the Novel Nano-Photonic Sensitizer NBDPBr Nanoparticles
Huang Q, Wang L, Zhang Y, Zhao L, Zhang T
International Journal of Nanomedicine 2026, 21:576927
Published Date: 28 March 2026