Back to Journals » Nature and Science of Sleep » Volume 18

Multicenter Validation of an AI-Based Snoring Model vs. Wearables for Diagnosing Sleep Apnea
Authors Guan H ![]() , Huang J, Liu D, Yang L, Zeng H, Huang J
, Huang J, Liu D, Yang L, Zeng H, Huang J ![]() , Miao B
, Miao B
Received 7 December 2025
Accepted for publication 23 April 2026
Published 14 May 2026 Volume 2026:18 582714
DOI https://doi.org/10.2147/NSS.S582714
Checked for plagiarism Yes
Review by Single anonymous peer review
Peer reviewer comments 2
Editor who approved publication: Dr Sarah L Appleton
Haoyan Guan,1 Junyu Huang,2 Danling Liu,1 Long Yang,3,4 Hao Zeng,1 Jingjing Huang,4 Beiping Miao1
1Department of Otolaryngology Head and Neck Surgery, The Second People’s Hospital of Shenzhen (the First Affiliated Hospital of Shenzhen University), Shenzhen, Guangdong, People’s Republic of China; 2Department of Otolaryngology Head and Neck Surgery, The First Affiliated Hospital of Xiamen University, Xiamen, Fujian, People’s Republic of China; 3State Key Laboratory of Medical Neurobiology and MOE Frontiers Center for Brain Science, Fudan University, Shanghai, People’s Republic of China; 4Sleep Medicine Center, ENT Institute and Otorhinolaryngology Department, Eye & ENT Hospital, Fudan University, Shanghai, People’s Republic of China
Correspondence: Beiping Miao, Department of Otolaryngology Head and Neck Surgery, The Second People’s Hospital of Shenzhen (The First Affiliated Hospital of Shenzhen University), Shenzhen, Guangdong, People’s Republic of China, Email [email protected] Jingjing Huang, Sleep Medicine Center, ENT Institute and Otorhinolaryngology Department, Eye & ENT Hospital, Fudan University, Shanghai, People’s Republic of China, Email [email protected]
Background: Sleep apnea–hypopnea syndrome (SAHS) has high prevalence and cardiovascular/cerebrovascular comorbidities. Polysomnography (PSG) is the diagnostic gold standard but limited by complexity, cost, and accessibility; smart wearables are convenient but less accurate. This study validated an AI-based snoring-sound model and compared its diagnostic performance with a wearable, using PSG as reference.
Methods: Adults with suspected SAHS (n = 134) were included and underwent overnight PSG, with simultaneous snoring sound and wearable signal recording. The snoring algorithm used short-time Fourier transform (STFT) spectrograms and a multiscale encoder–attention–decoder neural network for classification. Model performance was assessed using correlation analysis, intraclass correlation coefficient (ICC), Bland–Altman plots, and receiver operating characteristic (ROC) analyses. Accuracy, sensitivity, specificity, and area under the curve (AUC) values were computed for both models.
Results: Disease severity was associated with variation in BMI (p < 0.001) and decreasing oxygen saturation (p < 0.001). The snoring model showed stronger correlation and higher agreement with PSG-derived AHI (r = 0.79, ICC = 0.753) than the wearable (r = 0.68). Although the snoring model yielded consistently higher AUCs, particularly in mild SAHS (AUC = 0.83 vs. 0.72, p = 0.07), the differences between methods were not statistically significant (all p > 0.05). Both models achieved excellent discriminative performance in severe SAHS (AUC ≥ 0.90).
Conclusion: The AI-driven snoring-sound model demonstrated comparable overall performance and numerically better performance in certain settings, particularly in identifying mild SAHS.
Plain Language Summary: Sleep apnea-hypopnea syndrome (SAHS) is a common disorder with serious health implications, including cardiovascular and cerebrovascular risks. PSG is the gold standard for diagnosing SAHS but is limited by cost and accessibility. This has led to the development of wearable devices, though their accuracy is compromised by the inability to measure airflow directly and detect subtle arousals.
This study introduces an AI-based snoring sound analysis model as a non-invasive and scalable diagnostic tool for SAHS. Compared to PSG, the snoring model shows comparable performance, particularly in detecting mild SAHS, and demonstrates higher AUC values than wearable devices (AUC 0.83 vs. 0.72).
Keywords: sleep apnea syndromes, snoring, machine learning, sensitivity and specificity
Introduction
Sleep apnea–hypopnea syndrome (SAHS) is a prevalent sleep-related breathing disorder characterized by repetitive episodes of upper-airway obstruction during sleep, resulting in intermittent hypoxemia, sleep fragmentation, and excessive daytime somnolence. The disorder is closely linked with cardiometabolic and cerebrovascular diseases, and its prevalence is particularly high among patients with hypertension, coronary artery disease, heart failure, atrial fibrillation, and stroke.1,2 Moreover, genetic evidence supports a causal link between snoring and cerebrovascular events, highlighting the pathophysiological and public health significance of upper-airway obstruction in Chinese adults.3 Epidemiologic investigations have further shown that China bears the largest population burden of SAHS worldwide, with a recent multilevel meta-analysis estimating that the prevalence among Chinese adults has increased from approximately 8% in 2000–2005 to nearly 27% in 2021–2024, reflecting the growing national health burden.4,5 Globally, obstructive sleep apnea is estimated to affect nearly 1 billion adults aged 30–69 years, including approximately 425 million with moderate-to-severe disease, underscoring its substantial worldwide public health burden.4
Snoring, the most characteristic manifestation of SAHS, is caused by airflow turbulence and soft-tissue vibration within the upper airway. Acoustic analysis of snoring provides valuable insight into the site and degree of airway obstruction, offering a noninvasive window into upper-airway mechanics.6,7 Experimental modeling has confirmed that narrowing of the upper airway directly increases snoring intensity, while the resonant frequency of snoring is inversely correlated with airway length, an anatomic indicator of collapsibility.6
Meanwhile, the emerging interdisciplinary field of audiomics, which applies artificial intelligence (AI) to human acoustic signals, has enabled the extraction of disease-specific vocal and respiratory biomarkers from ordinary sound recordings.8–10 AI-driven acoustic analysis has demonstrated promising diagnostic capability across cardiopulmonary and neurological diseases, suggesting its potential as a scalable tool for sleep-disordered breathing assessment.
Currently, polysomnography (PSG) remains the diagnostic gold standard for SAHS, providing comprehensive physiologic recordings of airflow, respiratory effort, and oxygen saturation. However, its complexity, cost, and limited accessibility hinder large-scale screening. Along with other portable devices, smart wearable devices have emerged as practical alternatives, allowing home-based monitoring of oxygen saturation and pulse rate, yet their diagnostic precision remains inferior to PSG.11–15
Building upon this foundation, the present study aimed to extract quantitative features from snoring sounds using an AI-based acoustic model and to compare its diagnostic performance with that of a smart wearable device for detecting SAHS, using PSG as the reference standard.
A previous study from our group reported the construction of a multimodal dataset for sleep apnea detection.16 In contrast, the present study uses a separate multicenter dataset collected from different participants and focuses on evaluating the diagnostic performance of an AI-based snoring sound analysis model in a clinical setting.
Materials and Methods
Workflow of the Study
The overall workflow of this multicenter study is illustrated in Figure 1. Patients with suspected sleep-disordered breathing were enrolled from three collaborating institutions: the ENT Institute of Fudan University, the Second People’s Hospital of Shenzhen, and the First Affiliated Hospital of Xiamen University. During each PSG session, snoring sounds were simultaneously recorded using a bedside digital audio device, and physiological signals were concurrently collected by a wearable device. Data attrition was mainly attributable to three categories of quality-control-related issues. (1) PSG-related exclusions were associated with signal artifacts, unstable airflow channels, or insufficient sleep duration for reliable AHI scoring. (2) Snoring-sound data loss resulted from low signal-to-noise ratio caused by microphone displacement, head-position obstruction, or excessive ambient noise, leading to unusable audio segments during preprocessing. (3) Wearable-device data loss occurred when devices were improperly worn, detached during sleep, or incompletely synchronized, resulting in insufficient continuous nocturnal recordings. After applying these quality-control exclusions, the final valid dataset comprised 144 PSG recordings, 121 snoring-sound recordings, and 107 wearable-device recordings. Analyses were conducted using all available valid data for each modality after quality control, without restricting to subjects with complete data across all modalities.
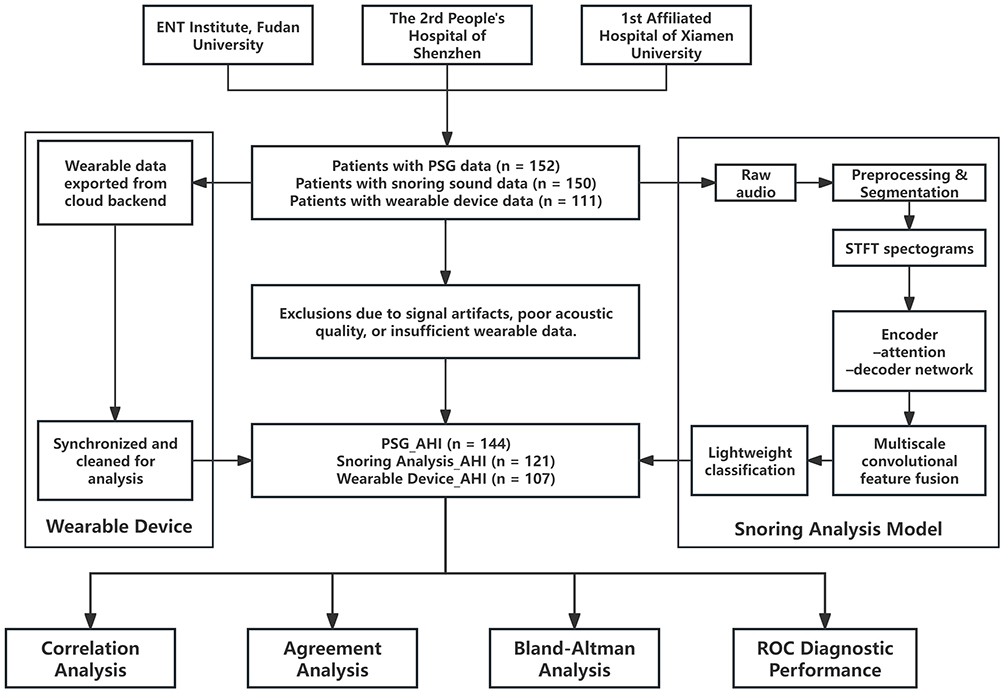 |
Figure 1 Study workflow and data availability across different modalities. PSG, snoring recordings, and wearable device data were analyzed based on the availability of valid recordings for each modality. |
Wearable-device data were exported from the cloud platform backend, synchronized with PSG timelines, and cleaned for missing or invalid segments. The algorithm implemented in the device is proprietary, and the researchers had no access to modify, inspect, or influence its internal processing or outputs. All wearable-derived data were used as generated by the device without any post hoc adjustment. Snoring audio signals underwent preprocessing and segmentation, followed by short-time Fourier transform (STFT) to generate spectrograms. These were processed by a multiscale encoder–attention–decoder neural network, which extracted temporal features through parallel depthwise convolutions and channel-attention modules, then fused them via a lightweight decoder for classification. The AI model used in this study was pre-trained prior to this analysis, and no further training or parameter tuning was performed on the current dataset.
The processed PSG_AHI, Snoring Analysis_AHI, and Wearable Device_AHI data (n = 144, 121, and 107, respectively) were integrated for comparative evaluation. Demographic analyses were performed in participants with complete clinical information (n = 134), whereas model performance analyses were conducted using all available recordings for each modality.
The methodological framework for snoring-sound preprocessing and model construction followed our previously published workflow.16 However, all data used in the present multicenter diagnostic-accuracy study were newly collected, and no participants or recordings from the prior publication were included. In the current work, we applied this framework to a larger, independent cohort and extended the analysis to evaluate diagnostic accuracy against PSG and wearable-derived AHI across multiple centers.
Patient Population
Patients who attended the Department of Otolaryngology, Head and Neck Surgery at the Second People’s Hospital of Shenzhen, the ENT Institute of the Eye and ENT Hospital of Fudan University, or the First Affiliated Hospital of Xiamen University between June 2025 and August 2025 were enrolled. The sample size was determined based on the pre-study calculation, using Cohen’s kappa coefficient. An expected agreement of 0.85, an allowable error margin of 0.06, and a two-sided 95% confidence interval (Z = 1.96) were assumed. Using these parameters, the minimum required sample size was estimated to be 136 participants. A potential 10% dropout or data loss rate was considered, and the final target sample size was set at 150 participants. No randomization procedure was applied.
Eligible participants were adults aged 18–70 years, irrespective of sex or body mass index (BMI). Exclusion criteria included: (1) presence of other severe airway diseases or injuries; (2) mental illness; (3) current use of sedative or antipsychotic medications; (4) previous upper airway surgery; or (5) pregnancy. The study protocol adhered to the principles of the Declaration of Helsinki, and written informed consent was obtained from all participants. The study was approved by all three Ethics Committees of participating hospitals. Based on the anticipated recruitment capacity of the three centers, the total sample size was allocated at an approximate ratio of 3:1:1, with a planned enrollment of 90 participants from the Eye and ENT Hospital of Fudan University and 30 participants each from the Second People’s Hospital of Shenzhen and the First Affiliated Hospital of Xiamen University.
The final enrolled sample was consistent with this plan: 90 from the Eye and ENT Hospital of Fudan University, 33 from the Second People’s Hospital of Shenzhen, and 29 from the First Affiliated Hospital of Xiamen University.
All participants underwent overnight polysomnography (PSG) using a Polysomnography Recorder (EMBLA, Natus Medical Inc). at the sleep center of one of the participating hospitals. In accordance with the criteria of the American Academy of Sleep Medicine (AASM) Manual (Version 2.0), apnea events were defined as a ≥90% reduction in airflow from pre-event baseline lasting at least 10 seconds, whereas hypopnea events were defined according to the AASM acceptable (optional in Version 3.0) criteria, as a ≥30% reduction in airflow lasting at least 10 seconds, associated with ≥4% oxygen desaturation.17–19 The apnea-hypopnea index (AHI) was calculated as the mean number of apneic and hypopneic events per hour of sleep. Sleep apnea-hypopnea syndrome (SAHS) was diagnosed when AHI ≥5 events per hour and classified as mild (5–15), moderate (15–30), or severe (≥30).17,19
A previously published study from our group described the development of a multimodal dataset for sleep apnea detection.16 However, the dataset used in the present study is entirely independent. All data in this study were newly collected from different participants across multiple centers, and no data from the previously published dataset were reused in this analysis.
Snoring Analysis Model Algorithm
The snoring-based classification algorithm first performs preprocessing and segmentation of the raw audio signals. Each segment is then transformed into a short-time Fourier transform (STFT) spectrogram, which serves as the network input. A multiscale neural architecture with an encoder–attention–decoder structure is employed, in which depthwise separable convolutional branches with different dilation rates operate in parallel to extract multiscale temporal features. Channel-attention modules are applied to adaptively weight salient representations, and features from multiple scales are subsequently fused and reconstructed through a lightweight decoder for final classification.
Statistical Analysis
All statistical analyses were performed using the R software (version 4.3.1; R Foundation for Statistical Computing, Vienna, Austria). Model performance was assessed by calculating accuracy, sensitivity, specificity, and the area under the receiver operating characteristic curve (AUC). Receiver operating characteristic (ROC) curves were plotted to visually illustrate the discriminative ability of each model, by plotting sensitivity against 1-specificity across a range of classification thresholds. Diagnostic performance across SAHS severity levels was evaluated using a one-vs-rest (OVR) ROC framework, and comparisons between the snore-based and wearable device–based AHIs were performed on paired samples using DeLong’s test. Subgroup analyses were conducted by stratifying participants according to sex, age (<40 vs. ≥40 years), and body mass index (BMI; <24 vs. ≥24 kg/m2),20 with 40 years used as a commonly adopted threshold for age stratification in epidemiological studies. AUCs were calculated within each subgroup using the same OVR framework.
For continuous variables, data are presented as the mean ± standard deviation (SD), whereas categorical variables are expressed as counts and percentages. Statistical significance was defined as P < 0.05.
Results
Demographics of the Study Cohort
A total of 134 participants were included, with the majority classified as severe SAHS (55.2%) (Table 1). The cohort was predominantly male (80.6%), and the proportion of males increased significantly with disease severity (p < 0.05), while BMI also increased progressively (p < 0.001). Hypertension was the most common comorbidity, present in 20.9% of participants. Regarding respiratory event type, obstructive events predominated (78.5%), whereas mixed type and hypopnea-only patterns were less frequent, and central type events were rare (p < 0.01).
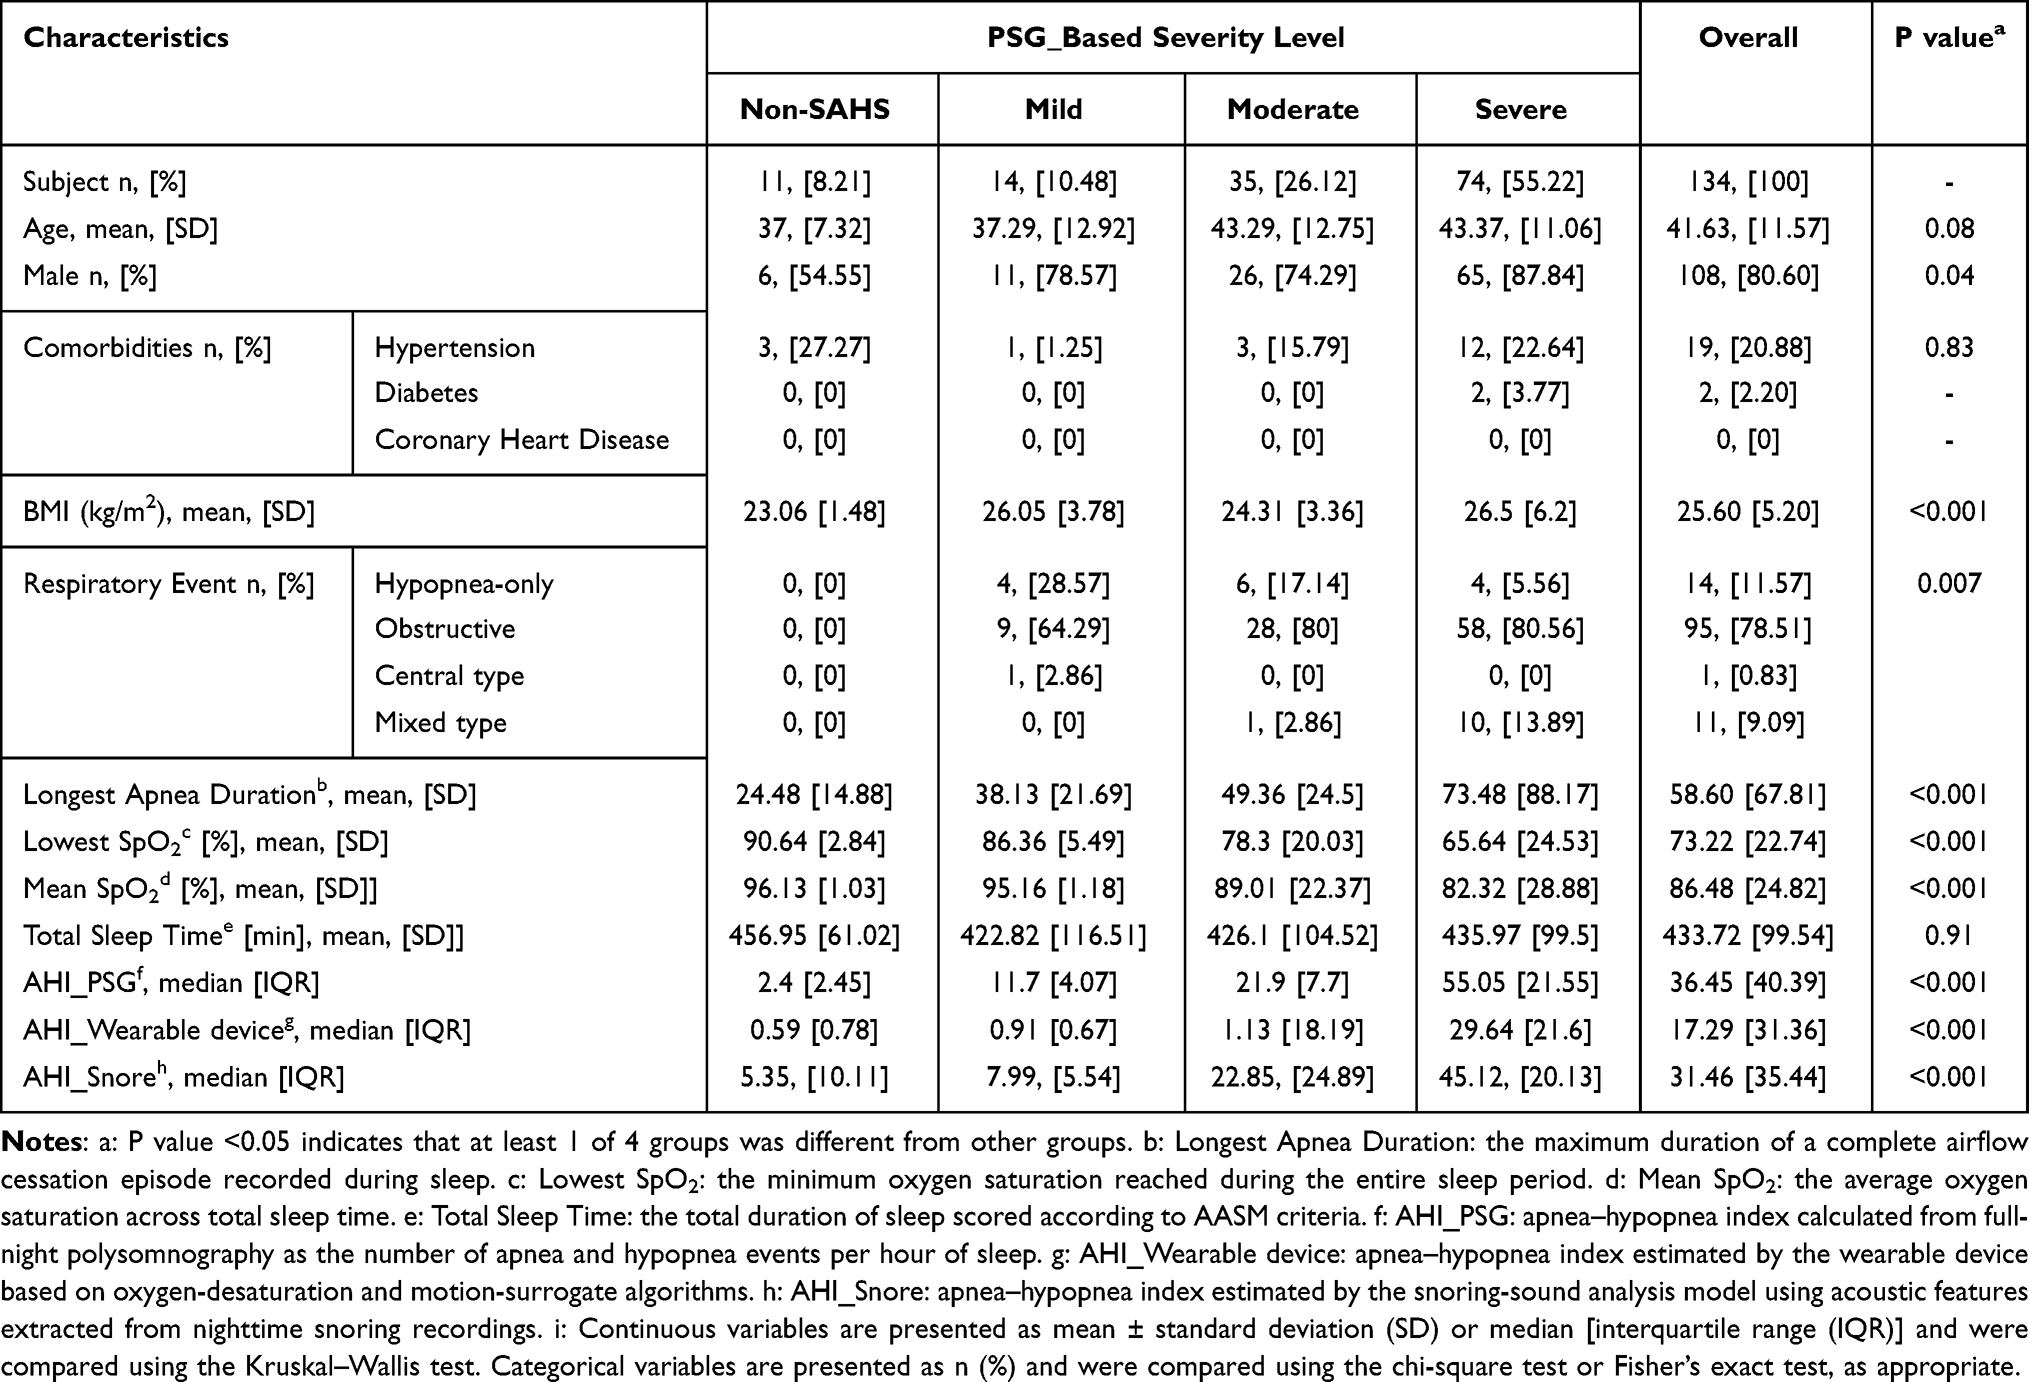 |
Table 1 Demographic of Study Cohort |
The longest apnea duration and oxygen saturation indices showed clear severity-related trends. The mean longest apnea duration increased progressively across severity groups (p < 0.001). Correspondingly, the lowest and mean SpO2 values decreased progressively across severity stratification (both p < 0.001). The total sleep time did not differ significantly among groups (p > 0.05).
As expected, the PSG-derived AHI increased sharply with disease category (p < 0.001). Both the wearable-based AHI and snoring-based AHI followed similar increasing trends (both p < 0.001).
Agreement and Correlation Between Snoring-Sound–Based Model, Wearable Device Model, and Polysomnography
The apnea–hypopnea index (AHI) derived from the Snoring Analysis showed a strong positive correlation with PSG-derived AHI (r = 0.79, 95% CI [0.72–0.85], p = 1.44e-27, n = 121), whereas the AHI obtained from the wearable device model exhibited a moderate correlation (r = 0.68, 95% CI [0.56–0.77], p = 1.52e-15, n = 107) (Figure 2).
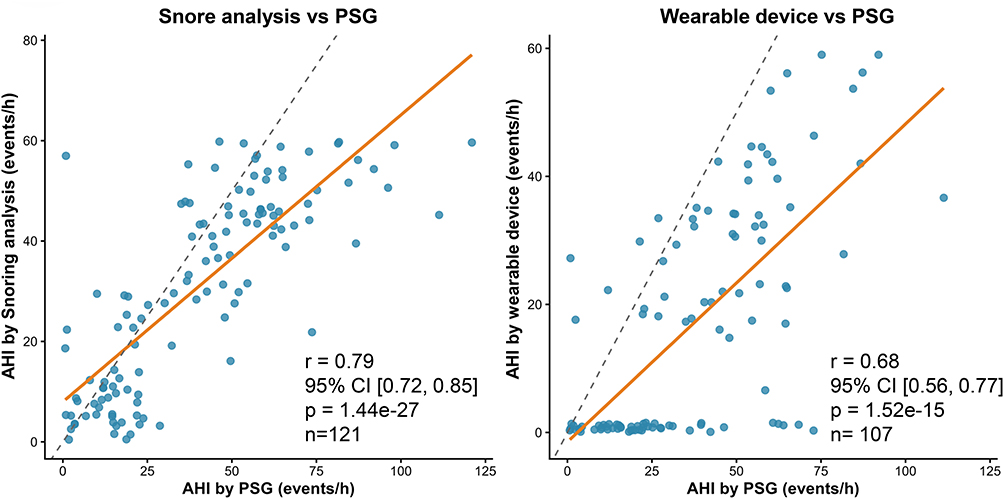 |
Figure 2 Scatter plots showing correlations between AHI derived from the Snoring analysis (left) or wearable device (right) and PSG. Solid Orange lines represent linear regression fits; dashed lines denote the line of identity. |
Agreement analysis between the Snoring Analysis model and polysomnography (PSG) demonstrated good consistency. The intraclass correlation coefficient (ICC) between AHI values derived from the Snoring Analysis and PSG was 0.753 (95% CI: 0.664–0.821), indicating a substantial level of agreement. Bland–Altman analysis revealed a mean bias of –9.12 events/h, with 95% limits of agreement ranging from –41.25 to 23 events/h (Figure 3), suggesting that the Snoring Analysis model slightly underestimated AHI compared with PSG while maintaining overall good concordance across the measurement range.
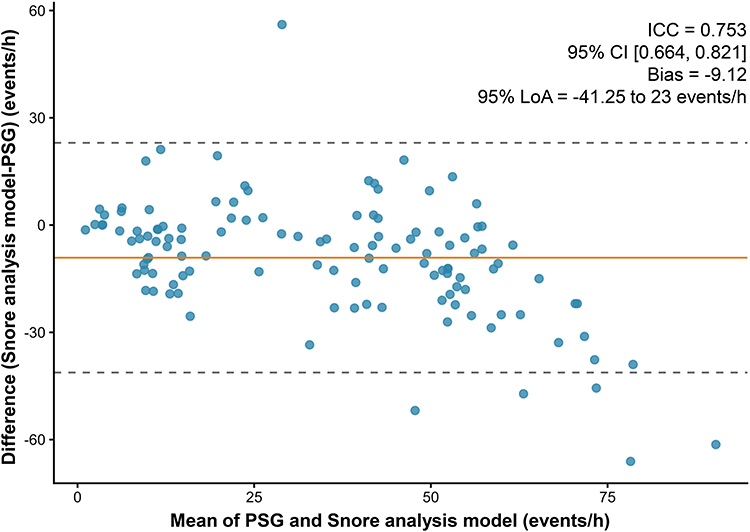 |
Figure 3 Bland–Altman plot comparing the apnea–hypopnea index (AHI) obtained from the Snoring analysis model and polysomnography (PSG). Each dot represents one participant. The solid Orange line indicates the mean bias between the two methods (–9.12 events/h), while the dashed lines represent the 95% limits of agreement (–41.25 to 23 events/h). The intraclass correlation coefficient (ICC) was 0.753 (95% CI [0.664, 0.821]). |
Overall, these findings indicate that the Snoring Analysis provides a valid and reliable estimation of AHI when compared with the PSG.
Diagnostic Performance of Snoring-Sound–Based Model and Wearable Device Model
In the one-vs-rest ROC analysis (each severity level versus all other levels), both the snore-derived and wearable device-derived AHIs demonstrated good to excellent discriminative ability across PSG-defined severity levels (Figure 4).
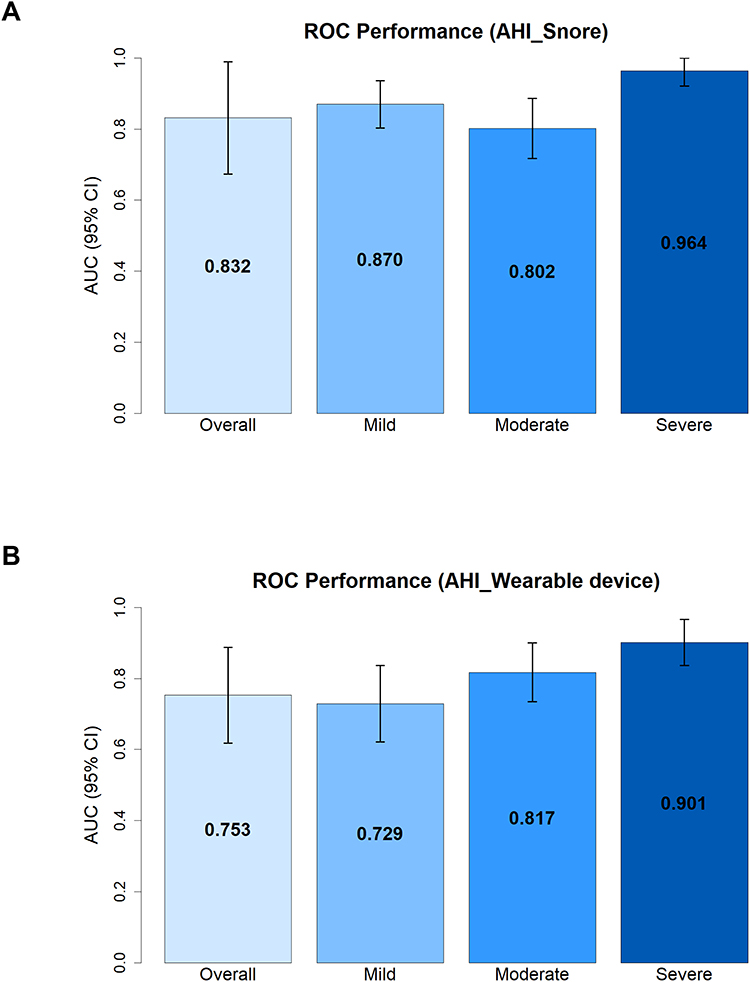 |
Figure 4 ROC performance of the Snoring Analysis Model and Wearable Device for detecting SAHS severity. (A) Receiver operating characteristic (ROC) analysis comparing the Snoring Analysis–derived apnea–hypopnea index (AHI) with the polysomnography (PSG) reference standard. In the one-vs-rest framework (each severity level versus all other levels), the area under the curve (AUC) for identifying subjects without SAHS (AHI < 5 events/h) was 0.832 (95% CI: 0.674–0.990). The AUCs were 0.870 (0.803–0.937), 0.802 (0.718–0.887), and 0.964 (0.922–1.000) for mild, moderate, and severe SAHS, respectively. (B) ROC analysis comparing the Wearable device–derived AHI with PSG. In the same one-vs-rest framework, the AUC for identifying subjects without SAHS (AHI < 5 events/h) was 0.753 (95% CI: 0.617–0.888). The AUCs were 0.730 (0.621–0.837), 0.817 (0.735–0.900), and 0.901 (0.837–0.966) for mild, moderate, and severe SAHS, respectively. SAHS severity was classified according to PSG-derived AHI as follows: normal (AHI < 5 events/h), mild (5 ≤ AHI < 15 events/h), moderate (15 ≤ AHI < 30 events/h), and severe (AHI ≥ 30 events/h). Error bars represent 95% confidence intervals. |
For identifying subjects without SAHS (AHI < 5), the snore-based AHI achieved an AUC of 0.83 (95% CI 0.67–0.99), while the wearable device-derived index reached 0.75 (95% CI 0.62–0.89). In mild SAHS, the AUCs were 0.87 (95% CI 0.80–0.94) for the snore model and 0.73 (95% CI 0.62–0.84) for the wearable device model. For moderate SAHS, both indices yielded comparable performance. The AUCs were 0.80 (95% CI 0.72–0.89) for the snore model and 0.82 (95% CI 0.73–0.90) for the wearable device model. In the severe SAHS group, both models achieved excellent diagnostic accuracy, with AUCs of 0.96 (95% CI 0.92–1.00) for snore and 0.90 (95% CI 0.84–0.97) for wearable device.
Overall, these results indicate that both indices can effectively discriminate SAHS severity, with the snore-based AHI showing numerically higher AUC values in the lower severity ranges.
Snoring-Sound–Based Model Shows Comparable Performance with Numerically Higher AUCs
When directly compared on paired samples using DeLong’s test (Figure 5), the snore-based model generally achieved higher AUCs than the wearable device-based model across most PSG-defined classes, although the differences did not reach statistical significance (all p > 0.05).
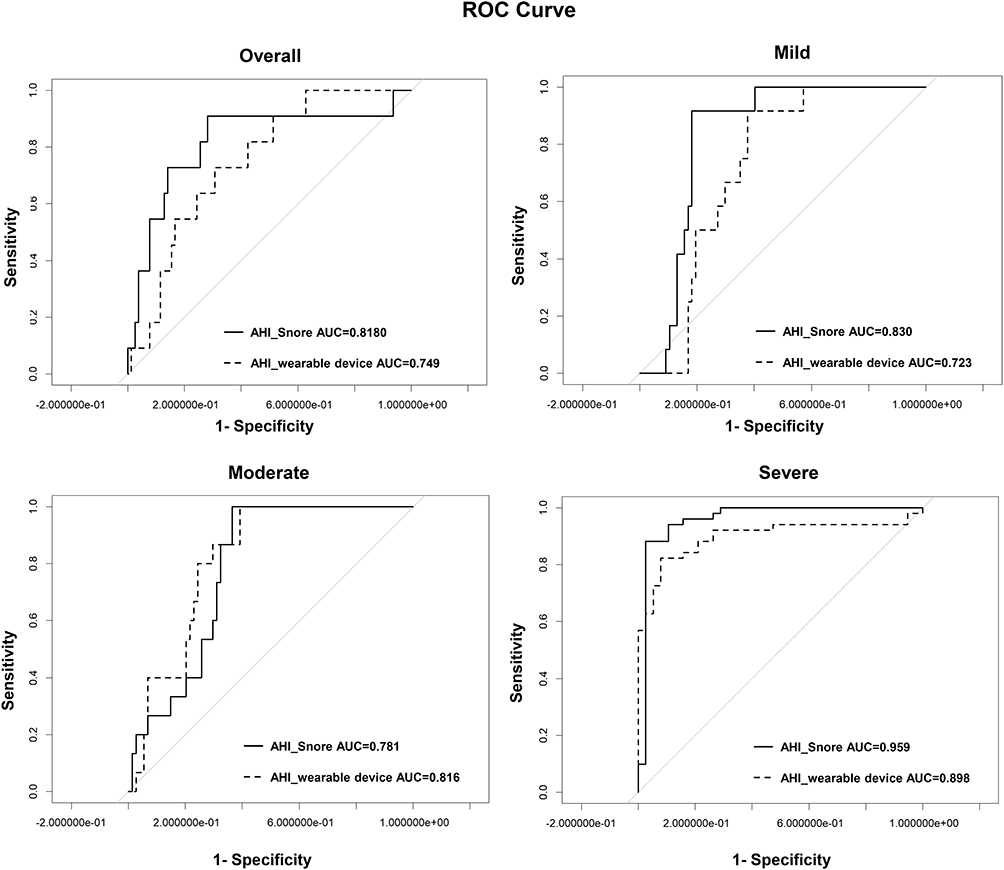 |
Figure 5 Paired comparison of ROC curves between the Snoring Analysis and Wearable Device models across PSG-defined classes. Panels depict one-vs-rest ROC curves for each class (Normal, Mild, Moderate, Severe), where each class is compared against all other classes. Normal subjects were defined as AHI < 5 events/h, mild SAHS as 5 ≤ AHI < 15 events/h, moderate SAHS as 15 ≤ AHI < 30 events/h, and severe SAHS as AHI ≥ 30 events/h. DeLong’s tests revealed no statistically significant differences between the two methods (all p > 0.05); however, the Snoring Analysis model generally achieved higher AUCs than wearable device model across most classes, particularly in the normal and mild categories. |
The advantage of the snore model was most evident in the lower-severity ranges. For identifying subjects without SAHS (AHI < 5), the snore model yielded an AUC of 0.82, whereas the wearable device-based method achieved 0.75 (p = 0.35). For mild SAHS, the AUCs were 0.83 for the snore model and 0.72 for the wearable device model (p = 0.07), indicating a non-significant trend.
In moderate SAHS, the AUCs were 0.78 for the snore model and 0.82 for the wearable device model (p = 0.53), indicating comparable diagnostic ability. For severe SAHS, both methods demonstrated excellent discrimination, with AUCs of 0.96 for the snore model and 0.90 for the wearable device model (p = 0.12).
Overall, although none of the between-method differences reached statistical significance, the snore-based model showed a tendency toward better discriminative performance, particularly in identifying non-SAHS and mild SAHS, highlighting its potential clinical utility as a simple and non-contact diagnostic approach.
Subgroup Analysis of Diagnostic Performance
Subgroup analyses using one-vs-rest classification demonstrated generally consistent diagnostic performance patterns of the snoring sound–based model and the wearable device across sex, age, and BMI categories (Figure 6A–D).
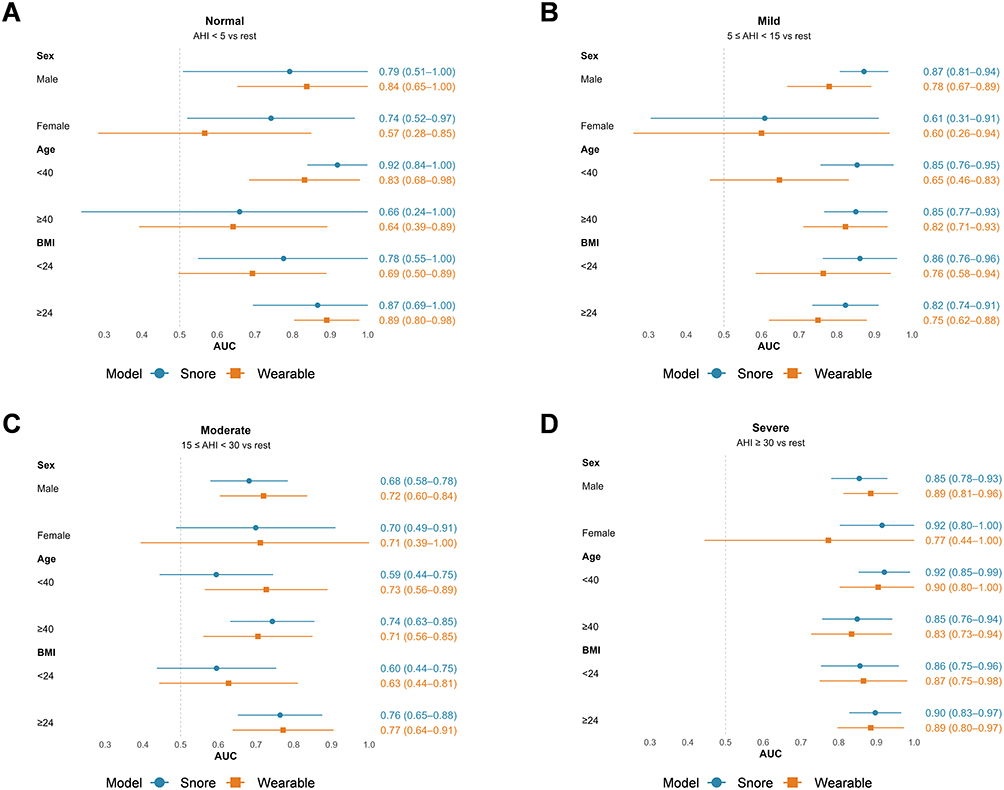 |
Figure 6 Subgroup analysis of diagnostic performance using one-vs-rest classification across SAHS severity categories. Forest plots showing the area under the receiver operating characteristic curve (AUC) with 95% confidence intervals (CIs) for both snoring sound–based model and the wearable device model across predefined subgroups, including sex, age (<40 vs. ≥40 years), and body mass index (BMI; <24 vs. ≥24 kg/m2). Each panel represents a one-vs-rest classification: (A) Normal (AHI < 5 vs rest), (B) Mild (5 ≤ AHI < 15 vs rest), (C) Moderate (15 ≤ AHI < 30 vs rest), and (D) Severe (AHI ≥ 30 vs rest). Points indicate AUC values and horizontal lines represent 95% CIs. The dashed vertical line indicates an AUC of 0.5. Detailed subgroup-specific AUC estimates are provided in Supplementary Table S1. |
For the identification of normal subjects (AHI < 5), both the snoring model and the wearable device showed moderate to good discrimination across subgroups, with AUC values generally ranging from approximately 0.57 to 0.92. Wider confidence intervals were observed in certain strata, particularly among females and subgroups with limited positive cases, reflecting small sample sizes in these subsets (Figure 6A).
In the mild SAHS category (5 ≤ AHI < 15), the snoring model achieved higher AUC values than the wearable device in most subgroups, particularly among male participants (0.87 vs. 0.78) and individuals aged < 40 years (0.85 vs. 0.65). Similar patterns were observed across BMI strata (eg, BMI < 24: 0.86 vs. 0.76; BMI ≥ 24: 0.82 vs. 0.75), suggesting a tendency toward improved discriminative performance of acoustic features in early-stage disease (Figure 6B).
For moderate SAHS (15 ≤ AHI < 30), both models demonstrated comparable but variable performance across subgroups, with AUC values generally ranging from approximately 0.59 to 0.77. In several strata, particularly among younger individuals (< 40 years: 0.59 vs. 0.73) and those with lower BMI (< 24: 0.60 vs. 0.63), the wearable device showed higher AUCs, whereas in other strata the snoring model performed similarly or slightly better. Overall, no consistent advantage of either modality was observed for this disease category (Figure 6C).
In the severe SAHS group (AHI ≥ 30), both approaches achieved consistently high diagnostic performance across subgroups, with AUC values typically ranging from approximately 0.83 to 0.92. The snoring model showed strong performance across multiple strata (eg, females: 0.92; age < 40 year, 0.92; BMI ≥ 24: 0.90), while the wearable device demonstrated comparable performance with similarly high AUCs (Figure 6D).
Overall, the snoring sound–based model showed relatively stable performance across subgroups. In the mild disease stage, AUC values were numerically higher in several subgroups, whereas for moderate SAHS the relative performance varied across strata. Both approaches demonstrated high diagnostic performance in severe SAHS.
Discussion
This study demonstrated that the snoring sound–based model achieved stronger correlation and better overall agreement with PSG-derived AHI values compared with the smartwatch-derived index. Although Bland–Altman analysis revealed a slight underestimation of AHI (mean bias = –9.12 events/h, 95% LoA = –41.25 to +23 events/h), the snoring analysis model maintained overall good concordance across the measurement range, suggesting that it provides a valid and reliable estimation of AHI relative to PSG. Such systematic bias has also been observed in previous studies where non-invasive surrogates, including acoustic intensity or oxygen desaturation, deviate from airflow-based references at extreme AHI ranges.21–23 Subgroup analyses (Figure 6A–D) showed generally consistent performance patterns of the snoring sound–based model across sex, age, and BMI strata. Although numerically higher AUC values were observed in several subgroups for mild SAHS, these differences were not consistent across strata and severity levels. The wider confidence intervals in certain subgroups are likely attributable to limited sample sizes and imbalanced case distribution. Nevertheless, these findings provide supportive evidence that model performance remains broadly stable across clinically relevant subgroups.
In comparison, most consumer wearables capture a narrower subset of physiological parameters, typically wrist photoplethysmography (PPG) and accelerometry, and thus lack direct airflow, calibrated thoracoabdominal effort, or EEG-based arousal detection required by AASM standards.17,18 This intrinsic limitation hinders their ability to detect subtle hypopneas or respiratory-effort–related arousals, leading to systematic AHI underestimation, especially in mild disease.22,24–26 For instance, the Embletta X100 validation study reported only moderate agreement between automated and manual scoring, confirming a downward bias in AHI estimation.24 Consistent with these observations, our snoring-sound model achieved higher discriminatory power in the lower-severity ranges, where acoustic cues may capture early airway narrowing more sensitively than oxygen- or motion-derived surrogates.6,23,27
Benchmarking our results against prior wearable investigations further contextualizes these findings. Consumer-grade PPG-based devices such as the Apple Watch and Galaxy Watch generally report AUCs around 0.8 for moderate-to-severe SAHS detection, with sensitivities near 80% in CVHR- or SpO2-based pipelines.21,26 Next-generation AI-enhanced Galaxy systems have achieved even higher accuracy, exceeding 90% agreement with PSG for moderate-to-severe SAHS.25 The evaluated smartwatch in our study performed at the upper end of this range (AUC 0.82 for moderate and 0.90 for severe SAHS), indicating effective respiratory-event detection. Importantly, the snoring-sound model further tended to outperform this high-performing wearable index in several subgroups, particularly in non-SAHS and mild SAHS cases, underscoring the incremental diagnostic value of acoustic biomarkers and reinforcing their potential for scalable, non-contact screening.
Notably, the existing literature on acoustic approaches is not entirely consistent. A systematic review reported that acoustic analysis of snoring is relatively accurate but not a strong method for diagnosing OSA.28 In addition, objective evidence suggests that certain acoustic features, such as snoring frequency, may have only modest predictive value and a weak relationship with disease severity, indicating that snoring alone may be insufficient for reliable OSA assessment.29 In contrast, more recent studies using smartphone-recorded breathing sounds have demonstrated reasonably good predictive performance, with accuracies exceeding 80%.30 Furthermore, home-based recordings have also shown high sensitivity and specificity across multiple AHI thresholds, supporting the feasibility of acoustic-based prediction in real-world settings.31 These discrepancies likely reflect differences in signal definition, recording environment, and model design. Therefore, the diagnostic performance of acoustic approaches should be interpreted as context-dependent rather than universally consistent.
In our previous work, we focused on the construction of a multimodal dataset to support the development of deep learning models for sleep apnea detection.16 In contrast, the present study was conducted using an independent multicenter cohort and emphasizes clinical validation of model performance. This distinction highlights the progression from data resource development to real-world diagnostic evaluation.
The biophysical coupling between airway anatomy and acoustic features also contributes to measurement variability.32,33 Differences in airway length, wall compliance, body position, and sleep stage can markedly alter snoring intensity and resonance frequency. Experimental and computational studies have confirmed that narrower airways amplify snoring intensity, whereas longer airways yield lower resonance frequencies, reflecting greater collapsibility.6,34,35 These physiological and environmental factors, along with microphone placement and ambient noise, likely account for part of the inter-individual scatter observed in our data.
Finally, several limitations warrant consideration. Firstly, although the sample size in this multicenter pilot study allowed for stable estimation of diagnostic performance, it remains relatively modest, which may limit the statistical power to detect small inter-method differences and restrict the generalizability of our findings. Second, all participants were recruited from Chinese clinical centers, and therefore the applicability of these findings to other ethnic groups or healthcare settings may require further validation. Third, hypopnea events in this study were defined using the American Academy of Sleep Medicine (AASM) acceptable criterion (≥30% airflow reduction with ≥4% oxygen desaturation), as specified in the AASM Manual (Version 2.0).17 Compared with the recommended ≥3% desaturation definition, this approach may yield a more conservative estimation of hypopnea events and consequently lower AHI values, particularly in patients with mild OSA. Fourth, due to differences in data availability across modalities, not all participants had complete data for all measurements, which may have affected cross-modality comparisons. Fifth, participants were recruited from outpatient clinics based on symptoms suggestive of SAHS (eg, snoring, mouth breathing, or witnessed apnea), and underwent overnight PSG, wearable monitoring, and acoustic recording in a hospital setting, the comorbidity information relied on self-reported data without systematic metabolic screening. These factors may explain why hypertension was the only comorbidity identified (20.9%), with no cases of diabetes or coronary heart disease, and should be addressed in future studies. Sixth, the inclusion of predominantly moderate-to-severe cases may have reduced sensitivity in evaluating model behavior at milder AHI thresholds. Even the most advanced ring- and wrist-type oximetry devices demonstrate inconsistent accuracy across desaturation thresholds (3% vs 4%) and brand-specific algorithms,14,26,36 emphasizing the need for standardized evaluation frameworks. Finally, the algorithm implemented in the wearable device is proprietary, and the researchers had no access to its internal processing or feature extraction mechanisms. This lack of transparency limits interpretability and precludes detailed methodological comparisons with the snoring-based model. However, the device was evaluated as a representative consumer technology, and its outputs were analyzed as generated to reflect real-world performance.
Future work should therefore expand recruitment to include larger, more diverse populations, harmonize acoustic and wearable data acquisition protocols, and explore multi-modal integration (acoustic + PPG + IMU) to bridge the physiological gap between surrogate measures and AASM-defined respiratory events.19,34,36
Conclusion
This multicenter study demonstrates that the snoring sound–based model provides a reliable and clinically meaningful estimation of AHI, with overall performance comparable to PSG and better agreement than the wearable device, particularly in the identification of mild SAHS. These findings suggest that acoustic features may offer advantages in detecting early or subtle respiratory abnormalities.
However, the model was evaluated within a specific clinical setting, and future studies with larger and independent external cohorts are needed to further validate its generalizability.
Overall, acoustic analysis represents a promising, non-invasive tool for SAHS screening in real-world settings.
Data Sharing Statement
The datasets supporting the results of this study are available from the corresponding author upon reasonable request. The data include the raw AHI values, snoring-sound recordings, and wearable device data. However, due to privacy and confidentiality concerns, we are unable to share raw patient-identifiable data publicly. Data requests should be directed to the corresponding author at [email protected].
Ethics Approval and Informed Consent
This study was registered in two public clinical trial registries before the enrollment of participants and was carried out in accordance with the World Medical Association Declaration of Helsinki. Informed consents have been obtained from all participants in this study. The trial registration number is ChiCTR2300069223 at China Clinical Trial Registry. The trial registration number is No.20220819120540004 at Shenzhen Clinical Medical Research Center for Otolaryngology Diseases. Ethical approval was obtained from all participating centers, including the Department of Otolaryngology Head and Neck Surgery, the Second People’s Hospital of Shenzhen, the First Affiliated Hospital of Shenzhen University (Approval No. 2023-113-01YJ); the Department of Otolaryngology Head and Neck Surgery, The First Affiliated Hospital of Xiamen University, School of Medicine, Xiamen University (Approval No. XMYY-2025KY049-01); and the ENT Institute and Otorhinolaryngology Department, Eye & ENT Hospital, Fudan University, Shanghai (Approval No. 2025006).
Consent for Publication
All participants provided written informed consent for the publication of study findings. The consent form included agreement for the use of any images, recordings, or data in publications. The participants were shown the article contents and gave explicit consent for publication.
Author Contributions
H.G. - Conceptualization, Formal Analysis, Writing-Original Draft. J.H. – Writing -Review & Editing, Data Curation. D.L. - Data Curation, Methodology. L.Y. and H.Z. - Data Curation. J.H., and B.M - Supervision, Methodology, Writing – Review & Editing. All authors took part in drafting, revising or critically reviewing the article; gave final approval of the version to be published; have agreed on the journal to which the article has been submitted; and agree to be accountable for all aspects of the work.
Corresponding Authors Justification: B. M. and J. H. made equal, indispensable contributions to the research.
Funding
This research was supported by the Noncommunicable Chronic Diseases-National Science and Technology Major Project (2024ZD0529200), Shenzhen Clinical Medical Research Center for Otolaryngology Diseases (No. 20220819120540004), Sanming Project of Medicine in Shenzhen (No. SZSM202111016), Natural Science Foundation of Fujian Province (2025J011429), and Xiamen Medical and Health Guiding Project (3502720244ZD1012). The funding agencies had no role in the study design, data collection, analysis, interpretation, or article preparation.
Disclosure
The authors declare that they have no competing interests related to this study. There are no financial, personal, or professional relationships that could influence the interpretation of data or the publication of this article.
References
1. Drager LF, Polotsky VY, Lorenzi-Filho G. Obstructive sleep apnea: an emerging risk factor for atherosclerosis. Chest. 2011;140(2):534–14. doi:10.1378/chest.10-2223
2. Yeghiazarians Y, Jneid H, Tietjens JR, et al. Obstructive sleep apnea and cardiovascular disease: a scientific statement from the American Heart Association. Circulation. 2021;144(3). doi:10.1161/CIR.0000000000000988
3. Zhu Y, Zhuang Z, Lv J, et al. Causal association between snoring and stroke: a Mendelian randomization study in a Chinese population. Lancet Reg Health West Pac. 2024;44:101001. doi:10.1016/j.lanwpc.2023.101001
4. Benjafield AV, Ayas NT, Eastwood PR, et al. Estimation of the global prevalence and burden of obstructive sleep apnoea: a literature-based analysis. Lancet Respir Med. 2019;7(8):687–698. doi:10.1016/S2213-2600(19)30198-5
5. Niu Y, Sun S, Wang Y, Chen L, Shao Y, Zhang X. Spatiotemporal trends in the prevalence of obstructive sleep apnoea across China: a multilevel meta-analysis incorporating geographic and demographic stratification (2000-2024). Nat Sci Sleep. 2025;17:879–903. doi:10.2147/NSS.S525547
6. Saha S, Bradley TD, Taheri M, Moussavi Z, Yadollahi A. A subject-specific acoustic model of the upper airway for snoring sounds generation. Sci Rep. 2016;6. doi:10.1038/srep25730.
7. Qian K, Janott C, Pandit V, et al. Classification of the excitation location of snore sounds in the upper airway by acoustic multifeature analysis. IEEE Trans Biomed Eng. 2017;64(8):1731–1741. doi:10.1109/TBME.2016.2619675
8. Bensoussan Y, Elemento O, Rameau A. Voice as an AI biomarker of health—introducing audiomics. JAMA Otolaryngol Neck Surg. 2024;150(4):283–284. doi:10.1001/jamaoto.2023.4807
9. Fagherazzi G, Fischer A, Ismael M, Despotovic V. Voice for health: the use of vocal biomarkers from research to clinical practice. Digit Biomark. 2021;5(1):78–88. doi:10.1159/000515346
10. Qiu X, Wang C, Li B, et al. An audio-semantic multimodal model for automatic obstructive sleep Apnea-Hypopnea Syndrome classification via multi-feature analysis of snoring sounds. Front Neurosci. 2024;18:1336307. doi:10.3389/fnins.2024.1336307
11. Huang J, Ren L, Chen L, Jia Z, Zhang T, Wu H. Application of automatic detection based on overnight airflow and blood oxygen in patients with sleep disordered breathing. Eur Arch Otorhinolaryngol. 2021;278(3):873–881. doi:10.1007/s00405-020-06008-5
12. Abd-Alrazaq A, Aslam H, AlSaad R, et al. Detection of sleep apnea using wearable AI: systematic review and meta-analysis. J Med Internet Res. 2024;26:e58187. doi:10.2196/58187
13. Cantore S, Ballini A, Farronato D, et al. Evaluation of an oral appliance in patients with mild to moderate obstructive sleep apnea syndrome intolerant to continuous positive airway pressure use: preliminary results. Int J Immunopathol Pharmacol. 2016;29(2):267–273. doi:10.1177/0394632015590949
14. Sanchez Gomez J, Pramono RXA, Imtiaz SA, Rodriguez-Villegas E, Valido Morales A. Validation of a wearable medical device for automatic diagnosis of OSA against standard PSG. J Clin Med. 2024;13(2):571. doi:10.3390/jcm13020571
15. Tiron R, Lyon G, Kilroy H, et al. Screening for obstructive sleep apnea with novel hybrid acoustic smartphone app technology. J Thorac Dis. 2020;12(8):4476–4495. doi:10.21037/jtd-20-804
16. Tao J, Huang J, Miao B, Yang L. A multimodal dataset for training deep learning models aimed at detecting and analyzing sleep apnea. Sci Data. 2025;12:1263. doi:10.1038/s41597-025-05583-8
17. Berry RB, Brooks R, Gamaldo C, et al. AASM scoring manual updates for 2017 (Version 2.4). J Clin Sleep Med. 2017;13(05):665–666. doi:10.5664/jcsm.6576
18. Kapur VK, Auckley DH, Chowdhuri S, et al. Clinical practice guideline for diagnostic testing for adult obstructive sleep apnea: an American academy of sleep medicine clinical practice guideline. J Clin Sleep Med. 2017;13(03):479–504. doi:10.5664/jcsm.6506
19. Chang JL, Goldberg AN, Alt JA, et al. International consensus statement on obstructive sleep apnea. Int Forum Allergy Rhinol. 2023;13(7):1061–1482. doi:10.1002/alr.23079
20. He Y, Pan A, Wang Y, et al. Prevalence of overweight and obesity in 15.8 million men aged 15–49 years in rural China from 2010 to 2014. Sci Rep. 2017;7(1):5012. doi:10.1038/s41598-017-04135-4
21. Hayano J, Yamamoto H, Nonaka I, et al. Quantitative detection of sleep apnea with wearable watch device. PLoS One. 2020;15(11):e0237279. doi:10.1371/journal.pone.0237279
22. Aurora RN, Swartz R, Punjabi NM. Misclassification of OSA severity with automated scoring of home sleep recordings. Chest. 2015;147(3):719–727. doi:10.1378/chest.14-0929
23. Fang L, Cai J, Huang Z, Tuohuti A, Chen X. Assessment of simulated snoring sounds with artificial intelligence for the diagnosis of obstructive sleep apnea. Sleep Med. 2025;125:100–107. doi:10.1016/j.sleep.2024.11.018
24. Park DY, Kim HJ, Kim CH, et al. Reliability and validity testing of automated scoring in obstructive sleep apnea diagnosis with the Embletta X100. Laryngoscope. 2015;125(2):493–497. doi:10.1002/lary.24878
25. Kim D, Han JY, Jung H, et al. AI‑enhanced smartwatch AHI estimation and AI‑scored polysomnography for obstructive sleep apnea: real‑world validation. Nat Sci Sleep. 2025;17:2297–2307. doi:10.2147/NSS.S540460
26. Tisyakorn J, Saiphoklang N, Sapankaew T, et al. Screening moderate to severe obstructive sleep apnea with wearable device. Sleep Breath. 2025;29(1):61. doi:10.1007/s11325-024-03232-9
27. Liu Y, Feng Y, Li Y, Xu W, Wang X, Han D. Automatic classification of the obstruction site in obstructive sleep apnea based on snoring sounds. Am J Otolaryngol. 2022;43(6):103584. doi:10.1016/j.amjoto.2022.103584
28. J H, La L, S L, et al. Acoustic analysis of snoring in the diagnosis of obstructive sleep apnea syndrome: a call for more rigorous studies. J Clin Sleep Med JCSM off Publ Am Acad Sleep Med. 2015;11(7). doi:10.5664/jcsm.4856
29. Alshaer H, Hummel R, Mendelson M, Marshal T, Bradley TD. Objective relationship between sleep apnea and frequency of snoring assessed by machine learning. J Clin Sleep Med JCSM off Publ Am Acad Sleep Med. 2019;15(3):463–470. doi:10.5664/jcsm.7676
30. Cho SW, Jung SJ, Shin JH, Won TB, Rhee CS, Kim JW. Evaluating prediction models of sleep apnea from smartphone-recorded sleep breathing sounds. JAMA Otolaryngol-- Head Neck Surg. 2022;148(6):515–521. doi:10.1001/jamaoto.2022.0244
31. Sc H, K D, Cs R, et al. In-home smartphone-based prediction of obstructive sleep apnea in conjunction with level 2 home polysomnography. JAMA Otolaryngol Head Neck Surg. 2024;150(1). doi:10.1001/jamaoto.2023.3490
32. Qualickuz Zanan NH, Azman M, Zainuddin K, Wan Puteh SE, Mohamed AS, Mat Baki M. Sound frequency spectra of snore in relation to the site of obstruction among snorers. Acta Otorhinolaryngol Ital. 2021;41(4):348–355. doi:10.14639/0392-100X-N1202
33. Chen L, Xiao T, Ng CT. The biomechanical mechanism of upper airway collapse in OSAHS patients using clinical monitoring data during natural sleep. Sensors. 2021;21(22):7457. doi:10.3390/s21227457
34. Herzog M, Schieb E, Bremert T, et al. Frequency analysis of snoring sounds during simulated and nocturnal snoring. Eur Arch Otorhinolaryngol. 2008;265(12):1553–1562. doi:10.1007/s00405-008-0700-2
35. Vena D, Gell L, Messineo L, et al. Physiological determinants of snore loudness. Ann Am Thorac Soc. 2024;21(1):114–121. doi:10.1513/AnnalsATS.202305-438OC
36. Yu Y, Huang JJ, Yang H, Ren LJ. Automated diagnostic method for sleep apnea and hypopnea using overnight airflow and oxygen saturation. MethodsX. 2025;15:103528. doi:10.1016/j.mex.2025.103528
 © 2026 The Author(s). This work is published and licensed by Dove Medical Press Limited. The
full terms of this license are available at https://www.dovepress.com/terms
and incorporate the Creative Commons Attribution
- Non Commercial (unported, 4.0) License.
By accessing the work you hereby accept the Terms. Non-commercial uses of the work are permitted
without any further permission from Dove Medical Press Limited, provided the work is properly
attributed. For permission for commercial use of this work, please see paragraphs 4.2 and 5 of our Terms.
© 2026 The Author(s). This work is published and licensed by Dove Medical Press Limited. The
full terms of this license are available at https://www.dovepress.com/terms
and incorporate the Creative Commons Attribution
- Non Commercial (unported, 4.0) License.
By accessing the work you hereby accept the Terms. Non-commercial uses of the work are permitted
without any further permission from Dove Medical Press Limited, provided the work is properly
attributed. For permission for commercial use of this work, please see paragraphs 4.2 and 5 of our Terms.