Back to Journals » Clinical Epidemiology » Volume 12
MultiCenter Interrupted Time Series Analysis: Incorporating Within and Between-Center Heterogeneity
Authors Ewusie JE ![]() , Thabane L, Beyene J, Straus SE, Hamid JS
, Thabane L, Beyene J, Straus SE, Hamid JS
Received 20 September 2019
Accepted for publication 16 May 2020
Published 17 June 2020 Volume 2020:12 Pages 625—636
DOI https://doi.org/10.2147/CLEP.S231843
Checked for plagiarism Yes
Review by Single anonymous peer review
Peer reviewer comments 2
Editor who approved publication: Professor Vera Ehrenstein
Joycelyne E Ewusie,1,2 Lehana Thabane,1 Joseph Beyene,1 Sharon E Straus,3 Jemila S Hamid1,2,4
1Department of Health Research Methods, Evidence, and Impact, McMaster University, Hamilton, Ontario, Canada; 2School of Epidemiology and Public Health, University of Ottawa, Ottawa, Canada; 3Li Ka Shing Knowledge Institute of St Michael’s Hospital, Toronto, Ontario, Canada; 4Children’s Hospital of Eastern Ontario, Ottawa, Ontario, Canada
Correspondence: Jemila S Hamid
Children’s Hospital of Eastern Ontario, Ottawa, Ontario, Canada
Tel +1 613 737-7600 x 4194
Email [email protected]
Background: Segmented regression (SR) is the most common statistical method used in the analysis of interrupted time series (ITS) data. However, this modeling strategy is indicated to produce spurious results when applied to aggregated data. For multicenter ITS studies, data at a given time point are often aggregated across different participants and settings; thus, conventional segmented regression analysis may not be an optimal approach. Our objective is to provide a robust method for analysis of ITS data, while accounting for two sources of heterogeneity, between participants and across sites.
Methods: We present a methodological framework within the segmented regression modeling strategy, where we introduced weights to account for between-participant variation and the differences across multiple sites. We empirically compared the proposed weighted segmented regression (wSR) with the conventional SR as well as with a previously published pooled analysis method using data from the Mobility of Vulnerable Elders in Ontario (MOVE-ON) project, a multisite ITS study.
Results: Overall, the wSR produced the most precise estimates, where they had the narrowest 95% CI, while the conventional SR method resulted in the least precise estimates. Our method also resulted in increased power. The pooled analysis method and the wSR had comparable results when there were ≤ 4 sites included in the overall analysis and when there was moderate to high between-site heterogeneity as measured by the I2 statistic.
Conclusion: Incorporating participant-level and site-level variability led to estimates that were more precise and accurate in determining the magnitude of the effect of an intervention and led to increased statistical power. This underscores the importance of accounting for the inherent variability in aggregated data. Extensive simulations are required to further assess the methods in a wide range of scenarios and outcome types.
Keywords: aggregated data, weighted segmented regression, pooled analysis, interrupted time series, multisite studies
Introduction
Interrupted time series (ITS) design involves repeated measurements of an outcome at several time points before and after implementation of interventions or programs and can be designed to investigate the impact of interventions and programs in healthcare settings. Segmented regression (SR) is the most common statistical method used in the analysis of ITS data.1–4 A recent scoping review, aimed at identifying methods for analyzing ITS data, showed that SR models were the most utilized methods, having been used in approximately 45% of the included studies to analyze their ITS data.5 These methods have been applied in various health research areas (eg clinical research, public health, and health services) to assess the impact of interventions on patient important outcomes or clinical practice.6–12
SR is a special case of multiple linear regression with an indicator variable representing the intervention periods, a continuous variable representing the time at which observations are taken, and an interaction variable.13 For ITS analysis employing SR, a regression line is fitted to each segment of the time series, for instance, the pre- and post-intervention periods.14 This approach assesses the magnitude of the effect of the intervention on the outcome of interest. Using this approach, both the immediate effect of the intervention as well as the effect of the intervention over time can be evaluated. SR analysis controls for potential confounders (such as age and gender), for example, by including covariates in the model to account for the confounders.15 The model can also be used to investigate seasonal or cyclical patterns that occur over time, as well as used to assess the presence of autocorrelation in the ITS data by including autoregressive parameters in the SR model.3,16
Despite the advantages, the SR model has a major limitation when it is applied to aggregated data.2,17,18 Aggregated data refer to summary statistics (eg mean, percentage, median) calculated across study participants. In health research involving ITS, aggregated data are very common since interventions are often implemented to evaluate the effect at healthcare facility level and data at a given time point are often summarized across participants within the healthcare facility. For multisite ITS studies, further aggregation occurs, where the data are summarized across several sites (eg hospital units) to evaluate the overall impact of interventions. Additionally, administrative routine data collected from different subjects across different regions are increasingly being used in ITS studies to perform post-hoc evaluation of nationwide policies and programs.5 Such data are usually only available in aggregated forms.
Aggregated data are a major cause of heteroskedasticity, which is a violation of the assumption of constant error variances, required during inference involving regression models.19 When data are aggregated, variability is introduced due to factors such as the differences in participant characteristics, sample size, and settings. Hence, the variance across time, and consequently the error variance, is no longer constant. To account for the variability introduced by aggregating data, Gebski et al20 proposed the pooled time series analysis method, where the intercepts and slopes are pooled from individual site analysis, using meta-analytic approaches, to calculate the overall effect of the intervention. Their method may not be optimal for all types of aggregated data, since the variability across participants within the same site was not accounted for. Further, the use of summary estimates (intercepts and slopes) instead of using all the available information from the data may lead to loss of power, and hence suboptimal results.21,22
In this study, we propose the extended weighted SR method (wSR), with the aim of incorporating both participant-level and site-level variability. The precision, accuracy, and statistical significance of our method are compared to the traditional SR method as well as the pooled time series method proposed by Gebski et al using empirical data.
Materials and Methods
Empirical Data
We use data from the Mobility of Vulnerable Elders in Ontario (MOVE-ON) project for our empirical evaluation.23,24 The original MOVE-ON study involved implementation and evaluation of the impact of an evidence-based educational intervention, which aimed to promote early mobilization and prevent functional decline among older patients admitted to acute-care academic hospitals across Ontario. An interrupted time series design was used to evaluate the impact of the intervention. The study was conducted across 14 hospitals consisting of 30 units that provide care to inpatients aged 65 and older. Data were collected over a period of 38 weeks, with a 10-week pre-implementation period followed by an 8-week implementation period, where the intervention was rolled out, and a 20-week post-implementation period was also considered. The primary outcome of the study was the mobilization status of patients, who were assessed on twice-weekly visual audits, which occurred three times per day (in the morning, at lunch, and in the afternoon). Patients were considered mobilized if they were observed out of bed (mobility score > 2).23,24 Further details of the study can be found elsewhere.23,24 In this paper, we will consider the primary outcome and present the proposed method using these data as an illustration. We also compare our method with previous methods empirically.
Weighted ITS Analysis
Consider the primary outcome, patient mobility, in the MOVE-ON project. Within each site, and at each time point, patient mobility was summarized as the percentage of patients who were observed (during audits) out of bed at least once in a day. That is, if we let (1) represent the mobility status for patient
  at time point
  , then the percentage of patients who were observed out of bed (
 ) at a time point
  is calculated as:
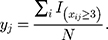
where (2) is an indicator function dichotomizing the primary outcome into two categories, whether a patient is out of bed or not out of bed; and N represents the total number of patients observed at each time point. To examine the impact of the intervention on patient mobility, a SR of the form described in equation (2) below was fitted and comparisons in level and trend of mobility were made among the pre-, during, and post-implementation periods.2
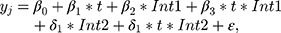
where (3) represents the time at which the outcome is measured, and Int1 and
  are indicator variables representing the intervention periods. Interactions between time and intervention periods are also included in the model. The parameter
  estimates the baseline percentage of patients who were out of bed;
  represents the slope (trend) of mobilization prior to the intervention; and
  and
and  represent the changes in intercepts and slopes between the pre- and during intervention periods; while
  and
and  represent the changes in intercepts and slopes between the pre and post intervention. The model can be presented in matrix format as:

where Y denotes a vector representing outcomes measured at different times;  is a matrix of the independent variables such as time and intervention;
  denotes a vector representing the regression coefficients (parameters); and
  is the error vector.
Recall that at each site, the data at each time point are aggregated across patients, which also involves summary statistics based on different sample sizes. Further, being a multisite study, data are also aggregated across sites. Thus, there are two levels of heterogeneity introduced; within site (ie across patients within hospitals and units) and across sites (across hospitals). Due to this unaccounted heterogeneity, the SR approach will be associated with increased bias and decreased precision when used on aggregated data. It has also been previously established that the violation of the homoscedasticity assumption (due to the difference in levels of variability) leads to inflated type I error and decreased power.2,25 To overcome this limitation, we propose the extended wSR approach, where the weighted least squares method is used to estimate the parameters of the model in equation (3). The estimators are given by:
(4)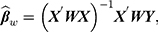
where (5) represents a diagonal matrix, which consists of the vector
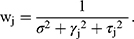
  as its diagonal elements. The weights (w) are calculated as the inverse of the sum of the within-site and between-site variances. That is, if
  represents the variance within a site at time point
  ,
,  represents the variance between sites, and
  represents the variance associated with the random error, then the weights are given as:
The variance of the weighted regression estimates is calculated as:
(6)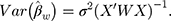
The standard errors and confidence intervals can therefore be constructed accordingly, using established formulas found in the literature.26
Empirical Evaluation
Our empirical evaluation consists of comparative analysis involving our wSR approach, the traditional SR approach, as well as the pooled analysis (PA) proposed by Gebski et al.20 To examine the performance of the proposed method to changes in the number of sites and various levels of within- and between-site heterogeneity, we performed analyses for different scenarios, where we varied the number of sites included, the amount of within-site variability, and the magnitude of between-site heterogeneity (low, moderate, and high) as measured by the  statistic used in the meta-analysis literature to quantify the amount of between-study heterogeneity.26,27 The heterogeneity is defined as low when
  moderate when
  , and high when
  For all scenarios considered, the results (estimates of slopes and intercepts) and the associated 95% confidence intervals (95% CIs) obtained from the three methods were compared to assess the precision and accuracy of the estimates respectively. For time series data, the Durbin–Watson statistic is the most common measure used to evaluate the presence of autocorrelation in the data.25 However, the data used in this study are from a previous project where the authors reported there was no significant autocorrelation in the data. Hence, we did not perform any further assessment of autocorrelation. All analysis was performed using R version 3.4.3 statistical software.
Results
During the 38-week study, a total of 125,025 observations were made from a total of 14,540 patients across the 14 sites, of which 3943 patients were audited pre-intervention, 3216 during intervention, and 7381 patients post intervention. For each site, the total number of patients per time point ranged from 30 to 146.
For analysis involving overall patient mobility across the 14 hospitals, the estimates of the regression coefficients obtained using each of the three methods are presented in Table 1. The wSR estimates have the narrowest confidence interval for all estimates, while the traditional SR has the widest confidence interval for most estimates. Nonetheless, the parameter estimates are relatively comparable for the SR and wSR methods in most cases.
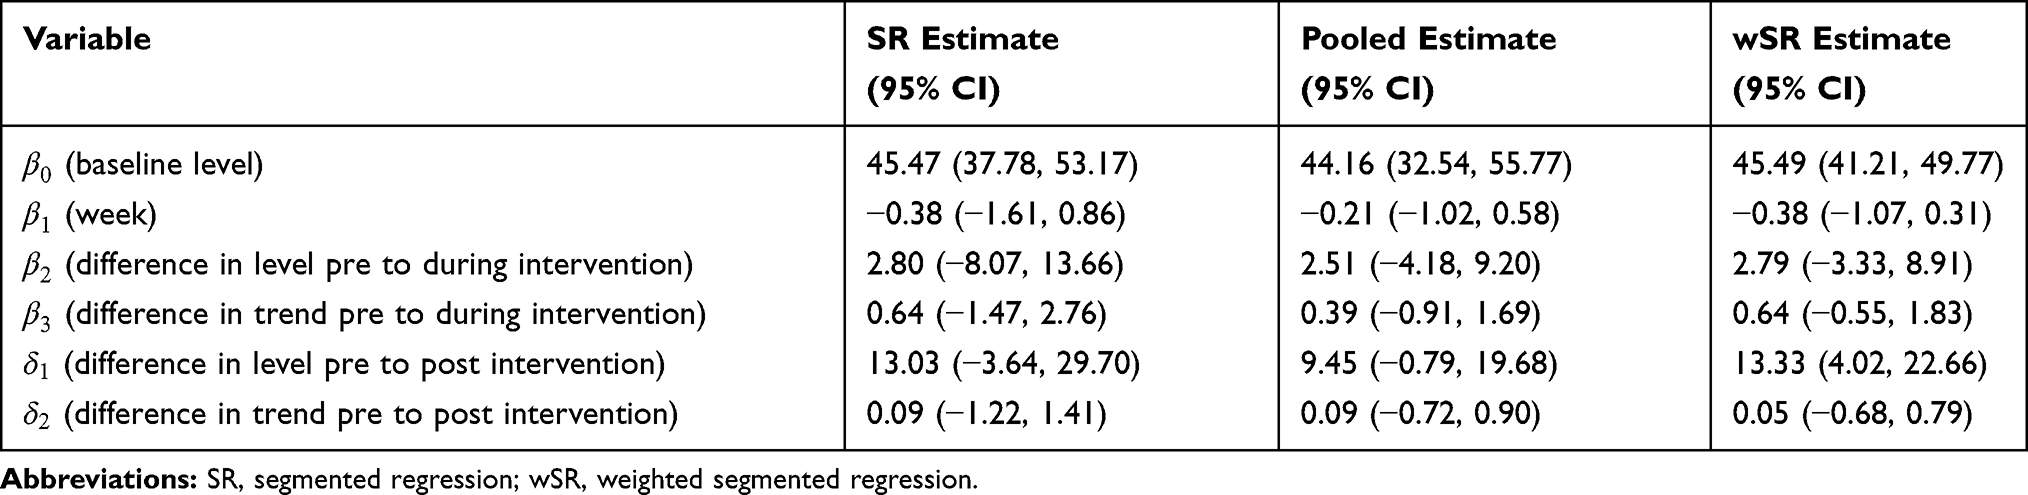 |
Table 1 Estimates for Intervention Effects and 95% CIs Obtained Using Segmented Regression (SR), Pooled Analysis (PA), and Weighted Segmented Regression (wSR) |
All of the models produced a negative coefficient for the week ( ) variable, indicating a decline in patient mobilization prior to the educational intervention. The positive coefficient of the intervention (
 ) variable implies that there was an immediate increase in the percentage of patient mobilization during the implementation of the intervention (Figure 1; Table 1). Similarly, there was a substantial increase in the weekly percentage of patients who were mobile during the intervention period,
  = 0.64 (95% CI: −0.55, 1.83), from the wSR estimate. We again observed that although all three models showed an increase in the trend of patient mobilization during the intervention period, this increase was not statistically significant (Figure 2, Table 1).
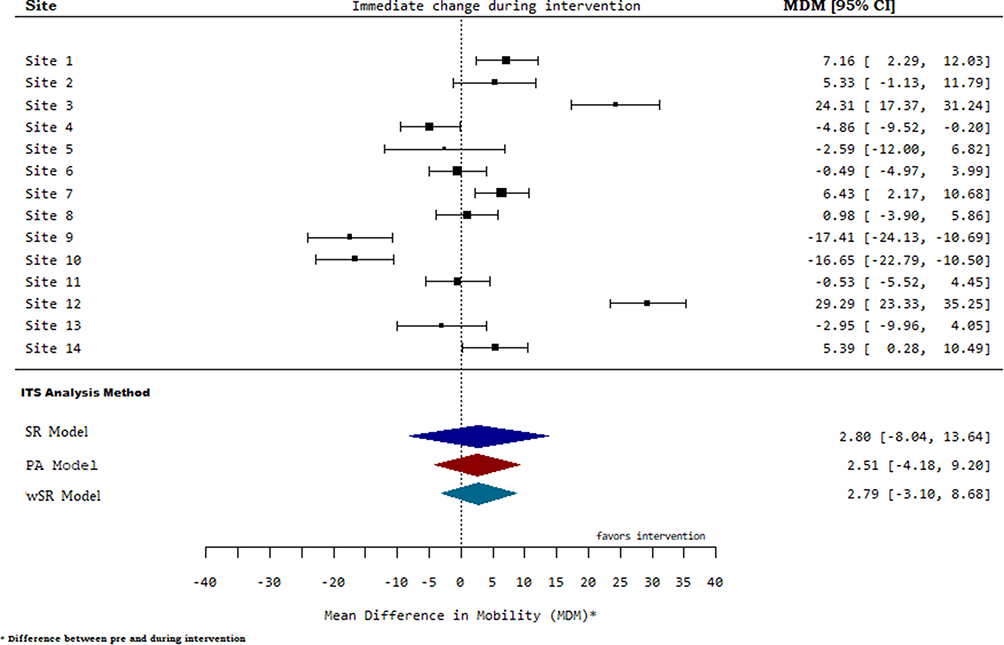 |
Figure 1 Forest plot for change in level of mobilization during the implementation of the intervention compared to the pre-intervention period. |
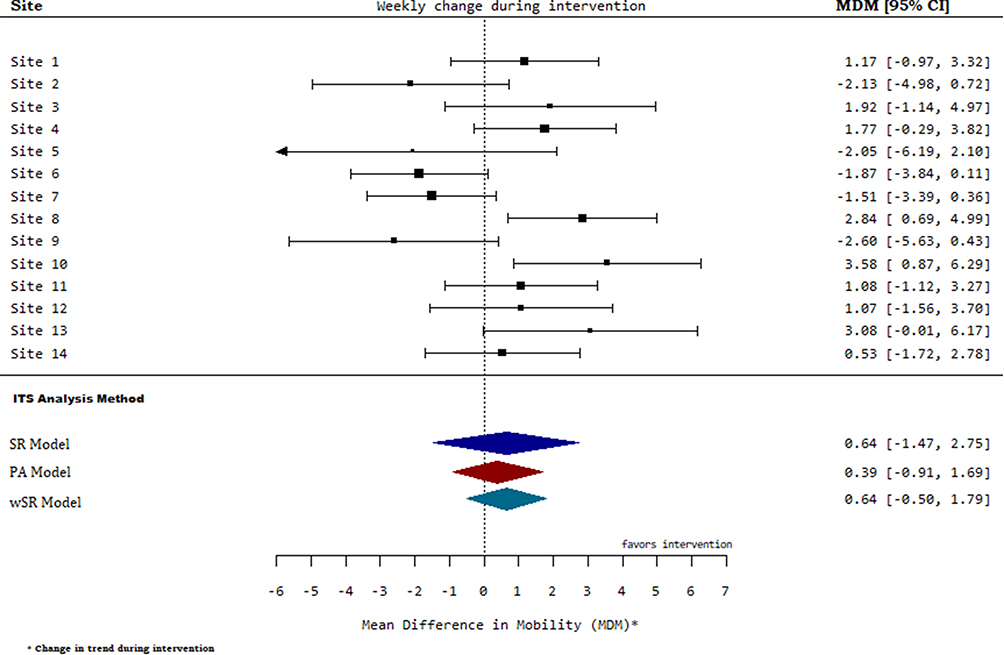 |
Figure 2 Forest plot for change in trend of mobilization during the implementation of the intervention compared to the pre-intervention period. |
Considering the change in level from the pre-intervention phase to the post-intervention phase, there was a significant increase in mobility, where 13% more patients were mobile in the post-intervention period compared to the pre-intervention period (Figure 3, Table 1). However, this difference was not statistically significant using both the traditional SR and PA methods. For all of the methods, the weekly percentage of patients who were mobile was shown to have increased by approximately 0.1% per week post intervention, albeit not significant (Table 1).
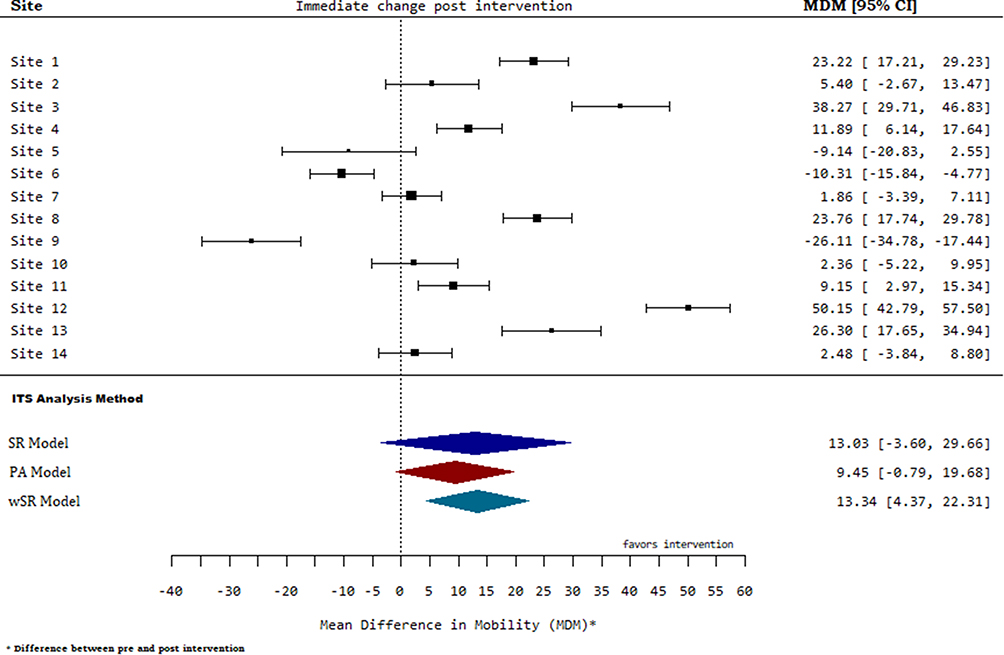 |
Figure 3 Forest plot for change in level of mobilization after the implementation of the intervention compared to the pre-intervention period. |
From Figures 1–3, there is substantial variability within sites and heterogeneity across sites. To perform more extensive comparative analysis with varying levels of heterogeneity, we performed subgroup analyses. The results for these subgroup analyses are presented in Table 2 as well as Figures 4–10.
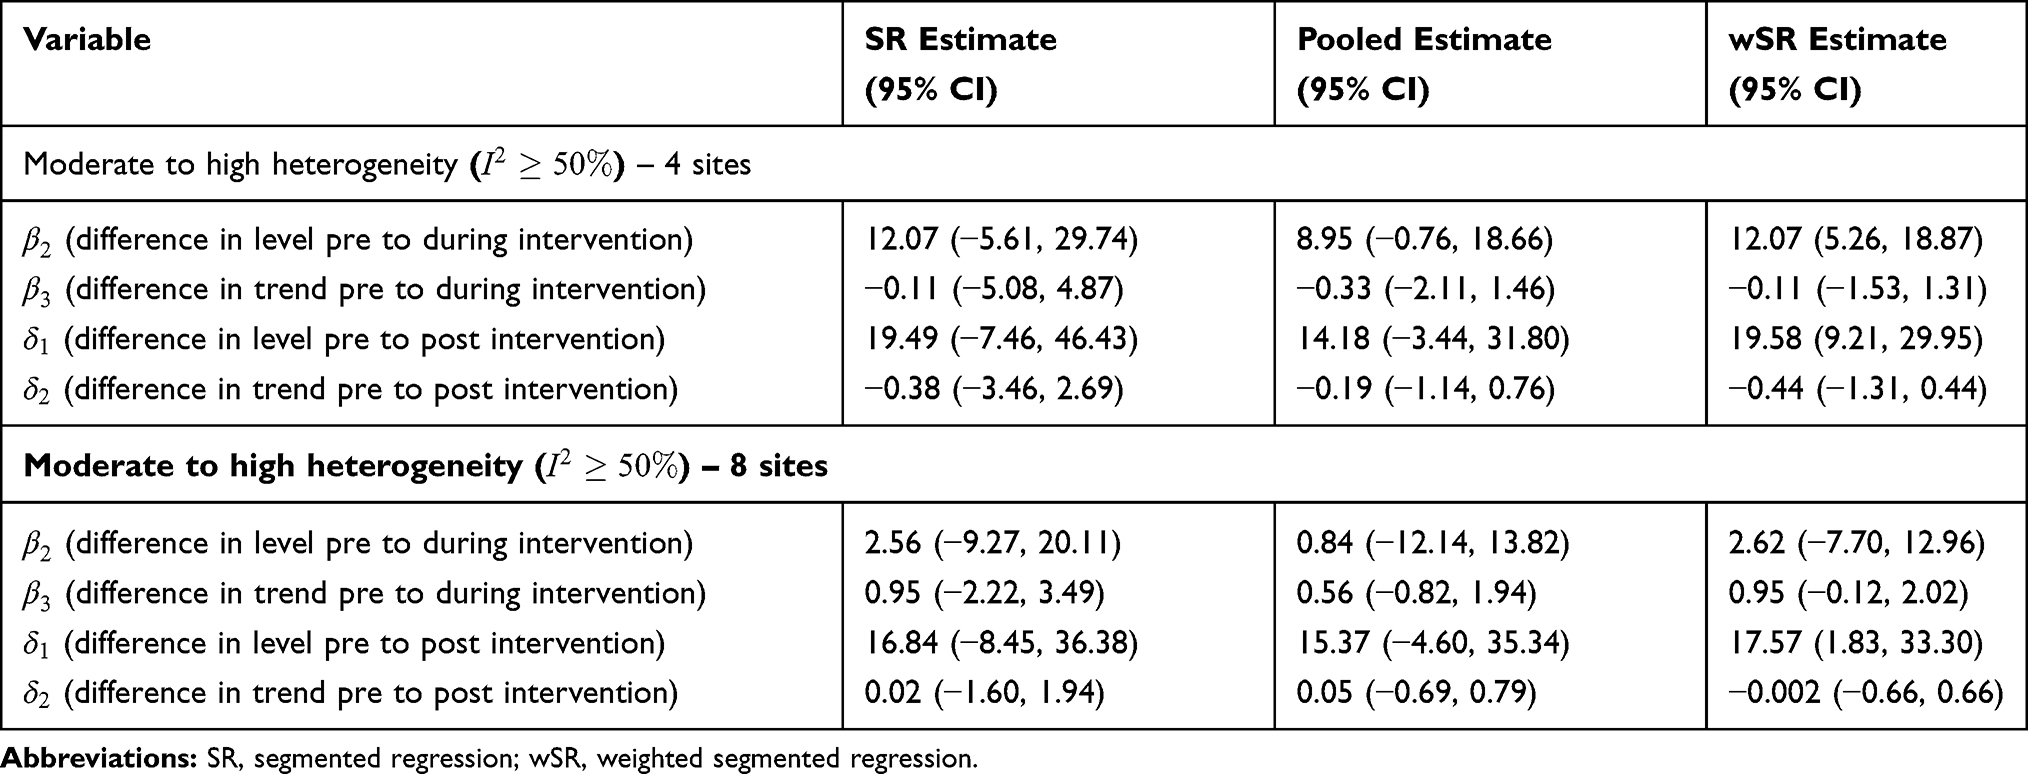 |
Table 2 Subgroup Estimates for Intervention Effects and 95% CIs Obtained Using Segmented Regression (SR), Pooled Analysis, and Weighted Segmented Regression (wSR) |
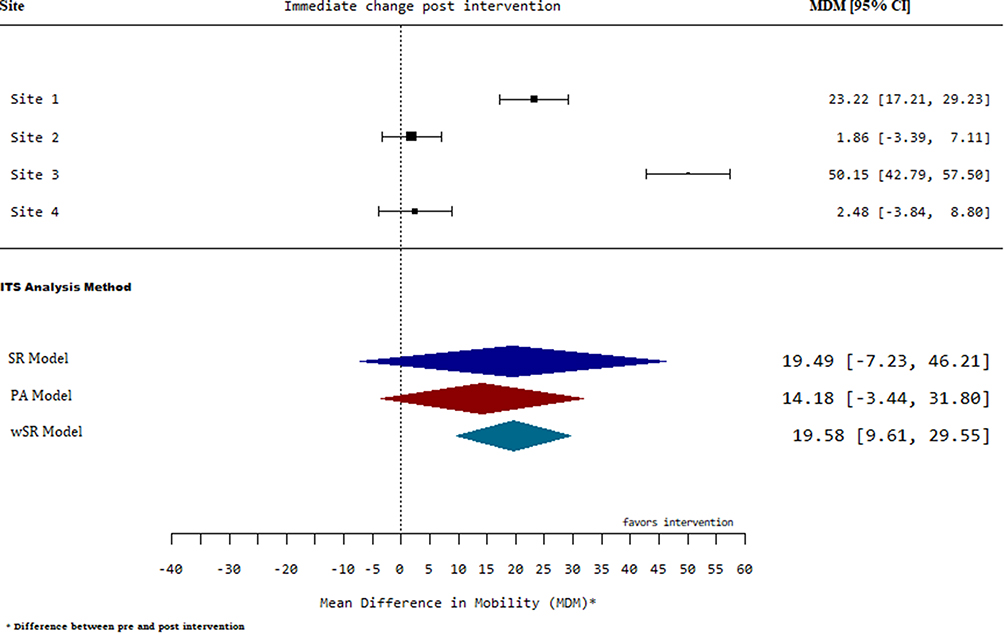 |
Figure 4 Forest plot for change in level of mobilization post intervention for high between-site heterogeneity. |
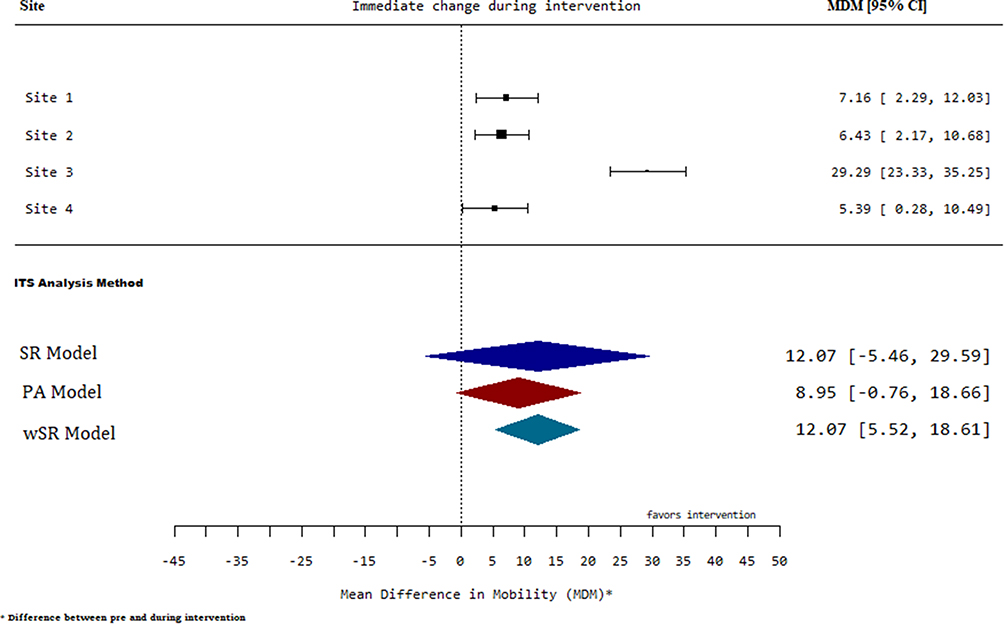 |
Figure 5 Forest plot for change in level of mobilization during intervention for moderate between-site heterogeneity. |
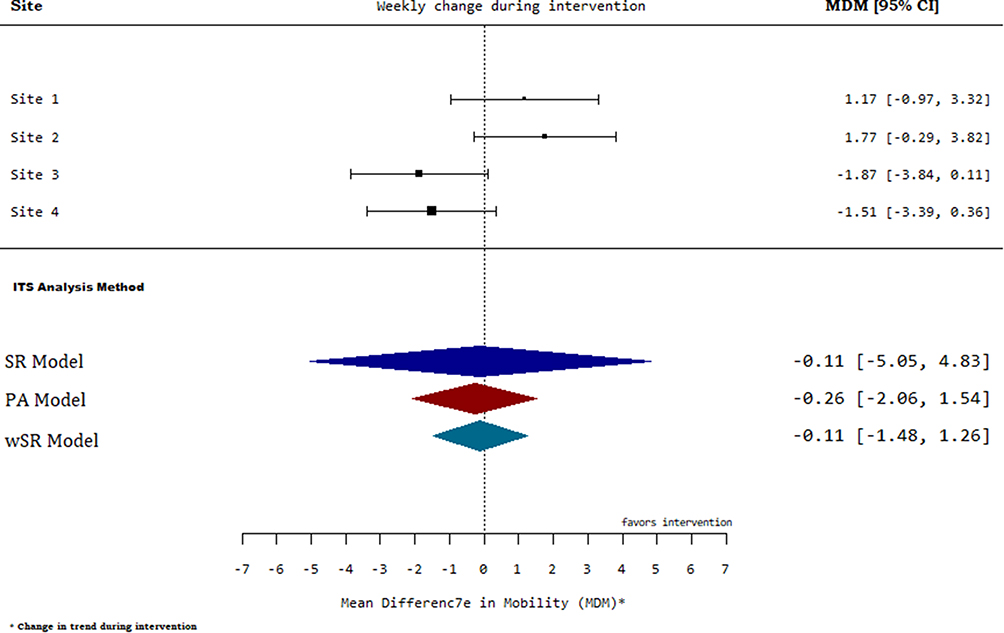 |
Figure 6 Forest plot for change in trend of mobilization during intervention for moderate between- and within-site heterogeneity. |
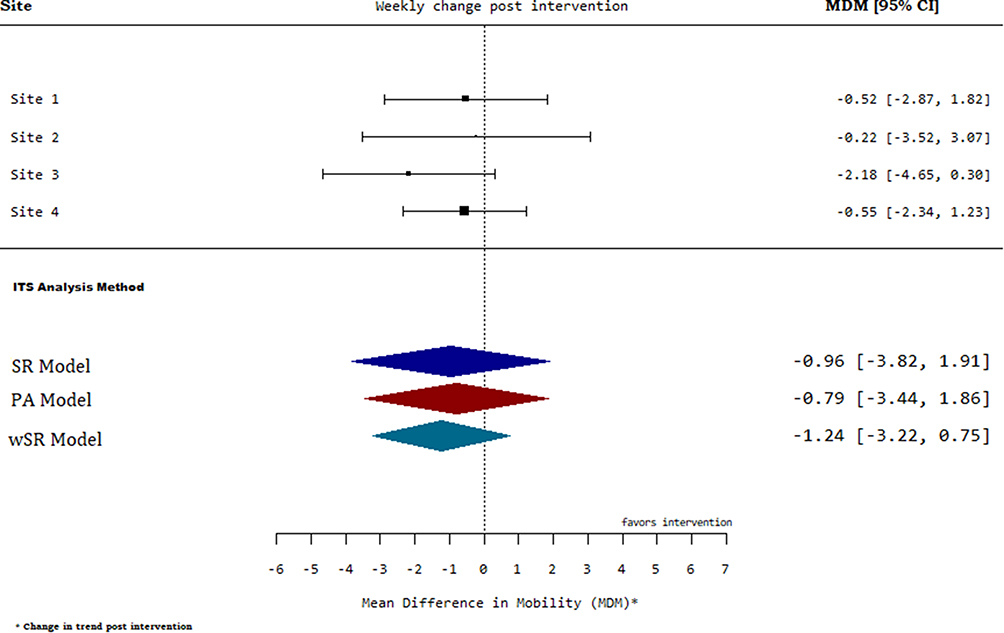 |
Figure 7 Forest plot for change in trend of mobilization post intervention for low between-site heterogeneity. |
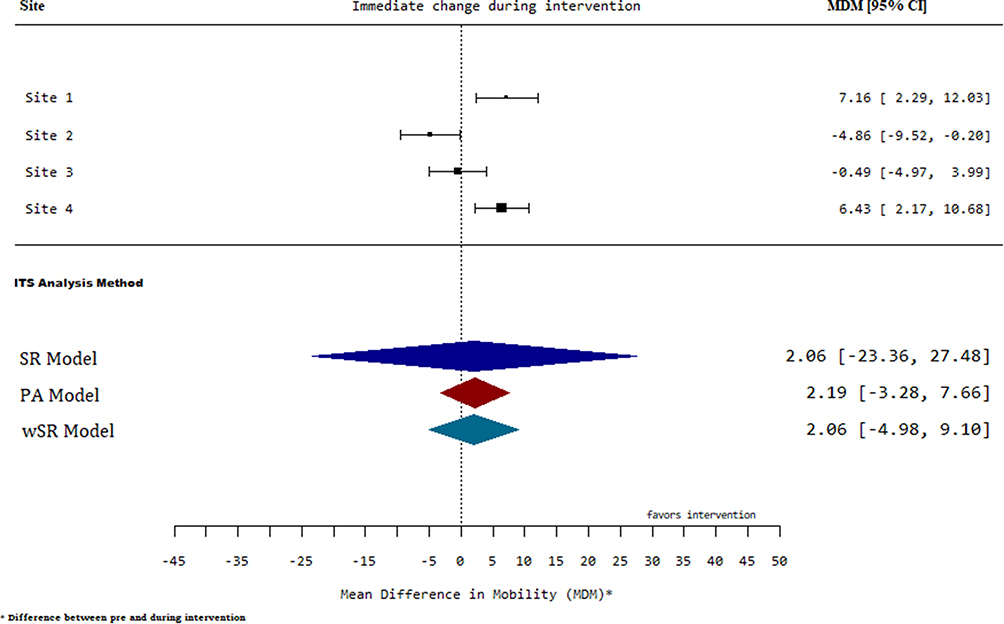 |
Figure 8 Forest plot for change in level of mobilization post intervention for low within- and between-site heterogeneity. |
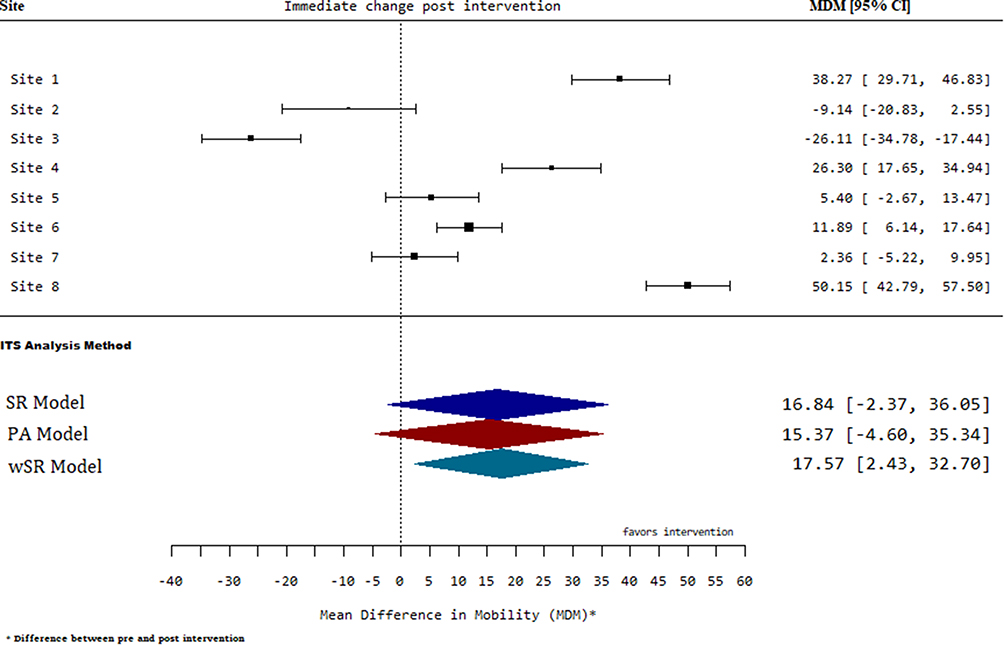 |
Figure 9 Forest plot for change in level of mobilization post intervention for moderate within- and between-site heterogeneity. |
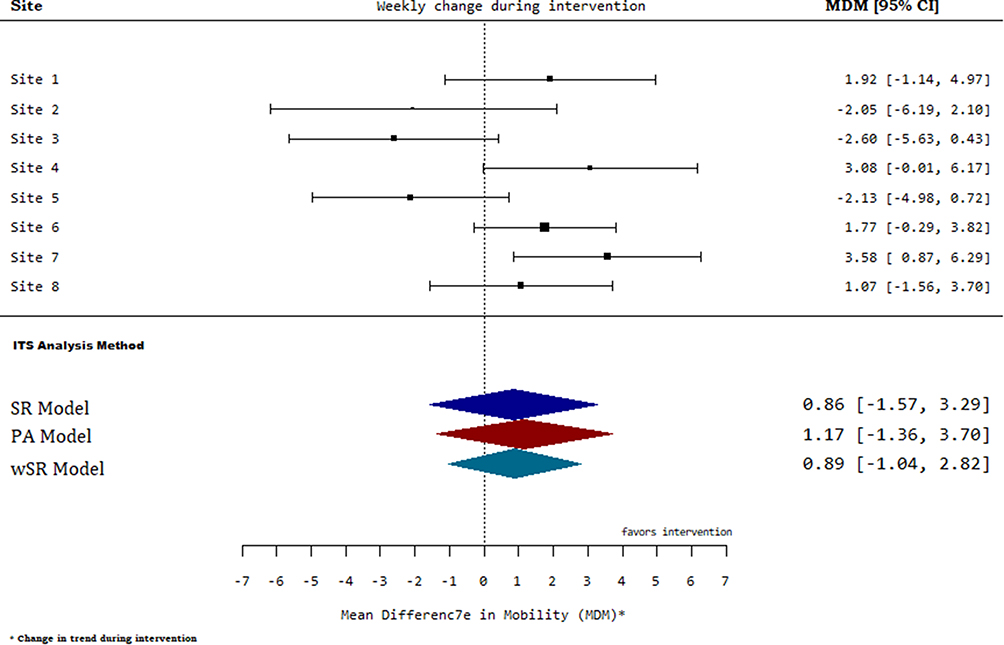 |
Figure 10 Forest plot for change in trend of mobilization post intervention for high within-site variability. |
For analysis involving four sites, when the between-site heterogeneity was very high,  , the wSR method produced the most precise estimate compared to the PA method and the conventional SR method (Figure 4), where the length of the confidence intervals for our estimates are significantly smaller and hence most precise compared to estimates based on the traditional SR and the PA methods (Table 2). The same conclusions were drawn when there was moderate between-site heterogeneity (Figure 5). On the other hand, when there was substantial within-site heterogeneity and moderate between-site heterogeneity, the wSR and the PA methods gave results that were similar in precision whereas the traditional SR still had the worst performance (Figure 6). When there is low between-site heterogeneity,
  , but substantial within-site variability, the wSR method provided the most precise estimates while the PA and the SR methods produced similar results (Figure 7). Interestingly, in the instance when the within- and between-site heterogeneity was low, the pooled method produced the most precise estimates, while the traditional SR performed significantly worse (Figure 8).
Similarly, when the number of included sites was increased to eight, the wSR method produced estimates with the narrowest confidence intervals in most cases (Table 2). When the between-site heterogeneity was at least moderate,  , the wSR method gave the most precise estimates compared to the other two methods (Figure 9). Interestingly, we observed that in some cases, where there was substantial within-site variability and moderate to high between-site heterogeneity, the PA method produced estimates associated with the widest confidence intervals (Figure 10).
Discussion
In this study, our aim was to extend the traditional SR approach, which is most commonly used in applications involving ITS studies and provide a methodological framework that allows the incorporation of within-site (between participants) and across-site (between healthcare facilities) heterogeneity. We performed extensive empirical evaluations by creating various scenarios using a multisite ITS study and compared our proposed method with that of the traditional SR and the PA method previously published.
Overall, our proposed wSR method produced estimates with the narrowest 95% confidence intervals for most of the scenarios considered, indicating that our method led to increased precision by incorporating two levels of heterogeneity in the data. The PA approach produced comparable estimates with that of the wSR in some scenarios, while the conventional SR method had the widest 95% confidence intervals compared to the other two methods. The observed wider confidence interval for the pooled method in situations with substantial within-site heterogeneity and a relatively high number of sites agrees with the reported limitation of the pooled analysis method.20 However, further investigation, preferably using extensive simulations, is required to understand performance limitations for the pooled method in comparison with the weighted analysis.
For almost all of the scenarios considered, our proposed method produced the most precise estimates, with narrower confidence intervals, hence allowing meaningful differences to be detected. This finding also indicates that our method led to increased statistical power. Finally, we would like to highlight that the extensive empirical evaluations performed in this paper lay the groundwork for further extensive study involving simulations to establish more extensive performance characteristics of our method and compare performance with the other methods in terms of well-established performance measures such as bias, mean square error (MSE), type I error rate, and statistical power.
Conclusions
In conclusion, the findings in this study show that accounting for participant variability and differences across healthcare facilities in the analysis of ITS data leads to increased precision and statistical power. The results also show that simply pooling slopes and intercepts from site-level analysis has performance limitations. Taking into consideration that most ITS studies are conducted in healthcare settings and involve aggregated data, we believe this study provides findings that encourage researchers to consider differences in the participant populations and across healthcare settings. Our study also highlights the need for researchers who collect administrative routine data, which are usually presented in aggregated forms, to also report the variability associated with such data for meaningful statistical analysis to be performed.
Abbreviations
ITS, interrupted time series; SR, segmented regression; LOS, length of stay; QI, quality improvement; wSR, weighted segmented regression; PA, pooled analysis; MSE, mean square error; MOVE-ON, Mobility of Vulnerable Elders in Ontario.
Data Sharing Statement
The datasets used or analyzed during the current study are available from the corresponding author on reasonable request.
Ethics Approval and Consent to Participate
Not Applicable.
Author Contributions
All authors contributed to data analysis, drafting or revising the article, gave final approval of the version to be published, and agree to be accountable for all aspects of the work.
Disclosure
The authors declare that they have no competing interests.
References
1. Penfold RB, Fang Z. Use of interrupted time series analysis in evaluating health care quality improvements. Acad Pediatr. 2013:S38–44.
2. Wagner AK, Soumerai SB, Zhang F, et al. Segmented regression analysis of interrupted time series studies in medication use research. J Clin Pharm Ther. 2002;27(4):299–309. doi:10.1046/j.1365-2710.2002.00430.x
3. Zhang F, Wagner AK, Soumerai SB, et al. Methods for estimating confidence intervals in interrupted time series analyses of health interventions. J Clin Epidemiol. 2009;62(2):143–148. doi:10.1016/j.jclinepi.2008.08.007
4. Ewusie J, Blondal E, Soobiah C, et al. Methods, applications, interpretations and challenges of interrupted time series (ITS) data: protocol for a scoping review. BMJ Open. 2017;7(6):e016018. doi:10.1136/bmjopen-2017-016018
5. Ewusie J, Soobiah C, Blondal E, et al. Methods, applications and challenges in the analysis of interrupted time series data: a scoping review. J Multidiscip Healthc. 2020. doi:10.2147/JMDH.S241085
6. Ansari F, et al. Outcomes of an intervention to improve hospital antibiotic prescribing: interrupted time series with segmented regression analysis. J Antimicrob Chemother. 2003;52(5):842–848. doi:10.1093/jac/dkg459
7. Bedard NA, DeMik DE, Glass NA, et al. Impact of clinical practice guidelines on use of intra-articular hyaluronic acid and corticosteroid injections for knee osteoarthritis. JBJS. 2018;100(10):827–834. doi:10.2106/JBJS.17.01045
8. Fowler S, Webber A, Cooper BS, et al. Successful use of feedback to improve antibiotic prescribing and reduce Clostridium difficile infection: a controlled interrupted time series. J Antimicrob Chemother. 2007;59(5):990–995. doi:10.1093/jac/dkm014
9. Hartung DM, Carlson MJ, Kraemer DF, et al. Impact of a Medicaid copayment policy on prescription drug and health services utilization in a fee-for-service Medicaid population. Med Care. 2008;46(6):565–572. doi:10.1097/MLR.0b013e3181734a77
10. Katikireddi SV, Der G, Roberts C, et al. Has childhood smoking reduced following smoke-free public places legislation? A segmented regression analysis of cross-sectional UK school-based surveys. Nicotine Tobacco Res. 2016;18(7):1670–1674. doi:10.1093/ntr/ntw018
11. Naimer MS, Kwong JC, Bhatia D, et al. The effect of changes in cervical cancer screening guidelines on chlamydia testing. Ann Fam Med. 2017;15(4):329–334. doi:10.1370/afm.2097
12. Smith DH, Perrin N, Feldstein A, et al. The impact of prescribing safety alerts for elderly persons in an electronic medical record: an interrupted time series evaluation. Arch Intern Med. 2006;166(10):1098–1104. doi:10.1001/archinte.166.10.1098
13. Kong M, Cambon A, Smith MJ. Extended logistic regression model for studies with interrupted events, seasonal trend, and serial correlation. Commun Stat Theory Meth. 2012;41(19):3528–3543. doi:10.1080/03610926.2011.563020
14. Wang JJ, et al. A comparison of statistical methods in interrupted time series analysis to estimate an intervention effect.
15. Bernal JL, Cummins S, Gasparrini A. Interrupted time series regression for the evaluation of public health interventions: a tutorial. Int J Epidemiol. 2017;46(1):348–355. doi:10.1093/ije/dyw098
16. Biglan A, Ary D, Wagenaar AC. The value of interrupted time-series experiments for community intervention research. Prev Sci. 2000;1(1):31–49. doi:10.1023/A:1010024016308
17. Taljaard M, McKenzie JE, Ramsay CR, et al. The use of segmented regression in analysing interrupted time series studies: an example in pre-hospital ambulance care. Implement Sci. 2014;9(1):77. doi:10.1186/1748-5908-9-77
18. Gillings D, Makuc D, Siegel E. Analysis of interrupted time series mortality trends: an example to evaluate regionalized perinatal care. Am J Public Health. 1981;71(1):38–46. doi:10.2105/AJPH.71.1.38
19. Box GE, et al. Time Series Analysis: Forecasting and Control. John Wiley & Sons; 2015.
20. Gebski V, Ellingson K, Edwards J, et al. Modelling interrupted time series to evaluate prevention and control of infection in healthcare. Epidemiol Infect. 2012;140(12):2131–2141. doi:10.1017/S0950268812000179
21. Lyman GH, Kuderer NM. The strengths and limitations of meta-analyses based on aggregate data. BMC Med Res Methodol. 2005;5(1):14. doi:10.1186/1471-2288-5-14
22. Garrett TA. Aggregated versus disaggregated data in regression analysis: implications for inference. Econ Lett. 2003;81(1):61–65. doi:10.1016/S0165-1765(03)00149-6
23. Liu B, Almaawiy U, Moore JE, Chan WH, Straus SE, MOVE ON Team. Evaluation of a multisite educational intervention to improve mobilization of older patients in hospital: protocol for mobilization of vulnerable elders in Ontario (MOVE ON). Implementation Science. 2013. 8(1):76.
24. Liu B, Moore JE, Almaawiy U, et al. Outcomes of Mobilisation of Vulnerable Elders in Ontario (MOVE ON): a multisite interrupted time series evaluation of an implementation intervention to increase patient mobilisation. Age Ageing. 2018;47(1):112–119. doi:10.1093/ageing/afx128
25. Sen A, Srivastava M. Regression Analysis: Theory, Methods, and Applications. Springer Science & Business Media; 2012.
26. Higgins JPT, Thompson SG. Quantifying heterogeneity in a meta-analysis. Stat Med. 2002;21(11):1539–1558. doi:10.1002/sim.1186
27. Higgins JP, et al. Measuring inconsistency in meta-analyses. BMJ. 2003;327(7414):557. doi:10.1136/bmj.327.7414.557
 © 2020 The Author(s). This work is published and licensed by Dove Medical Press Limited. The
full terms of this license are available at https://www.dovepress.com/terms
and incorporate the Creative Commons Attribution
- Non Commercial (unported, 3.0) License.
By accessing the work you hereby accept the Terms. Non-commercial uses of the work are permitted
without any further permission from Dove Medical Press Limited, provided the work is properly
attributed. For permission for commercial use of this work, please see paragraphs 4.2 and 5 of our Terms.
© 2020 The Author(s). This work is published and licensed by Dove Medical Press Limited. The
full terms of this license are available at https://www.dovepress.com/terms
and incorporate the Creative Commons Attribution
- Non Commercial (unported, 3.0) License.
By accessing the work you hereby accept the Terms. Non-commercial uses of the work are permitted
without any further permission from Dove Medical Press Limited, provided the work is properly
attributed. For permission for commercial use of this work, please see paragraphs 4.2 and 5 of our Terms.