Back to Journals » Cancer Management and Research » Volume 12
Multi-Window CT Based Radiological Traits for Improving Early Detection in Lung Cancer Screening
Authors Lu H ![]() , Kim J
, Kim J ![]() , Qi J, Li Q, Liu Y, Schabath MB
, Qi J, Li Q, Liu Y, Schabath MB ![]() , Ye Z
, Ye Z ![]() , Gillies RJ
, Gillies RJ ![]() , Balagurunathan Y
, Balagurunathan Y ![]()
Received 19 January 2020
Accepted for publication 3 October 2020
Published 27 November 2020 Volume 2020:12 Pages 12225—12238
DOI https://doi.org/10.2147/CMAR.S246609
Checked for plagiarism Yes
Review by Single anonymous peer review
Peer reviewer comments 2
Editor who approved publication: Dr Xueqiong Zhu
Hong Lu,1,2 Jongphil Kim,3 Jin Qi,1,2 Qian Li,1 Ying Liu,1 Matthew B Schabath,4 Zhaoxiang Ye,1 Robert J Gillies,2 Yoganand Balagurunathan2,5
1Department of Radiology, Tianjin Medical University Cancer Institute and Hospital, National Clinical Research Center of Cancer, Key Laboratory of Cancer Prevention and Therapy, Tianjin, People’s Republic of China; 2Department of Cancer Physiology, H. Lee Moffitt Cancer Center and Research Institute, Tampa, FL, USA; 3Department of Biostatistics and Bioinformatics, H. Lee Moffitt Cancer Center and Research Institute, Tampa, FL, USA; 4Department of Cancer Epidemiology, H. Lee Moffitt Cancer Center and Research Institute, Tampa, FL, USA; 5Department of Machine Language, H. Lee Moffitt Cancer Center and Research Institute, Tampa, FL, USA
Correspondence: Yoganand Balagurunathan; Robert J Gillies
H. Lee Moffitt Cancer Center and Research Institute, 12902 Magnolia Drive, Tampa, FL 33612, USA
Email [email protected]; [email protected]
Rationale and Objectives: Evaluate ability of radiological semantic traits assessed on multi-window computed tomography (CT) to predict lung cancer risk.
Materials and Methods: A total of 199 participants were investigated, including 60 incident lung cancers and 139 benign positive controls. Twenty lung window features and 2 mediastinal window features were extracted and scored on a point scale in three screening rounds. Multivariate logistic regression analysis was used to explore the association of these radiological traits with the risk of developing lung cancer. The areas under the receiver operating characteristic curve (AUROC), sensitivity, specificity, and positive predictive value (PPV) were computed to evaluate the best predictive model.
Results: Combining mediastinal window-specific features with the lung window features-based model significantly improves performance compared to individual window features. Model performance is consistent both at baseline and the first follow-up scan, with an AUROC increased from 0.822 to 0.871 (p = 0.009) and from 0.877 to 0.917 (p = 0.008), respectively, for single to multi-window feature models. We also find that the multi-window CT based model showed better specificity and PPV, with PPV at the second follow-up scan improved to 0.953.
Conclusion: We find combining window semantic features improves model performance in identifying cancerous nodules. We also find that lung window features are more informative compared to mediastinal features in predicting malignancy.
Keywords: multi-window, radiological, CT, lung cancer, screening
Introduction
Lung cancer continues to be the leading cause of cancer-related deaths worldwide.1 In 2017, an estimated 155,870 deaths were reported, representing approximately 26% of all cancer deaths in the United States.2 The early detection of lung cancer in high-risk individuals could improve survival. Low-dose computed tomography (LDCT) scans can help to detect small and potentially curable lung cancer in its early stage.3,4 The National Lung Screening trial (NLST), which compared LDCT and standard chest X-ray with three annual screens, demonstrated a 20% reduction in lung cancer mortality among those at high-risk.8 Based on the findings from the NLST, the US Preventive Services Task Force issued a recommendation for annual lung cancer screening by LDCT.5 There were few other follow-up meta-analyses to address the mortality reduction effect in both smokers and non-smokers.6,7
However, balancing the benefits of early detection and reducing harmful radiation exposure of lung cancer screening is currently a controversial issue.8 The high false positive rate is a major limitation of lung cancer screening, which will result in additional periodic testing or the need for an invasive procedure.9 Meanwhile, the fact that the majority of non-small cell lung cancers (NSCLCs) in the NLST were treated when they were greater in size than the curable threshold poses a diagnostic and management challenge.10 There is a need for early, precise detection tools to identify malignant tumors at smaller sizes within the curable threshold in order to apply LDCT to maximize the benefits of lung cancer screening.
In current practice, pulmonary nodules identified with computed tomography (CT) are managed according to widely accepted guidelines that heavily rely on nodule size.11–14 In NLST, a non-calcified nodule equal or greater than 4 mm was used as a criterion for identifying positivity, with little focus given to other abnormalities such as adenopathy or pleural effusion, leading to higher variability in positive nodule detection.15 Based on this definition, the false positive rate was reported to be approximately 96.4%.8 The Lung CT Screening Reporting and Data System (Lung-RADS)16 was proposed by the American College of Radiology as a guideline for nodule management and to provide risk assessment for LDCT findings. Lung-RADS uses an adaptive approach and evaluates the lung nodules differently at baseline compared to subsequent screenings time points. At baseline screening, nodule size and nodule attenuation are considered, whereas for subsequent screenings, the criteria require changes in size of the lesion to assess risk of malignancy. In a recent study, Henry et al17 reported that using Lung-RADS criteria would reduce the false positive rate compared to size-based metric used by the NLST, but the study claims it would also result in an increase in false negative results. It becomes imperative to develop non-size-based approaches to distinguish malignant from benign lung nodules in LDCT.
Our previous studies have shown the usefulness of semantic features in quantitative capture of radiologist opinion and their ability to improve detection of malignancy.18–20 Most of these proposed semantic features of primary lung nodules were defined on the lung window. Lee et al20 and Sajin et al21 have shown that the different parts of lung nodules that are visible in these CT windows (lung and mediastinal windows) were associated with different pathological components. It has to be noted that radiologists commonly switch between windows to improve diagnostic accuracy in conventional radiology.
We hypothesize that using different CT window settings allows us to better characterize heterogeneous tumors, which reflect different components and structures of the investigated lung nodules. The current study aims to develop a systematic approach to quantify multi-window CT based radiological descriptors and identifies a set of discriminant LDCT imaging characteristics that could be used to provide a risk assessment for the early detection of lung cancer.
Materials and Methods
Study Population
The patients' LDCT images and clinical information were obtained from the Cancer Data Access System after executing a data usage agreement with the NLST.21 The patient data curation and cohort selection has been well documented in our previous publications.22–24 In brief, the NLST study accrued a total of 53,454 participants who were at high risk (smokers) of lung cancer enrolled at 33 United States medical centers. Patients were randomly assigned to LDCT (26,722 individuals) and chest X-ray radiography examination, who were administered baseline and two annual follow-up scans. On confirmation of lung cancer, the participants were either dropped or followed up; both categories of patients were offered treatment options that followed a standard screening protocol.
The study cohort (Figure 1) has 199 patients in total, of whom 60 had lung cancers and 139 had a benign diagnosis (nodule positive controls). Incident lung cancer was identified as positive on the baseline scan according to the NLST criteria, and later followed up to be diagnosed as lung cancer at the first or second follow-up scan. The positive control group underwent three consecutive positive screens that were not diagnosed as a malignancy. The two groups were matched in terms of demographic characteristics, such as age, sex, smoking status, and other factors. This cohort had been described in a previous study for a complementary study goal.20
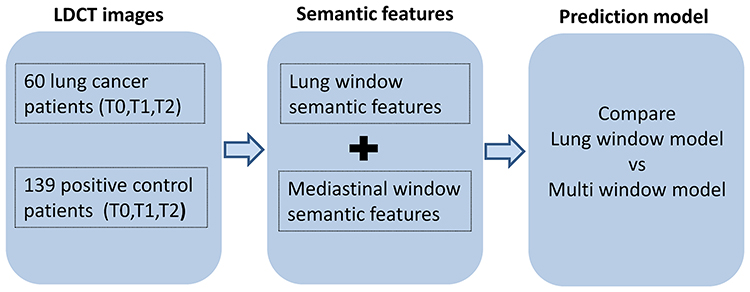 |
Figure 1 Schema of the study. The lung window and mediastinal window radiological traits were scored by radiologists and correlated with lung cancer risk. |
Multi-Window CT Image Analysis
Sequential LDCT images from three time points, baseline (T0), first follow-up (T1), and second follow-up (T2), each with about 1 year time interval between the time points, were reviewed by a clinical radiologist (H. L.) with more than 10 years of experience in thorax imaging. The reviewer was blinded to the patient's clinical information and their final diagnosis when evaluating the nodules. All LDCT images were displayed and scored using lung (WW 1500Hu, WL −600Hu) and mediastinal (WW 350Hu, WL 40Hu) window settings, independently. A total of 20 CT radiological traits (semantics) were defined in the lung window; two were defined in the mediastinal window (Table 1). The lung window semantic features were classified into seven groups, including location, size, shape, margin, density, internal features, and external features. The two mediastinal window-specific features were distribution patterns and solid part ratio. Each slice containing the tumor was evaluated and the average score was provided as the final assessment. Each CT descriptor was rated for binary or ordinal point scale.
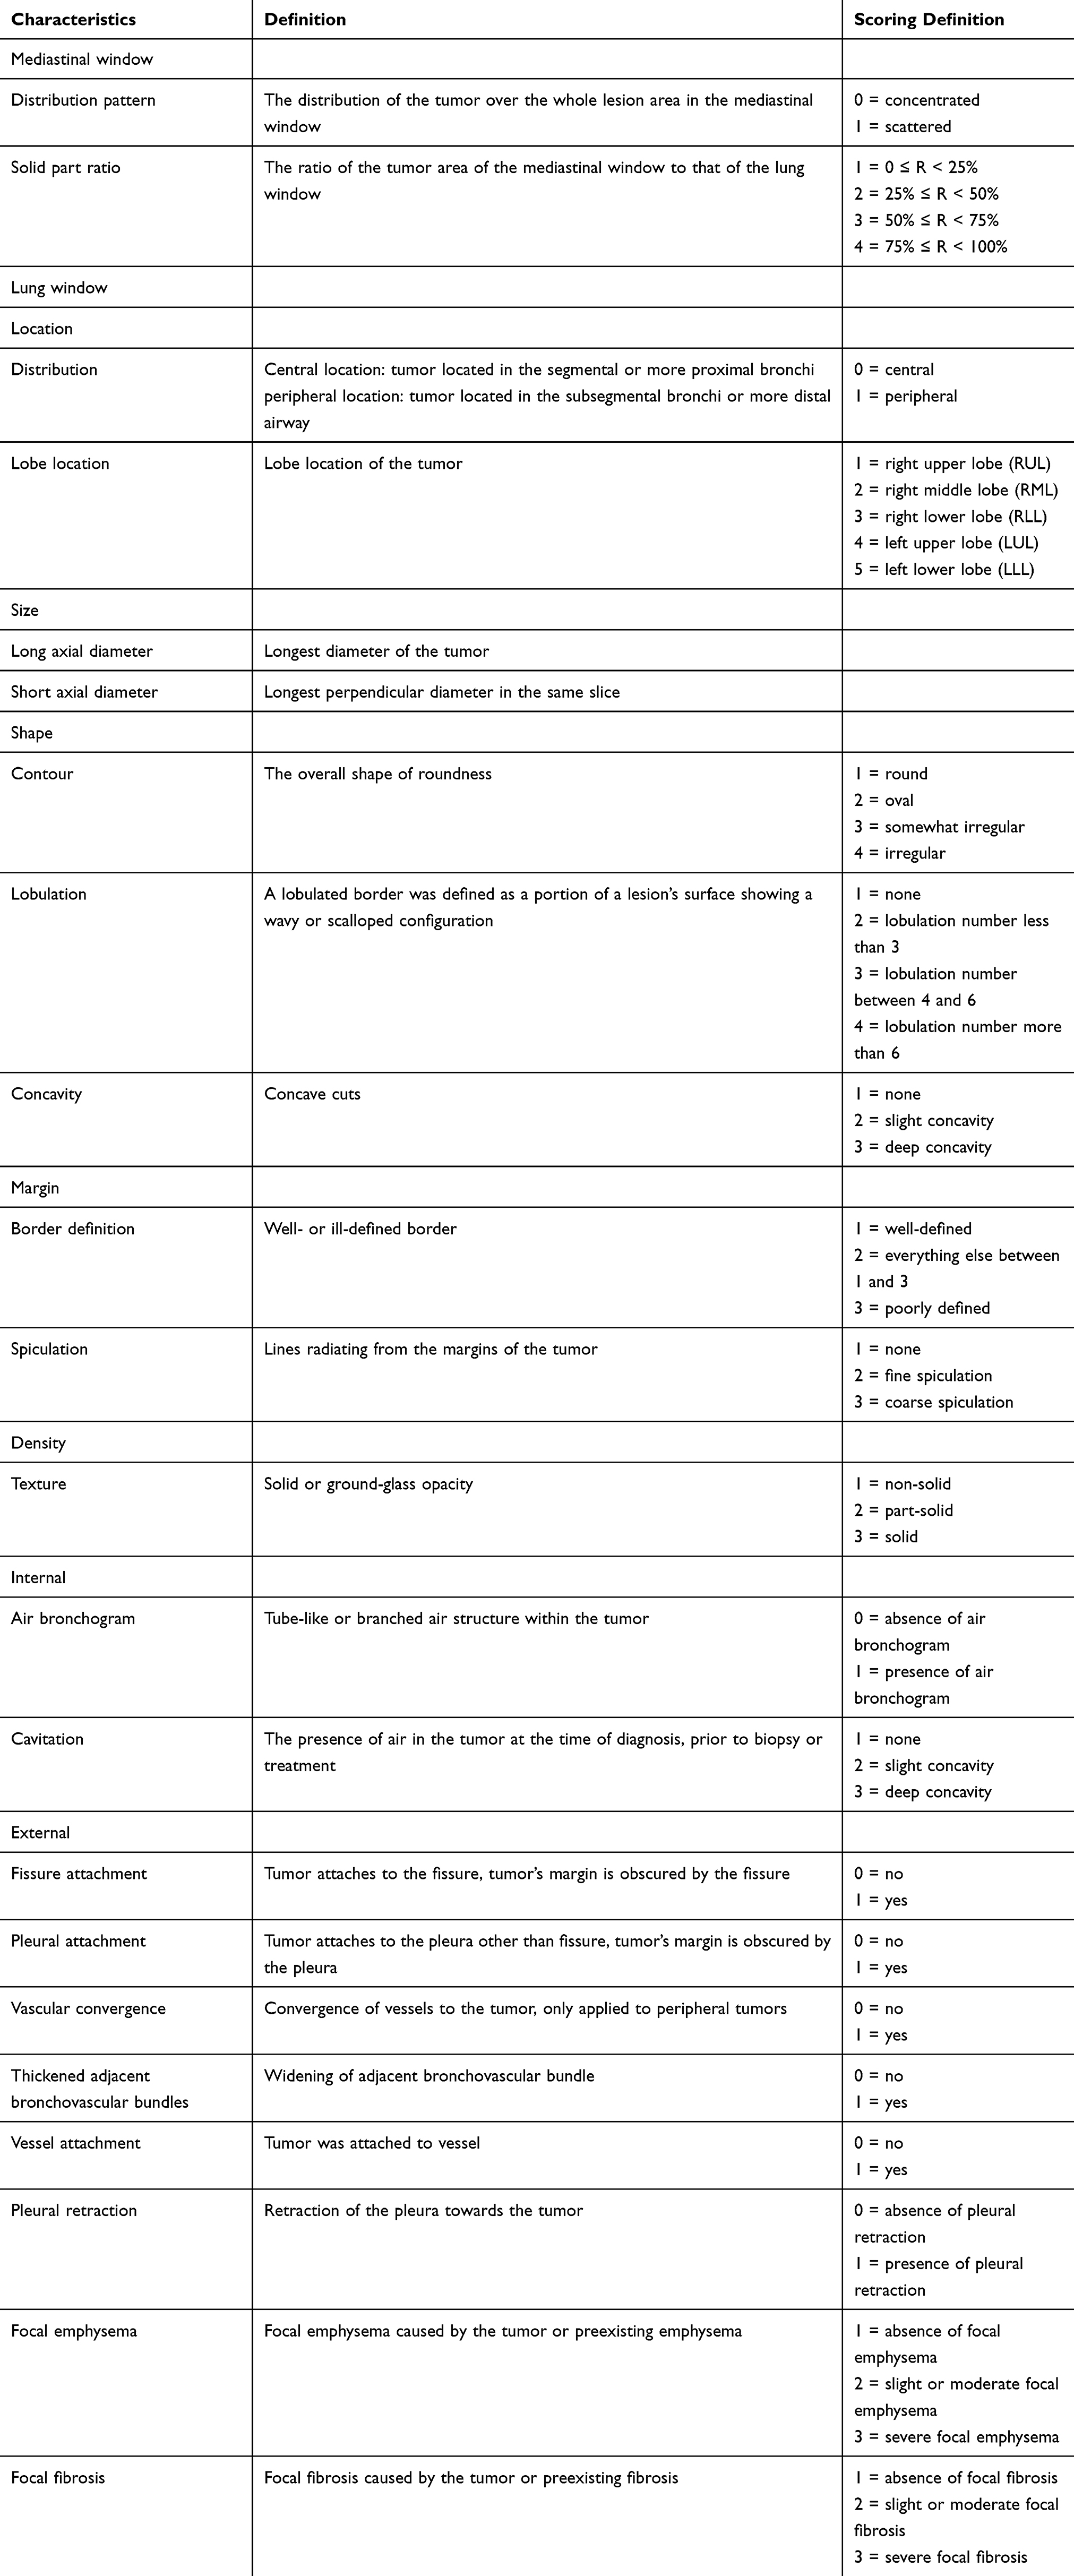 |
Table 1 Multi-Window Semantic Features for Lung Cancer |
The inter-reader agreement between expert radiologist assessed semantics in lung window has been analyzed.20 In this study, we assessed the reproducibility of mediastinal semantic features on a randomly selected sample of 40 patients (20 incident lung cancers and 20 benign positive controls). Semantics were independently scored by an attending radiologist (J. Q.) with more than 10 years’ experience in lung radiology. Patient images were reviewed using identical DICOM image viewer software (PACS), following same definition for multi-window CT setting, using a standardized images trait sheet. The nodule's anatomical location center slice number for a patient scan was obtained from the curated tables and exchanged between the study radiologists.
Statistical Analysis
All statistical analyses were performed using SAS software (version 9.4, Cary, NC). Continuous variables are reported as medians and ranges, while categorical variables are reported as counts and percentages. The logistic regression model was used to build the predictive models. Variables with a p-value < 0.15 in the univariable model were included in the multivariable model; a higher level is set to accommodate more features. The backward elimination method was used to select the final predictive model; at each step, features with a p-value > 0.05 were eliminated. Further, the classification and regression tree model was considered; prune by cost complexity method and grow by entropy method (results omitted). In this study, the regression model was selected because of better stability. Receiver operating characteristic curves for each model were constructed and the area under the curve (AUC) and 95% confidence interval (CI) was calculated. Goodness-of-fit for logistic regression models was estimated by the Hosmer–Lemeshow test to examine the calibration of the model.25 Comparisons between two AUCs were evaluated by the nonparametric approach following the DeLong method.26 Fivefold cross validation with 100 replications was performed to evaluate the performance of the final model. A two-sided p-value of < 0.05 was regarded as statistically significant.
All scored descriptors at three time points were compared between malignant and benign lung nodules. Agreement between two readers was evaluated by kappa index for categorical variable and concordance correlation coefficient for continuous variables. Depending on the kappa values, inter-observer agreement was considered to be poor (0.01–0.20), fair (0.21–0.40), moderate (0.41–0.60), good (0.61–0.80), or excellent (0.81–1.00).27
Results
The demographic characteristics of participant have been previously reported.20 There were 72, 70, and 55 lesions invisible on the mediastinal window at three time points, respectively, primarily due to low density (eg pure ground glass density nodules) and small size and were excluded for further analysis. The long and short diameters of all lung nodules on the lung and mediastinal window are presented in Supplement Table S1. The sizes of malignant nodules were bigger than benign nodules on both the lung window and mediastinal window (p < 0.05), except for the short diameter in the mediastinal window at baseline (p = 0.50). The difference between the size of benign and malignant nodules increased with the screening round.
Table 2 summarizes the performance of the prediction model built according to lung window features only. At baseline (T0), the informative lung window predictors included contour (OR = 4.70, 95% CI = 1.90–11.67), border definition (OR = 4.19, 95% CI = 1.88–9.31), and peri-nodule emphysema (OR = 3.41, 95% CI = 1.21–9.61) with an AUC of 0.822 (Figure 2 T0). At the first follow-up scan (T1), the included lung window semantic features of the final model were contour (OR = 12.69, 95% CI = 5.02–32.10), border definition (OR = 3.05, 95% CI = 1.28–7.18), and attachment to vessel (OR = 3.22, 95% CI = 1.33–7.79) with an AUC of 0.887 (Figure 2, T1). At the second follow-up scan (T2), the final model included four lung window features: contour (OR = 5.77, 95% CI = 1.79–18.56), concavity (OR = 7.64, 95% CI = 1.75–33.46), border definition (OR = 5.33, 95% CI = 1.71–16.57), and spiculation (OR = 5.33, 95% CI = 1.71–16.57) with an AUC of 0.926 (Figure 2 T2).
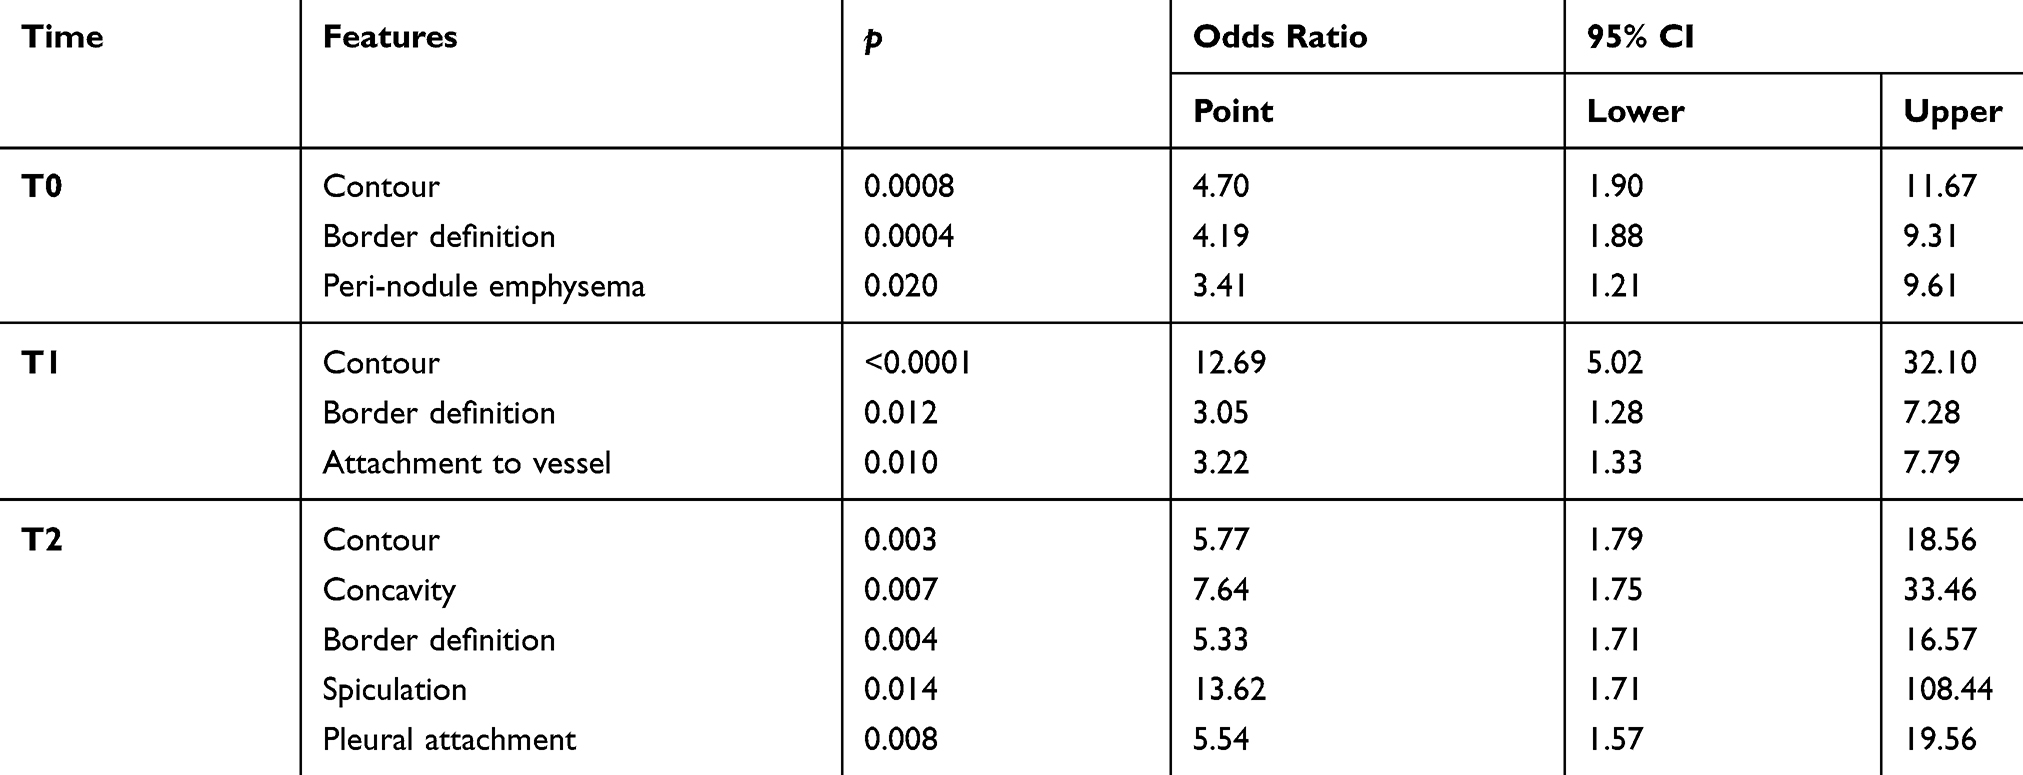 |
Table 2 Multivariable Analysis of Lung-Window Features in Predicting Lung Cancer at Three Time Points |
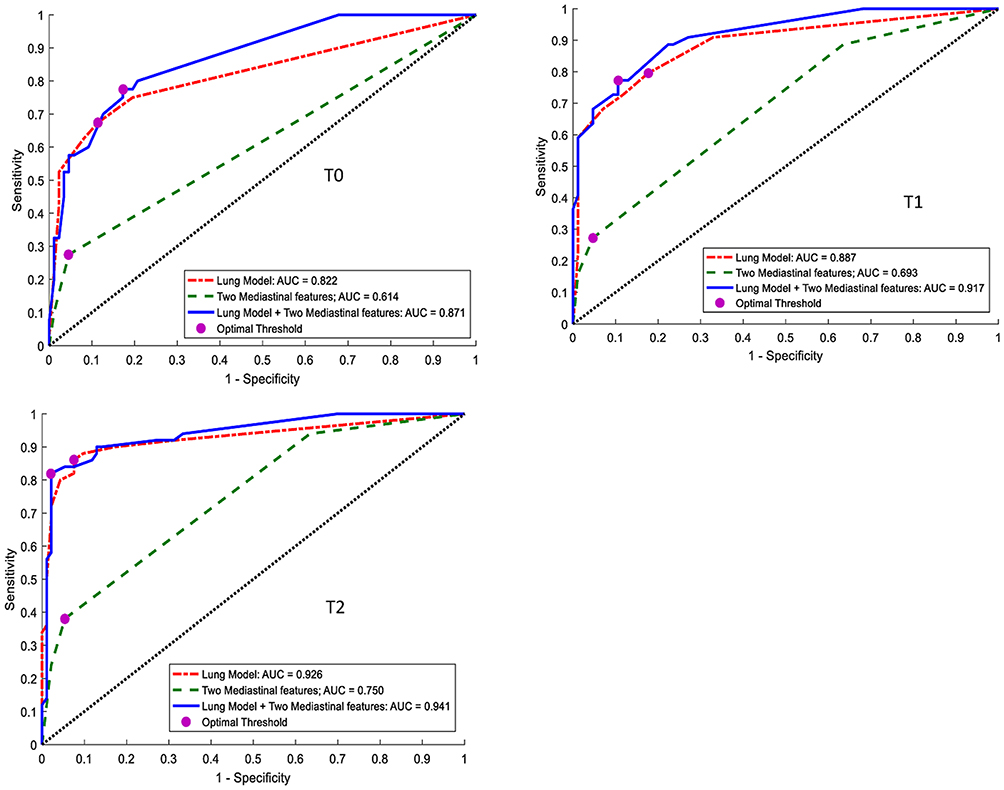 |
Figure 2 Receiver operating characteristic curves from multivariable analysis of lung window features (red line), mediastinal window features (green line), and combined multi-window features model (blue line). The lung window features model at T0 includes contour, border definition, and peri-nodule emphysema. At T1, the lung window features model includes contour, border definition, and attachment to vessel. At T2, the lung window features model includes contour, concavity, border definition, spiculation, and pleural attachment. Mediastinal window features are distribution pattern and solid part ratio. The multi-window features model includes all covariates from the lung window model and two features from the mediastinal model. |
The two mediastinal window features were significantly different (p < 0.05) between benign and malignant lung nodules, with the exception of discrepancy ratio at T0 (p = 0.93; Table 3). Concerning the distribution pattern, the scattered pattern on the mediastinal window was significantly more frequent in malignant lung nodules than benign lung nodules at baseline (18.3% vs 2.9%, p = 0.0002) and at follow-up screening (20.0% vs 2.9%, p = 0.0002 at T1; 31.7% vs 3.6%, p < 0.001 at T2). Two samples of mediastinal window feature-distribution pattern on benign and malignant lung nodules are given in Figures 3A–D and 4A–D. With regards to the solid part ratio feature, malignant lung nodules had a larger ratio than benign lung nodules and they increase in nodule size in follow-up screening (p = 0.023 at T1, p = 0.020 at T2).
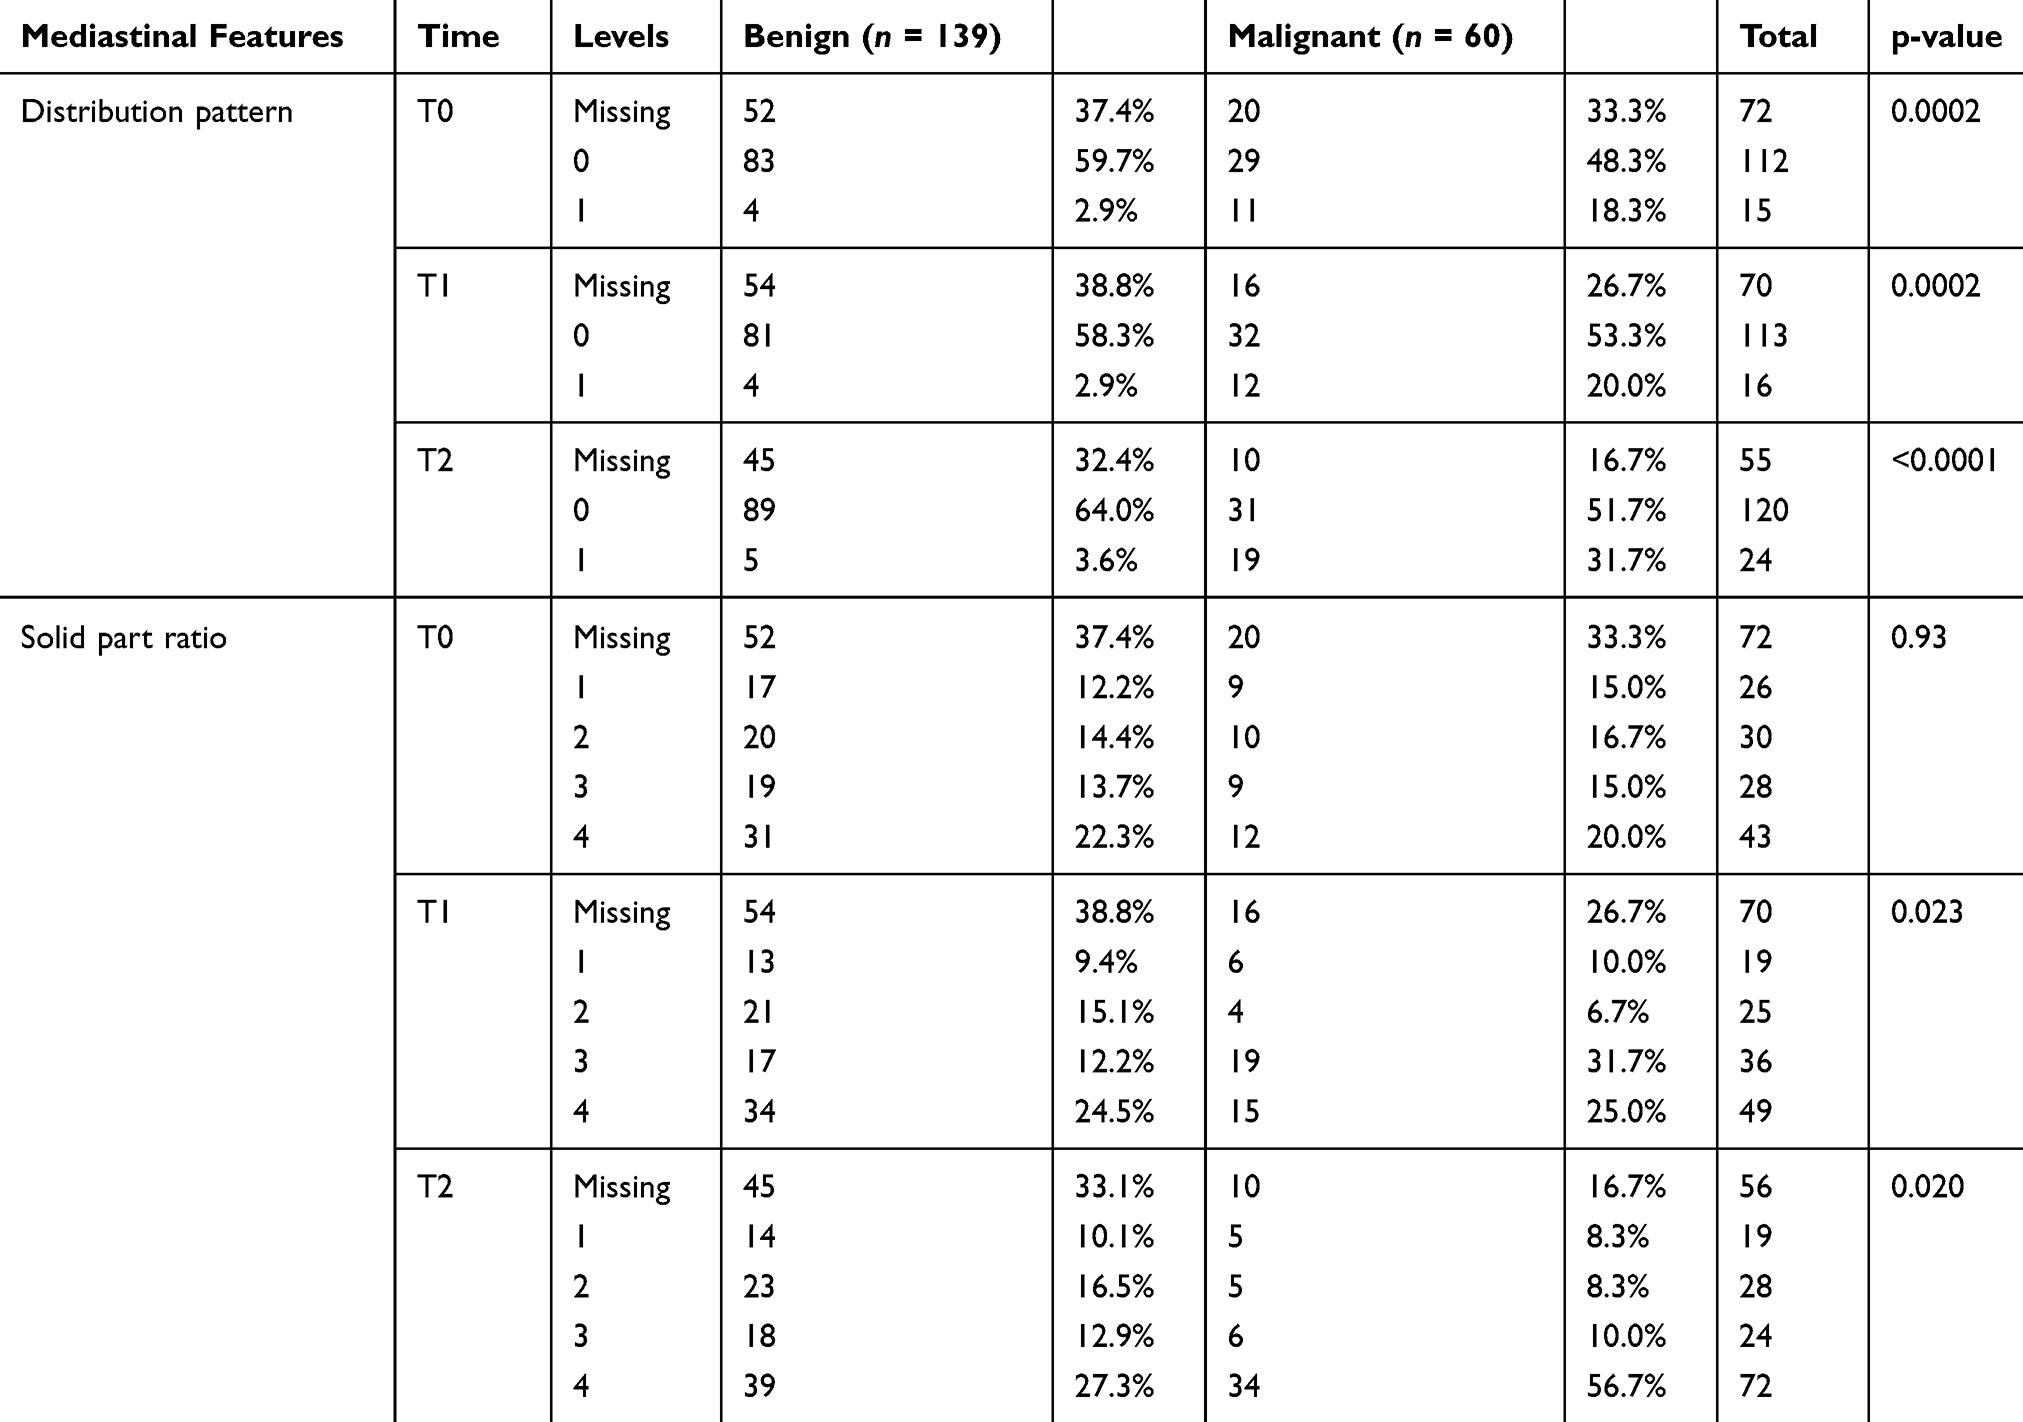 |
Table 3 Comparison of Two Mediastinal Features Between Benign and Malignant Lung Nodules |
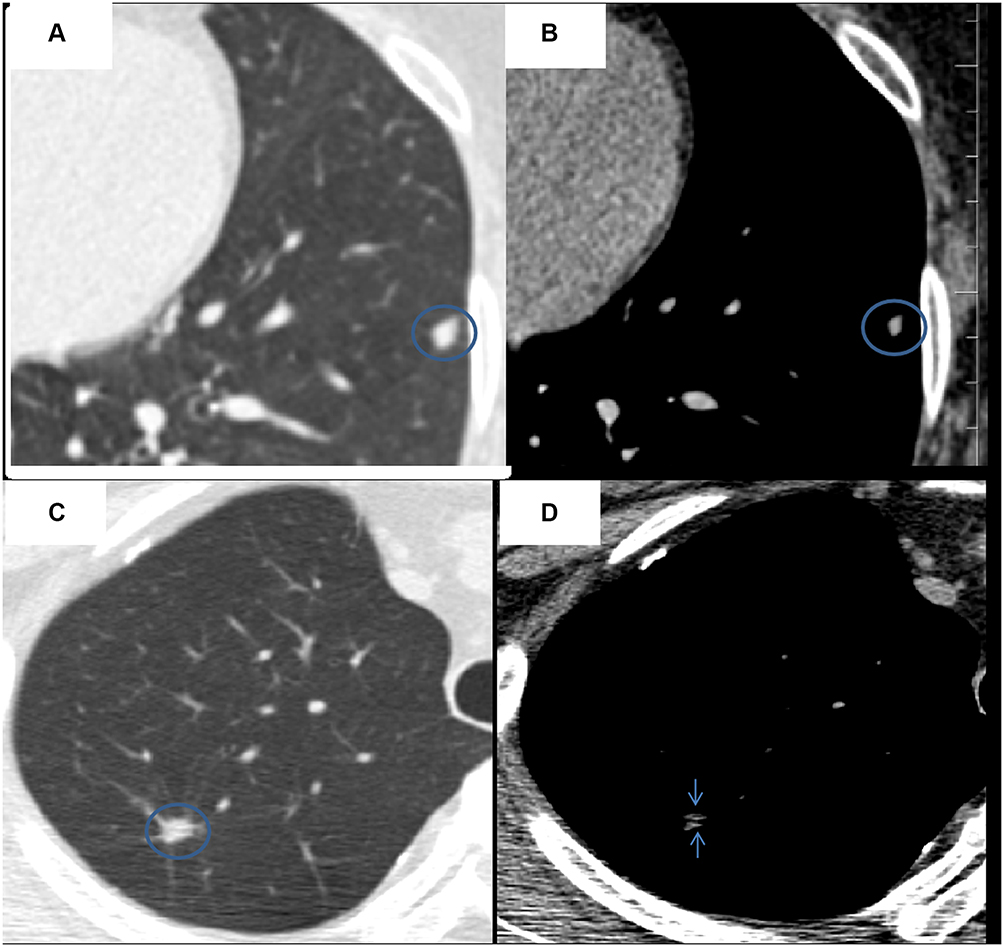 |
Figure 3 Mediastinal window feature-distribution pattern of benign lung nodules. (A, B) Axial CT images show an irregular nodule of the left lobe, with the concentrated distribution pattern on the mediastinal window. (C, D) Axial CT images show an irregular nodule in the right lobe, with the scattered distribution pattern on the mediastinal window. These two nodules were verified as benign lung nodules in NLST. |
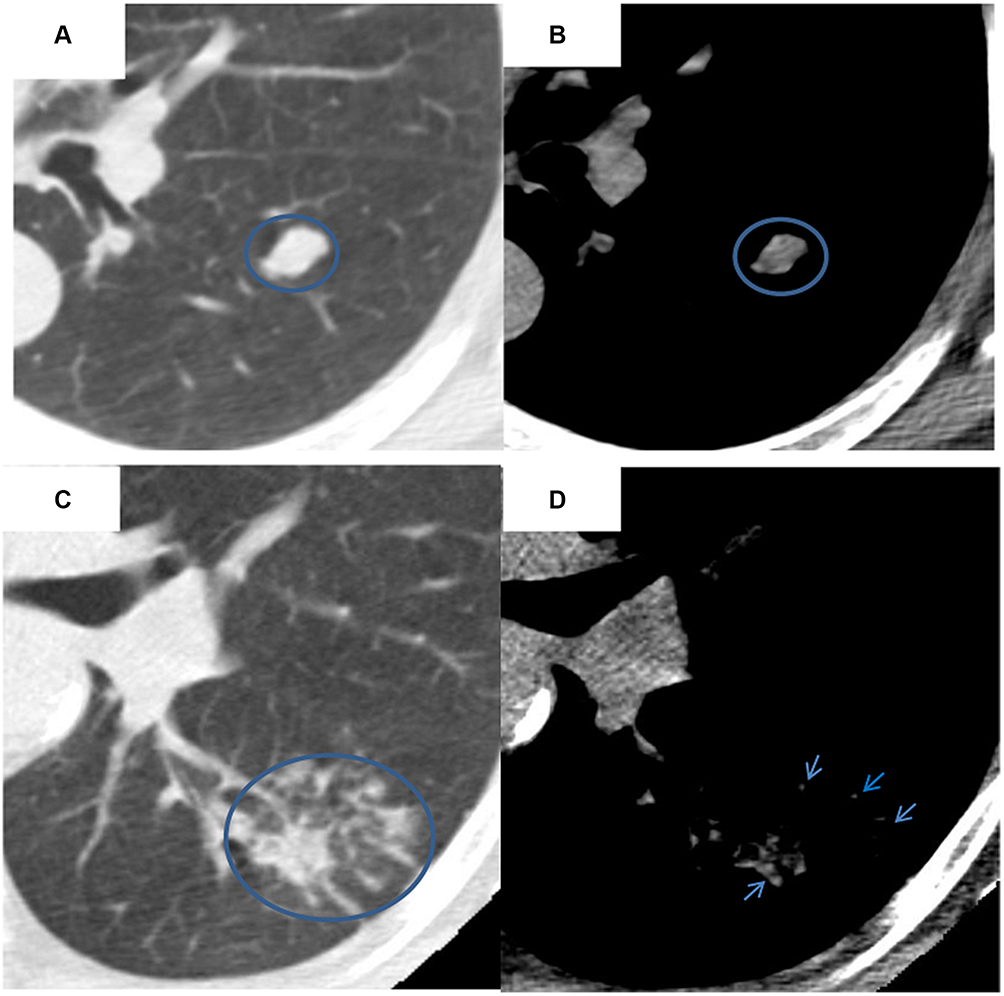 |
Figure 4 Mediastinal window feature-distribution pattern of lung cancer. (A, B) Axial CT images show an irregular nodule of the left lobe, with the concentrated distribution pattern on the mediastinal window. (C, D) Axial CT images show an irregular nodule in the right lobe, with the scattered distribution pattern on the mediastinal window. These two nodules were verified as lung cancer in NLST. |
The performance of semantic predictors both from the lung window and mediastinal window showed steady improvement with the screening rounds. The lung window features were more informative than mediastinal window features in predicting malignancy of lung nodules (Table 4). When adding two mediastinal window-based radiological features to a single lung window feature model, there was a significant improvement in predictor performance for identifying lung cancer, both at at baseline and on the first follow-up screening scan, with an AUC of 0.871 (95% CI = 0.809–0.933, p = 0.009) and 0.917 (95% CI = 0.869–0.966, p = 0.008), respectively. At the second follow-up, a multi-window features model showed an improvement, with an AUC value increased from 0.926 to 0.941 (95% CI = 0.899–0.983), but this did not reach statistical significance (p = 0.113). Meanwhile, the specificity and positive predictive value (PPV) were also markedly improved by combining these two mediastinal features during follow-up screening; it should be noted that the PPV value increased from 0.860 to 0.953 (Table 4).
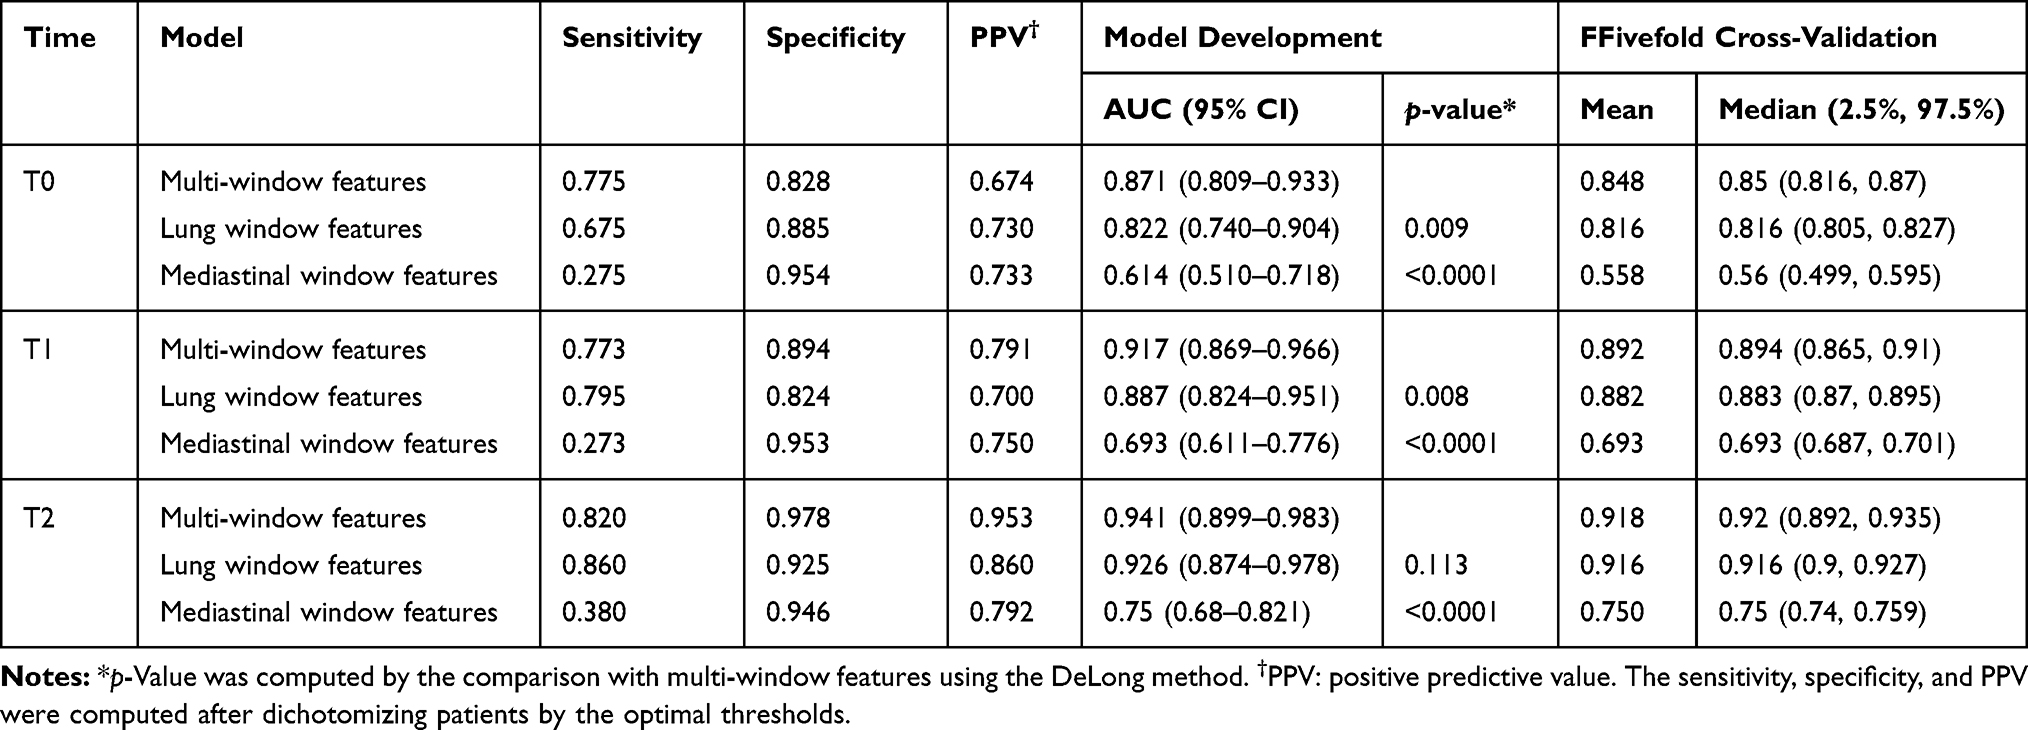 |
Table 4 Performance of Three Models in Predicting Lung Cancer at Three Time Points with Fivefold Cross-Validation |
We performed an inter-observer study to establish the reproducibility of two mediastinal window features, consistently scored across different observers, and found that they had perfect reproducibility with a kappa value of 1.00 for distribution pattern and 0.96 for solid part ratio (Figure 5A–H, Supplement Table S2).
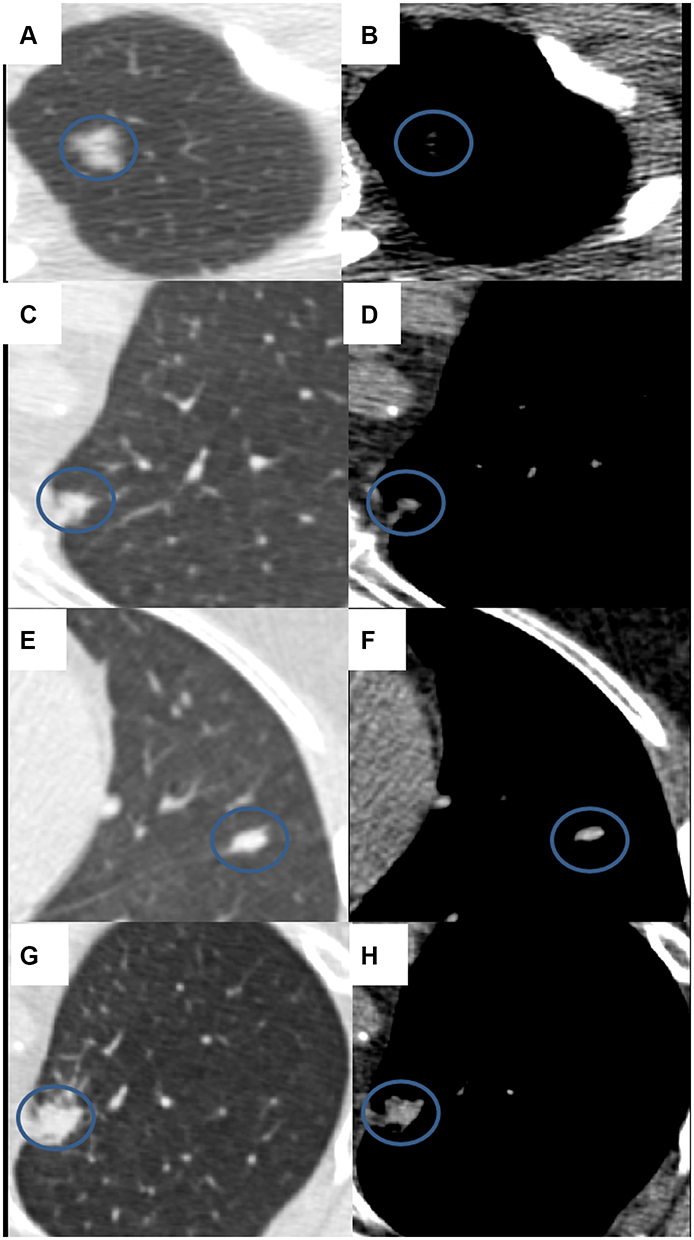 |
Figure 5 Mediastinal window feature-solid part ratio. (A, B) Score 1 (0 ≤ Ratio < 25%). (C, D) Score 2 (25% ≤ Ratio < 50%). (E, F) Score 3 (50% ≤ Ratio < 75%). (G, H) Score 4 (75% ≤ Ratio < 100%). |
Discussion
The goal of lung cancer screening is to detect disease at its earliest and most treatable stages, when the disease is localized and curative treatments are possible. Identifying malignancy accurately continues to be a challenge. In this study, we assessed the association of radiological features to lung cancer risk. Further, we built a multi-window CT based prediction model to show an improved AUROC for discriminating indeterminate pulmonary nodules in LDCT. We report that a combination of lung window and mediastinal window features better identifies malignancy than single window features, and the combination is helpful to improve the early detection of lung cancer, as well as the PPV.
The two mediastinal window-specific traits that were statistically associated with lung cancer risk are biologically and clinically relevant. It has been shown that presence of, and size of, solid parts are important factors for the management of indeterminate lung nodules.12,16,28 However, deciding whether a solid portion exists when evaluating a single lung window image is sometimes difficult and often falls short of a mutual satisfactory agreement, even for an experienced radiologist.29 Revel et al30 tried to use the mediastinal window to solve this problem. A simple criterion, the detectability of a solid portion in the mediastinal window, shows excellent inter-observer agreement for categorizing subsolid lung nodules. Their findings are consistent with the 2013 Fleischer guideline, which also recommends measuring the solid component on a mediastinal window. Moreover, they verified that the measurable solid potion on the mediastinal window correlates with invasiveness on pathologic examination. Sakao et al31 found that the nodule diameter on the mediastinal window was a significant predictive factor for lymph node metastasis and verified the association between the solid part on the mediastinal window and degree of tumor malignancy. Similarly, some studies found that the ratio of disappearance of the tumor area between the mediastinal window setting and the lung window setting correlates with clinical–pathologic characteristics and tumor aggressiveness and is a significant independent prognostic determinant for small lung adenocarcinoma.31,32 We offer new radiological insight into lung cancer screening and found that a higher ratio of solid component is associated with an increased risk of lung cancer at the first and second follow-up screening scans, consistent with the above-mentioned findings. The proportion of tumors with a solid part ratio greater than 50% was 56% and 66% for lung cancers at first and second follow-up screening, respectively, while only 36% and 39% for benign nodules. However, the solid component ratio did not show significant differences between lung cancer and benign lung nodules at baseline. We think these changes in the lung environment in the initial stages of cancer development would occur gradually, until it evolves into a highly specialized structure. In our study, we find a multi-window prediction model achieves 77.5% sensitivity and 82.8% specificity at baseline scan. By combining lung and mediastinal window findings effectively, we take full advantage of both window range and make up for their individual limitations.
We find malignant pulmonary nodules had a higher probability than benign nodules of showing a scattered distribution pattern of the solid component on the mediastinal window, a finding consistent with higher heterogeneity of lung cancer as compared to benign lung nodules. Most lung cancer lesions are a mixture of different histologic cell types with varying degrees of tumor differentiation. The International Association for the Study of Lung Cancer, American Thoracic Society, and European Respiratory Society jointly proposed a new histologic classification of lung adenocarcinoma in 2011, which classified lung adenocarcinoma as five histologic subtypes, namely lepidic, acinar, papillary, micropapillary, and solid pattern; the final diagnosis would be based on the predominant pattern by a semi-quantitative assessment approach (5% increments).33 The tumor architecture also correlates with imaging characteristics. As reported, the lepidic growth pattern is highly associated with ground glass opacity (GGO) on CT, which would be invisible on the mediastinal window,36 while the solid type is associated with non-lepidic predominant adenocarcinoma. In addition to the lepidic predominant pattern, some well-organized and well-differentiated acinar or papillary-predominant adenocarcinomas were also reported to show GGO.37 For benign lung lesions, GGO can be observed in focal interstitial fibrosis, inflammation, or pulmonary hemorrhage.38 The pathology of GGO and/or thickened interlobular septal in these lesions is attributed to the scattered distribution on mediastinal window. In our study, only approximately 3% of benign lung nodules presented as this scattered type, far below the average 23% for malignant lung nodules. We noticed that this ratio varied minimally during the three time points for benign lung nodules, while it rose expectedly over time for malignant nodules. Thus, we hypothesize that in addition to being a predictor of lung cancer risk, the distribution pattern on mediastinal window may also be associated with invasiveness or prognosis of lung adenocarcinoma.
Both the mediastinal window and the lung window have their own advantages in identifying characteristics of lung nodules. Consistent with previous studies,18–20 in our final model, the significant features on the lung window of primary lung nodules for the prediction of malignancy included contour, border definition, peri-nodule emphysema, attachment to vessel, concavity, spiculation, and pleural attachment. The positive association of these informative semantic features with the likelihood of malignancy have been widely acknowledged and used in clinical practice. Compared with current clinical guidelines, which rely heavily on the nodule size and have a widely ranging false positive rate, these semantic features were verified to be good predictors of malignancy. Paul et al39 applied Lung-RADS criteria to the NLST and found that Lung-RADS could be helpful in reducing the false positive rate, but this was at the cost of decreased sensitivity. In their study, the PPV at baseline and after baseline were 9.6% and 12.6%. Excitingly, the PPV of our model reached 67.4%, 79.1%, and 95.3% at baseline and at two follow-up time points, respectively. Thus, our multi-window CT based prediction model optimizes the informative features and aids the clinical decision support system.
However, our study has several limitations. Firstly, it was a retrospective analysis with a comparatively small sample size. Because the NLST participants came from different medical centers across the United States, the CT scanning parameters were not consistent, which could affect the contrast of images and possibly some of the radiologic features. We utilized a fixed window parameter to observe lung nodules in this study in order to mitigate this variance. It should be noted that the impact on variation in these acquisition parameters was less for semantic features than for quantitative features (radiomics). In addition, we did not classify these lung nodules as solid and non-solid groups, because the proposed mediastinal window-specific features already contain tumor density information. Our multi-window model would be appropriate for all intermediate nodules encountered with a screening or a diagnostic approach.
We do acknowledge that our finding in a curated diverse NLST clinical trial provided an ideal discovery cohort. It would be essential to future validate our findings in other racially diverse screening cohorts to strengthen our findings.
Conclusions
Multi-window CT based radiological traits show promising results that improveour ability for early detection of lung cancer. The lung window features are more informative than single mediastinal window features for predicting malignancy, whereas mediastinal window features provide strong complementary data to enhance the prediction accuracy and reduce false positives.
Ethics Approval and Consent to Participate
The study was conducted in compliance with ethical principles for medical research involving human subjects as outlined in World Medical Association’s Declaration of Helsinki and was approved by the Institutional Review Board (IRB) at University of South Florida (USF). Because it is a retrospective study, informed consent was waived. Patients’ privacy and personal identity information were well protected. All data were compiled in a Microsoft Excel spreadsheet, which was password protected to maintain patient confidentiality. Each subject was assigned a unique number in consecutive order, not derived from any patient identifiers.
Acknowledgments
We would like to convey our sincerely gratitude for the invaluable discussion to the members of Radiomics Research group at Moffitt Cancer Center and University of South Florida (Department of Computer sciences). We would like to extend our appreciation to Alberto Garcia for the image data management. This research was supported by the National Cancer Institute (grant U01-CA 143062-01) and the James and Esther King Biomedical Research Program (2KT01).
Disclosure
RJG reports grants from NIH and non-financial support from HeallthMyne Inc, during the conduct of the study; is an investor in and non-compensated consultant for HealthMyne, Inc, outside the submitted work; in addition, Dr Robert J. Gillies has patents 9,721,340 and 9,940,709 issued. HL received research scholarship from Tianjin Medical University Hospital to partially cover her research sabbatical time at Moffitt Cancer Center. The authors report no other potential conflicts of interest for this work.
References
1. Siegel RL, Miller KD, Jemal A. Cancer statistics, 2016. CA Cancer J Clin. 2016;66(1):7–30.
2. Smith RA, Andrews KS, Brooks D, et al. Cancer screening in the United States, 2017: A review of current American Cancer Society guidelines and current issues in cancer screening. CA Cancer J Clin. 2017;67(2):100–121.
3. Bach PB, Mirkin JN, Oliver TK, et al. Benefits and harms of CT screening for lung cancer: a systematic review. JAMA. 2012;307(22):2418–2429. doi:10.1001/jama.2012.5521
4. Patz EF, Goodman PC, Bepler G. Screening for lung cancer. N Engl J Med. 2000;343(22):1627–1633. doi:10.1056/NEJM200011303432208
5. Retrouvey M, Patel Z, Shaves S. US Preventive Services Task Force CT Lung Cancer Screening Recommendations: community Awareness and Perceptions. Journal of the American College of Radiology. 2016;13(2):R35–7. doi:10.1016/j.jacr.2015.12.011
6. Hsu H-T, Tang E-K, Wu M-T, et al. Modified Lung-RADS Improves Performance of Screening LDCT in a Population with High Prevalence of Non–smoking-related Lung Cancer. Acad Radiol. 2018;25(10):1240–1251. doi:10.1016/j.acra.2018.01.012
7. Wu F-Z, Huang Y-L, Wu CC, et al. Assessment of Selection Criteria for Low-Dose Lung Screening CT Among Asian Ethnic Groups in Taiwan: from Mass Screening to Specific Risk-Based Screening for Non-Smoker Lung Cancer. Clin Lung Cancer. 2016;17(5):e45–e56. doi:10.1016/j.cllc.2016.03.004
8. Wiener RS. Balancing the Benefits and Harms of Low-Dose Computed Tomography Screening for Lung Cancer: medicare’s Options for Coverage. Ann Intern Med. 2014;161(6):445–446. doi:10.7326/M14-1352
9. Pinsky PF, Bellinger CR, Miller DP. False-positive screens and lung cancer risk in the National Lung Screening Trial: implications for shared decision-making. J Med Screen. 2018;25(2):110–112.
10. Goldwasser DL. Estimation of the tumor size at cure threshold among aggressive non-small cell lung cancers (NSCLCs): evidence from the surveillance, epidemiology, and end results (SEER) program and the national lung screening trial (NLST). Int J Cancer. 2017;140(6):1280–1292. doi:10.1002/ijc.30548
11. MacMahon H, Austin JHM, Gamsu G, et al. Guidelines for management of small pulmonary nodules detected on CT scans: a statement from the Fleischner Society. Radiology. 2005;237(2):395–400. doi:10.1148/radiol.2372041887
12. Naidich DP, Bankier AA, MacMahon H, et al. Recommendations for the management of subsolid pulmonary nodules detected at CT: a statement from the Fleischner Society. Radiology. 2013;266(1):304–317. doi:10.1148/radiol.12120628
13. Callister ME, Baldwin DR, Akram AR, et al. British Thoracic Society guidelines for the investigation and management of pulmonary nodules. Thorax. 2015;70(Suppl 2):ii1–ii54.
14. National Comprehensive Cancer Network. NCCN Guidelines for Lung Cancer Screening; 2015. Available from: http://wwwnccnorg/patients/guidlines/lung_screening/.
15. Pinsky PF, Gierada DS, Nath PH, Kazerooni E, Amorosa J. National lung screening trial: variability in nodule detection rates in chest CT studies. Radiology. 2013;268(3):865–873. doi:10.1148/radiol.13121530
16. American College of Raiology. Lung CT Screening Reporting and Data System (lung-RADSTM). http://wwwarcorg/Quality-Safety/Resouces/LungRADS., 2014
17. Marshall HM, Zhao H, Bowman RV, et al. The effect of different radiological models on diagnostic accuracy and lung cancer screening performance. Thorax. 2017;72(12):1147–1150.
18. Liu Y, Balagurunathan Y, Atwater T, et al. Radiological Image Traits Predictive of Cancer Status in Pulmonary Nodules. Clin Cancer Res. 2017;23(6):1442–1449.
19. Liu Y, Wang H, Li Q, et al. Radiologic Features of Small Pulmonary Nodules and Lung Cancer Risk in the National Lung Screening Trial: A Nested Case-Control Study. Radiology. 2018;286(1):298–306.
20. Li Q, Balagurunathan Y, Liu Y, et al. Comparison Between Radiological Semantic Features and Lung-RADS in Predicting Malignancy of Screen-Detected Lung Nodules in the National Lung Screening Trial. Clin Lung Cancer. 2018;19(2):148–56 e3.
21. Institute. NC. Cancer data access system https://biometryncinihgov/cdas/nlst/.
22. National Lung Screening Trial Research T. Reduced lung-cancer mortality with low-dose computed tomographic screening. N Engl J Med. 2011;365(5):395–409.
23. National Lung Screening Trial Research T. Baseline characteristics of participants in the randomized national lung screening trial. J Natl Cancer Inst. 2010;102(23):1771–1779.
24. National Lung Screening Trial Research T. The National Lung Screening Trial: overview and study design. Radiology. 2011;258(1):243–253.
25. David W, Hosmer SL. Applied Logistic Regression. new york: John Wiley & Sons; 2000.
26. DeLong ER, DeLong DM, Clarke-Pearson DL. Comparing the areas under two or more correlated receiver operating characteristic curves: a nonparametric approach. Biometrics. 1988;44(3):837–845.
27. Viera AJ, Garrett JM. Understanding interobserver agreement: the kappa statistic. Fam Med. 2005;37(5):360–363.
28. Godoy MC, Naidich DP. Subsolid pulmonary nodules and the spectrum of peripheral adenocarcinomas of the lung: recommended interim guidelines for assessment and management. Radiology. 2009;253(3):606–622.
29. Ridge CA, Yildirim A, Boiselle PM, et al. Differentiating between Subsolid and Solid Pulmonary Nodules at CT: inter- and Intraobserver Agreement between Experienced Thoracic Radiologists. Radiology. 2016;278(3):888–896.
30. Revel MP, Mannes I, Benzakoun J, et al. Subsolid Lung Nodule Classification: A CT Criterion for Improving Interobserver Agreement. Radiology. 2018;286(1):316–325.
31. Okada M, Nishio W, Sakamoto T, Uchino K, Tsubota N. Discrepancy of computed tomographic image between lung and mediastinal windows as a prognostic implication in small lung adenocarcinoma. Ann Thorac Surg. 2003;76(6):1828–1832.
32. Ikehara M, Saito H, Yamada K, et al. Prognosis of small adenocarcinoma of the lung based on thin-section computed tomography and pathological preparations. J Comput Assist Tomogr. 2008;32(3):426–431.
33. Travis WD, Brambilla E, Noguchi M, et al. International Association for the Study of Lung Cancer/American Thoracic Society/European Respiratory Society: international multidisciplinary classification of lung adenocarcinoma: executive summary. Proc Am Thorac Soc. 2011;8(5):381–385.
34. Russell PA, Wainer Z, Wright GM, Daniels M, Conron M, Williams RA. Does lung adenocarcinoma subtype predict patient survival?: A clinicopathologic study based on the new International Association for the Study of Lung Cancer/American Thoracic Society/European Respiratory Society international multidisciplinary lung adenocarcinoma classification. J Thorac Oncol. 2011;6(9):1496–1504.
35. Warth A, Muley T, Meister M, et al. The novel histologic International Association for the Study of Lung Cancer/American Thoracic Society/European Respiratory Society classification system of lung adenocarcinoma is a stage-independent predictor of survival. J Clin Oncol. 2012;30(13):1438–1446.
36. Lee HY, Lee KS. Ground-glass opacity nodules: histopathology, imaging evaluation, and clinical implications. J Thorac Imaging. 2011;26(2):106–118.
37. Son JY, Lee HY, Lee KS, et al. Quantitative CT analysis of pulmonary ground-glass opacity nodules for the distinction of invasive adenocarcinoma from pre-invasive or minimally invasive adenocarcinoma. PLoS One. 2014;9(8):e104066.
38. Gao JW, Rizzo S, Ma LH, et al. Pulmonary ground-glass opacity: computed tomography features, histopathology and molecular pathology. Transl Lung Cancer Res. 2017;6(1):68–75.
39. Pinsky PF, Gierada DS, Black W, et al. Performance of Lung-RADS in the National Lung Screening Trial: a retrospective assessment. Ann Intern Med. 2015;162(7):485–491.
 © 2020 The Author(s). This work is published and licensed by Dove Medical Press Limited. The
full terms of this license are available at https://www.dovepress.com/terms
and incorporate the Creative Commons Attribution
- Non Commercial (unported, 3.0) License.
By accessing the work you hereby accept the Terms. Non-commercial uses of the work are permitted
without any further permission from Dove Medical Press Limited, provided the work is properly
attributed. For permission for commercial use of this work, please see paragraphs 4.2 and 5 of our Terms.
© 2020 The Author(s). This work is published and licensed by Dove Medical Press Limited. The
full terms of this license are available at https://www.dovepress.com/terms
and incorporate the Creative Commons Attribution
- Non Commercial (unported, 3.0) License.
By accessing the work you hereby accept the Terms. Non-commercial uses of the work are permitted
without any further permission from Dove Medical Press Limited, provided the work is properly
attributed. For permission for commercial use of this work, please see paragraphs 4.2 and 5 of our Terms.