")
Back to Journals » Diabetes, Metabolic Syndrome and Obesity » Volume 16
Multi-Tiered Assessment of Gene Expression Provides Evidence for Mechanisms That Underlie Risk for Type 2 Diabetes
Authors Asam K, Lewis KA , Kober K , Gong X, Kanaya AM, Aouizerat BE, Flowers E
Received 2 August 2023
Accepted for publication 25 October 2023
Published 31 October 2023 Volume 2023:16 Pages 3445—3457
DOI https://doi.org/10.2147/DMSO.S428572
Checked for plagiarism Yes
Review by Single anonymous peer review
Peer reviewer comments 3
Editor who approved publication: Prof. Dr. Juei-Tang Cheng
Kesava Asam,1 Kimberly A Lewis,2 Kord Kober,2,3 Xingyue Gong,2 Alka M Kanaya,4,5 Bradley E Aouizerat,1,6 Elena Flowers2,7
1Bluestone Center for Clinical Research, New York University, New York City, NY, USA; 2Department of Physiological Nursing, University of California, San Francisco, CA, USA; 3Bakar Computational Health Sciences Institute, University of California, San Francisco, CA, USA; 4Department of Epidemiology and Biostatistics, University of California, San Francisco, CA, USA; 5Department of Medicine, University of California, San Francisco, CA, USA; 6Department of Oral and Maxillofacial Surgery, New York University, New York City, NY, USA; 7Institute for Human Genetics, University of California, San Francisco, CA, USA
Correspondence: Elena Flowers, University of California, San Francisco, Department of Physiological Nursing, 2 Koret Way, #605L, San Francisco, CA, 94143-0610, USA, Tel + 1 415-476-0983, Email [email protected]
Introduction: Integrated transcriptome and microRNA differential gene expression (DEG) analyses may help to explain type 2 diabetes (T2D) pathogenesis in at-risk populations. The purpose of this study was to characterize DEG in banked biospecimens from underactive adult participants who responded to a randomized clinical trial measuring the effects of lifestyle interventions on T2D risk factors. DEGs were further examined within the context of annotated biological pathways.
Methods: Participants (n = 52) in a previously completed clinical trial that assessed a 12-week behavioural intervention for T2D risk reduction were included. Participants who showed > 6mg/dL decrease in fasting blood glucose were identified as responders. Gene expression was measured by RNASeq, and overrepresentation analysis within KEGG pathways and weighted gene correlation network analysis (WGCNA) were performed.
Results: No genes remained significantly differentially expressed after correction for multiple comparisons. One module derived by WGCNA related to body mass index was identified, which contained genes located in KEGG pathways related to known mechanisms underlying risk for T2D as well as pathways related to neurodegeneration and protein misfolding. A network analysis showed indirect connections between genes in this module and islet amyloid polypeptide (IAPP), which has previously been hypothesized as a mechanism for T2D.
Discussion: We validated prior studies that showed pathways related to metabolism, inflammation/immunity, and endocrine/hormone function are related to risk for T2D. We identified evidence for new potential mechanisms that include protein misfolding. Additional studies are needed to determine whether these are potential therapeutic targets to decrease risk for T2D.
Keywords: transcriptome, diabetes, fasting blood glucose, biomarkers, pathway analysis
Introduction
Type 2 diabetes (T2D) affects approximately 34 million Americans, and an additional 88 million are estimated to be at high risk of developing the disease. 1 T2D is a significant public health problem due to its increasing prevalence, chronic nature, economic burden, lifestyle-related risk factors, health disparities, long-term consequences, and the need for effective prevention strategies. 1 One of the primary challenges in preventing and treating T2D is its multifactorial etiology.2 Several genetic risk factors for T2D have been reported, however modifiable lifestyle and behavioural characteristics are also important risk factors.3,4 Recent studies have identified at least 4–5 T2D subtypes that differ in phenotypic characteristics, associated inflammatory biomarkers, and disease outcomes.5–8
The prevalence of different subtypes of T2D may have associations with genetic risk factors, but it is widely acknowledged that environmental factors, such as lifestyle and behavior, have a significant impact on the development of the condition.9 Behavioral interventions may not have the same effect across all subtypes due to these genetic and environmental variations.9 Biomarkers that capture the interplay between genes and the environment could be valuable in identifying individuals at risk for T2D and related conditions earlier, allowing for targeted prevention strategies and more effective behavioral interventions. Assessing the transcriptome, which represents the entire set of expressed genes at a given time, can offer insights into how an individual’s genetic makeup responds to environmental factors. The transcriptome is dynamic and can change over time in response to external influences, making it a potentially useful tool for evaluating the combined influence of genetic and environmental risk factors for T2D. By analyzing the transcriptomic profiles, researchers can not only study individual genes but also examine the coordinated activity of groups of genes involved in specific biological processes. These gene co-expression network analysis methods help identify biological pathways and their genetic signatures, which can aid in understanding the underlying mechanisms of the disease.10
The purpose of this study was to characterize the differential gene expression in biospecimens from underactive adults who participated in a 12-week behavioral intervention for T2D risk reduction in a previously completed randomized clinical trial. Differentially expressed genes were further examined within the context of annotated biological pathways. The goal of this research is to identify the specific genes and biological pathways that contribute to the risk of T2D based on the combination of their genetic characteristics within the context of extrinsic environmental factors.
Materials and Methods
Study Sample and Design
The study sample included a subset of participants from the previously completed Practicing Restorative Yoga versus Stretching for the Metabolic Syndrome (PRYSMS) clinical trial (clinicaltrials.gov identifier NCT01024816), which tested the effects of restorative yoga versus active stretching on fasting blood glucose (FBG) in overweight adults at risk for T2D.11 The trial showed that participants in the restorative yoga group had a 6mg/dL decrease in FBG compared to the stretching group. However, stretching did have a positive effect on FBG for some participants in the stretching group (n = 3; 30%), and therefore the study sample was combined to look at relationships between gene expression and biological pathways in individuals who were responsive to behavioral intervention overall. Participants in the PRYSMS study were recruited from the San Francisco and San Diego areas and met the International Diabetes Federation criteria for metabolic syndrome.12 The Institutional Review Board at the University of California, San Francisco approved the PRYSMS trial, and all participants provided informed consent in accordance with the Declaration of Helsinki. Only the subset of participants who provided consent to have biospecimens banked for future research were included in the study described in this manuscript. Additional inclusion criteria included availability of banked plasma specimens from the baseline study visit with availability of at least two additional follow-up timepoints (n = 52). Exclusion criteria from the PRYSMS trial are described in detail elsewhere.12 Briefly, participants were excluded if FBG was ≥126 mg/dl, HbA1c was ≥7.0%, fasting triglycerides were ≥300 mg/dl, weight was ≥400 pounds, participants had neurological conditions that limited their mobility, a hospitalization for coronary heart disease within the past 6 months, current pregnancy or lactation, history of bariatric surgery, substance abuse, and use of medications affecting metabolic factors.12 Participant demographics, lifestyle characteristics, and medical history were documented at baseline.
Clinical data were collected at baseline, 3-, 6-, 9-, and 12-months. Participant weight was measured on a standard balance beam scale and height using a stadiometer. Waist circumference was measured using a Gulick II tape spring-tension measure at the site of maximum circumference midway between the lower ribs and the anterior superior iliac spine. The mean of two waist circumference measurements was calculated. Body mass index (BMI) was calculated as weight in kilograms divided by height in meter squared.
FBG was measured using an automated analyser with an immobilized enzyme biosensor (YSI 2300 STAT Plus, YSI Life Sciences, Yellow Springs, OH). Total cholesterol, triglycerides and HDL-cholesterol were measured by enzymatic calorimetric methods (Quest Diagnostics, San Jose, CA), and LDL-cholesterol was calculated using the Friedewald equation.13 Blood used for banking of plasma was collected by venipuncture into vacutainers containing the preservative EDTA, centrifuged at 4°C to separate plasma from cellular blood components, and stored at −80°C.
For the current analysis and as we have done previously, participants were defined as “responders” or “non-responders”.14 Participants with at least a 6mg/dL decrease in FBG after 12-months were classified as responders, while participants with <6mg/dL change in FBG at 12 months were classified as non-responders. The approximate physiologic range in FBG for ambulatory adults without type 2 diabetes is 50–126 mg/dL. The mean change in FBG in the intervention group in the PRYSMS trial was 6 mg/dL, which represents an 8% change within this approximate physiologic range. As evidenced by the landmark Diabetes Prevention Program trial, which also identified a 6 mg/dL decrease in FBG, this magnitude of change is clinically meaningful for decreasing incidence of T2D.6
Molecular Data Collection
Blood was collected in PAXgene vacutainers containing reagents to lyse cells and stabilize RNA molecules according to standard protocol (Qiagen, Hilden, Germany). Vacutainers were stored at −80°C.
RNA Extraction
RNA isolation was completed using the PAXgene blood RNAeasy kit according to standard protocol (Qiagen, Hilden, Germany). The quantity of RNA was checked by Nanodrop (Thermo Fisher). The integrity of total RNA will be checked on Fragment Analyzer (Agilent, Cat. No. DNF-472), only RNA with RQN number of above 6 was used for library construction.
Library Preparation
A starting quantity of 100ng of total RNA was used according to vendor instructions with Universal plus mRNA with Nu Quant (TECAN, Cat. No. 0520), and the final library PCR amplification was >17 cycles. After library completion, individual libraries were pooled equally by volume and quantified using Fragment Analyzer (Agilent, Cat. No. DNF-474).
RNAseq
Quantified library pools were diluted to 1nM, loaded onto a flow cell (Illumina, Cat. No. FC-420-1001) and sequenced on an Illumina MiniSeq to check for quality of reads. Individual libraries were normalized according to MiniSeq output reads, specifically by the percentage of reads mapping to protein coding genes, loaded onto a flow cell (Illumina, Cat. No. 20028313) and sequenced in four lanes of an Illumina NovaSeq6000.
Statistical Analysis
Descriptive statistics were calculated to examine and evaluate the demographic and clinical characteristics of participants. Comparisons between the baseline characteristics and clinical characteristics of responders and non-responders were assessed using independent groups Student’s t-test for continuous variables and chi-squared tests for categorical variables (R, 2019).
Data Preprocessing
PRSYMS RNA seq Fastq files were transferred to the New York University Greene high performance computational cluster. The fastq files were assessed for quality, and adapters were removed using Fastp (version 0.20.1). The cleaned sequences were mapped to the human genome (build 102) using HISAT2 (version 2.2.1) resulting in Sequence Alignment Map (SAM) files. SAM files were converted into BAM (Binary Alignment Map) files, which were then assembled into transcripts using StringTie (version 2.1.4). A gene count matrix was created using the transcript results and PrepDE python script.
Differential Gene Expression Analysis
Differential expression analysis was performed using the Deseq2 R package (version 1.32) for the responder variable to assess for differences in gene expression between responders vs non-responders. Gene counts generated in an earlier data pre-processing step and the responder phenotypes were converted into Deseq2 objects. Genes that could be annotated to an Entrez ID and with a minimum 10 counts in ≥90% of the sample were retained for the analysis. Using the surrogate variable analysis (SVA) package (version 3.40), batch correction was performed to identify variation not attributed to the phenotype or covariates (a total of 12 surrogate variables were identified and included in the final Deseq2 models). Differentially expressed genes were identified using the filtered SVA-corrected expression set. Genes that had an unadjusted p-value <0.05 were considered significant. The Deseq2 package calculates p-values using the Wald test and adjustment for multiple comparisons was done using the Benjamini-Hochberg false discovery rate method.15
We used two publicly available datasets to perform validation of the differentially expressed transcripts identified in this study. The first (GSE193436) was sequenced on an Illumina HighSeq 4000 using standard Illumina protocols and filtration.16 SRA files were downloaded and converted to FASTQ using fasterq-dump (version: 3.0.5) after which the same differential gene expression analysis as described above was applied. This study sample included overweight individuals with (n = 6) and without (n = 6) T2D recruited in China. The second dataset (GSE101931) used the Illumina HumanHT-12 V4.0 expression bead chip array.17 Log2 normalization and probes that had a median expression in at least 90% of samples were retained. SVA was performed (version 3.40) and included in the subsequent analysis. Differential expression of the filtered normalized data was performed using Limma (version 3.54.0). This study sample included Black individuals, overweight and obese individuals with prediabetes (n = 5) and controls (n = 5) recruited in the US.
Pathway Analysis
Over-representation analysis was performed for the SVA corrected differentially expressed genes using clusterprofiler packages (version 4.0.5) and the Kyoto Encyclopedia of Genes and Genomes (KEGG) database. Genes that had an unadjusted p-value <0.05 were considered significant. The background signal was defined as all filtered and annotated genes. Dotplot and Gene-Concept network plots were generated using Clusterprofiler.
Weighted Gene Co-Expression Network Analysis
SVA-corrected normalized RNAseq counts were used as the input variables. Standard deviations across the participants for all the genes were calculated. WGCNA (version 1.71) was performed on the genes that had a standard deviation ≥0.3. Modules significantly associated with phenotypes of interest (ie, responder and body mass index (BMI)) were retained. Significant genes were used to perform over representation analysis using clusterprofiler (version 4.0.5) and pathway annotation using the Kyoto Encyclopedia of Genes and Genomes (KEGG) database.18 Genes that had an unadjusted p-value <0.05 were considered significant. The background signal was defined as all filtered and annotated genes. To identify potential mechanistic interactions between the genes selected for this module, protein–protein interactions were evaluated using STRINGdb (version 2.10.0 R package). Interactions were filtered to include human protein–protein interactions with direct connections.
Pathway Network Analysis
Ingenuity Pathway Analysis (IPA) path explorer (version 01–21-03) was used to identify direct and indirect interactions, in any direction, between genes, proteins, and their products (eg, enzymes, transcription factors, peptidases, etc.) that were identified in the differential expression analysis to be overrepresented in KEGG pathways (p < 0.05). (QIAGEN Inc., https://www.qiagenbioinformatics.com/products/ingenuity- pathway-analysis) Filters in the Ingenuity expert information tool included mammalian, non-chemical, and non-miR interactions.
Results
Participant Characteristics
A total of 52 participants from the PRYSMS trial had complete gene expression data and were included in this study. Participant characteristics are shown in Table 1. Overall, the mean age of the sample was 54 ± 7 years, participants primarily identified as female (70%, n = 36) and White race (73%, n = 38), and were overweight (BMI 35.5 ± 6.8 kg/m2). The only significant difference between the groups was the baseline FBG, which was higher in the responders (n = 10; 112 ± 9 mg/dL) compared to non-responders (n = 42; 100 ± 10 mg/dL) (p < 0.05). Because both groups fall in the prediabetes range, this was not considered a covariate in subsequent analyses.
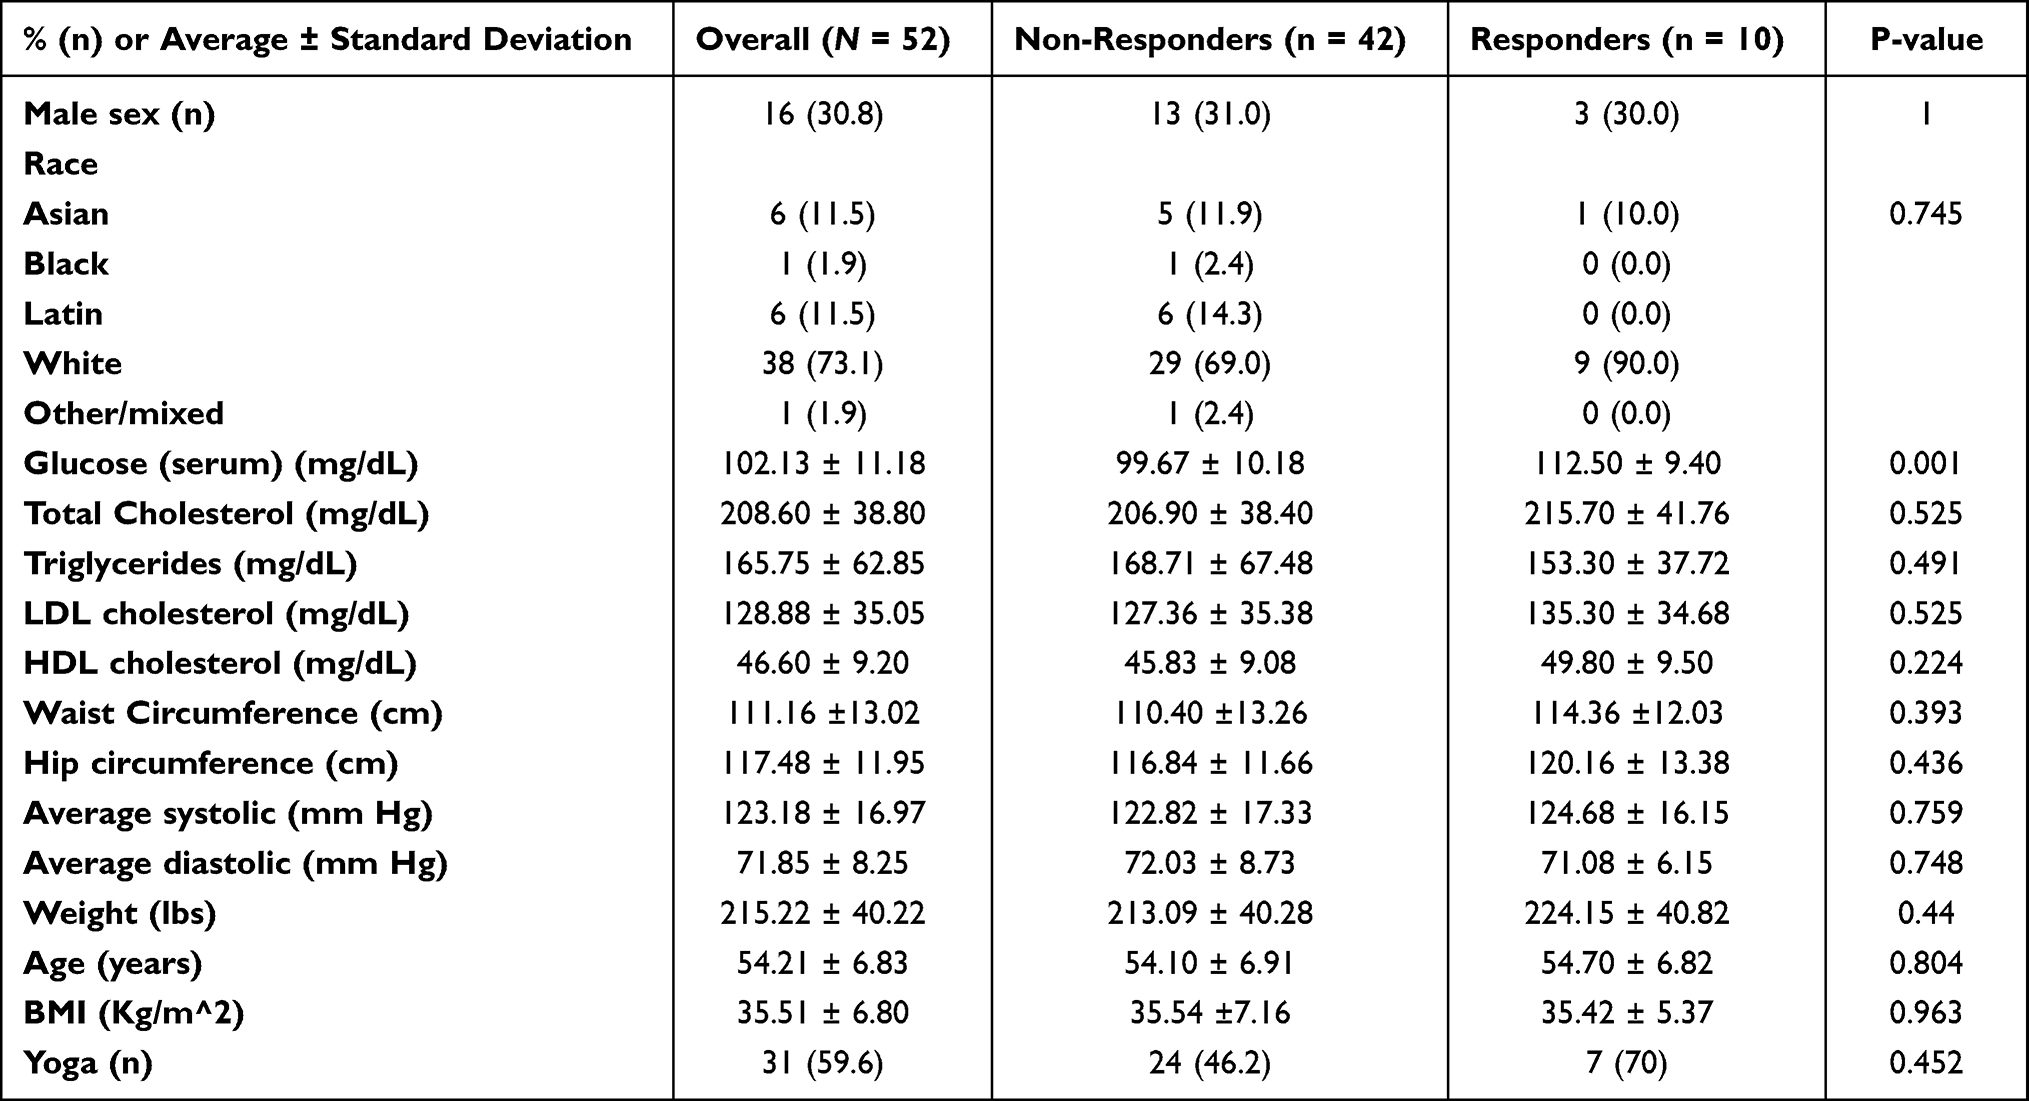 |
Table 1 Demographic and Clinical Characteristics by Group |
 |
Table 2 KEGG Pathway Themes |
Gene Expression
Of a total of 60,675 annotated genes, 17,294 met the quality control thresholds of having ≥10 reads in at least 90% (n = 47) of the sample. There were 570 transcripts that were differentially expressed in responders compared to non-responders (p<0.05)), however none of these remained significant after adjustment for multiple comparisons (q < 0.05) (Supplemental Table 1). The expression of the 10 transcripts with the highest magnitude difference in expression levels between responders and non-responders is shown in Figure 1 (Panel A). While not statistically significant in this sample, Panel B in Figure 1 shows the distribution of gene counts between the responders and non-responders with clear differences between the median values. We then leveraged publicly available external datasets to assess for differential expression of genes that were significant prior to adjustment for multiple comparisons and found that, excluding duplicate probes on the array, were 99 transcripts validated by the external dataset that also used RNAseq methods, and 20 transcripts were further validated in the external dataset that used array-based methods (Supplemental Table 2).
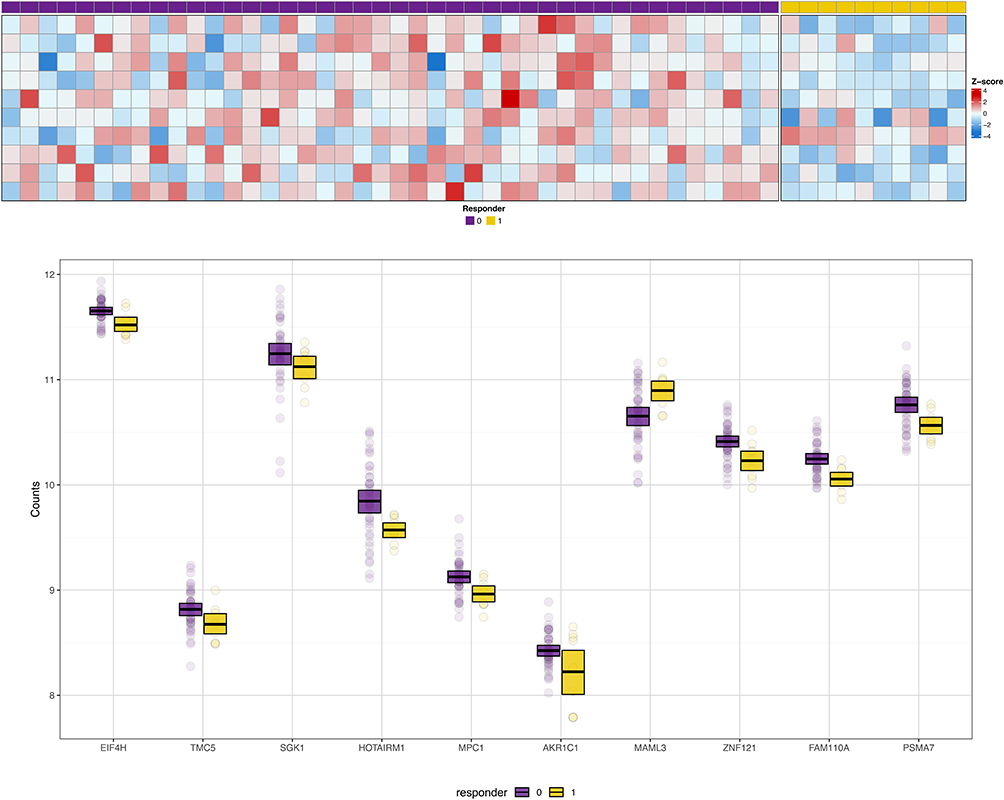 |
Figure 1 Panel A shows the heat map for the 10 transcripts that showed the highest magnitude fold-change between responders and non-responders. Individual participants are represented by columns; those indicated by purple boxes are the non-responders; those indicated by yellow boxes are the responders. Rows represent individual gene transcripts. Intensity of the colors blue or red indicates the magnitude of the z-score for fold-change. Panel B shows box and whisker plots for the distribution of gene counts for the 10 transcripts with the greatest magnitude differential expression between responders and non-responders. The center thick black bar shows the median, the upper and lower borders of the boxes represent the 75th and 25th percentiles, and individual dots are outliers. Non-responders are shown in purple; responders are shown in yellow. |
We also identified transcripts for 33 microRNAs and found three that were significantly differentially expressed in responders compared to non-responders (ie, miR-181, miR-3667, miR-378; p < 0.05); however, none of these remained significant after adjustment for multiple comparisons (q < 0.05).
Pathway Analysis
We identified KEGG pathways that contained over-representation of genes that were differentially expressed between responders and non-responders to behavioral interventions (p < 0.05). The top 10 pathways are shown in Figure 2. In the WGCNA of the responder versus non-responder groups, no significant modules were identified. Because overweight and obesity are significant risk factors for T2D, we also evaluated BMI to include in the WGCNA analysis. For BMI, one significant module was identified (r = 0.35, p < 0.05), containing 99 genes. In an over-representation analysis, 64 KEGG pathways were identified to contain at least one of the 99 genes within this module (top 10 shown in Figure 3). Of the 99 genes in this module, 79 were annotated in the StringDB protein interaction database.19 A greater number of interactions between these gene products were observed (ie, 427) than expected (ie, 108; p < 0.0001). Among the observed interactions, immune function was a common theme.
 |
Figure 2 The top 10 pathways that contained over-representation of the differentially expressed transcripts related to responders versus non-responders to behavioral interventions are shown. The size of the dot represents the number of transcripts within the pathway that were over-represented relative to the total number of transcripts included in the analyses. The color of the dot shows the magnitude of the false discovery rate-adjusted p-value. |
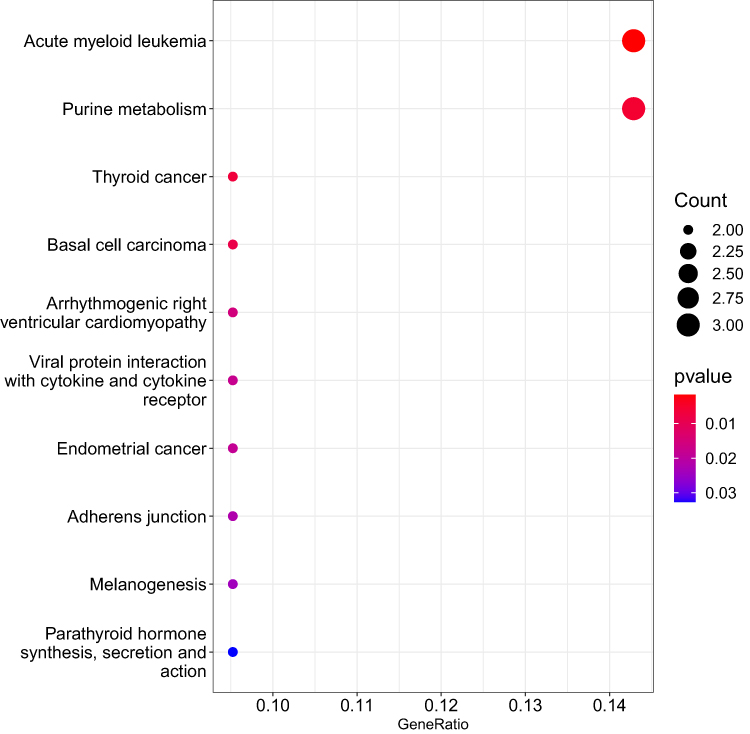 |
Figure 3 The top 10 pathways that contained over-representation of the differentially expressed transcripts contained within the module derived from weighted gene correlation network analysis for body mass index are shown. The size of the dot represents the number of transcripts within the pathway that were over-represented relative to the total number of transcripts included in the analyses. The color of the dot shows the magnitude of the false discovery rate-adjusted p-value. |
Discussion
The purpose of this study was to assess for differential expression of genes between individuals who did versus did not respond to behavioral interventions to decrease risk for T2D. T2D is a complex condition that occurs as a result of numerous underlying mechanisms, which can vary between subgroups of individuals, as previously described.5 The potential applications of this research are improved understanding of the specific mechanisms underlying risk for T2D for these subgroups of individuals, which can then inform optimal treatment strategies. This analysis identified 570 transcripts that were differentially expressed between study participants at risk for T2D who responded versus those who did not respond to the interventions. In order to more accurately assess the complex coordinated biological activity that underlies the development of risk for T2D, building on the initial analysis of differentially expressed single genes, we also determined annotated biological pathways that contained the genes observed to be differentially expressed. Previously observed biological pathways were validated, and new pathways were identified.
Among the top ten KEGG pathways targeted by differentially expressed genes (Figure 2), there is a primary theme of neurodegeneration and protein-misfolding disorders, including Huntington's disease, amyotrophic lateral sclerosis, prion disease, and Parkinson’s disease pathways. The nervous system relies on a delicate balance of chemical factors, and the T2D risk factors collectively known as metabolic syndrome can disrupt this balance, linking nervous system damage and neurodegenerative disorders to T2D risk.20 The mechanism of this linkage is complex, including endothelial damage, inflammation, and impaired autophagy.20 Chronic physiological stress-related hormones and inflammation can impede autophagy, and thus stress-reducing lifestyle interventions may enhance autophagy and reduce inflammation.21,22 Individuals in our sample who responded to stress-reducing lifestyle interventions with decreased FBG may have more resilient nervous system pathways that maintain sufficient autophagy and mitigate inflammation to preserve function. As with most compensatory mechanisms, time of exposure may affect cells’ resiliency. Because of the gradual nature of T2D risk onset, it is difficult to precisely measure the duration of time that individuals in our study have been exposed to the biochemical environment that increases risk to the nervous system cells; thus, we are not able to control for exposure time in our sample.
Individuals diagnosed with Huntington’s disease have seven times greater risk for T2D,23 and individuals with T2D are at greater risk for Parkinson’s disease.24 In contrast, individuals with T2D are at decreased risk for amyotrophic lateral sclerosis.25 As with these neurodegenerative conditions, T2D has been characterized as a protein misfolding condition when accumulation of the islet amyloid polypeptide (IAPP) hormone results in pancreatic β-cell loss and disease progression.26 Polymorphisms in the IAPP gene cause increased amyloid formation of this protein in the pancreas that begins to accumulate before clinically detectable disease and is associated with early onset T2D.26 Preliminary evidence has suggested the possibility that T2D may be transmitted as an infectious disease via the IAPP protein in the same manner that prions are the vector for transmission of bovine spongiform encephalopathy (ie, mad cow disease).26 Prion diseases in humans are most often developed sporadically, but they may also be genetic or acquired via prion-infected tissue (eg, blood transfusions, grafts, human-derived hormones, or rarely from ingesting infected animals), or contaminated surgical instruments.27 This line of inquiry about a prion-based T2D transmission needs extensive development beyond the current state of evidence, but if true, it may mean that responders to behavioral interventions have an enhanced ability to reject infectious prions, that the prions are dormant or present in smaller amounts that are not yet impacting function, or that responders may be experiencing a different mechanism of T2D risk than the non-responders (ie, prion exposure-related dysfunction vs non-prion-related dysfunction).
While this study did not directly measure IAPP expression, our network analysis (Figure 4) indicated that signal transducer and activator of transcription 3 (STAT3), farnesyl-diphosphate farnesyltransferase 1 (FDFT1), and cytochrome P450 family 51 subfamily A member 1 (CYP51A1), which were differentially expressed between responders and non-responders in this dataset (p < 0.05; q >0.05), or their products, have indirect connections to IAPP. Stat3 has been described as a key mediator in the injury responses in islets transgenic for human IAPP and from individuals with T2D.28 Further, Stat3 activates cytokine signaling-3 (Socs3), an inhibitor of leptin signaling in the brain, with greater time-sensitive activity in the evening before and during T2D observed in mouse models.29 In another mouse model study, high levels of Stat3 led to hyperglycemia, hyperlipidemia, and decreased liver glycogen.30
 |
Figure 4 Solid lines show direct interactions. Dashed lines show indirect interactions. Arrows show activation. Blunted lines show inhibition. Vertical diamonds are enzymes. Horizontal diamonds are peptidases. Vertical ovals are transmembrane receptors. Horizontal ovals are transcription regulators. Circles are other. Double circles are complexes. Vertical rectangles are G-protein coupled receptors. Squares are cytokines. Trapezoids are transporters. Inverted triangles are kinases. Molecules outlined in purple are gene transcripts or their products that were located in the top 10 Kyoto Encyclopedia of Genes and Genomes (KEGG) pathways that contained overrepresented genes from differential expression analysis. |
High glucose levels led to the upregulation of FDFT1 in a rat model for diabetes, which contributed to altered β-cell differentiation.31 Both FDFT1 and CYP51A1 are related to BMI and T2D via increased intracellular cholesterol biosynthesis.32,33 CYP51A1 may be involved in neurodegenerative disorders by interacting with the Sigma 1 receptor on the endoplasmic reticulum membrane, which under physiological stress may lead to protein misfolding and accumulation.34 Although STAT3, FDFT1, and CYP51A1 are associated with T2D pathology, IAPP, and neurodegenerative diseases, potential mechanisms that connect these pathways are undefined.
In our previous work, we described the KEGG pathways targeted by microRNAs associated with risk for T2D in this same study sample.35 Table 2 compares those previous results to the findings from the current study. The identified pathways were sorted into themes based on function, including metabolism/inflammation and endocrine/hormone. The study described in this paper aligns with our previous findings in that there were similar inflammation-related pathways identified (ie, coronavirus disease – COVID-19, Chemical carcinogenesis – reactive oxygen species, phagosome). Inflammation is widely known to contribute to, and result from, T2D,36 which is consistent with the recurrent theme of inflammation-related pathways being targeted by differentially expressed genes in individuals at risk for T2D. Our findings suggest that responders to a stress-reducing lifestyle intervention may better attenuate inflammation than non-responders, thus improving glycemic control.37 Additional studies are needed to further refine the evidence about the specific inflammatory pathways and to determine whether modification of the expression of inflammatory genes and consequential perturbation of biological pathways may impact risk for T2D. Administration of synthetic microRNAs or antagomiRs has the potential to modify the expression of individual genes, which may be useful for prevention or therapeutic interventions.
The theme of inflammatory pathway involvement is repeated in our findings from the WGCNA module associated with BMI, along with the addition of immune function pathways. KEGG pathways targeted by genes in the WGCNA module associated with BMI (Figure 3) include viral protein interaction with cytokine and cytokine receptor and melanogenesis. Another common theme for pathways containing overrepresentation of genes in the BMI module is related to immune function, including acute myeloid leukemia, thyroid cancer, basal cell carcinoma, and endometrial cancer. Validating our prior observation that pathways related to endocrine/hormone activity are associated with risk for T2D (Table 2), parathyroid hormone synthesis, secretion and action was one of the top KEGG pathways containing genes within the module associated with BMI. There are two genes from the module associated with BMI that are present in seven of the top ten KEGG pathways. These include lymphoid enhancer-binding factor 1 (LEF1) and transcription factor 7 (TCF7). Both of these genes are involved in innate immune activity. One prior study found that polymorphisms in TCF7 are associated with increased prevalence of metabolic syndrome in a sample of individuals living in Pakistan.38 Further studies are needed to determine whether, similar to inflammatory pathways, there may be immunity-related genes that could be targeted by synthetic microRNAs or antagomiRs to decrease risk for T2D and enhance response to lifestyle interventions.
This was a secondary analysis of a previously completed clinical trial to test the effect of behavioral stress reduction interventions on risk factors for T2D. The characteristics of this subset of the overall trial sample did not differ from the overall sample (data not shown). The study sample was predominantly female and White, which is not representative of the overall United States population. The extent to which these findings can be generalized to other sex or gender and racial or ethnic groups is not known. Prior studies have conflated race and ethnicity with genetic ancestry, which may be one explanation for discrepant findings. Our own prior study highlighted that findings from gene expression studies were inconsistently validated when analyzed by sex or gender and racial or ethnic group.39 Future studies warrant the characterization of genetic ancestry associated with genetic polymorphisms that may impact gene expression in a manner that is distinct from the social construct of race and ethnicity.
Not all participants agreed to storage of biospecimens, and among those who did, not all participants had sufficient biospecimens for inclusion in this study, which resulted in a relatively small sample size that may have impacted the power to detect statistical differences in gene expression. However, as shown in Figure 1 (Panel B), there is a distinct difference in the distribution of the gene counts between the responders and non-responders. This limitation was mitigated by the approach of evaluating biological pathways and networks in addition to single-gene transcripts. Furthermore, we were able to validate our findings using external datasets, even relatively small sample sizes (n = 10, n = 10) that included related but not identical phenotypes.
The purpose of this study was to identify genes and pathways associated with responses to behavioral interventions to decrease risk for T2D. Because single genes are numerous and, individually, capture only a fragment of overall physiological function, there may be limitations to how much information can be gleaned from gene-level assessment, particularly in the setting of a relatively small sample size. Assessment of a higher order of biology, through evaluation of over-representation of differentially expressed genes within annotated biological pathways, may overcome these limitations. Validating prior studies, we identified inflammation, immune function, and metabolic function and common themes for pathways that contained differentially expressed genes in this sample. We also identified a strong theme of neurodegenerative and protein misfolding disease; a small number of recent studies have also characterized T2D as a protein misfolding condition. Additional studies are needed to determine if modulation of expression of genes within these pathways by synthetic microRNAs or antagomiRs could impact risk for T2D and responses to risk-reduction interventions. In addition, further studies are needed to determine whether the observed themes are generalizable to a population with more diverse biological and social characteristics.
Data Sharing Statement
The data supporting this analysis are from previously reported studies and datasets, which have been cited. The processed data are available from the corresponding author upon request.
Acknowledgments
The abstract of this paper was presented at the Western Institute of Nursing’s 56th Annual Communicating Nursing Research Conference as a podium presentation with interim findings. The poster’s abstract was published in “Abstracts of Symposium Presentations” in Communicating Nursing Research Conference Proceedings Journal, “Physiological and Biological Measures, Leveraging Technology to Advance Nursing and Equity in Research, Practice, and Education”, 56: 139. Available from https://www.winursing.org/communicating-nursing-research
Funding
Dr Flowers was supported by the National Center for Advancing Translational Sciences of the National Institutes of Health grant number KL2TR000143 and the Hellman Family Foundation. The PRYSMS study was supported by the National Center for Complementary and Alternative Medicine of the National Institutes of Health grant number R01AT004569. Molecular data collection from the PRYSMS study was supported by the National Institutes of Diabetes, Digestive, and Kidney Disease of the National Institutes of Health grant numbers R21DK117346 and P30DK098722. Dr Kanaya is supported by the National Heart Lung, and Blood Institute of the National Institutes of Health grant number 2K24HL112827. Dr Lewis is supported by the Larry L. Hillblom Foundation Fellowship award number 2022-D-011-FEL.
Disclosure
The authors declare that there is no conflict of interest regarding the publication of this paper.
References
1. National Diabetes Statistics Report. 2017, Centers for Disease Control and Prevention, U.S. Department of Health and Human Services: Atlanta, GA.
2. Manolio TA, Collins FS, Cox NJ, et al. Finding the missing heritability of complex diseases. Nature. 2009;461(7265):747–753. doi:10.1038/nature08494
3. Xue A, Wu Y, Zhu Z, et al. Genome-wide association analyses identify 143 risk variants and putative regulatory mechanisms for type 2 diabetes. Nat Commun. 2018;9(1):2941. doi:10.1038/s41467-018-04951-w
4. Bagchi D. Nutritional and Therapeutic Interventions for Diabetes and Metabolic Syndrome.
5. Ahlqvist E, Storm P, Käräjämäki A, et al. Novel subgroups of adult-onset diabetes and their association with outcomes: a data-driven cluster analysis of six variables. Lancet Diabetes Endocrinol. 2018;6(5):361–369. doi:10.1016/S2213-8587(18)30051-2
6. Zou X, Zhou X, Zhu Z, et al. Novel subgroups of patients with adult-onset diabetes in Chinese and US populations. Lancet Diabetes Endocrinol. 2019;7(1):9–11. doi:10.1016/S2213-8587(18)30316-4
7. Anjana RM, Baskar V, Nair ATN, et al. Novel subgroups of type 2 diabetes and their association with microvascular outcomes in an Asian Indian population: a data-driven cluster analysis: the INSPIRED study. BMJ Open Diabetes Res Care. 2020;8(1):e001506. doi:10.1136/bmjdrc-2020-001506
8. Herder C, Maalmi H, Strassburger K, et al. Differences in biomarkers of inflammation between novel subgroups of recent-onset diabetes. Diabetes. 2021;70(5):1198–1208. doi:10.2337/db20-1054
9. Hill-Briggs F, Adler NE, Berkowitz SA, et al. Social determinants of health and diabetes: a scientific review. Diabetes Care. 2020;44:258–279. doi:10.2337/dci20-0053
10. Shao H, Zhang Y, Liu Y, et al. Establishment and verification of a gene signature for diagnosing type 2 diabetics by WGCNA, LASSO analysis, and in vitro experiments. Biomed Res Int. 2022;2022:4446342. doi:10.1155/2022/4446342
11. Kanaya AM, Araneta MRG, Pawlowsky SB, et al. Restorative yoga and metabolic risk factors: the practicing restorative yoga vs. stretching for the metabolic syndrome (PRYSMS) randomized trial. J Diabetes Complications. 2014;28(3):406–412. doi:10.1016/j.jdiacomp.2013.12.001
12. Alberti KG, Eckel RH, Grundy SM, et al. Harmonizing the metabolic syndrome: a joint interim statement of the International Diabetes Federation Task Force on Epidemiology and Prevention; National Heart, Lung, and Blood Institute; American Heart Association; World Heart Federation; International Atherosclerosis Society; and international association for the Study of Obesity. Circulation. 2009;120(16):1640–1645. doi:10.1161/CIRCULATIONAHA.109.192644
13. Friedewald WT, Levy RI, Fredrickson DS. Estimation of the concentration of low-density lipoprotein cholesterol in plasma, without use of the preparative ultracentrifuge. Clin Chem. 1972;18(6):499–502. doi:10.1093/clinchem/18.6.499
14. Flowers E, Kanaya AM, Fukuoka Y, et al. Preliminary evidence supports circulating microRNAs as prognostic biomarkers for type 2 diabetes. Obes Sci Pract. 2017;3(4):446–452. doi:10.1002/osp4.134
15. Benjamini Y, Hochberg Y. Controlling the false discovery rate: a practical and powerful approach to multiple testing. J Royal Statistical Society. 1995;57(1):289–300.
16. Yan S, Yao N, Li X, et al. The association between the differential expression of lncRNA and type 2 diabetes mellitus in people with hypertriglyceridemia. Int J Mol Sci. 2023;24(5):56.
17. Berry NT, Hubal M, Wideman L. The effects of an acute exercise bout on GH and IGF-1 in prediabetic and healthy African Americans: a pilot study investigating gene expression. PLoS One. 2018;13(1):e0191331. doi:10.1371/journal.pone.0191331
18. Kanehisa M, Goto S. KEGG: Kyoto encyclopedia of genes and genomes. Nucleic Acids Res. 2000;28(1):27–30. doi:10.1093/nar/28.1.27
19. Szklarczyk D, Gable AL, Nastou KC, et al. The STRING database in 2021: customizable protein-protein networks, and functional characterization of user-uploaded gene/measurement sets. Nucleic Acids Res. 2021;49(D1):D605–D612. doi:10.1093/nar/gkaa1074
20. Maiuolo J, Gliozzi M, Musolino V, et al. From metabolic syndrome to neurological diseases: role of autophagy. Front Cell Dev Biol. 2021;9:651021. doi:10.3389/fcell.2021.651021
21. Doherty J, Baehrecke EH. Life, death and autophagy. Nat Cell Biol. 2018;20(10):1110–1117. doi:10.1038/s41556-018-0201-5
22. Zhu Z, Yu R, Yang C, et al. Stress-related hormone reduces autophagy through the regulation of phosphatidylethanolamine in breast cancer cells. Ann Transl Med. 2021;9(2):149. doi:10.21037/atm-20-8176
23. Farrer LA. Diabetes mellitus in Huntington disease. Clin Genet. 1985;27(1):62–67. doi:10.1111/j.1399-0004.1985.tb00185.x
24. Hassan A, Sharma Kandel R, Mishra R, et al. Diabetes mellitus and Parkinson’s disease: shared pathophysiological links and possible therapeutic implications. Cureus. 2020;12(8):e9853. doi:10.7759/cureus.9853
25. Vasta R, D’Ovidio F, Logroscino G, et al. The links between diabetes mellitus and amyotrophic lateral sclerosis. Neurol Sci. 2021;42(4):1377–1387. doi:10.1007/s10072-021-05099-0
26. Mukherjee A, Soto C. Prion-like protein aggregates and type 2 diabetes. Cold Spring Harb Perspect Med. 2017;7(5):a024315. doi:10.1101/cshperspect.a024315
27. Sigurdson CJ, Bartz JC, Glatzel M. Cellular and molecular mechanisms of prion disease. Annu Rev Pathol. 2019;14(1):497–516. doi:10.1146/annurev-pathmechdis-012418-013109
28. Blencowe M, Furterer A, Wang Q, et al. IAPP-induced beta cell stress recapitulates the islet transcriptome in type 2 diabetes. Diabetologia. 2022;65(1):173–187. doi:10.1007/s00125-021-05569-2
29. Nie T, Zhang S, Vazhoor Amarsingh G, et al. Altered metabolic gene expression in the brain of a triprolyl-human amylin transgenic mouse model of type 2 diabetes. Sci Rep. 2019;9(1):14588. doi:10.1038/s41598-019-51088-x
30. Xu L, Li Y, Yin L, et al. miR-125a-5p ameliorates hepatic glycolipid metabolism disorder in type 2 diabetes mellitus through targeting of STAT3. Theranostics. 2018;8(20):5593–5609. doi:10.7150/thno.27425
31. Bensellam M, Jonas JC, Laybutt DR. Mechanisms of beta-cell dedifferentiation in diabetes: recent findings and future research directions. J Endocrinol. 2018;236(2):R109–R143. doi:10.1530/JOE-17-0516
32. Ding J, Reynolds LM, Zeller T, et al. Alterations of a cellular cholesterol metabolism network are a molecular feature of obesity-related type 2 diabetes and cardiovascular disease. Diabetes. 2015;64(10):3464–3474. doi:10.2337/db14-1314
33. Diamanti K, Cavalli M, Pereira MJ, et al. Organ-specific metabolic pathways distinguish prediabetes, type 2 diabetes, and normal tissues. Cell Rep Med. 2022;3(10):100763. doi:10.1016/j.xcrm.2022.100763
34. Penke B, Fulop L, Szucs M, et al. The role of sigma-1 receptor, an intracellular chaperone in neurodegenerative diseases. Curr Neuropharmacol. 2018;16(1):97–116. doi:10.2174/1570159X15666170529104323
35. Flowers E, et al. Coexpressed microRNAs, target genes and pathways related to metabolism, inflammation and endocrine function in individuals at risk for type 2 diabetes. Mol Med Rep. 2022;25(5). doi:10.3892/mmr.2022.12672
36. Donath MY, Shoelson SE. Type 2 diabetes as an inflammatory disease. Nat Rev Immunol. 2011;11(2):98–107.
37. Tsalamandris S, Antonopoulos AS, Oikonomou E, et al. The role of inflammation in diabetes: current concepts and future perspectives. Eur Cardiol. 2019;14(1):50–59. doi:10.15420/ecr.2018.33.1
38. Zafar U, Khaliq S, Ali Z, et al. TCF7-L2 rs7903146 polymorphism in metabolic syndrome with and without acute coronary syndrome. J Pak Med Assoc. 2020;70(10):1774–1778. doi:10.5455/JPMA.45480
39. Flowers E, Kanaya AM, Zhang L, et al. The role of racial and ethnic factors in microRNA expression and risk for type 2 diabetes. Front Genet. 2022;13:853633. doi:10.3389/fgene.2022.853633
 © 2023 The Author(s). This work is published and licensed by Dove Medical Press Limited. The full terms of this license are available at https://www.dovepress.com/terms.php and incorporate the Creative Commons Attribution - Non Commercial (unported, v3.0) License.
By accessing the work you hereby accept the Terms. Non-commercial uses of the work are permitted without any further permission from Dove Medical Press Limited, provided the work is properly attributed. For permission for commercial use of this work, please see paragraphs 4.2 and 5 of our Terms.
© 2023 The Author(s). This work is published and licensed by Dove Medical Press Limited. The full terms of this license are available at https://www.dovepress.com/terms.php and incorporate the Creative Commons Attribution - Non Commercial (unported, v3.0) License.
By accessing the work you hereby accept the Terms. Non-commercial uses of the work are permitted without any further permission from Dove Medical Press Limited, provided the work is properly attributed. For permission for commercial use of this work, please see paragraphs 4.2 and 5 of our Terms.