Back to Journals » Journal of Pain Research » Volume 19
Multi-Patient Analysis of Steroid-Induced Hyperglycemia in Diabetic Patients Using Continuous Glucose Monitoring
Authors Birthi P, Pattabiraman M, Ramaswamy A, Kumar M, Agrawal A, Dua A, Nalamachu SR ![]() , Chandra S
, Chandra S ![]()
Received 21 September 2025
Accepted for publication 6 February 2026
Published 20 March 2026 Volume 2026:19 569171
DOI https://doi.org/10.2147/JPR.S569171
Checked for plagiarism Yes
Review by Single anonymous peer review
Peer reviewer comments 2
Editor who approved publication: Professor Michael Überall
Pravardhan Birthi,1,2 Mahesh Pattabiraman,1 Akila Ramaswamy,1 Mritunjay Kumar,2 Akshay Agrawal,3 Anterpreet Dua,4 Srinivas R Nalamachu,5 Surabhi Chandra6
1Clinical Research Division, Tri City Research Center, Grand Island, NE, USA; 2Grand Island Pain Relief Center, Grand Island, NE, USA; 3Bryan Health, Grand Island, NE, USA; 4Department of Anesthesiology and Perioperative Medicine, Augusta University, Medical College of Georgia, Augusta, GA, 30912, USA; 5Analgesic Clinical Research, LLC, Overland Park, KS, USA; 6University of Nebraska Kearney, Kearney, NE, USA
Correspondence: Mahesh Pattabiraman, Clinical Research Division, Tri City Research Center, Grand Island, NE, USA, Tel +308 240 1215, Email [email protected]
Introduction: Steroid-induced hyperglycemia (SIH) is a frequent complication of glucocorticoid therapy, yet most prior studies have relied on sparse glucose measurements that limit understanding of timing and trajectory. Continuous glucose monitoring (CGM) offers high-resolution insights into these fluctuations with continuous temporal resolution that enables identification of transient and delayed glycemic responses.
Methods: In this prospective, single-arm observational study, CGM data were analyzed from 58 adults with diabetes who received a single standard-of-care steroid injection for interventional pain management. Participants received dexamethasone (n=38), methylprednisolone (n=15), or triamcinolone (n=5). Dexcom G7 CGM recorded glucose every 5 minutes for up to 10 days post-injection. Glucose trajectories were summarized and stratified by steroid type, gender, and age (< 64.6 vs ≥ 64.6 years).
Results: Across steroid types, glucose increased within ~2 hours after injection. Dexamethasone produced the most consistent excursion, peaking at ~220– 225 mg/dL and returning toward baseline by 24– 36 hours. Methylprednisolone showed a more moderate delayed increase (~175– 185 mg/dL) with sustained elevation for several days. Triamcinolone demonstrated similar peak levels (~220 mg/dL) but marked variability, limiting interpretability. Females generally exhibited higher and earlier peaks than males, most notably with dexamethasone. Younger patients showed more dynamic excursions and less uniform recovery, whereas older patients demonstrated flatter trajectories and more stable return toward baseline. Data completeness was highest through 48– 72 hours post-injection.
Discussion: This study provides one of the most detailed CGM characterizations of SIH, demonstrating steroid-specific and demographic-modified responses. Dexamethasone displayed a reproducible excursion phase, methylprednisolone a delayed pattern, and triamcinolone inconsistent variability. These findings highlight the utility of CGM for identifying temporal SIH features, with the first 48 to 72 hours yielding clinically reliable monitoring window.
Plain Language Summary: This study used a continuous glucose monitoring device to track blood sugar levels after a single pain-relief steroid injection in 58 adults with diabetes. Across all steroid types, blood glucose levels typically began to rise within approximately two hours after injection. Dexamethasone produced a sharp increase that returned toward baseline within 24– 36 hours, while methylprednisolone showed a delayed increase that persisted for several days. Triamcinolone was also evaluated, but results were interpreted with caution due to greater variability and smaller sample size. Modest differences were observed by age and sex. These findings support focused glucose monitoring during the first 48– 72 hours after steroid injection, when steroid-specific glucose changes are most pronounced.
Keywords: steroid-induced hyperglycemia, diabetes, continuous glucose monitors, steroids, pain, metabolic disorders
Introduction
Glucocorticoids are commonly used for their potent anti-inflammatory1 and immunosuppressive effects2 in many clinical settings, including musculoskeletal pain, autoimmune diseases, and cancer treatment.3–5 Despite their usefulness, steroids like dexamethasone, methylprednisolone, and triamcinolone are well-known to cause increases in blood glucose levels, even in people without pre-existing diabetes.6,7 This condition, called steroid-induced hyperglycemia (SIH), is especially concerning in older adults and those with impaired glucose tolerance, as short-term high blood sugar can lead to problems such as delayed wound healing,8,9 increased risk of infection,10 and longer recovery times.11 Although SIH usually resolves on its own, it can reveal hidden glucose intolerance or contribute to the development of ongoing diabetes, especially in people with risk factors. Studies show that glucocorticoid exposure can accelerate beta-cell dysfunction and insulin resistance, raising the long-term risk of developing type 2 diabetes mellitus.12,13 SIH is generally described as a temporary spike in blood sugar following steroid use, lasting from hours to days. However, because most monitoring relies on traditional methods like fasting plasma glucose or occasional fingerstick blood glucose tests, the details of these fluctuations are often not fully understood. Understanding the timing and pattern of blood sugar changes is crucial for patients on corticosteroid therapy, as missing these fluctuations can hinder prompt and effective management of blood sugar. Herein, we present our findings on SIH observed in a study involving 58 diabetic patients using CGM after receiving corticosteroid injections for pain relief from three different steroids. Compared with intermittent finger prick or laboratory glucose measurements, CGM provides high-resolution, longitudinal data that captures the timing, magnitude, and duration of steroid-induced glycemic excursions. This allows identification of transient and delayed hyperglycemic patterns that are frequently missed by point-in-time measurements. The high-resolution data collected in this provides detailed insights into when these blood sugar changes occur, their severity, and their duration, and these results aim to fill an important gap in current knowledge about this phenomenon.14,15 These findings are expected to help inform future clinical guidance on glucose surveillance following glucocorticoid administration by highlighting steroid-specific risk windows and patient-level variability in SIH.
Background
Dexamethasone, a long-acting glucocorticoid, has been shown in previous studies and case reports to cause delayed but sustained hyperglycemia, sometimes lasting up to 72 hours after injection based on finger-prick blood glucose measurements.14 While case studies, such as those by Zhang and Karam16 reported in 2021 using single patient CGM, describe triphasic glycemic profiles following intravenous dexamethasone, the applicability of these findings to larger, more diverse populations receiving non-IV formulations remains unclear. Additionally, there has been a lack of comprehensive study examining whether SIH patterns differ by age, gender, or steroid type in routine clinical practice leaving a knowledge gap that needs to be addressed. CGM now provides the ability to capture real-time glucose fluctuations with high temporal resolution, offering a unique opportunity to analyze SIH dynamics more accurately. Unlike traditional point measurements, CGM allows identification of critical inflection points in glucose levels (onset, peak, and duration) making it a powerful tool for evaluating steroid-related glucose excursions in both diabetic and non-diabetic populations. This study documents detailed glucose patterns over time of a larger number of patients generating a more reliable dataset enabling precise identification of key features of steroid-induced hyperglycemia, such as onset, peak, and duration, while also providing further insights into how these patterns differ by age, gender, and steroid type.
Study Design and Methods
This study was conducted as a single-arm, prospective observational trial at a community-based pain management clinic from March 2024 to March 2025. A total of 81 patients aged 19 years or older with diabetes mellitus who visited the clinic for pain therapy were enrolled. By the end of the study, usable CGM datasets were available for 58 participants, as data from 23 individuals could not be analyzed due to discontinuation of cloud-based data sharing for reasons not clearly identifiable. The final analysis therefore included 58 adult patients with diabetes mellitus who received a clinically indicated corticosteroid injection as part of interventional pain management. The cohort was predominantly elderly with an average age of 64.6 years comprising 38 females and 20 males. All steroid injections were given as part of standard care without modifications for research purposes. Participants received one of three commonly used corticosteroids: dexamethasone (n=38), methylprednisolone (n=15), or triamcinolone (n=5). Each patient was fitted with a Dexcom G7 CGM sensor immediately before the injection, and the standard steroid injection was administered 15 to 30 minutes of sensor placement. The CGM device was paired via Bluetooth with the patient’s smartphone using the Dexcom Clarity mobile app, enabling glucose monitoring at five-minute intervals over 10 days. Dexcom LLC provided the CGM sensors free of charge for research purposes. The CGM data were downloaded from the Dexcom Clarity system as individual spreadsheets and compiled for analysis. The dataset included timestamped glucose values along with patient-level attributes such as age, gender, and steroid type. The site of injection was not included in this analysis due to the wide variation in this category.
Use of generative AI: Limited AI assistance (ChatGPT, OpenAI; accessed Aug 2025) was used for language polishing in manuscript and identifying errors/bugs in Python code. Final code, analyses, figures, and results were written, reviewed, and validated by the authors; no synthetic data or AI-generated images were used.
Data Processing and Variable Construction
The raw dataset contained approximately 2000 entries with non-numeric values labeled as “High” (>400 mg/dL) or “Low” (<40 mg/dL), reflecting the default display behavior of the Dexcom system. These “High” and “Low” entries were imputed by using a random forest regression model consistent with conservative boundary assumptions. These values represented a small proportion of the overall CGM dataset and were imputed solely to preserve continuity of glucose trajectories; exclusion of these values did not materially alter the observed steroid-specific patterns. To support subgroup analysis, categorical variables were created: (a) Age Group patients were divided into two groups: those younger than 64.6 years and those 64.6 or older, (b) Steroid Type re-categorized into three groups: dexamethasone, methylprednisolone, and triamcinolone, (c) Time Since Injection a derived continuous variable in minutes that represents the elapsed time from steroid injection, aligned with CGM initiation.
Data Aggregation and Analysis
Data analysis and visualization were carried out using Python (v3.11), with Pandas and NumPy for data manipulation and Matplotlib for plotting. CGM data were aggregated at the patient level and summarized using mean, standard deviation (SD), and standard error of the mean (SEM). Group-level glucose trajectories were generated for the entire cohort and stratified by steroid type, gender, and age group. The primary outcomes included onset of hyperglycemia following steroid injection, peak glucose levels, and time to return to baseline glucose.
The graphs depicted in Figures 1 and 2 were generated using Matplotlib in Python. The comparative juxtaposition plot of CGM in Figure 1 overlapped with the graph report by Zhang and Karam16 as seen in Figure 3 was generated by digitally tracing CGM plots in Microsoft PowerPoint. The Zhang and Karam trace is reproduced under the terms of the Creative Commons Attribution–NonCommercial–NoDerivatives 4.0 International License (CC BY-NC-ND 4.0), with adaptations limited to formatting for consistency of presentation and without modification of the underlying scientific content. Figures 4–7 were also generated using Matplotlib in Python.
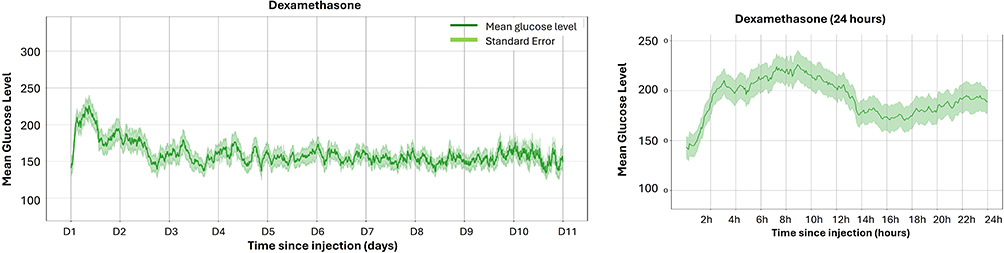 |
Figure 1 CGM profiles following dexamethasone injection. Plots show mean blood glucose levels (mg/dL) over time with bands representing standard error. (Left) Entire monitoring period (11 days) post-injection. (Right) Expanded view of the first 24 hours post-injection to highlight the glycemic excursion phase. |
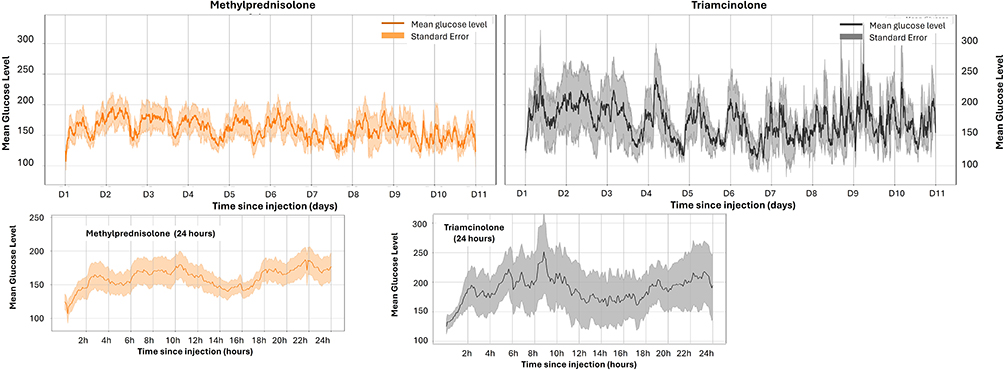 |
Figure 2 Mean CGM glucose trends with standard error following methylprednisolone and triamcinolone injection over 11 days (top) and expanded view showing the first 24 hours post-injection (bottom). |
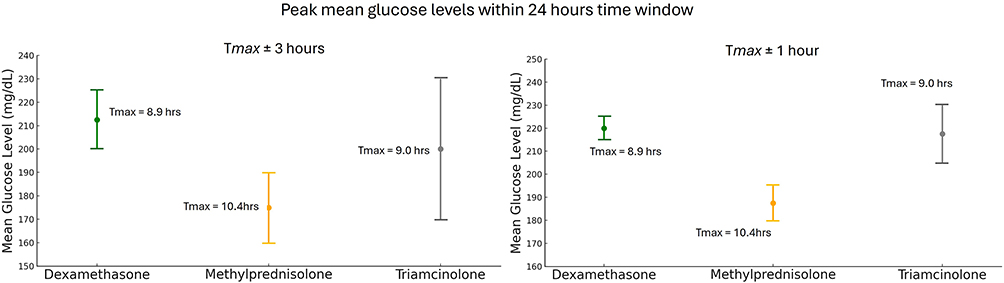 |
Figure 3 Mean glucose levels over 6-hour (left) and 2-hour (right) time window of highest glucose reading in CGM (Tmax) for each steroid and its variation. |
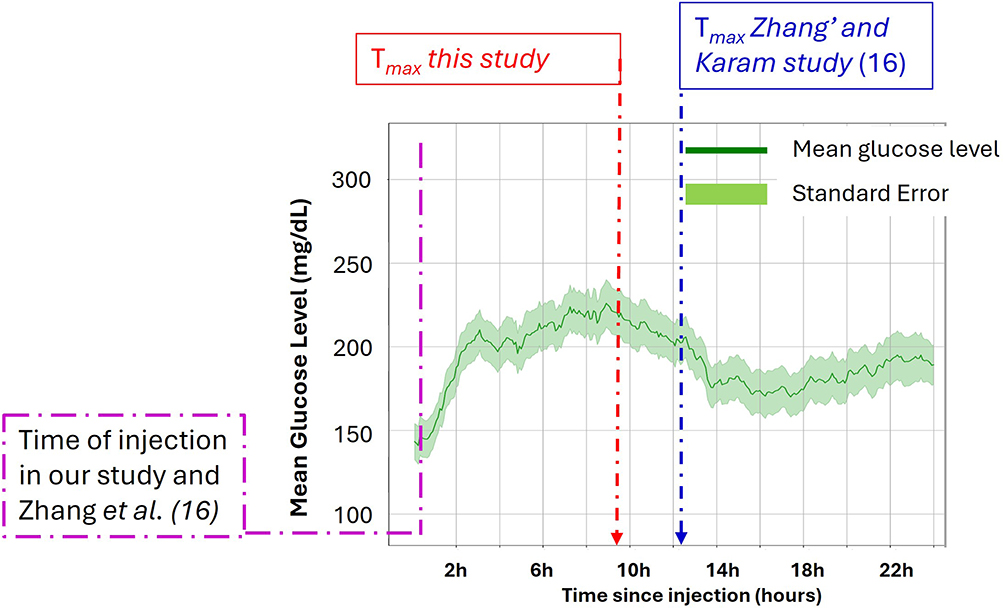 |
Figure 4 Comparison of dexamethasone-induced glucose Tmax between this study (red dashed arrow) and that reported by Zhang and Kram16 (blue dashed arrow). Mean glucose levels (green line) with standard error (shaded area) are plotted over 24 hours post-injection, showing comparable Tmax values across studies. |
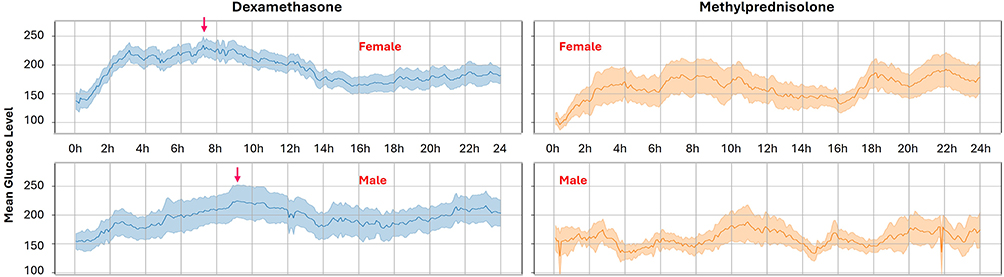 |
Figure 5 Plot of CGM data separated based on gender for dexamethasone and methylprednisolone. Red arrows in left panel (for dexamethasone) indicate highest glucose level. |
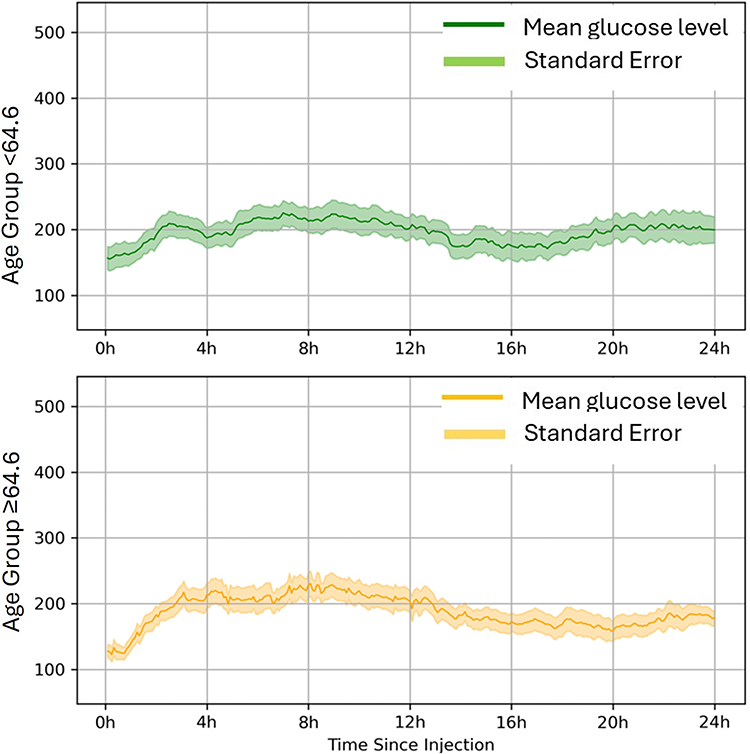 |
Figure 6 Glucose response over 24 hours following dexamethasone injection, shown by age group (<64.6 and ≥ 64.6). Table summarizing key features such as peak glucose, time to peak, Area Under the Curve, return to baseline, end-of-day glucose, and variability. |
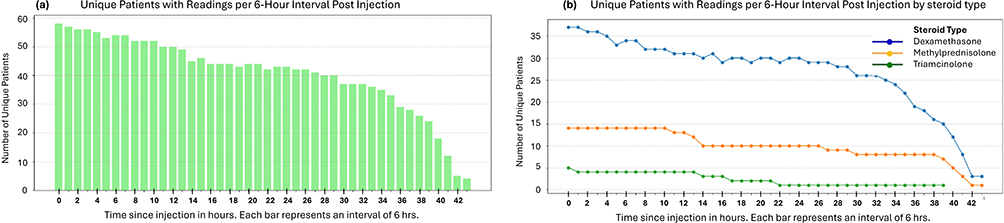 |
Figure 7 Trend of change in patient record over time. Left panel (a) shows the data collected for total number of patients, and right panel (b) shows this information for different steroid type. |
The following inclusion and exclusion criteria were employed in recruiting participants for this study.
Inclusion Criteria
- Adults aged 19 years or older.
- A1C of 6.5% or higher within the past three months.
- Patients meeting the medical criteria for need of interventional pain management procedure requiring corticosteroid administration as determined by the PI.
- Willing and able to use Dexcom’s CGM device.
- Willing to install Dexcom G7 app in their phone and register it for cloud data sharing received by TCRC at clarity.dexcom.com.
Exclusion Criteria
- Pregnancy or lactation.
- Medically unmanaged diabetes.
- History of diabetic ketoacidosis (DKA) or hyperosmolar hyperglycemic state (HHS).
- History of severe hypoglycemia.
- Active infection.
- History of a liver disorder (ALT > threefold of the ULN) or renal disease.
- Immune compromised patient.
- Active illegal drug user (self-reported).
- Under any other steroid treatment.
- Any other medical condition or treatment that would make participation in the study unsafe or infeasible as determined by the PI.
Regulatory Compliance
All research activities adhered to the ethical principles set forth in the Declaration of Helsinki and complied with all applicable federal regulations governing human subjects research. The protocol was reviewed and approved by an independent central institutional review board (WCG IRB, 1370155), and all participants provided informed consent before enrollment. WCG IRB (Princeton, NJ, USA) is not directly affiliated with any of the authors’ institutions, and it serves as the IRB of record for this study in accordance with 45 CFR 46 and ICH-GCP guidelines. The study used FDA-cleared CGM devices within their approved clinical indications, and no investigational drugs or procedures were employed. Data collection was prospective and observational, with all interventions part of routine and standard of clinical care. The study was registered on ClinicalTrials.gov following initiation of data collection.
The datasets generated and analyzed during the present study are not publicly available due to patient privacy and data security considerations but may be shared in de-identified form upon request to the corresponding author. Data sharing will be limited to qualified researchers for purposes of academic investigation subject to approval by the institutional review process and compliance with applicable data protection regulations. The custom Python scripts used for data cleaning, imputation, and analysis will also be made available upon request for transparency and reproducibility of the findings.
Results
The average of CGM readings, along with the standard mean error bands for the three different steroids in the study, was plotted against time to visualize blood glucose excursions and stabilization in patients. The number of patients in each steroid group, along with their average age, gender distribution, and site of injection, are summarized in Table 1. Distinct differences in SIH patterns and recovery trends were observed, as illustrated in Figure 1 for dexamethasone and in Figure 2 for methylprednisolone and triamcinolone.
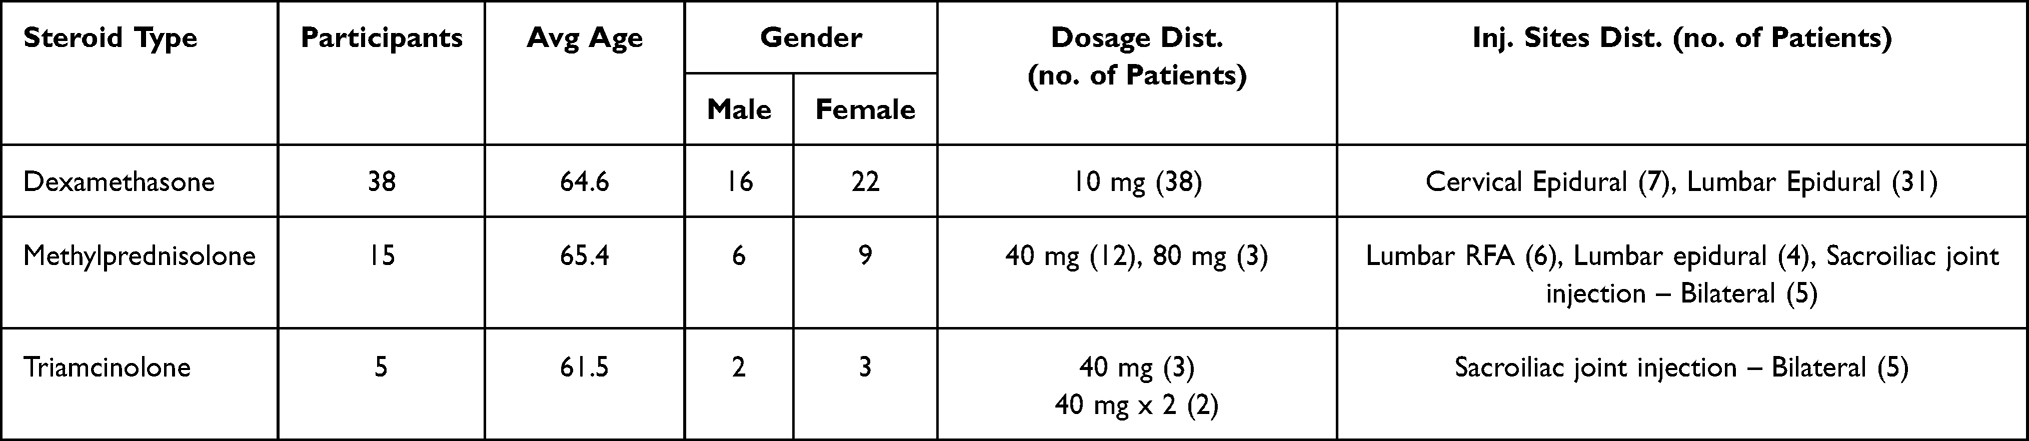 |
Table 1 Distribution of Steroids, Dosage, Injection Site, and Gender |
Distribution of Steroids, Dosage, and Injection Site
The number of patients receiving each of the three steroids, along with gender, dosage, and distribution details, are listed in Table 1. The average age across groups ranged from 61.5 to 65.4 years among the three steroids. The dexamethasone group was the largest, with 38 patients receiving 10 mg; this steroid was most often administered via lumbar epidural injection. Methylprednisolone was typically given at 40 mg (n=13) or 80 mg (n=2), with injection sites including lumbar RFA, lumbar epidural, and bilateral sacroiliac joint injections. Triamcinolone was administered to five patients – three of them received 40 mg, and two received 40 mg twice. All triamcinolone injections were performed at the bilaterally affected sacroiliac joints. Gender distribution was generally balanced, with slightly more females in the dexamethasone and triamcinolone groups. This stratification highlights key differences in steroid dosing patterns and anatomical targets across treatment groups, offering important context for interpreting glycemic outcomes.
Blood Glucose Level Changes Following Steroid Injection
The blood glucose levels (mg/dL) following steroid injection, monitored using the CGM device for the three patient groups, are plotted over time (in days) across the 10 days. The blood glucose excursion was most prominent within the first 24 hours for all three steroids. Analysis of these plots for each steroid provides some key details regarding the SIH characteristics of these steroids.
Dexamethasone exhibited a rapid and pronounced glycemic response as noticed in Figure 1. As observed in the first 24-hour profile shown in the right panel, glucose levels rose sharply within 2 hours post-injection and peaked between 8 and 10 hours reaching a mean of ~220 to 225 mg/dL. This was followed by a gradual decline, with levels approaching ~150 mg/dL by 24–36 hours. A transient dip around 14–16 hours was observed with glucose level reaching 175 mg/dL, followed by a modest rebound that remained well below the initial peak, consistent with expected intraday variability rather than a distinct secondary excursion. Thereafter, glucose values stabilized to near pre-injection levels. The SEM band remained relatively narrow, indicating that the mean trajectory was estimated with high precision. In the 10-day trajectory, glucose levels showed only mild day-to-day variation and no sustained secondary spike, supporting a single-phase hyperglycemic excursion with gradual resolution.
Methylprednisolone showed a more moderate but extended glycemic pattern (Figure 2) with glucose levels gradually increasing and smaller spikes around 10 to 12 hours and again near 18 to 20 hours, averaging between 175 to185 mg/dL. Unlike dexamethasone, methylprednisolone did not produce a single dominant peak and the highest CGM reading was also about 35 points lower. Methylprednisolone also varied remarkedly from dexamethasone in the SIH phase wherein the glucose elevation lasted throughout the entire 24 hour period and did not return to baseline until at least 3 to 4 days later. Over 10 days, glucose stayed mildly high with ongoing variability and no apparent stabilization, indicating a longer-acting or a potentially biphasic effect. The SEM band was broader than that for dexamethasone, reflecting lower precision in the mean estimate, which likely stems from greater inter-patient variability and smaller sample size.
Triamcinolone exhibited the most irregular and variable glucose trends (Figure 2). Within the first 24 hours, mean glucose readings rose rapidly, peaking around 6 to 8 hours at approximately 220 mg/dL, but the pattern was inconsistent with secondary fluctuations and dips throughout the monitoring period. Over the 10-day span, glucose levels varied widely between 140 to 200 mg/dL, showing no clear stabilization phase. The SEM band was considerably wider than that for the other two steroids, reflecting both the smaller sample size (n=5) and greater inter-individual variability in glycemic response.
Figure 3 offers a detailed comparison of steroid-induced glycemic excursions focused on each steroid’s peak glucose time within the first 24 hours (Tmax). The left panel displays mean glucose levels within a ±3-hour window around Tmax, while the right panel narrows this to a Tmax±1-hour interval. The whisker plots visually depict both the average peak glucose and the variation between patients, with standard deviation represented by the spacing between horizontal bars. The plots suggest that a direct comparison between dexamethasone and methylprednisolone is justified, whereas triamcinolone cannot be directly compared due to high variability caused by a small sample size of n = 5.
Within the Tmax±3-hour window, dexamethasone showed the highest mean peak glucose around 212 mg/dL, with relatively less variability compared to triamcinolone. Methylprednisolone had the lowest excursion, approximately 177 mg/dL, with a later Tmax around 10.4 hours and moderate dispersion. Triamcinolone displayed a relatively comparable mean to dexamethasone (~200 mg/dL), but with much larger variability, again indicating inconsistent responses among patients due to the small sample size. The ±1-hour window further decreased the dispersion for all three steroids. The comparative whisker plots of the Tmax showed a clear distinction between dexamethasone and methylprednisolone in the SIH phase that the latter causing delayed glycemic excursion.
These focused comparisons further demonstrate that for all three steroids cause glycemic elevations after injection, the magnitude, timing, and consistency of these effects differ significantly depending on the steroid type.
Comparison of Dexamethasone Case Study in Literature
The temporal profile of dexamethasone-induced hyperglycemia observed in our study matches the CGM data reported by Zhang and Karam,16 who described a reproducible triphasic glycemic pattern in a 70-year-old patient receiving repeated intravenous dexamethasone (8 to 12 mg) for chemotherapy. In their case, glucose levels rose within hours after injection and plateaued for 23 to 35 hours, followed by a transient dip and a secondary rise lasting 7 to 13 hours on Day 3. Regarding SIH, they identified the peak of the initial glycemic excursion (Tmax) at about 9 to10 hours, which is highlighted in our comparative graphical analysis as shown in Figure 4.
Interestingly, our multi-patient cohort also showed a similar early-phase pattern with glucose levels rising within 2 hours and peaking at an average of 8.9 hours after injection. The subsequent decline in glucose levels mirrors the pattern reported by Zhang and Karam.16 Additionally, a slight dip followed by a secondary rise in mean glucose levels can be seen in both datasets during the 12 to 18-hour period, indicating a potential inflection point in steroid pharmacodynamics. When aligned by time, both datasets display a consistent early hyperglycemic pattern after dexamethasone administration, confirming the reliability of this response across different clinical settings.
Despite differences in the route of administration (intravenous in Zhang versus mainly articular or epidural in our cohort), the similarity in timing and shape of the initial SIH response highlights the consistency of this physiological effect across our studies. Our cohort-level data, gathered from CGM recordings of more than 35 patients, broadens the importance of the previously reported single-patient case study. This reproducibility strengthens the case for targeted, time-sensitive glycemic monitoring, especially within the first 12 hours after injection, which seems to be a clinically relevant window for managing SIH.
Gender-Based Glucose Trends in SIH
To examine how gender affects the glycemic response to steroid administration, glucose trends were divided by both gender and steroid type. The resulting plots show clear differences in both the extent and consistency of glucose increases across subgroups, as shown in Figure 5.
Dexamethasone
Females showed a quick and clear SIH response after dexamethasone was given, with mean glucose levels rising sharply in the first few hours and peaking around 8 to 10 hours near 240 mg/dL. A steady decline followed, with levels dropping to about 150 mg/dL by 24 to 36 hours and staying fairly stable over the 10-day period. The pattern was smooth, and the SEM band was narrow, indicating that the mean response was estimated with high precision. Males had a similar timing for the peak but at a lower level (~220 mg/dL), followed by a slower recovery phase. Males showed wider SEM bands, reflecting less precision in the mean estimate, consistent with more heterogeneous responses within this subgroup.
Methylprednisolone
Comparison of the glucose fluctuation within the first 24 hours in females showed that glucose levels increased more gradually compared to dexamethasone in females as well around 185 mg/dL between 12 and 24 hours after injection, with a generally sustained increase extending into later days. The SEM band showed moderate variability. In males, the rise was slower and more gradual, mostly staying within the 160–175 mg/dL range, with more variability from day to day. Both groups lacked a clear peak, and the extended elevation was more dispersed in pattern.
Triamcinolone
Both female and male subgroups showed highly irregular glucose profiles, with no clear SIH peak or return to baseline. Female patients experienced a sharp spike between 8 to 10 hours, exceeding 250 mg/dL, but their responses were inconsistent over time and highly variable. Males displayed multiple fluctuations without a dominant peak, generally with lower amplitude changes. The broad SEM bands throughout indicate lower precision in the mean estimate, consistent with substantial variability among individuals and the small sample size (n=5).
Across all three steroid categories, female patients generally exhibited higher peak glucose levels and more structured SIH trajectories than males, particularly in the early post-injection phases. Males showed more subdued responses and greater variability. These differences may suggest underlying gender-based variations in steroid pharmacokinetics, insulin sensitivity, or hormonal influences on glucose metabolism. As in previous sections, data beyond day 8 should be interpreted cautiously due to decreased patient retention, which results in broader standard error bands and greater uncertainty at later time points.
Glycemic Readings by Age Group for Dexamethasone
Age-based analysis of CGM data revealed notable patterns in glycemic response following dexamethasone administration. As shown in Figure 6, patients younger than the mean age of 64.6 years experienced a sharp rise in glucose levels within the first 2 hours after injection, peaking between 4 and 8 hours at about 220 to 230 mg/dL. This was followed by a gentle decline and a brief dip around 16 hours, after which glucose levels slightly increased again toward the 24-hour point. In contrast, patients aged 64.6 years and older showed a similar early rise in blood sugar, but their peak occurred slightly earlier (around 4 hours) and was slightly lower (210 to 220 mg/dL). The older group also exhibited a more linear and sustained return to baseline without a secondary spike. Overall, the trajectory in older patients appeared flatter and more stable across the 24 hours. The shaded standard error bands in both groups stayed relatively narrow, indicating precise estimates of the mean trajectory in each age group; however, the older group showed slightly less variability. These trends suggest that while the pattern of dexamethasone-induced hyperglycemia is generally consistent across age groups, younger patients tend to have a more dynamic fluctuation with a longer elevation phase and mild rebound, whereas older patients display a more uniform and predictable recovery. The key metrics of age-related differences in glucose levels are summarized in Table 2 and Figure 6. While these patterns provide useful clinical insights, they should be considered preliminary, and further analysis may be necessary to determine their significance and broader relevance.
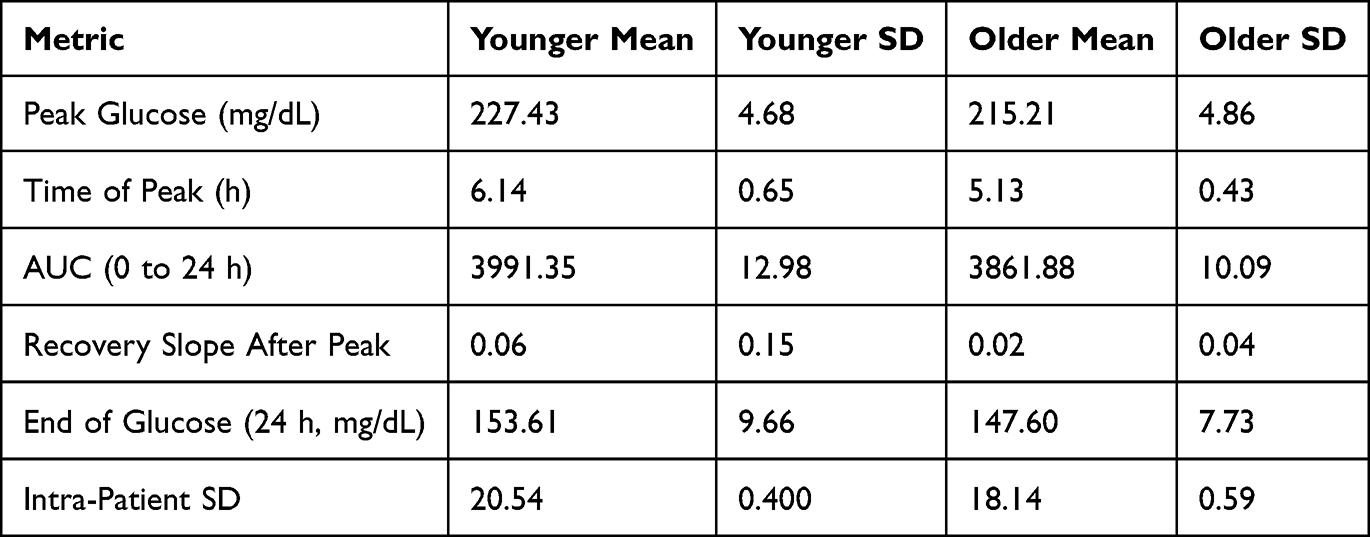 |
Table 2 Statistical Features of Age-Based Analysis of CGM Data |
Patient Retention Over Time and Consistency in Data Collection
The longitudinal collection of CGM data in this study was analyzed, and the number of unique patients contributing valid glucose readings over time, segmented into 6-hour intervals post-injection, is summarized in Figure 7a; the same information for different steroids is shown in Figure 7b. Figure 7a indicates that nearly all 58 patients’ data were collected in the first 6-hour interval after steroid injection. Retention remained high and consistent across the first 48 hours, with more than 50 patients contributing readings through interval 8 (~48 hours post-injection). Afterward, a gradual decline was observed. Until around 7.5 days, nearly 70% of participant data was still being collected. The drop-off became more noticeable after day 8, and by the final interval (interval 43, ~10.75 days), fewer than 10 patients’ data were being collected in the Dexcom Clarity cloud system. This progressive attrition highlights the need for cautious interpretation of data beyond day 7, as the smaller sample size increases variability and the impact of individual outliers becomes more significant.
Regarding patient retention by steroid type, stratifying by steroid type reveals notable differences in data completeness among the three groups: dexamethasone (n=38), which had the strongest retention, with over 30 patients consistently contributing data for the first 5 days (intervals 0–20). A gradual decline followed, with 25–30 patients active up to day 8. Data availability then sharply decreased after day 9, reaching just 2 patients by the final interval. Methylprednisolone (n=14): retention remained steady for the first 13 intervals (~3.25 days), with 13–14 patients, then declined to about 10 patients and remained stable for several subsequent days. The final drop occurred around day 9. Triamcinolone (n=5): this group showed the most limited retention. Fewer than 5 patients contributed data at any point, and only 2 patients remained after day 6. The subgroup’s small size and early attrition limit the interpretability of long-term trends.
These retention curves show that the first 48–72 hours after injection give the most complete and reliable data for analyzing SIH. After this period, data quality and statistical confidence decrease, especially for the triamcinolone group. Fluctuations in glucose levels seen during later time points (after ~day 8) should be interpreted with this in mind, as they are probably caused by a small number of patients and greater variability, which is clearly shown in the standard error bands.
Discussion
This study provides one of the most detailed cohort-level descriptions of SIH using continuous glucose monitoring, highlighting the heterogeneity of responses across steroid types and patient subgroups. Table 3 summarizes the key findings illustrating that dexamethasone, methylprednisolone, and triamcinolone each generate distinctive glycemic profiles, and suggesting that SIH does not present a uniform complication but rather a potentially identifiable drug-specific phenomenon. The consistent peak and rapid decline associated with dexamethasone supports its clinical predictability, offering an opportunity for targeted monitoring within a relatively short post-injection window. In contrast, methylprednisolone demonstrated a flatter and more sustained elevation, indicating a prolonged metabolic impact that could increase the cumulative glycemic burden. Triamcinolone was represented by only five patients due to which its interpretation is limited; however, despite the limitation, the irregular and inconsistent glucose excursions observed in this small group suggest a less predictable response profile compared with the other steroids.
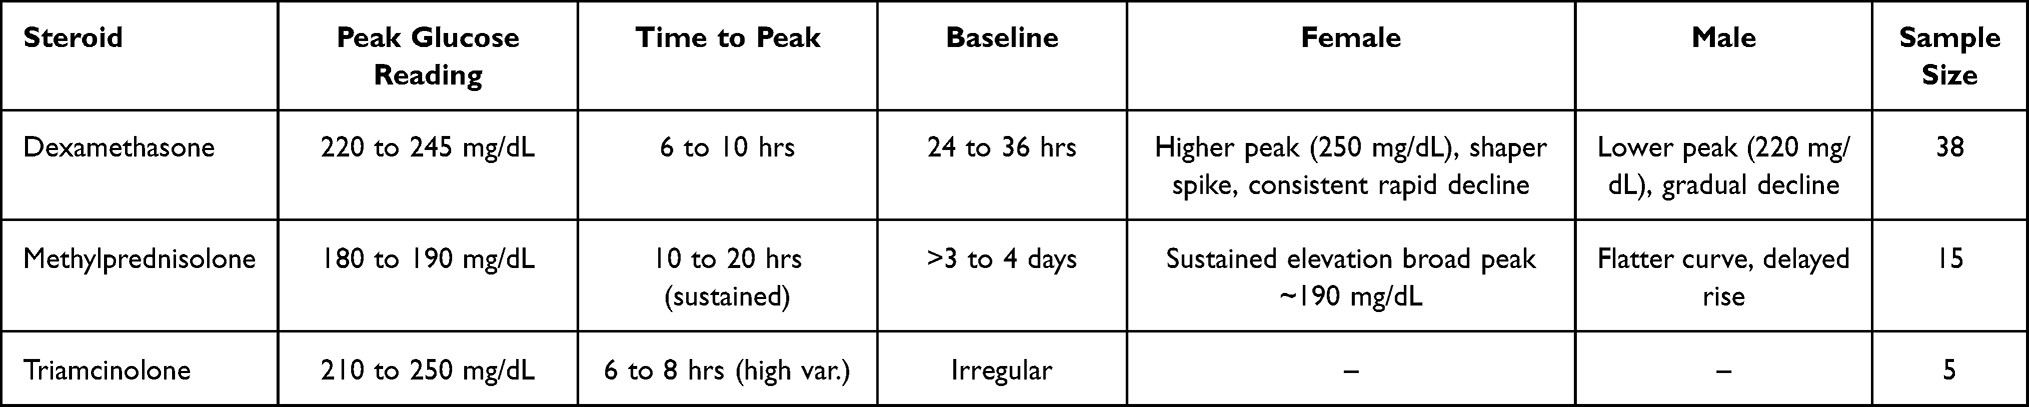 |
Table 3 Summary of Key Insights Derived From the CGM Data |
In addition to pharmacologic distinctions demographic modifiers appear to provide important context. The higher peaks and more structured recovery observed in females suggest possible sex-related differences in glucocorticoid metabolism or insulin sensitivity. Similarly, the sharper and more dynamic fluctuations in younger participants, compared with the steadier recovery in older individuals, point to potential age-related influences on glycemic resilience. Such observations coincide with endocrinology literature describing heterogeneity in glucocorticoid metabolic effects and the need to tailor antihyperglycemic strategies to steroid type and dose.17 Although exploratory, these findings indicate that demographic might be one of the key considerations while assessing SIH risks.
The close alignment between our dexamethasone data and the case report by Zhang and Karam strengthens the reliability of early excursion phases and emphasizes the reproducibility of this pattern across diverse clinical contexts. Importantly, the retention analysis reinforces that the first 48 to 72 hours after injection represent the most reliable and clinically meaningful window for SIH monitoring. Later time points, while informative, suffer from attrition and greater variability, reducing their interpretive strength.
Considered together we believe a comprehensive initial understanding emerges and these findings support a more individualized approach to glucose monitoring after steroid injections, informed by both the agent selected and the patient’s demographic profile. They also demonstrate the unique contribution of CGM in detecting temporal inflection points that conventional monitoring strategies are unable to capture. The incorporation of CGM into routine pain management could therefore enable case-based precision care, mitigating risks while accommodating patient variability.
The observed steroid-specific glycemic profiles in our study may have relevance beyond short-term hyperglycemia. This is particularly applicable to patients exposed to repeated steroid injections or concurrent medications that influence glucose metabolism. Prolonged or recurrent glycemic excursions and elevations, such as those associated with longer-acting steroids, may contribute to cumulative metabolic burden in susceptible individuals, especially in the setting of multi-drug regimens where effects on glucose regulation may be additive. The increasing availability of high-resolution CGM data has enabled applications extending beyond acute glycemic surveillance. Recent studies have demonstrated the use of CGM-derived features in machine learning models to predict incident diabetic retinopathy in adults with type 1 diabetes, as well as the integration of CGM metrics with genetic risk profiling to enhance prediction of immunological risk associated with diabetes progression.18,19 While these applications fall outside the scope of the present study, they illustrate the potential expanding the role of CGM as a data-rich platform for stratification of risks and long-term metabolic assessment.
Conclusion
This study demonstrates that SIH is a heterogeneous, steroid-specific complication influenced by pharmacological properties and patient-level modifiers. Dexamethasone produced a reproducible excursion phase with clear resolution, whereas methylprednisolone was associated with more prolonged elevations and triamcinolone with inconsistent variability. Gender and age further shaped the glycemic trajectory, highlighting the limitations of uniform monitoring strategies. By leveraging continuous glucose monitoring, this analysis revealed temporal patterns and inflection points not detectable with conventional glucose testing. The first 48 to 72 hours emerged as the most reliable window for capturing clinically relevant fluctuations, providing actionable insights for real-world management. These findings argue for integrating CGM into routine pain practice to enable tailored monitoring strategies, improve anticipatory care, and reduce the metabolic risks associated with steroid therapy. Findings from this study could inform clinical practice in anticipating the timing, duration, and periods of heightened risk of steroid-induced hyperglycemia, with clinically relevant differences observed between older and younger patients.
Acknowledgments
The authors thank Dexcom, Inc. for the donation of CGM systems provided at no cost (IIS-2023-125). No financial support or compensation was received for conducting this study from Dexcom. MP and PB thank TCRC and GIPRC staff for their efforts in carrying out this research.
Disclosure
Dr Mahesh Pattabiraman reports grants from Abbott Medical Inc., Saluda Medical Inc, and Medtronic, provided to TriCity Research Center, outside the submitted work. The authors report no other conflicts of interest in this work.
References
1. Coutinho AE, Chapman KE. The anti-inflammatory and immunosuppressive effects of glucocorticoids, recent developments and mechanistic insights. Mol Cell Endocrinol. 2011;335(1):2–13. doi:10.1016/j.mce.2010.04.005
2. Strehl C, Ehlers L, Gaber T, Buttgereit F. Glucocorticoids-all-rounders tackling the versatile players of the immune system. Front Immunol. 2019;10:1744. doi:10.3389/fimmu.2019.01744
3. Van Der VV. Glucocorticoids: mechanisms of action and antiinflammatory. Mediators Inflamm. 1998;7(4):229–237. doi:10.1080/09629359890910
4. Knezevic NN, Jovanovic F, Voronov D, Candido KD. Do corticosteroids still have a place in the treatment of chronic pain? Front Pharmacol. 2018;9:1229. doi:10.3389/fphar.2018.01229
5. Leppert W, Buss T. The role of corticosteroids in the treatment of pain in cancer patients. Curr Pain Headache Reports. 2012;16(4):307–313. doi:10.1007/s11916-012-0273-z
6. Saigi I, Perez A. Management of glucocorticoid induced hyperglycemia. Rev Clin Esp. 2010;210(8):397–403. doi:10.1016/j.rce.2010.03.006
7. Shah P, Kalra S, Yadav Y, et al. Management of glucocorticoid-induced hyperglycemia. Diab Metab Syndrome Obes. 2022;Volume 15:1577–1588. doi:10.2147/DMSO.S330253
8. Rosenberg CS. Wound healing in the patient with diabetes mellitus. Nurs Clin North America. 1990;25(1):247–261. doi:10.1016/S0029-6465(22)00238-9
9. Bitar MS. Glucocorticoid dynamics and impaired wound healing in diabetes mellitus. Am J Pathol. 1998;152(2):547–554.
10. Kim EJ, Ha KH, Kim DJ, Choi YH. Diabetes and the risk of infection: a national cohort study. Diabet Metabol J. 2019;43(6):804. doi:10.4093/dmj.2019.0071
11. Brinchmann‐Hansen O, Dahl‐Jørgensen K, Hanssen K, Sandvik L. Macular recovery time, diabetic retinopathy, and clinical variables after 7 years of improved glycemic control. Acta ophthalmologica. 1992;70(2):235–242. doi:10.1111/j.1755-3768.1992.tb04130.x
12. Clore JN, Thurby-Hay L. Glucocorticoid-induced hyperglycemia. Endocr Pract. 2009;15(5):469–474. doi:10.4158/EP08331.RAR
13. Hwang JL, Weiss RE. Steroid‐induced diabetes: a clinical and molecular approach to understanding and treatment. Diabetes/Metab Res Rev. 2014;30(2):96–102. doi:10.1002/dmrr.2486
14. Fong AC, Cheung NW. The high incidence of steroid-induced hyperglycaemia in hospital. Diabet Res Clin Pract. 2013;99(3):277–280. doi:10.1016/j.diabres.2012.12.023
15. Jeong Y, Han HS, Lee HD, et al. A pilot study evaluating steroid-induced diabetes after antiemetic dexamethasone therapy in chemotherapy-treated cancer patients. Cancer Res Treat. 2016;48(4):1429–1437. doi:10.4143/crt.2015.464
16. Zhang F, Karam JG. Glycemic profile of intravenous dexamethasone-induced hyperglycemia using continuous glucose monitoring. Am J Case Rep. 2021;22:e930733. doi:10.12659/AJCR.930733
17. Li J-X, Cummins CL. Fresh insights into glucocorticoid-induced diabetes mellitus and new therapeutic directions. Nat Rev Endocrinol. 2022;18(9):540–557. doi:10.1038/s41574-022-00683-6
18. Montaser E, Shah VN. Prediction of incident diabetic retinopathy in adults with type 1 diabetes using machine learning approach: an exploratory study. J Diabetes Sci Technol. 2024;19322968241292369. doi:10.1177/19322968241292369
19. Montaser E, Farhy LS, Rich SS. Enhancing type 1 diabetes immunological risk prediction with continuous glucose monitoring and genetic profiling. Diabetes Technol Ther. 2025;27(4):292–300. doi:10.1089/dia.2024.0496
 © 2026 The Author(s). This work is published and licensed by Dove Medical Press Limited. The
full terms of this license are available at https://www.dovepress.com/terms
and incorporate the Creative Commons Attribution
- Non Commercial (unported, 4.0) License.
By accessing the work you hereby accept the Terms. Non-commercial uses of the work are permitted
without any further permission from Dove Medical Press Limited, provided the work is properly
attributed. For permission for commercial use of this work, please see paragraphs 4.2 and 5 of our Terms.
© 2026 The Author(s). This work is published and licensed by Dove Medical Press Limited. The
full terms of this license are available at https://www.dovepress.com/terms
and incorporate the Creative Commons Attribution
- Non Commercial (unported, 4.0) License.
By accessing the work you hereby accept the Terms. Non-commercial uses of the work are permitted
without any further permission from Dove Medical Press Limited, provided the work is properly
attributed. For permission for commercial use of this work, please see paragraphs 4.2 and 5 of our Terms.