Back to Journals » ImmunoTargets and Therapy » Volume 15
Multi-Omics Analysis Reveals m7G Methylation-Related Genes May Be Involved in TGF-β Signaling-Mediated Anti-PD-L1 Response in Bladder Cancer
Authors Liang HQ ![]() , Li YJ, Yu JY, Mo QZ, Wei QJ
, Li YJ, Yu JY, Mo QZ, Wei QJ ![]() , Liang YQ, Wei FY, Zhang XP
, Liang YQ, Wei FY, Zhang XP ![]() , Zhao JW, He YX, Feng XD, Yin BT
, Zhao JW, He YX, Feng XD, Yin BT ![]() , Liang XW, Nong RJ, Wang YY, Qin M, Cheng JW
, Liang XW, Nong RJ, Wang YY, Qin M, Cheng JW ![]()
Received 22 November 2025
Accepted for publication 26 March 2026
Published 14 April 2026 Volume 2026:15 583577
DOI https://doi.org/10.2147/ITT.S583577
Checked for plagiarism Yes
Review by Single anonymous peer review
Peer reviewer comments 2
Editor who approved publication: Professor Michael Shurin
Hai-Qi Liang,1,* Yu-Jian Li,1,* Jia-Yin Yu,1,* Qi-Zhou Mo,1 Qiu-Ju Wei,2 Yu-Qi Liang,2 Fa-Ye Wei,1 Xiao-Ping Zhang,3 Jia-Wen Zhao,1 Yu-Xian He,2 Xin-Dong Feng,2 Bin-Tong Yin,1 Xin-Wen Liang,1 Ren-Jun Nong,1 Yao-Yu Wang,1 Min Qin,4 Ji-Wen Cheng1
1Department of Urology, The First Affiliated Hospital of Guangxi Medical University, Nanning, Guangxi, People’s Republic of China; 2Guangxi Medical University, Nanning, Guangxi, People’s Republic of China; 3Department of Urology, Liuzhou Traditional Chinese Medical Hospital, Liuzhou, Guangxi, People’s Republic of China; 4Human Sperm Bank, The First Affiliated Hospital of Guangxi Medical University, Nanning, Guangxi, People’s Republic of China
*These authors contributed equally to this work
Correspondence: Ji-Wen Cheng, Department of Urology, The First Affiliated Hospital of Guangxi Medical University, 6 Shuangyong Road, Nanning, Guangxi, 530021, People’s Republic of China, Email [email protected] Min Qin, Human Sperm Bank, The First Affiliated Hospital of Guangxi Medical University, 6 Shuangyong Road, Nanning, Guangxi, 530021, People’s Republic of China, Email [email protected]
Background: Immunotherapy resistance is a significant challenge in bladder cancer treatment. The role of N7-methylguanosine (m7G) methylation in this process remains unclear. This study aims to investigate the potential role of m7G methylation-related genes (m7GRGs) in immunotherapy resistance using a multi-omics approach.
Methods: This study integrated bioinformatics analysis with in vitro experimental validation. We obtained bulk, single-cell, and spatial transcriptomics data from multiple bladder cancer cohorts in public databases, including TCGA, GEO and IMvigor210. Machine learning models were performed to identify molecular clusters and screen signature genes. Gene ontology analysis was used for gene function enrichment. siRNA transfection knocked down the expression of characteristic genes in bladder cancer cell lines to validate their roles in signaling regulation. Gene expression was assessed using qRT-PCR, Western blot, and immunohistochemistry. Additionally, CCK-8 and wound healing assays were performed to evaluate the effects of characteristic genes on the proliferation and migration of bladder cancer cells.
Results: Two bladder cancer molecular clusters were identified, with the C1 cluster exhibiting worse prognosis, higher m7GRGs expression, and an immunosuppressive microenvironment. NUDT10 was a key prognostic gene distinguishing molecular clusters. A subset of differentially methylated genes correlated with anti-PD-L1 resistance were enriched in the TGF-β signaling pathway. Single-cell and spatial transcriptomics revealed that NUDT10 was co-expressed with TGF-β activator LRRC32. IMvigor210 and GSE176307 datasets found that expression of NUDT10 and LRRC32 was associated with poor response to anti-PD-L1 therapy. Knockdown of NUDT10 in bladder cancer cells inhibited the expression of LRRC32 and reduced the proliferation and migration abilities of the cancer cells.
Conclusion: This study identifies NUDT10 as a key gene associated with poor prognosis based on m7GRGs-defined molecular clusters in bladder cancer. NUDT10 expression may regulate TGF-β signaling and is associated with poor response to anti-PD-L1 therapy in advanced or metastatic bladder cancer.
Keywords: bladder cancer, m7G methylation, immune checkpoint blockade, immunotherapy, TGF-β
Introduction
Bladder cancer is one of the most common malignant tumors of the urinary system. According to Global Cancer Statistics 2022, there were annually 613,791 new cases and 220,349 deaths from bladder cancer globally.1 Although significant progress has been made in the diagnosis and treatment of bladder cancer, the long-term survival rate of patients remains unsatisfactory. Particularly for patients with muscle-invasive bladder cancer (MIBC), the five-year survival rate is only about 60%.2 In recent years, chemotherapy, targeted therapy, and immunotherapy have brought new hope to patients with locally advanced or metastatic bladder cancer.3–5 In particular, immune checkpoint inhibitors (ICIs), such as PD-1/PD-L1 inhibitors, have demonstrated remarkable efficacy in the treatment of bladder cancer.5 However, immunotherapy resistance has become a major challenge in clinical practice. The Phase 2 IMvigor210 study of atezolizumab has revealed that more than 85% of patients exhibited primary resistance or acquired resistance, leading to treatment failure and disease progression.6
RNA methylation, as an important post-transcriptional modification, plays a critical role in biological processes.7 Recent studies have confirmed that RNA methylation can regulate tumor immunity.8 Among these modifications, N7-methylguanosine (m7G), a common type of RNA methylation, influences RNA processing, metabolism, stability, and translation efficiency, thereby participating in the regulation of tumor cell proliferation and differentiation.9,10 The m7G modification is catalyzed by specific methyltransferase complexes, with the METTL1/WDR4 complex being the primary catalytic enzyme for m7G in mammals.10 Studies have shown that aberrant m7G methylation is closely associated with the development and progression of bladder cancer.11,12 In bladder cancer, m7G-modified tRNA upregulates the expression of EGFR/EFEMP1, promoting the proliferation and invasion of bladder cancer cells.13 Meanwhile, m7G modification also facilitates the accumulation of polymorphonuclear myeloid-derived suppressor cells within tumors by regulating the chemokines CXCL5 and CXCL8, thereby influencing the immune microenvironment and impairing the efficacy of immune checkpoint blockade (ICB) therapy.14 These findings suggest that m7G methylation may play a key role in the regulation of tumor immunity.
m7G-related genes (m7GRGs) refer to regulatory genes associated with m7G methylation. Some m7GRGs do not directly catalyze m7G modification but participate in the dephosphorylation process of m7G-related metabolites.15 Recent studies have also highlighted the interplay between epigenetics and epitranscriptomics, elucidating how DNA and RNA methylation collaboratively regulate the expression of specific genes.16,17 Previous research has identified 44 m7GRGs,18–20 which will be applied in this study. Utilizing an integrated multi-omics approach, this study profiles bladder cancer by incorporating bulk, scRNA-seq, and spatial transcriptomics data. This strategy systematically uncovers the disease’s heterogeneity, delineates molecular clusters, and identifies potential therapeutic targets. The research aims to provide an in-depth investigation into the role of m7G methylation in mediating immunotherapy resistance in bladder cancer via the integration of multi-omics data.
Materials and Methods
Data Collection
Bulk RNA sequencing (RNA-seq) data and corresponding clinical information for The Cancer Genome Atlas Bladder Cancer (TCGA-BLCA) cohort were downloaded from the UCSC Xena database (https://xena.ucsc.edu/). The single-cell RNA-seq (scRNA-seq) dataset GSE14514021 and visium spatial transcriptomics dataset GSE17135122 were downloaded from the Gene Expression Omnibus (GEO) repository. IMvigor210 dataset was acquired from the IMvigor210CoreBiologies R package.23 Additionally, GSE17630724 dataset was obtained as validation set. The details of these datasets were summarized in Table 1. The study was approved by the Ethics Committees of The First Affiliated Hospital of Guangxi Medical University (No. 2025-E1069).
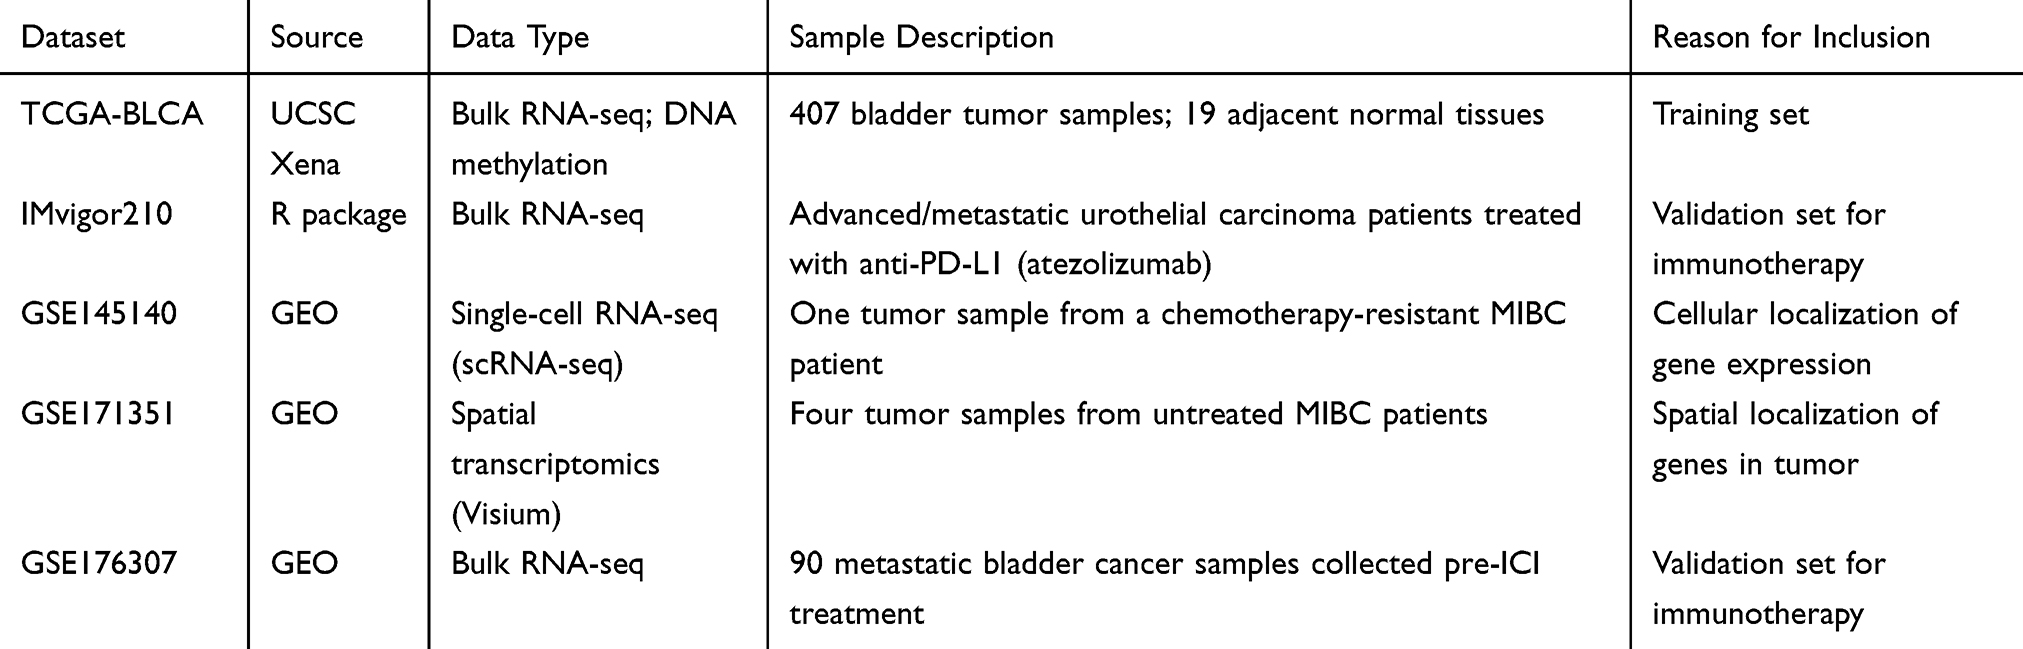 |
Table 1 Information of the Inclused Dataset |
Identification of Bladder Cancer Molecular Clusters
Bladder cancer molecular clusters were identified within the TCGA-BLCA dataset. Using the non-negative matrix factorization (NMF) algorithm from the NMF R package, the TCGA-BLCA samples were categorized into molecular clusters based on the m7GRGs expression patterns. The optimal rank was determined by calculating model stability metrics, such as residuals, across different ranks. The most consistent and stable decomposition result from 50 iterations was automatically selected as the final output. Subsequently, differences in characteristic gene expression, patient survival prognosis, and clinical features among the different molecular clusters were validated.
Survival Analysis
Survival analysis was performed based on the overall survival (OS) follow-up information of TCGA-BLCA patients. Using the “surv_cutpoint” function from the survival R package, an optimal cutoff value was selected to divide all samples into high-expression and low-expression groups based on the expression levels of the characteristic genes. Kaplan-Meier survival curves were plotted for the two groups, and statistical analysis was conducted using the Log rank test. Furthermore, univariate Cox regression analysis and multivariate Cox regression analysis were performed to identify independent prognostic risk factors within the characteristic gene expression. Additionally, a Risk-Score was constructed based on the coefficients from the multivariate Cox regression model. The 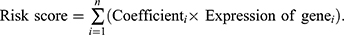 Three machine learning models Least Absolute Shrinkage and Selection Operator (LASSO), Random Forest (RF), Extreme Gradient Boosting (XGBoost) were used to identify bladder cancer clusters based on the expression of prognostic genes. Signature genes with best performance were given by each model.
DNA Methylation Differential Analysis
The TCGA-BLCA DNA methylation dataset was utilized for analysis. Differential analysis of DNA methylation levels between the two bladder cancer molecular clusters was performed using the limma R package. The empirical Bayes method was used to adjust variance, and multiple comparison correction was performed using the Benjamini-Hochberg method. Using the criteria of absolute log2 Fold-Change greater than 1 and adjusted P-value less than 0.05, all DNA methylation levels were categorized into up-regulated, down-regulated, and non-significant groups. The Illumina annotation file was used to annotate the DNA regions corresponding to the differentially methylated sites.
Biological Function Enrichment Analysis
Biological functions enriched for the characteristic genes were analyzed based on the Gene Ontology (GO) database. The org.Hs.egdb R package was used to convert gene symbols to Entrez IDs, followed by GO enrichment analysis using the enrichGO function from the clusterProfiler R package. The enrichment results were categorized into Biological Process (BP), Cellular Component (CC), and Molecular Function (MF). The circlize R package was used to visualize the associations between enriched GO terms and the characteristic genes.
Screening of Immunotherapy Response-Related Genes
Differentially methylated genes (DMGs) between the two TCGA-BLCA subgroups were selected as candidate genes. These were further screened in the IMvigor210 dataset to identify DMGs associated with response to anti-PD-L1 immunotherapy. Patients with complete response (CR) and partial response (PR) were classified as the response group, while those with stable disease (SD) and progressive disease (PD) were classified as the resistant group. T-test was used to compare the expression levels of the signature genes between the two groups, and the Benjamini-Hochberg method was applied for False Discovery Rate (FDR) correction. Genes with an adjusted P-value less than 0.05 were considered to be immunotherapy response-related genes.
Evaluation of Tumor-Infiltrating Immune Cells
The CIBERSORT deconvolution algorithm was used to evaluate tumor-infiltrating immune cells based on the TCGA-BLCA RNA-seq matrix. First, a pre-defined signature gene set file named LM22, which contains specific gene expression signatures for 22 immune cell types, was obtained. Subsequently, the CIBERSORT R package was used to estimate the relative proportions of immune cells in each tumor sample. The resulting values represent the relative proportion of each immune cell type within the total immune cell population of an individual sample.
Validation Set Analysis
The expression differences of the signature genes between the ICIs treatment response and resistance groups were validated in the GSE176307 dataset. Furthermore, the prognostic features of signature genes were validated in this independent cohort.
scRNA-Seq Analysis
The Seurat R package was used for scRNA-seq analysis. Quality control parameters were established based on the inclusion criteria of the original study21 and followed the widely accepted quality control principles in the field of scRNA-seq analysis.25 Cells with more than 1,000 and fewer than 150,000 unique molecular identifiers (UMIs), more than 500 and fewer than 10,000 expressed genes, and less than 10% mitochondrial reads were included. A total of 2,075 cells remained for further analysis based on these criteria. Cell clusters were identified using a shared-nearest neighbor graph (k.param = 30) with the cluster resolution set to 0.1. Cell types were annotated for the scRNA-seq data using the SingleR R package.
Spatial Transcriptomics Analysis
Spatial transcriptomics data constitute a high-dimensional information matrix that simultaneously records gene expression levels and spatial coordinates on the same tissue section. The Seurat R package was used for quality control, normalization, dimensionality reduction, and clustering analysis of the gene expression matrix. Key parameters were set as follows: spots detecting fewer than 200 genes or with over 10% mitochondrial gene content were filtered out. Unsupervised clustering algorithms were employed to identify cell populations with distinct transcriptomic features, and these populations were annotated using the SingleR R package and differential expression gene analysis. Finally, by integrating Hematoxylin and Eosin (H&E) staining images, the spatial distribution patterns of these transcriptionally defined cell populations within the native tissue architecture were visualized and biologically interpreted.
Cell Lines and Culture Conditions
The human bladder urothelial carcinoma cell line J82 was procured from the Cell Bank of Chinese Academy of Medical Sciences in Shanghai. The cells were maintained in RPMI-1640 medium (Gibco, USA) and grown in complete medium supplemented with 10% fetal bovine serum (FBS; Gibco, USA) and a penicillin-streptomycin antibiotic mixture (100 U/mL penicillin and 100 µg/mL streptomycin; Invitrogen, USA). They were maintained under standardized culture conditions at 37°C in a humidified incubator with 5% CO2.26
siRNA Transfection
Small interfering RNA (siRNA) targeting NUDT10 and negative control (NC) were purchased from GenePharma (Suzhou, China). Specific siRNA targeting NUDT10 and NC were transiently transfected into J82 cells according to the manufacturer’s instructions. LIP2000 reagent was used for each transfection.
siNUDT10 sense strand: CAAGGACACAGCUCAUCCUTT
siNUDT10 antisense strand: AGGAUGAGCUGUGUCCUUGTT
NC sense strand: UUCUCCGAACGUGUCACGUTT
NC antisense strand: ACGUGACACGUUCGGAGAATT
RNA Extraction and Quantitative Real-Time PCR (qRT-PCR)
Total RNA was isolated using Trizol® reagent (Life Technologies, USA) following cell lysis, with chloroform added to facilitate phase separation. The purified RNA pellet was subsequently resuspended in 50 µL of RNase-free water. RNA concentration and purity were assessed using a NanoDrop spectrophotometer (Thermo Fisher Scientific, USA). For cDNA synthesis, 1 µg of total RNA was reverse transcribed with the PrimeScript RT kit (Takara, Japan). qRT-PCR was performed using 2× TaqMan qPCR Master Mix (Solarbio, China). Data points with undetectable Ct values or Ct values exceeding 35 were excluded from analysis. GAPDH was used as the endogenous control for normalization. Relative expression levels of target genes were determined using the 2−ΔΔCt method. All PCR primers were synthesized by Shanghai Sangon Biotech (China).
Western Blot Analysis
Total protein was extracted from J82 cells and stored at −80°C. Western blot analysis was performed as described previously.27 Cells were lysed using RIPA buffer for protein extraction, and protein concentration was determined using a BCA kit. A total of 20 µg of protein was subjected to 12% SDS-PAGE gel electrophoresis, and the separated proteins were transferred onto PVDF membranes. The membranes were blocked with 5% non-fat milk in blocking buffer at room temperature for 2 h, followed by overnight incubation with diluted primary antibodies at 4°C. Details and dilution ratios of the primary antibodies were as follows: anti-GAPDH (Cat# 81640-5-RR; 1:5000; Proteintech), anti-NUDT10 (Cat# 68478-1-Ig; 1:5000; Proteintech), and anti-PD-L1 (Cat# 66248-1-Ig; 1:2000; Proteintech) Membranes were then incubated with goat anti-rabbit (Cat# SA00001-2; 1:1000; Proteintech) or goat anti-mouse (Cat# SA00001-1; 1:1000; Proteintech) secondary antibodies at room temperature for 1 h Protein bands were visualized using BeyoECL Plus reagent, and gray value analysis was performed using ImageJ software.
CCK-8 Assay
Cell proliferation was assessed using the Cell Counting Kit-8 (CCK-8) assay. J82 cells were seeded in 96-well plates at a density of 2×10³ cells per well and cultured for 24 h, followed by transfection with NUDT10 siRNA or si-NC. Subsequently, 10 µL of CCK-8 solution was added to each well at 0, 24, 48, and 72 h. After incubation for 1 h, the optical density at 450 nm was measured using a Spark multifunction microplate reader.
Wound Healing Assay
J82 cells were seeded in 6-well plates at a density of 5×10⁵ cells per well. After 24 h, cells were transfected with NUDT10 siRNA or si-NC and cultured for an additional 24 h until reaching 100% confluence as a monolayer. A wound was created by scratching the cell layer with a 200 µL pipette tip. The medium was then replaced with 0.5% serum-containing medium, and images of the scratched areas were captured using an inverted microscope at 0, 24, and 48 h.
ceRNA Network Construction
Competing endogenous RNA (ceRNA) refers to a class of RNA molecules that competitively bind to miRNAs by sharing identical miRNA binding sites, thereby regulating the expression of target genes. Since m7G methylation modification may act on lncRNAs, miRNAs, and mRNAs, a ceRNA network was constructed to gain deeper insights into the regulatory mechanisms of target genes. Firstly, differentially expressed miRNAs and lncRNAs between bladder cancer molecular clusters were screened. Subsequently, interactions among the differentially expressed RNAs were queried using the ENCORI/starBase database. The ceRNA network was constructed based on the lncRNA-miRNA-mRNA interaction relationships.
Statistical Analysis
Statistical analyses were performed in R (Version 4.4.2) and GraphPad Prism (Version 8.0.2). The t-test was applied to compare the expression of genes and the infiltration scores of immune cells between two groups. Pearson’s correlation was applied in all correlation analyses. A P-value of less than 0.05 was considered statistically significant for all tests.
Results
Characteristics of Bladder Cancer Molecular Clusters
The study workflow is summarized in a flowchart (Figure 1). The NMF algorithm categorized the TCGA-BLCA samples into two molecular clusters, designated C1 (n=134) and C2 (n=273), based on the expression patterns of m7GRGs (Figure 2A and B). m7GRGs demonstrated higher expression levels in the C1 cluster (Figure 2C). Most m7GRGs were differentially expressed in tumor tissues compared to normal tissues (Figure 2D). Patients with the C1 cluster exhibited a poorer overall survival prognosis compared to those with the C2 cluster (P=0.003) (Figure 2E). Gene function enrichment analysis of the 44 m7GRGs suggested their involvement in pathways such as TGF-β signaling and fibroblast growth factor receptor (FGFR) signaling (Figure 2F).
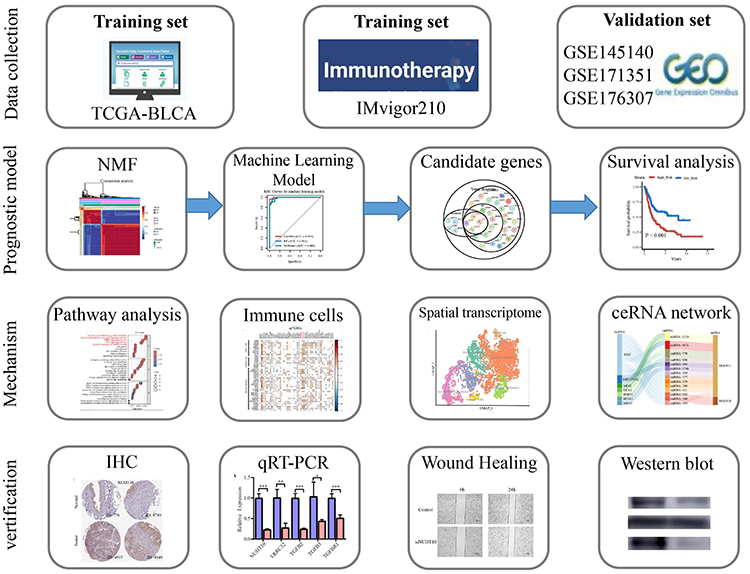 |
Figure 1 The flow chart of the study. |
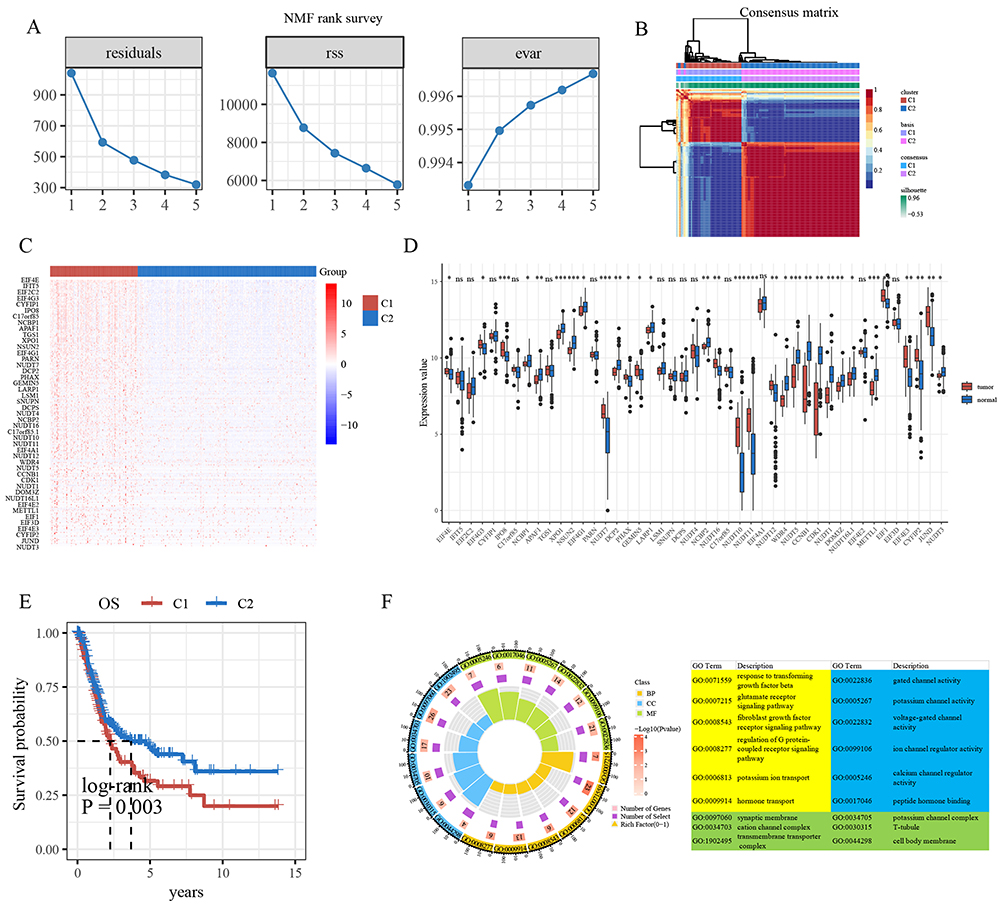 |
Figure 2 (A) Parameters of the NMF algorithm: residuals, residual sum of squares (rss), and explained variance (evar) (k = 1–5). (B) Consensus clustering matrix for k = 2. (C) Heat map of m7GRGs expression in bladder cancer molecular clusters. (D) Expression levels of m7GRGs in tumors and normal tissues. (E) Kaplan-Meier survival analysis of bladder cancer molecular clusters. (F) Gene functional analysis of the m7GRGs. *, P < 0.05; **, P < 0.01; ***, P < 0.001. |
m7GRGs Expression Levels Correlate with Prognosis
Univariate Cox regression analysis identified NUDT11, NUDT10, GEMIN5, CYFIP1, and WDR4 as risk factors for overall survival, while DOM3Z and NUDT4 were protective factors (Figure 3A). Multivariate Cox regression analysis indicated that NUDT10 and WDR4 were independent risk factors for overall survival (Figure 3B). Risk-score = NUDT11×(−0.038) + NUDT10×0.157 + GEMIN5×0.047 + DOM3Z×(−0.278) + CYFIP1×0.326 + NUDT4×(−0.121) + WDR4×0.317. The LASSO, RF, XGBoost machine learning models achieved high accuracy in identifying bladder cancer clusters, with the AUC of 0.998, 0.991 and 0.989, respectively (Figure 3C). NUDT11, NUDT10, NUDT7, and IFIT5 were jointly selected as the best decision genes by three machine learning models (Figure 3D). Kaplan-Meier curve analysis demonstrated the good prognostic performance of the Risk-score (Figure 3E). Furthermore, diagnostic ROC curve analysis showed that NUDT11 and NUDT10 effectively distinguished between the C1 and C2 bladder cancer clusters (Figure 3F–I). Given the superior performance of NUDT10/NUDT11 in differentiating bladder cancer clusters, they will be emphasized in the subsequent study. IHC staining profiles indicated that NUDT10 and NUDT11 exhibited moderate staining intensity and were expressed in over 75% of bladder tumor cells, but with low staining and less than 25% quantity in normal urothelial cells (Figure 3J and K). This validated the overexpression of NUDT10/NUDT11 in bladder cancer.
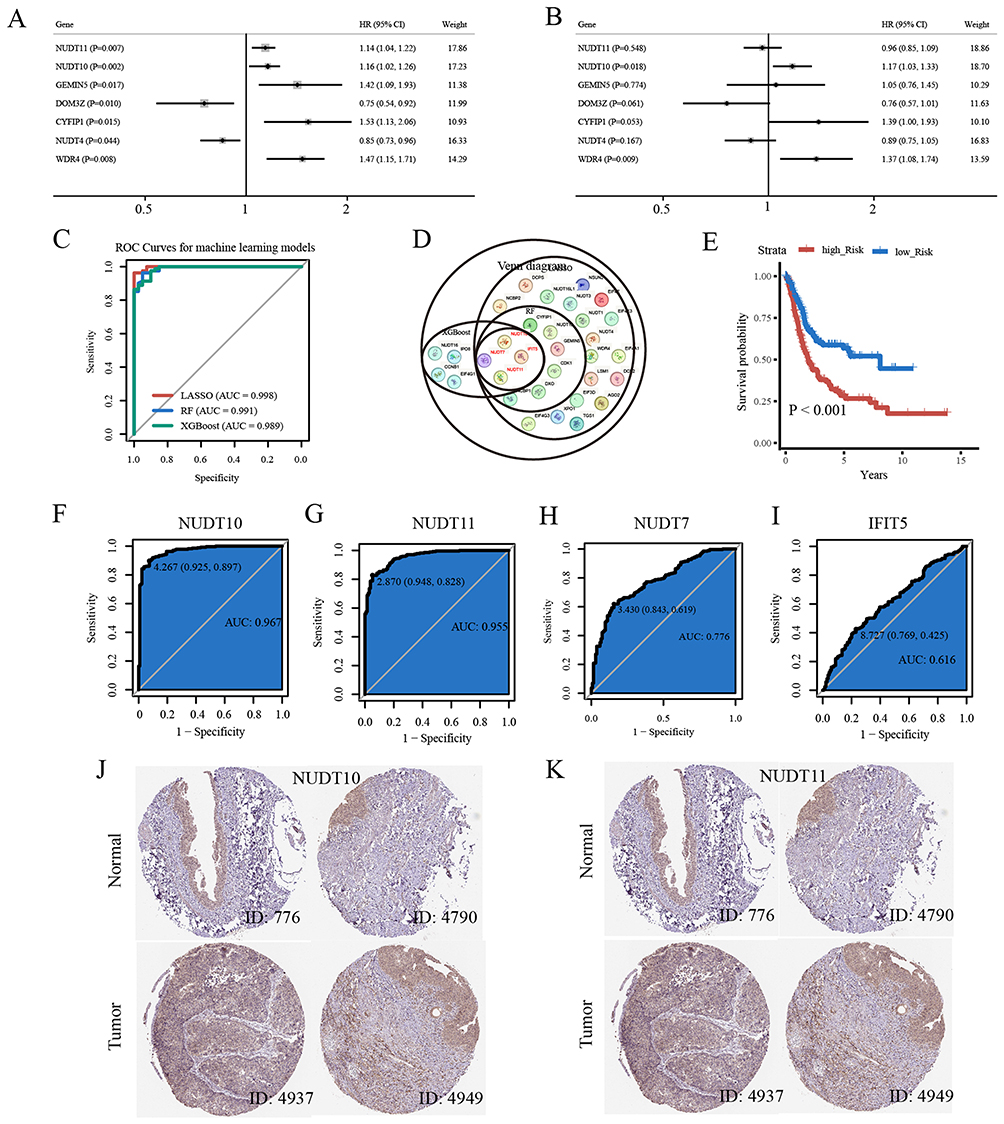 |
Figure 3 (A) The univariate Cox regression analysis of OS based on m7GRGs. (B) The multivariate Cox regression analysis of OS based on m7GRGs. (C) ROC curves for the LASSO, RF, XGBoost machine learning models. (D) Venn diagram for signature genes of the three machine learning models. (E) Kaplan-Meier survival analysis of risk-score. (F–I) Diagnostic ROC curve based on expression of NUDT11, NUDT10, NUDT7, and IFIT5 for differentiating bladder cancer molecular clusters. (J) IHC staining of bladder tumors. (K) IHC staining of bladder normal epithelium. |
Differentially Methylated Genes in Bladder Cancer Molecular Clusters
A total of 12,012 differentially methylated CpG sites were identified between the C1 and C2 bladder cancer molecular clusters, with 9,803 hypermethylated and 2,209 hypomethylated sites (Figure 4A). By annotating these differential CpG sites to specific genes, 3,448 DMGs were identified. A strong correlation was observed between the expression levels of m7GRGs and DMGs (Figure 4B). Gene function enrichment analysis revealed that the DMGs were enriched in pathways such as TGF-β signaling, FGFR signaling, ERBB signaling, Wnt signaling, and MAPK signaling (Figure 4C and D).
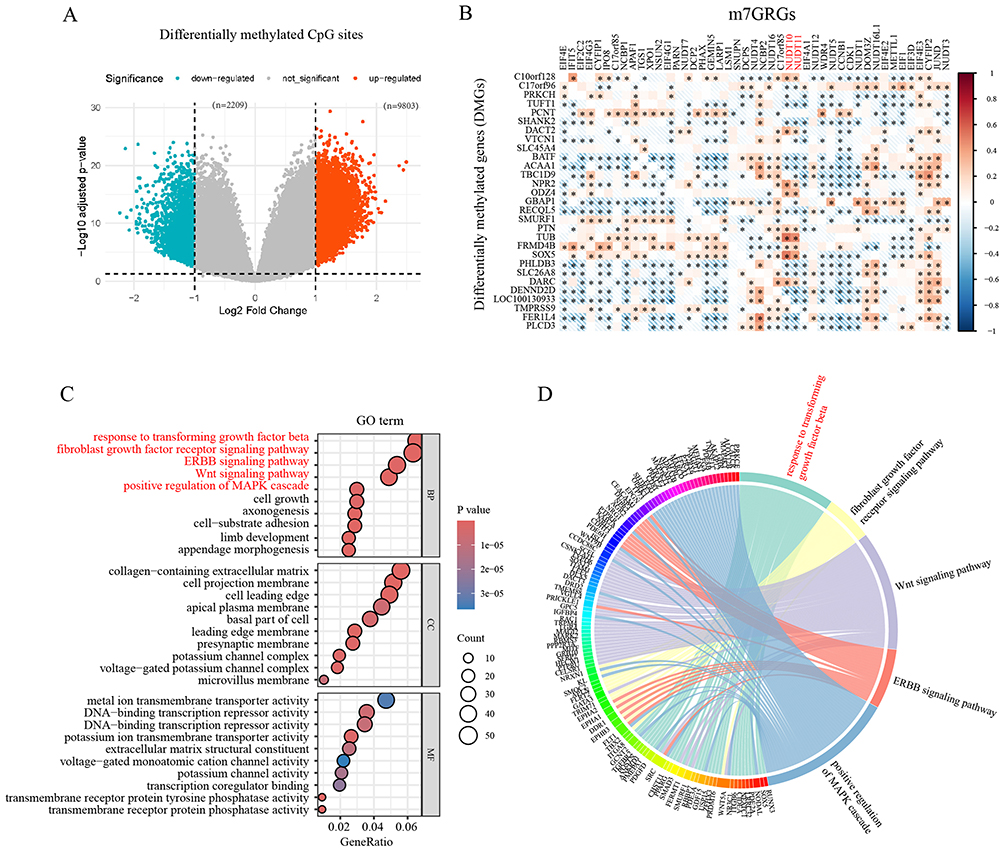 |
Figure 4 (A) Differentially methylated CpG sites between the C1 and C2 bladder cancer molecular clusters, with 9,803 hypermethylated and 2,209 hypomethylated sites. (B) Pearson’s correlation analysis of m7GRGs expressions and DMGs (R>0.5). (C) Gene functional analysis of the DMGs. (D) The DMGs enriched in key pathways. *, P < 0.05. |
DMGs are Associated with Anti-PD-L1 Response
The expression levels of 376 DMGs were significantly different between the response and resistance groups in the IMvigor210 dataset (Figure 5A). These resistance-associated DMGs also showed a strong correlation with m7GRGs expression, with 30 DMGs showing a correlation coefficient greater than 0.5 (Figure 5B). Biological function enrichment analysis revealed that these DMGs are involved in FGFR signaling, TGF-β signaling, Wnt signaling, and T-cell differentiation, among other pathways (Figure 5C). Among the resistance-associated DMGs with a correlation coefficient greater than 0.5 with m7GRGs, LRRC32 was enriched in the TGF-β signaling pathway (Figure 5D). Most of these DMGs were differentially expressed between the C1/C2 bladder cancer molecular clusters and the response/resistance groups. Specifically, LRRC32 expression was higher in the resistance group compared to the response group (Figure 5E and F).
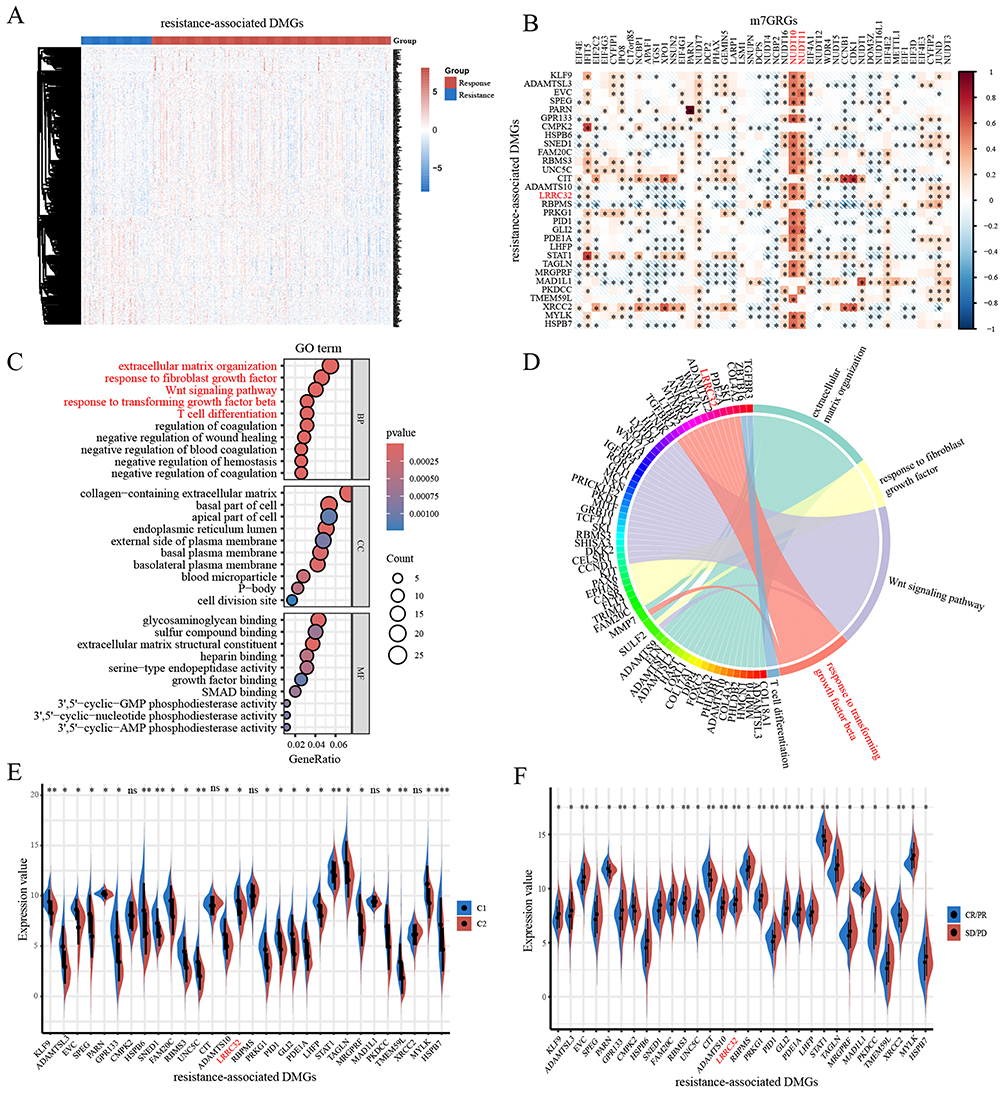 |
Figure 5 (A) The expression of DMGs between the response and resistant groups in the IMvigor210 dataset. (B) Pearson’s correlation analysis of m7GRGs expressions and the resistance-associated DMGs (R>0.5). (C) Gene functional analysis of the resistance-associated DMGs. (D) The resistance-associated DMGs enriched in key pathways. (E) Expression levels of resistance-associated DMGs in bladder cancer molecular clusters. (F) Expression levels of resistance-associated DMGs in anti-PD-L1 response and resistant groups. *, P < 0.05; **, P < 0.01; ***, P < 0.001. |
Immune Infiltration and ICIs Response Validation in Bladder Tumor Molecular Clusters
The infiltration levels of CD8+ T cells, M1 macrophages, and activated dendritic cells were lower in the C1 bladder cancer cluster compared to the C2 cluster, while M2 macrophage infiltration was higher (Figure 6A). This suggests reduced antigen presentation and cellular immune activity in the C1 cluster, indicating an immunosuppressive tumor microenvironment. At the molecular level, the expression of NUDT10/NUDT11 was positively correlated with various immunosuppressive factors, including CD274 (PD-L1), CSF1R, CTLA4, HAVCR2, IDO1, IL10, LAG3, PDCD1 (PD-1), TGFB2, TGFB3, and TGFBR1 (Figure 6B). Given the important role of the TGF-β signaling pathway in bladder cancer immunotherapy response, further validation was performed using the GSE176307 dataset from bladder cancer patients receiving immunotherapy. In this validation set, the expression levels of NUDT10, NUDT11, LRRC32, and TGFB3 were all higher in the resistance group compared to the response group (Figure 6C). Survival analysis in the validation set also confirmed that high expression of NUDT10/NUDT11 was a risk factor for OS (Figure 6D and E). In the TCGA-BLCA dataset, a strong positive correlation was observed between the expression of NUDT10/NUDT11 and TGF-β signaling markers, including LRRC32, TGFB2, TGFB3, and TGFBR1 (Figure 6F–M).
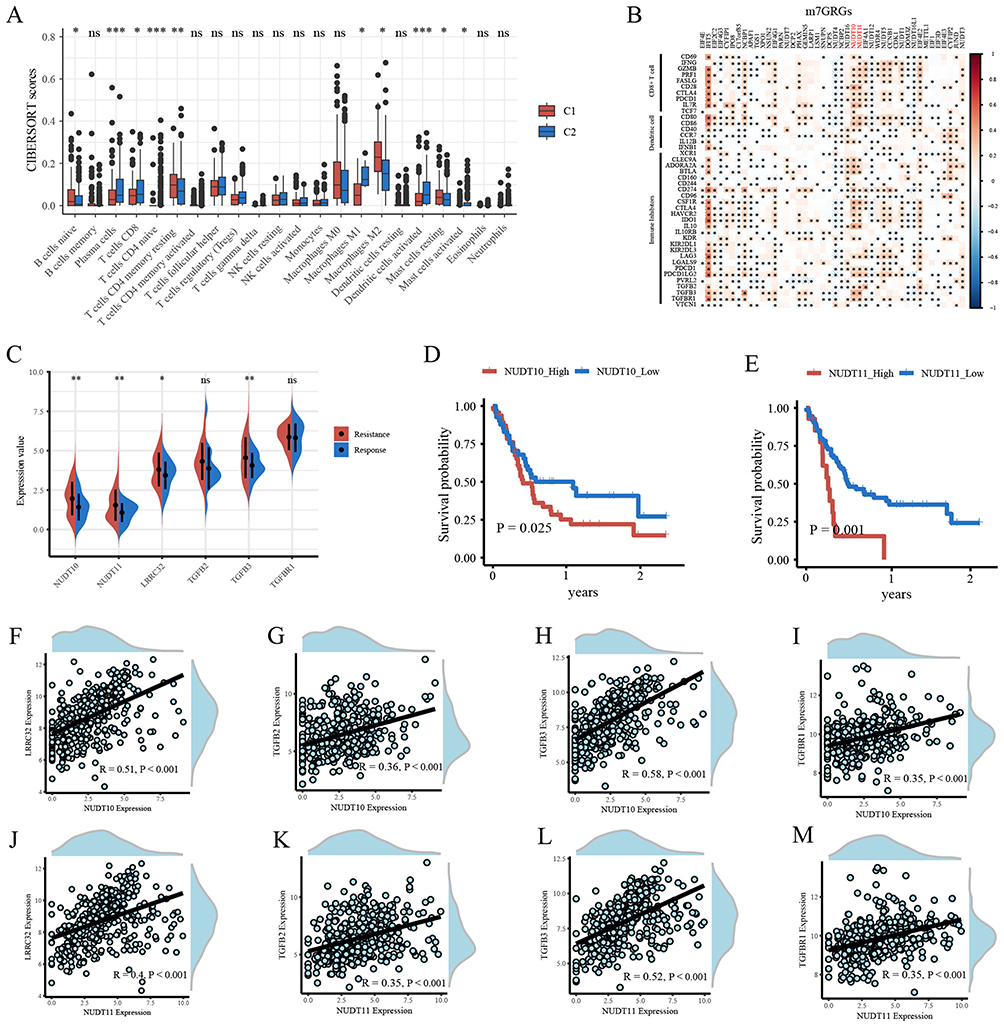 |
Figure 6 (A) The immune infiltration cells score between bladder cancer C1 and C2 molecular clusters in TCGA-BLCA. (B) Pearson’s correlation analysis of m7GRGs expressions and immune biomarkers. (C) Expression of NUDT10, NUDT11, LRRC32, TGFB2, TGFB3, and TGFBR1 between ICIs treatment response and resistance groups in validation set GSE176307. (D and E) Kaplan-Meier survival analysis of NUDT10 and NUDT11 in validation set GSE176307. (F–M) Pearson’s correlation analysis of NUDT10/NUDT11 and LRRC32, TGFB2, TGFB3, TGFBR1. *, P < 0.05; **, P < 0.01; ***, P < 0.001. |
scRNA-Seq Analysis
Eight cell clusters were identified in the bladder cancer scRNA-seq dataset GSE145140, including tumor cells, T cells, endothelial cells, macrophages, muscle cells, fibroblasts, and urothelial cells (Figure 7A). NUDT10 and NUDT11 were primarily expressed in fibroblasts (Figure 7B and C). LRRC32, TGFB2, TGFB3, and TGFBR1 all showed relatively high expression levels in fibroblasts (Figure 7D–G). Correlation analysis within the scRNA-seq dataset further confirmed a positive correlation between the expression levels of NUDT10/NUDT11 and LRRC32 (Figure 7H).
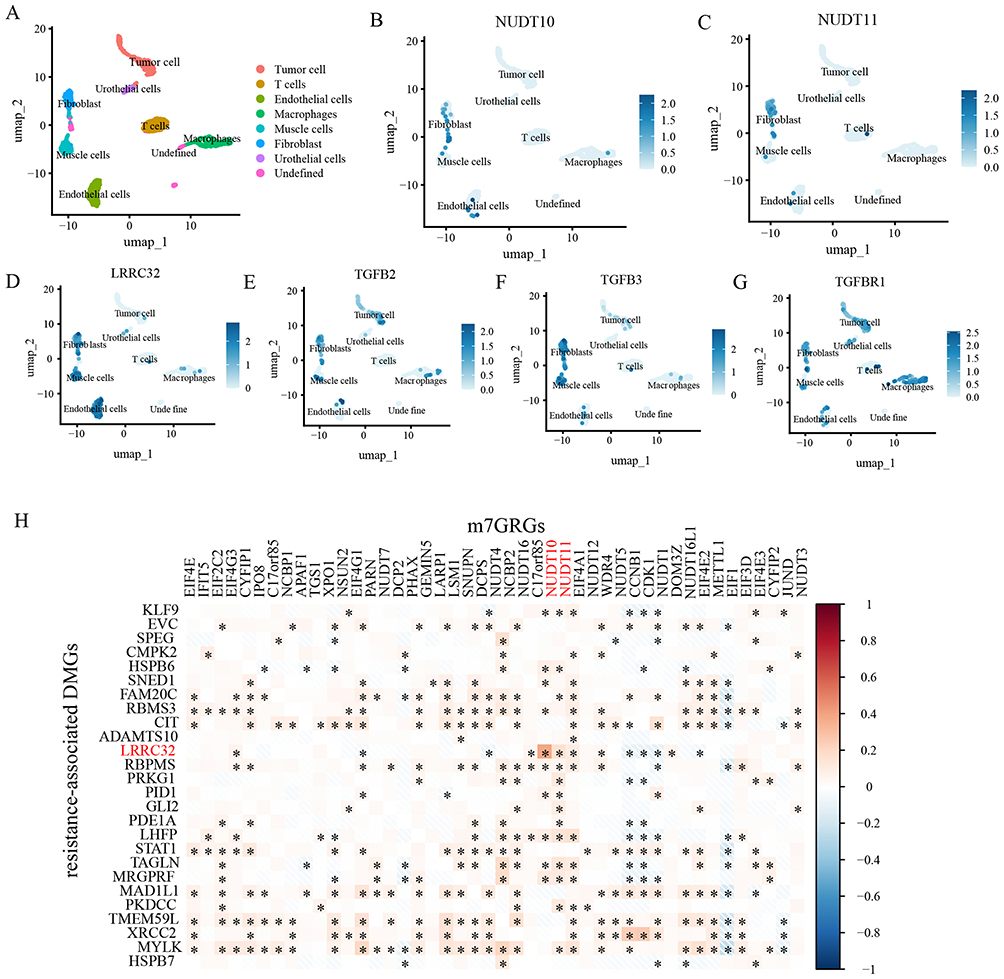 |
Figure 7 (A) Cluster diagram of cell types in bladder cancer scRNA-seq dataset GSE145140. (B–G) Expression of NUDT10, NUDT11, LRRC32, TGFB2, TGFB3, and TGFBR1 in identified cell types of scRNA-seq dataset GSE145140. (H) Pearson’s correlation analysis of m7GRGs expressions and the resistance-associated DMGs (R>0.5) in scRNA-seq dataset GSE145140. *, P < 0.05. |
Spatial Transcriptomics Analysis
In the bladder cancer spatial transcriptomics dataset GSE171351, seven distinct cell clusters were identified: luminal epithelial, basal epithelial, neuroendocrine epithelial, neuroendocrine epithelial 2, fibroblast, immune cells, and stem cells (Figure 8A). Tumor Sample 1 was predominantly composed of luminal epithelial cells; Sample 2 primarily contained neuroendocrine epithelial and immune cells; Sample 3 mainly consisted of luminal epithelial and basal epithelial cells; and Sample 4 was primarily composed of luminal epithelial cells and fibroblasts (Figure 8B). The accuracy of the cell annotations was further validated by examining the expression levels of characteristic genes (Figure 8C). It revealed that both NUDT10 and NUDT11 are expressed in fibroblasts and epithelial cells (Figure 8D and E). Furthermore, LRRC32, TGFB2, TGFB3, and TGFBR1 all exhibited relatively high expression levels in fibroblasts (Figure 8F–I). Spatial mapping of gene expression onto H&E-stained tumor sections demonstrated expression of NUDT10 and NUDT11 in Sample 4, which presented the most extensive fibroblast infiltration along with concurrently elevated expression of LRRC32, TGFB2, TGFB3, and TGFBR1. Notably, the spatial distribution of characteristic gene expression overlapped with regions of fibroblast infiltration (Figure 8J–O).
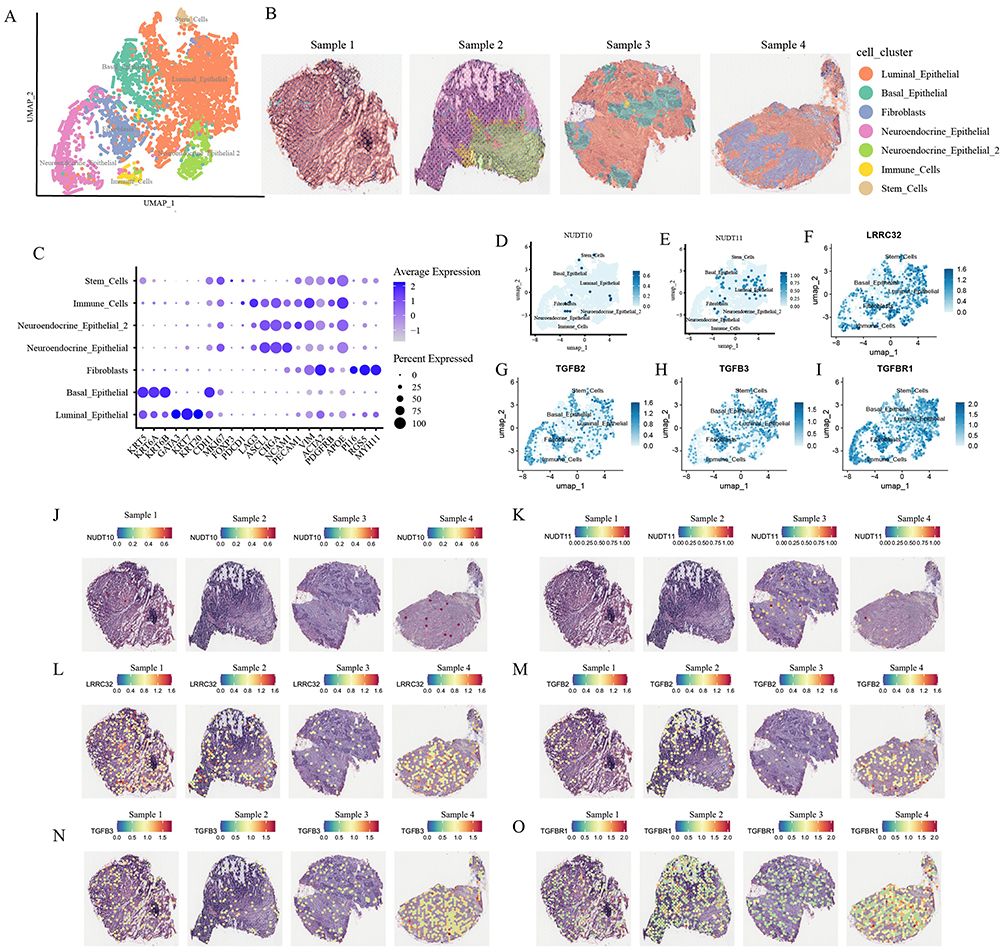 |
Figure 8 (A) Cluster diagram of cell types in bladder cancer spatial transcriptomics dataset GSE171351. (B) The spatial distribution of cell types in the four bladder cancer samples with H&E staining images. (C) The expression of characteristic genes in identified cell types. (D–I) Expression of NUDT10, NUDT11, LRRC32, TGFB2, TGFB3, and TGFBR1 in identified cell types. (J–O) Expression of NUDT10, NUDT11, LRRC32, TGFB2, TGFB3, and TGFBR1 in the tumor samples with H&E staining images. |
Knockdown of NUDT10 Suppresses the TGF-β Signaling and PD-L1 Expression
Since NUDT10 shows the highest correlation with the expression levels of TGF-β signaling signature genes, we further investigated its biological function in bladder cancer. NUDT10 expression was knocked down using siRNA, and the transfection efficiency was validated at both the mRNA and protein levels (Figure 9A and C). qRT-PCR confirmed that the expression levels of LRRC32, TGFB2, TGFB3, and TGFBR1 were significantly decreased in NUDT10-knockdown J82 cells (P < 0.05, Figure 9A). Furthermore, PD-L1 expression was also significantly reduced in the NUDT10 siRNA group compared with the si-NC group (P < 0.01, Figure 9B). Consistently, Western blot analysis confirmed reduced PD-L1 protein expression following NUDT10 knockdown (Figure 9C).
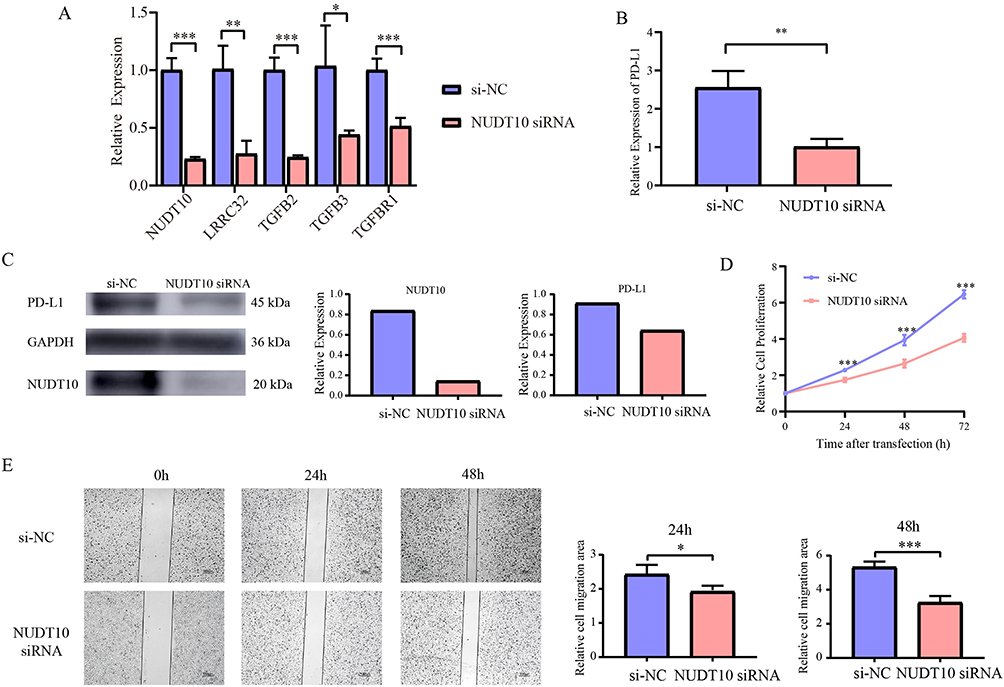 |
Figure 9 (A) The gene expression levels of NUDT10, LRRC32, TGFB2, TGFB3 and TGFBR1 in both NUDT10-knockdown and si-NC cell lines were evaluated by qRT-PCR. (B) The gene expression level of PD-L1 was detected by qRT-PCR. (C) Western blotting analysis was conducted to detect the expression of NUDT10 and PD-L1 in both NUDT10-knockdown and si-NC cell lines. (D) CCK-8 assay. (E) Wound healing assay. *, P < 0.05; **, P < 0.01; ***, P < 0.001. |
Knockdown of NUDT10 Inhibits Proliferation and Migration of Bladder Cancer Cells
The CCK-8 assay demonstrated that the proliferative capacity of J82 cells was significantly impaired after NUDT10 knockdown, with cell viability at 24, 48, and 72 h being lower than that in the si-NC group (P < 0.001, Figure 9D). Subsequently, wound healing assays revealed that the migratory ability of J82 cells was attenuated in the NUDT10 knockdown group, as evidenced by a significantly reduced percentage of wound closure area at 24 and 48 h compared with the si-NC group (Figure 9E).
Prediction of the lncRNA-miRNA-mRNA Interaction Network
A total of 149 differentially expressed miRNAs were identified between the C1 and C2 molecular clusters in the TCGA-BLCA dataset (Figure 10A). By querying the ENCORI/starBase database, miRNA-432 and miRNA-490 were found to be associated with NUDT10, while miRNA-369, miRNA-377, miRNA-380, miRNA-376b, miRNA-487a, miRNA-494, miRNA-495, miRNA-656, miRNA-770, miRNA-379, miRNA-411, and miRNA-1224 were associated with NUDT11 (Figure 10B). The expression levels of these miRNAs were positively correlated with NUDT10/NUDT11 (Figure 10C). Additionally, 62 differentially expressed lncRNAs were screened between the C1/C2 molecular clusters (Figure 10D). Database searches revealed associations between the above miRNAs and lncRNAs including XIST, MIR155HG, MIAT, UCA1, PART1, HCG11, and MEG3 (Figure 10E). Based on these associations, an lncRNA-miRNA-mRNA interaction network was constructed (Figure 10F).
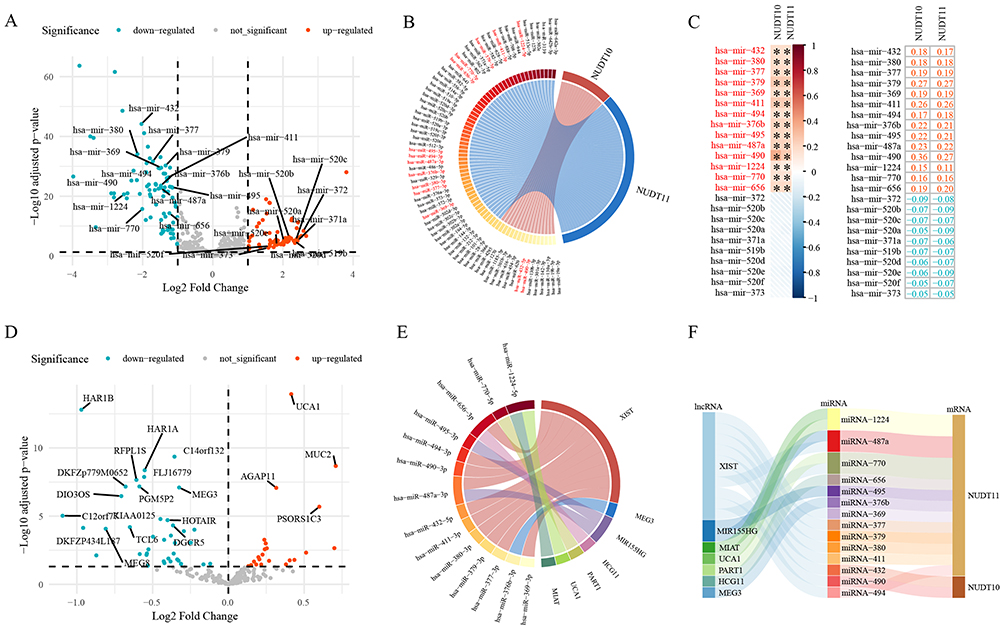 |
Figure 10 (A) Differentially expressed miRNAs between the C1 and C2 molecular clusters in the TCGA-BLCA dataset. (B) The differentially expressed miRNAs were associated with NUDT10 and NUDT11 in the ENCORI/starBase database. (C) Pearson’s correlation analysis of NUDT10/NUDT11 expression and key miRNAs. (D) Differentially expressed lncRNAs between the C1 and C2 molecular clusters in the TCGA-BLCA dataset. (E) The association of differentially expressed miRNAs and lncRNAs in the ENCORI/starBase database. (F) The lncRNA-miRNA-mRNA interaction network. *, P < 0.05. |
Discussion
This study analyzed the expression and biological functions of m7GRGs in bladder cancer. It established associations between m7GRGs and genes involved in anti-PD-L1 response and explored the underlying mechanisms. By leveraging the expression patterns of m7GRGs, bladder cancer molecular clusters were established, which exhibited differences in prognosis and tumor immune infiltration. The m7GRG NUDT10 effectively distinguished between bladder cancer molecular clusters and may be involved in regulating TGF-β signaling-mediated anti-PD-L1 response in advanced/metastatic bladder cancer.
NUDT10 and NUDT11 are paralogous genes. They are members of the nudix (nucleoside diphosphate linked moiety X)-type motif-containing family. NUDT10 and NUDT11 encode phosphohydrolase proteins, belonging to the nudix hydrolases (NUDTs), which catalyze the hydrolysis of various nucleoside diphosphates linked to other moieties.28 In recent years, studies have found that overexpression of NUDT10 and NUDT11 is associated with poor prognosis in tumors,29 but the underlying mechanisms remain unclear.
Recent studies have discovered that DNA and RNA methylation can directly interact to regulate gene transcription. Although DNA and RNA methylation belong to two distinct layers of gene regulation - epigenetics and epitranscriptomics, respectively, they collectively influence cellular functions in disease. For example, the RNA methyltransferase METTL3 has been shown to bind to CpG islands and promote DNA demethylation at nearby sites by recruiting the TET1 demethylase, thereby modulating transcription.30 This reflects the coordinated regulation of protein expression at the transcriptional and translational levels within cells. Our study revealed extensive differences in DNA CpG methylation levels between the C1 and C2 bladder cancer molecular clusters. Among these, the expression levels of some DMGs were associated with anti-PD-L1 response in bladder cancer. Functional enrichment analysis indicated that these DMGs are involved in pathways such as TGF-β signaling, FGFR signaling, Wnt signaling, and T-cell differentiation.
Anti-PD-1/PD-L1 therapy is recommended as part of first-line therapy for advanced bladder cancer.31 A previous study demonstrated that TGF-β activates fibroblasts in the tumor stroma, promoting extracellular matrix remodeling and forming a physical barrier that prevents CD8⁺ T cells from infiltrating the tumor, thereby diminishing the efficacy of ICIs treatment. Combined blockade of TGF-β and PD-L1 reversed this exclusion, enhanced T cell infiltration, and strengthened anti-tumor immunity.23 This highlights the critical regulatory role of TGF-β signaling in the response to ICIs treatment in bladder cancer. In our study, the C1 cluster with higher LRRC32 expression exhibited reduced infiltration of CD8⁺ T cells and activated dendritic cells, indicating an immunosuppressive tumor microenvironment. In addition to its role in regulating fibroblast function, TGF-β signaling is also a critical driver of M2 polarization of tumor-associated macrophages.32 We also found that C1 cluster exhibited enrichment of M2 macrophages and a reduction in M1 macrophages, which correlates with enhanced TGF-β signaling activity.
Correlation analysis of gene expression revealed a significant positive correlation between NUDT10/NUDT11, and the expression levels of LRRC32, a characteristic gene of the TGF-β signaling pathway. LRRC32, also known as GARP, is a key regulator of TGF-β signaling. It controls TGF-β activation by maintaining the cytokine in its latent form during storage in the extracellular space.33 LRRC32 anchors latent TGF-β at the cell surface and participates in its conformational change and activation process, thereby precisely regulating the signaling mode and immunomodulatory functions of TGF-β.34 scRNA-seq and spatial transcriptome analysis revealed an adjacent relationship between NUDT10 and LRRC32 at both the cellular and spatial localization levels. siRNA knockdown experiments showed that downregulation of NUDT10 decreased the expression of TGF-β pathway genes and PD-L1, providing preliminary evidence for the potential regulatory role of NUDT10 in TGF-β signaling. Moreover, in the validation dataset GSE176307, bladder cancer patients with high NUDT10 expression were more likely to develop resistance to anti-PD-L1 therapy and had a poor prognosis. Therefore, NUDT10 may regulate TGF-β signaling and play a role in ICB response.
ceRNA regulation may also serve as a regulatory mechanism for NUDT10/NUDT11 expression. A previous study has found that the lncRNA XIST participates in TGF-β-induced epithelial-mesenchymal transition (EMT).35 Another study showed that TGF-β can induce lncRNA MIR155HG to promote EMT.36 Besides, TGF-β2 upregulates lncRNA UCA1 to enhance cancer cell invasion and metastasis.37 Furthermore, miR-495,38 miR-379,39 miR-411,40 and miR-49441 were reported to be regulated by TGF-β signaling. Therefore, TGF-β signaling may regulate the expression of NUDT10/NUDT11 through the ceRNA network.
Through integrated multi-omics analyses encompassing genomics, transcriptomics, and epigenomics, study revealed that m7GRGs may be involved in the regulation of TGF-β signaling and influence the response to anti-PD-L1 treatment. However, this study has limitations. A causal relationship in which NUDT10 regulates TGF-β signaling and PD-L1 expression still cannot be established, and the underlying mechanisms require further experimental investigation.
Conclusion
This study identified distinct molecular clusters in bladder cancer based on the transcriptional profiles of m7GRGs, and identified NUDT10 as a key gene distinguishing these clusters. NUDT10 expression was elevated in bladder cancer and associated with poor prognosis. NUDT10 may regulate TGF-β signaling and participate in modulating the expression of PD-L1 in tumor cells. These findings are based on public database analyses and in vitro validation, and further confirmation using clinical specimens and functional studies is warranted.
Abbreviations
BLCA, Bladder Cancer; ceRNA, Competing Endogenous RNA; DMGs, Differentially Methylated Genes; EMT, Epithelial-Mesenchymal Transition; FGFR, Fibroblast Growth Factor Receptor; GEO, Gene Expression Omnibus; GO, Gene Ontology; H&E, Hematoxylin and Eosin; ICI, Immune Checkpoint Inhibitor; ICB, Immune Checkpoint Blockade; m7G, N7-Methylguanosine; m7GRG, m7G Methylation-Related Gene; NMF, Non-negative Matrix Factorization; OS, Overall Survival; qRT-PCR, quantitative real-time PCR; ROC, Receiver Operating Characteristic; scRNA-seq, Single-Cell RNA Sequencing; TCGA, The Cancer Genome Atlas; TGF-β, Transforming Growth Factor Beta.
Data Sharing Statement
The publicly available gene expression data used in the present study can be accessed from the TCGA website (https://portal.gdc.cancer.gov/) and GEO database website (https://www.ncbi.nlm.nih.gov/gds). IMvigor210 dataset can be acquire from the IMvigor210CoreBiologies R package (http://research-pub.gene.com/IMvigor210CoreBiologies).
Statement of Ethics
The study was approved by the Ethics Committees of The First Affiliated Hospital of Guangxi Medical University (No. 2025-E1069). Written informed consent from participants was not required in accordance with local guidelines.
Acknowledgments
We thank all the contributors of data involved in this study.
Funding
Guangxi Key Research and Development Program (No. GuikeFN2504240032); National Natural Science Foundation of China (No. 82160483); National Natural Science Foundation of China (No. 82400898); Guangxi Clinical Research Center for Urology and Nephrology, (No. GuikeAD20297081); Guangxi Science and Technology Base and Talent Project (No. GuikeAD20238090).
Disclosure
The authors have no conflicts of interest.
References
1. Bray F, Laversanne M, Sung H. et al. Global cancer statistics 2022: GLOBOCAN estimates of incidence and mortality worldwide for 36 cancers in 185 countries. CA Cancer J Clin. 2024;74(3):229–18. doi:10.3322/caac.21834
2. Siegel RL, Miller KD, Jemal A. Cancer statistics, 2018. CA Cancer J Clin. 2018;68(1):7–30. doi:10.3322/caac.21442
3. De Santis M, Palou Redorta J, Nishiyama H, et al. Durvalumab in combination with BCG for BCG-naive, high-risk, non-muscle-invasive bladder cancer (POTOMAC): final analysis of a randomised, open-label, Phase 3 trial. Lancet. 2025;406(10516):2221–2234. doi:10.1016/S0140-6736(25)01897-5
4. Hong X, Chen X, Wang H, et al. A HER2-targeted Antibody-Drug Conjugate, RC48-ADC, Exerted Promising Antitumor Efficacy and Safety with Intravesical Instillation in Preclinical Models of Bladder Cancer. Adv Sci. 2023;10(32):e2302377. doi:10.1002/advs.202302377
5. Necchi A, Joseph RW, Loriot Y, et al. Atezolizumab in platinum-treated locally advanced or metastatic urothelial carcinoma: post-progression outcomes from the Phase II IMvigor210 study. Ann Oncol. 2017;28(12):3044–3050. doi:10.1093/annonc/mdx518
6. Rosenberg JE, Hoffman-Censits J, Powles T, et al. Atezolizumab in patients with locally advanced and metastatic urothelial carcinoma who have progressed following treatment with platinum-based chemotherapy: a single-arm, multicentre, phase 2 trial. Lancet. 2016;387(10031):1909–1920. doi:10.1016/S0140-6736(16)00561-4
7. Dai Q, Moshitch-Moshkovitz S, Han D, et al. Nm-seq maps 2’-O-methylation sites in human mRNA with base precision. Nat Methods. 2017;14(7):695–698. doi:10.1038/nmeth.4294
8. Li HB, Tong J, Zhu S, et al. m(6)A mRNA methylation controls T cell homeostasis by targeting the IL-7/STAT5/SOCS pathways. Nature. 2017;548(7667):338–342. doi:10.1038/nature23450
9. Furuichi Y, LaFiandra A, Shatkin AJ. 5’-Terminal structure and mRNA stability. Nature. 1977;266(5599):235–239. doi:10.1038/266235a0
10. Lin S, Liu Q, Lelyveld VS, Choe J, Szostak JW, Gregory RI. Mettl1/Wdr4-Mediated m(7)G tRNA Methylome Is Required for Normal mRNA Translation and Embryonic Stem Cell Self-Renewal and Differentiation. Mol Cell. 2018;71(2):244–55.e5. doi:10.1016/j.molcel.2018.06.001
11. Ying X, Hu W, Huang Y, et al. A Novel tsRNA, m7G-3′ tiRNA Lys TTT, Promotes Bladder Cancer Malignancy Via Regulating ANXA2 Phosphorylation. Adv Sci. 2024;11(31):e2400115. doi:10.1002/advs.202400115
12. Chen C, Chao Y, Zhang C, et al. TROP2 translation mediated by dual m(6)A/m(7)G RNA modifications promotes bladder cancer development. Cancer Lett. 2023;566:216246. doi:10.1016/j.canlet.2023.216246
13. Ying X, Liu B, Yuan Z, et al. METTL1-m7 G-EGFR/EFEMP1 axis promotes the bladder cancer development. Clin Transl Med. 2021;11(12):e675. doi:10.1002/ctm2.675
14. Liu H, Zeng X, Ren X, et al. Targeting tumour-intrinsic N7-methylguanosine tRNA modification inhibits MDSC recruitment and improves anti-PD-1 efficacy. Gut. 2023;72(8):1555–1567. doi:10.1136/gutjnl-2022-327230
15. Liu W, Wang Y, Ulivi P, et al. A signature of five 7-methylguanosine-related genes is a prognostic marker for lung squamous cell carcinoma. J Thorac Dis. 2023;15(11):6265–6278. doi:10.21037/jtd-23-1504
16. Quarto G, Li Greci A, Bizet M, et al. Fine-tuning of gene expression through the Mettl3-Mettl14-Dnmt1 axis controls ESC differentiation. Cell. 2025;188(4):998–1018.e26. doi:10.1016/j.cell.2024.12.009
17. Deng X, Fan G. Tuning up gene transcription via direct crosstalk of DNA and RNA methylation. Mol Cell. 2025;85(4):674–676. doi:10.1016/j.molcel.2025.01.030
18. Zhang M, Song J, Yuan W, Zhang W, Sun Z. Roles of RNA Methylation on Tumor Immunity and Clinical Implications. Front Immunol. 2021;12:641507. doi:10.3389/fimmu.2021.641507
19. Tomikawa C. 7-Methylguanosine Modifications in Transfer RNA (tRNA). Int J Mol Sci. 2018;19(12):4080. doi:10.3390/ijms19124080
20. Deng J, Lin J, Liu C, et al. N7-methylguanosine methylation-related regulator genes as biological markers in predicting prognosis for melanoma. Sci Rep. 2022;12(1):21082. doi:10.1038/s41598-022-25698-x
21. Lee HW, Chung W, Lee HO, et al. Single-cell RNA sequencing reveals the tumor microenvironment and facilitates strategic choices to circumvent treatment failure in a chemorefractory bladder cancer patient. Genome Med. 2020;12(1):47. doi:10.1186/s13073-020-00741-6
22. Abdel-Hafiz HA, Schafer JM, Chen X, et al. Y chromosome loss in cancer drives growth by evasion of adaptive immunity. Nature. 2023;619(7970):624–631. doi:10.1038/s41586-023-06234-x
23. Mariathasan S, Turley SJ, Nickles D, et al. TGFβ attenuates tumour response to PD-L1 blockade by contributing to exclusion of T cells. Nature. 2018;554(7693):544–548. doi:10.1038/nature25501
24. Rose TL, Weir WH, Mayhew GM, et al. Fibroblast growth factor receptor 3 alterations and response to immune checkpoint inhibition in metastatic urothelial cancer: a real world experience. Br J Cancer. 2021;125(9):1251–1260. doi:10.1038/s41416-021-01488-6
25. Luecken MD, Theis FJ. Current best practices in single-cell RNA-seq analysis: a tutorial. Mol Syst Biol. 2019;15(6):e8746. doi:10.15252/msb.20188746
26. Yu J, Yu C, Jiang K, et al. Unveiling potential: urinary exosomal mRNAs as non-invasive biomarkers for early prostate cancer diagnosis. BMC Urol. 2024;24(1):163. doi:10.1186/s12894-024-01540-6
27. Deng X, Liu X, Hu B, Liu J, Fu B, Zhang W. Upregulation of MTHFD2 is associated with PD‑L1 activation in bladder cancer via the PI3K/AKT pathway. Int J Mol Med. 2023;51(6):51. doi:10.3892/ijmm.2023.5254
28. Malik A, Hept MA, Purcell EB. Sound the (Smaller) Alarm: the Triphosphate Magic Spot Nucleotide pGpp. Infect Immun. 2023;91:e0043222. doi:10.1128/iai.00432-22
29. Ren S, Cao W, Ma J, Li H, Xia Y, Zhao J. Correlation evaluation between cancer microenvironment related genes and prognosis based on intelligent medical internet of things. Front Genet. 2023;14:1132242. doi:10.3389/fgene.2023.1132242
30. Deng S, Zhang J, Su J, et al. RNA m(6)A regulates transcription via DNA demethylation and chromatin accessibility. Nat Genet. 2022;54:1427–1437. doi:10.1038/s41588-022-01173-1
31. Zhang C, Liu S, Zhang J, et al. A Multifunctional Fe-EGCG@RSL3 Nanomedicine Synergizes Ferroptosis Induction and Tumor Microenvironment Remodeling for Enhanced Bladder Cancer Immunotherapy. Research. 2025;8(6774):0735. doi:10.1126/science.adu2836
32. Gong D, Shi W, Yi SJ, Chen H, Groffen J, Heisterkamp N. TGFβ signaling plays a critical role in promoting alternative macrophage activation. BMC Immunol. 2012;13(1):31. doi:10.1186/1471-2172-13-31
33. Tran DQ, Andersson J, Wang R, Ramsey H, Unutmaz D, Shevach EM. GARP (LRRC32) is essential for the surface expression of latent TGF-β on platelets and activated FOXP3 + regulatory T cells. Proc Natl Acad Sci U S A. 2009;106(32):13445–13450. doi:10.1073/pnas.0901944106
34. Jin M, Seed RI, Cai G, et al. Dynamic allostery drives autocrine and paracrine TGF-β signaling. Cell. 2024;187(22):6200–19.e23. doi:10.1016/j.cell.2024.08.036
35. Li C, Wan L, Liu Z, et al. Long non-coding RNA XIST promotes TGF-β-induced epithelial-mesenchymal transition by regulating miR-367/141-ZEB2 axis in non-small-cell lung cancer. Cancer Lett. 2018;418:185–195. doi:10.1016/j.canlet.2018.01.036
36. Cui W, Meng W, Zhao L, Cao H, Chi W, Wang B. TGF-β-induced long non-coding RNA MIR155HG promotes the progression and EMT of laryngeal squamous cell carcinoma by regulating the miR-155-5p/SOX10 axis. Int J Oncol. 2019;54(6):2005–2018. doi:10.3892/ijo.2019.4784
37. Yang C, Li X, Wang Y, Zhao L, Chen W. Long non-coding RNA UCA1 regulated cell cycle distribution via CREB through PI3-K dependent pathway in bladder carcinoma cells. Gene. 2012;496(1):8–16. doi:10.1016/j.gene.2012.01.012
38. Miguel V, Ramos R, García-Bermejo L, Rodríguez-Puyol D, Lamas S. The program of renal fibrogenesis is controlled by microRNAs regulating oxidative metabolism. Redox Biol. 2021;40:101851. doi:10.1016/j.redox.2020.101851
39. Kato M, Chen Z, Das S, et al. Long non-coding RNA lncMGC mediates the expression of TGF-β-induced genes in renal cells via nucleosome remodelers. Front Mol Biosci. 2023;10:1204124. doi:10.3389/fmolb.2023.1204124
40. Sun M, Huang F, Yu D, et al. Autoregulatory loop between TGF-β1/miR-411-5p/SPRY4 and MAPK pathway in rhabdomyosarcoma modulates proliferation and differentiation. Cell Death Dis. 2015;6(8):e1859. doi:10.1038/cddis.2015.225
41. Maharati A, Akhlaghipour I, Taghehchian N, Farshchian Yazdi Z, Moghbeli M. Role of microRNA-494 in tumor progression. Am J Transl Res. 2023;15(11):6342–6361.
 © 2026 The Author(s). This work is published and licensed by Dove Medical Press Limited. The
full terms of this license are available at https://www.dovepress.com/terms
and incorporate the Creative Commons Attribution
- Non Commercial (unported, 4.0) License.
By accessing the work you hereby accept the Terms. Non-commercial uses of the work are permitted
without any further permission from Dove Medical Press Limited, provided the work is properly
attributed. For permission for commercial use of this work, please see paragraphs 4.2 and 5 of our Terms.
© 2026 The Author(s). This work is published and licensed by Dove Medical Press Limited. The
full terms of this license are available at https://www.dovepress.com/terms
and incorporate the Creative Commons Attribution
- Non Commercial (unported, 4.0) License.
By accessing the work you hereby accept the Terms. Non-commercial uses of the work are permitted
without any further permission from Dove Medical Press Limited, provided the work is properly
attributed. For permission for commercial use of this work, please see paragraphs 4.2 and 5 of our Terms.