")
Back to Journals » International Journal of Nanomedicine » Volume 18
MRI Directed Magnevist Effective to Study Toxicity of Gd-Doped Mesoporous Carbon Nanoparticles in Mice Model
Authors Zhang C, Shi C , Chang P, Bian S, Li B, Li J, Hou P
Received 25 August 2023
Accepted for publication 18 October 2023
Published 27 October 2023 Volume 2023:18 Pages 6119—6136
DOI https://doi.org/10.2147/IJN.S433213
Checked for plagiarism Yes
Review by Single anonymous peer review
Peer reviewer comments 2
Editor who approved publication: Dr Farooq A. Shiekh
Chun Zhang,1,2 Changzhou Shi,1 Pengzhao Chang,1 Shuang Bian,1,2 Bangbang Li,1 Jingjing Li,1,2 Pingfu Hou2,3
1School of Medical Imaging, Xuzhou Medical University, Xuzhou, 221004, People’s Republic of China; 2Department of Radiology, Affiliated Hospital of Xuzhou Medical University, Xuzhou, 221006, People’s Republic of China; 3Cancer Institute, Xuzhou Medical University, Xuzhou, Jiangsu, 221004, People’s Republic of China
Correspondence: Pingfu Hou; Jingjing Li, Email [email protected]; [email protected]
Purpose: Magnetic resonance imaging (MRI) has been a valuable and widely used examination technique in clinical diagnosis and prognostic efficacy evaluation. The introduction of MRI contrast agent (CA) improves its sensitivity obviously, particularly with the development of nano-CA, which presents higher contrast enhancement ability. However, systematical evaluation of their toxicity is still limited, hampering their further translation in clinics.
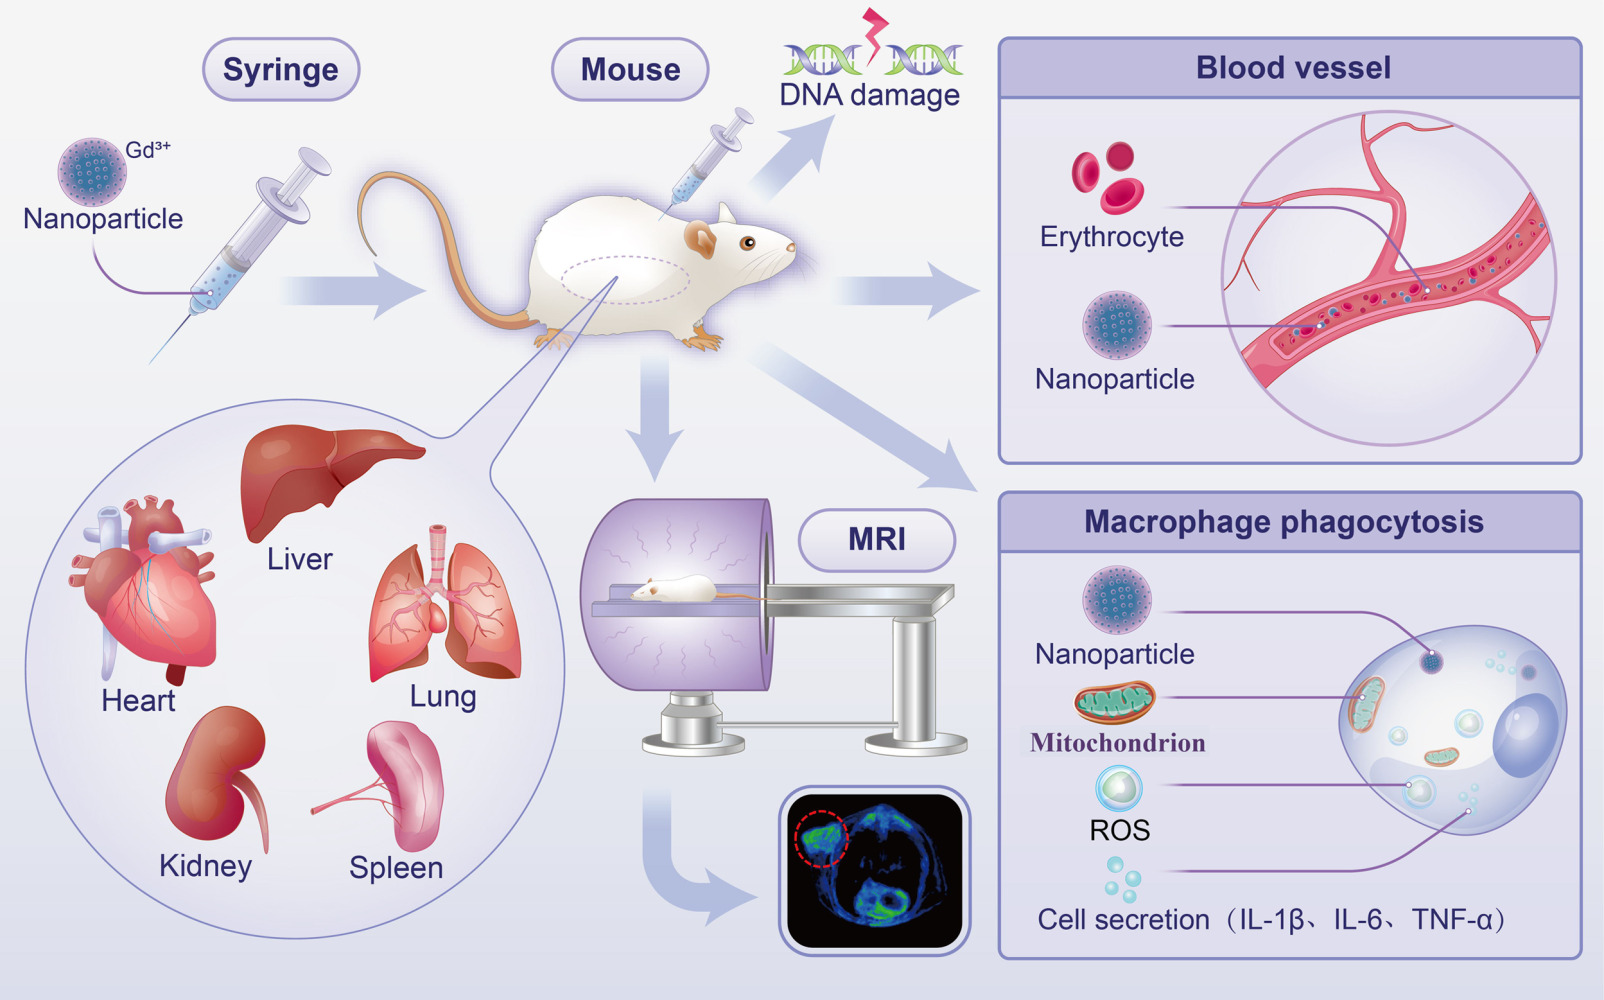
Methods: In this paper, to systematically evaluate the toxicity of nano-CA, Gd-doped mesoporous carbon nanoparticles (Gd-MCNs) prepared by a one-step hard template method were introduced as a model and clinically used MRI CA, Magnevist (Gd-DTPA) as control. Their in vitro blood compatibility, cellular toxicity, DNA damage, oxidative stress, inflammation response as well as in vivo toxicity and MR imaging behaviors were studied and compared.
Results: The experimental results showed that compared with Gd-DTPA, Gd-MCNs displayed negligible influence on the red blood cell shape, aggregation, BSA structure, macrophage morphology and mitochondrial function. Meanwhile, limited ROS and inflammatory cytokine production also illustrated the cellular compatibility of Gd-MCNs. For in vivo toxicity evaluation, Gd-MCNs presented acceptable in vivo biosafety even under 12 times injection for 12 weeks. More importantly, at the same concentration of Gd, Gd-MCNs displayed better contrast enhancement of tumor than Gd-DTPA, mainly coming from its high MRI relaxation rate which is nearly 9 times that of Gd-DTPA.
Conclusion: In this paper, we focus on the toxicity evaluation of MRI nano-CA, Gd-MCNs from different angles. With Gd-DTPA as control, Gd-MCNs appeared to be highly biocompatible and safe nanoparticles that possessed promising potentials for the use of MRI nano-CA. In the future, more research on the long-term genotoxicity and the fate of nanoparticles after being swallowed should be performed.
Keywords: MRI, nano-contrast agent, cytotoxicity, tissue toxicity, immunotoxicity
Graphical Abstract:
Introduction
Magnetic resonance imaging has become an effective and irreplaceable method for clinical diagnosis due to its good soft tissue contrast, lack of ionizing radiation and potential in molecular imaging. However, limited sensitivity is a major drawback of MRI.1 To solve this problem, MRI CAs have been introduced and developed, which can affect the relaxation rate of water molecules to improve the sensitivity of MRI. Gd-loaded CAs, that is T1-shortening agents, are preferred because they generate stronger contrast than T2-shortening agents. A variety of small molecules chelated with Gd3+ have been approved for clinical use, such as Magnevist (Bayer-Schering) and Gadovist (Bayer Healthcare). Gadolinium (Gd) (III) chelates, such as Magnevist (Gd-DTPA),2 were approved by the Food and Drug Administration (FDA) and European agencies in the late 1980s and are now widely used in clinical practice.3,4
However, Magnevist as a clinical MRI CA still shows some limitations, such as relatively low relaxation rate, short circulation time, and potential toxicity, including renal systemic fibrosis.5,6 As the most concerned security issue, kidney fibrosis, is the final common outcome of a wide variety of chronic kidney diseases. It is characterized by excessive deposition of extracellular matrix (ECM) that leads to tissue scarring.7 Renal fibrosis is of great concern because of its irreversible pathological process and it impairs renal function.
With the development of nanotechnology, nanomaterials have received more and more clinical attention for their superior properties, which makes nano-CA become a hot research topic. In recent years, a variety of nano-CAs have been reported for MRI, such as gold-bearing nanoparticles, Fe3O4@Au for multimodal imaging and photothermal therapy of tumors,8 manganese dioxide nanosheets,9 silica-based nanoparticles,10 and carbon-based nanomaterials (graphene,11 carbon nanospheres,12 and carbon quantum dots).13 However, few of them have been used in clinics, mainly because their biosafety is still not clear. Pei et al reported a ROS-responsive T1 CA (GA-Fe(II)-PEG-FA) and evaluated their cytotoxicity, hemolysis rate, blood routine and histology of major organs.14 A single-atom Gd nano-CA (Gd-SA) with excellent T1-weighted magnetic resonance enhancement was proposed by Zhang’s group. Their biocompatibility was also evaluated by cytotoxicity, hemolysis assay, blood biochemistry analysis and histological examination.15 Although most studies have conducted preliminary biosafety assessment on these nanoparticles, including MTT, blood routine, blood biochemistry and pathology, etc, this is still not enough for clinical transformation. Their blood compatibility,16 such as erythrocyte effect, conformation of plasma proteins and the phagocytosis of macrophages have not been covered. As MRI CAs, most of them are injected intravenously into the body.17 This means that the nano-CAs must pass through the blood circulation, stay in the plasma for a certain period of time, and then arrive at the corresponding tissue site. Therefore, it is important to evaluate their behavior in the blood and its effect on the blood composition. On the other hand, as a kind of foreign body, nanoparticles will be recognized by immune cells when entering human body and may trigger immune response,18 secrete inflammatory factors and trigger a series of inflammatory reactions, which might affect the function of normal cells. Thus, the immunotoxicity evaluation is also necessary. With the gradual deepening of NP research, more and more studies have shown that NP exposure might induce apoptosis.19,20 Thus, their influences on cell apoptosis, membrane damage, genetic toxicity, acute and chronic toxicity, as well as in vivo behaviors should be considered before their further biomedical applications.
To systematically evaluate the biosafety of MRI nano-CA, Gd-MCNs as the target were prepared by a one-step hard template method and they displayed excellent relaxation rate (39.044 mM−1s−1 Gd) to be used as MRI CA. In recent years, more and more researches have been conducted on hollow mesoporous carbon nanospheres,21,22 which have large surface area, three-dimensional pore structure, good adsorption and photothermal properties. Compared with traditional Gd agent, the magnetic resonance relaxation rate of Gd-MCNs is greatly improved, and the circulation time in vivo is prolonged.23 Such improvement of its performance illustrated the promising potential in future MRI. However, the cytotoxicities of carbon nanomaterials still remain controversial. Herein, with Gd-DTPA as control, the biosafety of Gd-MCNs was systematically evaluated from the perspectives of blood, immunity, genetics, acute and chronic toxicity, etc.
Materials and Methods
Materials
Lipopolysaccharide (LPS, CAS No: 82857-67-8) was supplied by Sigma-Aldrich (USA). Mouse IL-6 ELISA kit (SEKM-0007), Mouse IL-1β ELISA kit (SEKM-0002) and Mouse TNF-α ELISA kit (SEKM-0034) were purchased from Beijing Solarbio Science & Technology Co., Ltd. (Beijing, China). 2′,7′- Dichlorodihydrofluorescein diacetate (DCFH-DA, MB4682-1) was purchased from Dalian Meilun Biotechnology Co., Ltd. (Dalian, China). Annexin V-FITC Apoptosis Detection Kit (KGA108-2) was purchased from Jiangsu KeyGEN BioTECH Co., Ltd. (Nanjing, China). MTT Cell Proliferation and Cytotoxicity Assay Kit (C0009S), LDH Cytotoxicity Assay Kit (C0016) and Mitochondrial Membrane Potential Assay Kit with JC-1 (C2006) were obtained from Beyotime (Jiangsu, China). VicGelRed nucleic acid dye (VN302) was obtained from Vicmed (Beijing, China).
All the experiments in this study were approved by the Animal Experimental Center of Xuzhou Medical University. The cell lines (RAW264.7, 786-0 and NIH-3T3) used in this study were purchased from the Cell Bank of the Chinese Academy of Sciences (Shanghai, China).
Characterization of Gd-Doped Mesoporous Carbon Nanoparticles in Mouse Plasma
The hydrodynamic diameters of Gd-MCNs were measured by dispersing Gd-MCNs in PBS or 10% FBS for 1, 3, 5, 7, 9, 11, 13, and 15 d using NanoZS90 zeta potential analyzer (Malvern, England). The MRI signal stability of Gd-MCNs in PBS was also investigated at 37 °C using MRI (GE discovery 750 W, USA) with the same sample preparation as above.
Influence on Hemolysis Rate and Erythrocyte Morphology
The blood of Kunming mice was collected from the eyeball to prepare 2% red blood cell suspension. Gd-MCNs and Gd-DTPA were co-incubated with 2% red blood cell suspension at room temperature for 2 h with different concentrations (0, 2.8, 5.6, 7.0, 8.4, 14.0 μM Gd), respectively, and the supernatant was collected after centrifugation to measure its absorbance.21 Hypertonic solution and hypotonic solution were used as positive controls, and the red blood cells after different treatments were precipitated by centrifugation. The obtained cells were then fixed with glutaraldehyde, and their morphologies were observed under scanning electron microscopy (JEOL Ltd, Akishima, Japan).
Influence on Conformation of Plasma Proteins
0.1 mg/mL BSA was co-incubated with Gd-MCNs or Gd-DTPA for 2 h. The supernatant was collected after centrifugation, and its absorbance was determined by UV-vis (HITACHI UH4150, Hitachi, Japan) and CD circular dichrometry (JASCO J-815, Japan).
The Phagocytosis by Macrophages
Gd-MCNs was co-incubated with RAW264.7 for 4 h, and the supernatant was discarded. After washed with PBS and digested with 2.5% trypsin, the cells were collected by centrifugation, and fixed with glutaraldehyde overnight. The internal structure of the cells was observed by transmission electron microscope (JSM-5600LV, JEOL, Japan).
MTT Detection
RAW264.7 and NIH-3T3 cells were inoculated into 96-well plates and placed in an incubator at 37 °C until the cells grew to about 70%. Gd-MCNs and Gd-DTPA with different concentrations (0, 2.8, 5.6, 7.0, 8.4, 14.0 μM Gd) were added to the cells and cultured for 24 h. The supernatant was discarded, and the cells were washed twice with PBS. DMEM containing 1 mg/mL MTT was then added and incubated for another 4 h. After discarding the medium, dimethyl sulfoxide (DMSO) was added. The absorbance of the supernatant at 490 nm was measured with the microplate reader (Multiskan MK3, Thermo, USA).
Influence on Cell Apoptosis
RAW264.7 cells were inoculated on 6-well plates and cultured overnight at 37 °C. The cells were then co-incubated with Gd-MCNs, Gd-DTPA or DOX for 4 h. After washed with PBS for three times, the cells were stained with AnnexinV-FITC and Propidium Iodide (PI) and detected by flow cytometry (FACS Canto II, BD, USA).
Detection of Mitochondrial Membrane Potential
RAW264.7 cells were inoculated on a 6-well plate, and when the cells stuck to the wall, Gd-MCNs or Gd-DTPA solutions were added, with carbonyl cyanide 3-chlorophenylhydrazone (CCCP) as the positive control. The cells were incubated for 4 h, and the supernatant was discarded. Then, 1 mL of 5,5’,6,6’- tetrachloro −1,1’3,3’- tetraethyl-imidazolcarbocyanine iodide (JC-1) staining solution was added to each well and cultured for 20 min at 37 °C. After discarding the supernatant, the cells were washed with JC-1 staining buffer twice and cultured in 2 mL cell culture for imaging under Fluorescence Microscope (DMI3000B, Leica, Germany).
Detection of Lactic Dehydrogenase (LDH) Release
RAW264.7 cells were inoculated on 96-well plate. When the cells grew to about 70%, Gd-MCNs, Gd-DTPA and DOX were added, respectively, and cultured for 4 h. After discarding the supernatant, LDH release agent was added, and incubated at 37 °C for 1 h. Then, 120 μL of supernatant was taken out and added to a new 96-well plate (n = 3). Their absorbance at 490 nm was detected by microplate reader (Multiskan MK3, Thermo, US).
Detection of ROS Generation
RAW264.7 cells were inoculated on a 6-well plate, and when the cells were attached to the wall, Gd-MCNs, Gd-DTPA (7.0 μM Gd) and LPS (5 μg/mL) were added, respectively, and cultured for 12 h. DCFH-DA was diluted in serum-free medium at 1:1000 to a final concentration of 10 μmol/L. After removing the cell culture solution, 1 mL of diluted DCFH-DA was added to each well and co-cultured in the cell incubator at 37 °C for 20 min. The cells were washed three times with serum-free cell culture solution to adequately remove DCFH-DA that did not enter the cells. The intracellular ROS generation was observed by Inverted Fluorescence Microscope (DMI3000B, Leica, Germany).
Detection of Cytokine Release
RAW264.7 cells were inoculated into a 6-well plate with a density of about 50,000 cells/mL and cultured overnight. They were then co-incubated with Gd-MCNs and Gd-DTPA (7.0 μM Gd) for 24 h, and LPS (5 μg/mL) was used as the positive control (n = 3). After incubation, the supernatant was collected and diluted for the detection of cytokines (IL-1β, IL-6 and TNF-α) by ELISA kit. The absorbance values of the supernatant at 450 nm were detected by microplate reader.
DNA Damage Test
Fifty microliters of 0.5% common melting point agarose was spread on frosted slide to form a rubber base. One hundred and fifty microliters of 0.5% ordinary melting point agarose was added to the rubber substrate, then a cover glass was covered, and cooled at 4 °C for 10 min. After removing the cover glass, the mixture of 50 μL of 1.0% low melting point agarose and 50 μL RAW264.7 cell suspension (105/mL) was tiled immediately, then a cover glass was covered, and the mixture was cooled at 4 °C for 10 min. After removing the cover glass, 50 μL 0.5% low melting point agarose was tiled; then, a cover glass was covered, and the mixture was cooled at 4 °C for 10 min. After removing the cover glass, the mixture was cracked at 4 °C for 1 h. The rubber plate electrophoresis was performed at 4 °C for 20 min (25 V, 300 mA). The glue plate was taken out, and 5 μg/mL PI was added for staining. It was placed in the dark for 20 min and then decolorized with distilled water for 15 min.24 Observation and recording were made by Fluorescence Microscope.
Animals
Animal experiments were conducted according to the guidelines of the National Institutes of Health on the use of animals in research. All animal experiments were approved by the Animal Care Committee of Xuzhou Medical University (L202211S024). All animals were acclimatized for 1 week before the experiment in an animal room with standardized temperature (25–28 °C), humidity (50–60%), and a 12 h light/dark cycle. The animals were fed with different standard diets and given sterile water. Kunming mice (8–10 weeks old, weight of 25–35 g) were obtained from the Animal Experiment Center of Xuzhou Medical University and maintained in a specific pathogen-free environment. Balb/c mice were subcutaneously injected with 786–0 renal carcinoma cells (5 × 10⁶ in 100 μL PBS) to construct tumor mouse model.
Determination of Blood Half-Life Circulation
The half-life of Gd-MCNs in the blood circulation was determined by ICP-MS in Kunming white mice (50% males and 50% females). Peripheral blood (10 μL) was collected from the tail vein with heparin sodium (90 μL) in separate Eppendorf tubes at 5, 30, 60, 120, 240, 360, 720 min after tail-vein administration of Gd-MCNs (5mg/kg). The Gd amount in each sample was determined by inductively coupled plasma-optical emission spectroscopy (ICP-MS, Thermal Elemental) (Inductively coupled plasma parameters: Radio frequency power = 1550 W, Cooling gas flow = 18 L/min, Auxiliary gas flow = 1.2 L/min, Carrier gas flow = 1.08 L/min; Detection parameter: Resolution (10% peak height) = 0.7 ± 0.01u. Measurement method: jump peak, Measuring point/peak = 3, Integration time = 0.1 s/point, Mass spectrometer parameter: Vacuum degree = 6.58 × 10⁻⁶ Torr, Deflection voltage = −10 V, Radio frequency voltage = 200 V.). Half-life was calculated according to the obtained Gd concentration with the time passing by.
Evaluation of Acute Toxicity
Studies were conducted to investigate whether Gd-MCNs have acute toxicity. Twelve mice were divided into three groups, which were injected with normal saline, Magnevist or Gd-MCNs via the tail vein, respectively. Then, they were observed over 72 h for signs of acute toxicity, including the general appearance of the eyes, skin, fur and tremor, convulsion, imbalance while walking, paralysis, agitation and respiratory difficulty.
Biodistribution in the Mouse
For the biodistribution study of Gd-MCNs in the mouse, the Gd contents in the heart, lung, liver, spleen, and kidney were measured by ICP-MS at 12 h after Gd-MCNs injection (5mg/kg). Each tissue sample (0.1 g) was homogenized in 200 μL ultrapure water, and then the homogenate solution was centrifuged for 10 min at 10,000 rpm. Finally, the content of gadolinium in the supernatant was analyzed by ICP-MS after being digested by HNO3.
Histological Studies
Kunming mice were divided into three groups (Normal saline, Gd-MCNs and Gd-DTPA). The mice in the latter two groups were injected with Gd-MCNs or Gd-DTPA via the tail vein (5mg/kg). After 72 h or 12 weeks, the heart, lung, liver, spleen and kidney in the three groups were obtained and fixed in 10% formalin accordingly. All tissue samples were dehydrated through xylene and graduated alcohol and stained with hematoxylin and eosin (H&E) for evaluation using a standard light microscope. Specific steps for H&E were listed below. The tissue samples section was placed in the iron hematoxylin dye solution, and the nucleus was blue after staining. The section was treated with hydrochloric acid differentiation solution. Then, the section was treated with ammonia to invert the nuclear dye to make the nucleus more visible. Next, the section was placed in eosin dye solution, and the cytoplasm was red after staining. Rinse the dye solution off the slice with running water to reduce background noise and color interference.25,26 For 12 weeks observation, Gd-MCNs or Gd-DTPA were injected once a week with a total of 12 times injection.
Biochemical Determination of Hepatic and Renal Functions
For the plasma analyses study, Kunming mice were divided into three groups: normal saline group, Magnevist (Gd-DTPA) group and Gd-MCNs group. The mice were injected with normal saline, Magnevist or Gd-MCNs via the tail vein (5 mg/kg), respectively. After 72 h or 12 weeks, blood was harvested by cardiac puncture. Afterwards, plasma was obtained by centrifugation. Important biochemical index for the liver, including alanine aminotransferase (ALT) and aspartate aminotransferase (AST), and kidney, including UREA and CREA, was measured on a Hitachi 747 Chemistry Analyzer with Boehringer Mannheim Corporation (Roche, Indianapolis, Indiana, USA) reagents. For 12 weeks observation, Gd-MCNs or Gd-DTPA were injected once a week with a total of 12 times injection.
In vivo Metabolic Study
After the Kunming mice were anesthetized with 4% chloral hydrate, the limbs and tail of the mice were fixed on the special magnetic resonance coil of mice with medical tape. The mice were injected with 200 µL of Gd-MCNs (0.5 mg/mL) via the tail vein, and the MRI scannings were performed at different time points (0, 15 min, 0.5 h, 1 h, 2 h, 4 h, 8 h, and 12 h, respectively). The T1 signal strength values of different parts at different time points were measured on AW 4.6 post-processing workstation. Gradient echo sequence scanning was adopted, and the parameters were TR = 16 ms, TE = 3.2 ms, FOV = 8 cm × 8 cm, matrix = 320 × 288, layer thickness = 1.0 mm, and layer spacing = 0.5 mm.
Imaging Performance Comparison
4T1 cells in good growth state were collected and prepared into single-cell suspension (107/mL). The right back of Balb/c female mice that had been accommodated for one week was treated with hair removal, then disinfected with 75% alcohol. Two hundred microliters of cell suspension was injected into the subcutaneous soft tissue. The subcutaneous graft tumor of breast cancer grows about 100 mm3. The mice were anesthetized with 4% chloral hydrate, and the limbs and tail of the mice were fixed on the special magnetic resonance coil with medical tape. The mice were divided into two groups. T1 sequence MRI scanning was performed at 0, 1, 4, 8, and 12 h post-injection of 200 µL Gd-MCNs and Gd-DTPA (0.5 mg/mL Gd) via the tail vein. The T1 signal strength values of different parts at different time points were measured on AW 4.6 post-processing workstation.
Statistical Analysis
All statistical analyses were performed with SPSS (version 16.0; SPSS, Chicago, IL). The results were expressed as the means ± SD for the groups. Data were analyzed by one-way ANOVA and least-significant different tests between groups. Comparisons between the control group and other groups were performed using the One-Way ANOVA and Dunnett’s tests. For all analyses, if P<0.05, the results were considered significantly different. The smaller the P-value, the more significant the difference between the groups is and P< 0.001 showed the experimental data have strong statistical power.
Results
The biosafety evaluation is vital for new nano-CAs to medical use. However, due to the diversity of NPs themselves in terms of structure and properties, as well as the different toxic endpoints observed at different biological levels, the results assessed using different evaluation models might be different or even contradictory. Thus, systematical preclinical toxicity studies are still necessary. With Gd-MCNs as target and Gd-DTPA as control, the related blood compatibility, in vitro cellular toxicity, DNA damage, oxidative stress, inflammation responses as well as in vivo toxicity were performed.
Characterization and in vitro Stability Test
To be used as an MRI CA model, Gd-MCNs were prepared by a one-step hard template method, with TEOS as silicon source, resorcinol and formaldehyde as carbon source, and Gd-Si-DTTA as Gd source.27 Different from traditional hard template, which need to prepare hard template first and then repeated filling of template holes, the one-step hard template method realized the Gd doping and carbon filling at the same time. The morphology and nanostructure of Gd-MCNs were firstly observed by TEM. As shown in Figure 1A, the shape of the synthesized Gd-MCNs was hollow and spherical, and it exhibited good dispersibility and uniform size distribution with an average diameter of 150 nm. Gd doping enabled them to be used as MRI CA. The MR signals in the T1-weighted MR images became brighter along with the increase of Gd-MCNs concentration from 0.035 mM to 0.1136 mM, indicating their concentration-dependent MR contrast effect (Figure 1B). The longitudinal MR relaxation rate (r1) was calculated to be 39.044 mM−1s −1, which was 9 times that of Gd-DTPA (4.2 mM−1s −1) (Figure 1C), showing their potential as MRI nano-CA. Then, their colloidal stability and MRI signal stability in the plasma were evaluated. The colloidal stability of nanoparticles is of crucial importance as it may affect biodistribution, metabolization, toxicity and so on. The hydrodynamic diameters of nanoparticles are commonly employed to evaluate the colloidal stability of NPs. As shown in Figure 1D, the hydrodynamic diameters of Gd-MCNs in PBS and 10% FBS did not change significantly within 15 days, indicating the excellent colloidal stability of Gd-MCNs. The time-dependent curve of the MR signal intensity of Gd-MCNs under 4 °C conditions showed that with the extension of storage time, there was no significant change in the MR signals with the time passing by (Figure 1E).
 |
Figure 1 (A) TEM image of Gd-MCNs; (B) T1-weighted and pseudo color image of Gd-MCNs with various concentrations; (C) T1 relaxivity determination of Gd-MCNs; (D) the hydrodynamic diameter changes of Gd-MCNs in PBS and 10% FBS with time passing by; (E) MRI signal intensity change of Gd-MCNs during 15 days. The scale bar illustrates 200 nm. |
Blood Compatibility Study
Hemolysis rate and morphologic changes of red blood cells are the key indicators to evaluate the blood compatibility of nanomaterials when they enter the blood. Gd-MCNs were co-incubated with red blood cells in vitro to observe their influence on red blood cells. As shown in Figure 2A, similar to Gd-DTPA, the hemolysis rate of Gd-MCNs was below 3% when Gd concentration was between 0 and 14 μM. Additionally, the red blood cells remained the shape of double concave disc, and no obvious aggregation occurred (Figure 2B). On the contrary, the red blood cells in the positive control group (hyperosmotic solution) were crinkled and tentacles were formed on the cell surface. Cells incubated with hypotonic solution showed incomplete cell membranes and local breakage.
 |
Figure 2 (A) Hemolysis rates of red blood cells in Gd-MCNs and Gd-DTPA solutions with different concentration and the corresponding picture (insert); (B) SEM images of red blood cells incubated with normal saline, Gd-MCNs, 0.45% NaCl (hyperpermeable) and 1.35% NaCl (hypopermeable); UV-vis absorbance spectra (C) and circular dichroism (D) of BSA, BSA + Gd-MCNs and BSA + Gd-DTPA; (E) TEM images of macrophage phagocytosis before and after incubation with Gd-MCNs. The red arrows indicate the internalized Gd-MCNs. |
In addition, when foreign nanoparticles enter the bloodstream, they first interact extensively with proteins in the plasma. Albumin is an important drug-binding protein in plasma. It is also the plasma protein with the highest content. It can combine with acidic, alkaline and neutral drugs to further affect drug transport, metabolism and other processes.28 The influence of nanomaterials on the conformation of BSA might reflect their blood compatibility. Thus, we incubated Gd-MCNs with BSA to detect the changes of UV absorption spectrum and circular dichroism (CD) of BSA. As shown in Figure 2C, an obvious absorption peak of BSA at 280 nm was observed in the presence of 50 μg/mL Gd-MCNs with no significant transverse shift of the absorption peak, which was similar to that of pure BSA solution and Gd-DTPA co-incubated solution. Two negative peaks were found at 208 nm and 224 nm in CD spectrum, both of which are characteristic of the α-helical structure in the secondary structure of BSA. After co-incubation with Gd-MCNs, the characteristic absorption peaks of BSA were basically coincided with that of pure BSA (Figure 2D). The similar results in both UV absorption spectrum and CD spectrum indicated that compared with the clinical CA Gd-DTPA, Gd-MCNs did not cause significant changes in the conformation of plasma proteins, showing their good blood compatibility.
Except the interaction with plasma proteins, nanoparticles entering the body as an exogenous substance will be recognized and phagocytosed by the immune system. Macrophages are the earliest and most sensitive cells in the immune response.29 Furthermore, nanoparticle-induced immune responses, such as the effects on cellular uptake, cellular viability, and the induction of inflammation, were mainly occurred in macrophages. Thus, macrophage phagocytosis and the following influence of cell morphology were evaluated by the co-incubation of Gd-MCNs with macrophages. As shown in Figure 2E, Gd-MCNs could be uptaken by RAW264.7 cells and existed in the cytoplasm in the form of vesicles, remaining the intact morphology of the cell membrane and nuclear membrane.
Cytotoxicity Test
We conducted their toxicity verification on the cells from multiple angles. Considering the MRI requirement, the cytotoxicity evaluations were performed in the range of 0 −14 μM Gd because a good comparison effect can be achieved at 50 μg/mL (Gd concentration is 7.0 μM) in vivo. Firstly, the influence of Gd-MCNs on cell viability of RAW264.7 and NIH-3T3 cells was studied by MTT assay. As shown in Figure 3A and B, cell viabilities of RAW264.7 and NIH-3T3 were all above 80% no matter in the presence of Gd-MCNs or Gd-DTPA with a range of 0 −14 μM Gd. Then, the live-death experiment was introduced to evaluate the cell survival rate after exposure to Gd-MCNs or Gd-DTPA with daunomycin as positive control. Compared with control, only a few cells died when incubated with Gd-MCNs or Gd-DTPA. However, the dead cells did not show significant difference between Gd-MCNs and Gd-DTPA with the same Gd concentration (Figure 3C and D).
 |
Figure 3 Cell viability of RAW264.7 (A) and NIH-3T3 (B) co-incubated with different concentrations of Gd-MCNs and Gd-DTPA; Fluorescence images (C) and the corresponding green fluorescence intensity (D) of RAW264.7 cells stained by Calcein-AM and PI after different treatments; (E) flow cytometry of RAW264.7 cells with different treatments; (F) LDH leakage of RAW264.7 cells after co-incubation with Gd-MCNs or Gd-DTPA; fluorescence imaging (G) and semi-quantitative analysis (H) of mitochondrial membrane potential in RAW64.7 cells after co-incubation with Gd-MCNs and Gd-DTPA. *P < 0.05, **P < 0.01. |
Later, macrophage apoptosis experiment was further used to verify their influence on cell damage. As shown in Figure 3E, after different treatments, the early apoptosis rates of macrophages in control group, Gd-MCNs group, and Gd-DTPA group were 2.26%, 1.83%, 2.35%, and the late apoptosis rates were 5.34%, 7.33%, 11.3%, respectively. For DOX group, the cells were almost dead with a survival rate of only 0.32%. The results indicated that cell apoptosis induced by Gd-MCNs did not increase significantly, and the proportion of cell premature and late dying was even lower than that of the clinically used CA, Gd-DTPA, indicating an excellent biosafety of Gd-MCNs to cells.
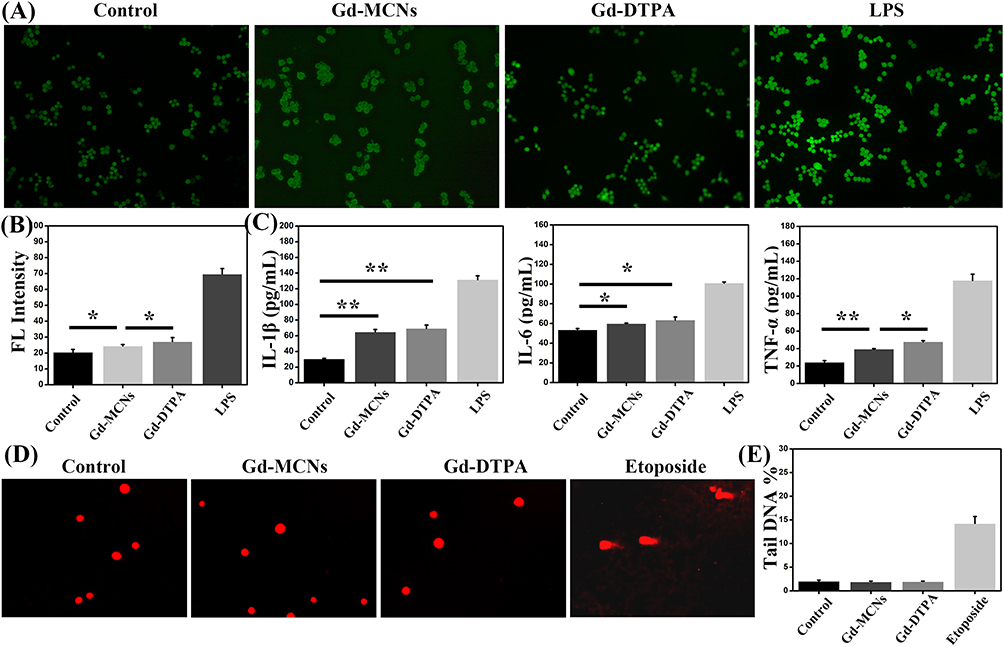 |
Figure 4 Fluorescence detection (A) and semi-quantitative analysis (B) of ROS production in RAW264.7 cells after co-incubation with Gd-MCNs or Gd-DTPA; (C) the release of IL-1β, IL-6 and TNF-α in RAW264.7 cells after different treatments; Fluorescence detection (D) and semi-quantitative analysis (E) of DNA damage in RAW264.7 cells after different treatments. *P < 0.05, **P < 0.01. |
Lactate dehydrogenase is an extremely stable cellular enzyme, which exists in the cytoplasm of normal cells. Once the cell membrane damaged, LDH will be released outside the cell.30 Therefore, LDH release experiment was used to analyze the integrity of the cell membrane and judge the degree of cell damage. Compared with the negative control group, LDH release amount in Gd-MCNs group was significantly increased. However, such release in Gd-MCNs group was relatively lower than Gd-DTPA group (P = 0.017, P<0.05), indicating that Gd-MCNs may lead to the increase of partial cell membrane permeability, resulting in the release of LDH outside the cell (Figure 3F). However, such destruction might not cause serious cell damage and considering the result in clinical Gd-DTPA group, Gd-MCNs presented acceptable cytotoxicity.
The change of mitochondrial membrane potential plays a core role in the process of apoptosis and necrosis of cells. Thus, the mitochondrial membrane potential was also detected to observe the damage of materials to mitochondria for the evaluation of early cell apoptosis. Mitochondrial staining was observed under a fluorescence microscope after cell co-incubation for 4 h, and the results are shown in Figure 3G and H. The majority of JC-1 existed in the form of polymer in the mitochondria of normal cells. When incubated with Gd-MCNs and Gd-DTPA, the green fluorescence basically did not increase, indicating that the mitochondria were in good condition in Gd-MCNs or Gd-DTPA treated RAW264.7 cells, while the strong green fluorescence emissions were observed in CCCP positive control group showing the damage of mitochondria.
Cellular Oxidative Stress and Inflammatory Response Studies
ROS generation is regarded as a characteristic of cellular response to nanomaterials because ROS is involved in non-specific oxidation, causing damage to macromolecules, impairs their function and triggers stress response mechanisms and commonly precedes other cellular responses. NP-induced ROS results, in part, from mitochondrial dysfunction and activation of stress-related cell signaling pathways, as well as DNA damage, that results in cell cycle arrest and apoptosis.20 The ROS production in macrophages stimulated by Gd-MCNs and Gd-DTPA was detected with LPS-treated macrophages as positive control. As shown in Figure 4A and B, compared with the negative control group, macrophages co-incubated with Gd-MCNs produced a significant increased green fluorescence emission from ROS, which was a little weaker than that of Gd-DTPA (P = 0.0347, P < 0.05). The strong green fluorescence emissions in LPS-treated RAW264.7 illustrated the mass ROS production and inflammation occurrence.
Then, inflammatory cytokines, a family of cytokines that can regulate the immune system bidirectionally, were further detected in RAW264.7 cells with different treatments. They are mainly involved in the differentiation and activation of immune cells. The occurrence of inflammation is often accompanied by the massive secretion of IL-1β and IL-6, and overexpression of TNF-α will promote the production of IL-1β and IL-6 and other factors.31 In order to understand the expression levels of inflammatory factors, the contents of proinflammatory cytokines in macrophage supernatant after incubation with different materials were determined by ELISA kit. As illustrated in Figure 4C, both Gd-MCNs and Gd-DTPA increased the secretion of the above three inflammatory factors, but there was no significant difference in the secretion of IL-1β and IL-6 between Gd-MCNs group and Gd-DTPA group (PIL-1β = 0.169, PIL-6 = 0.231, P > 0.05), and the secretion of TNF-α in Gd-MCNs group was lower than that in Gd-DTPA group (PTNF-α = 0.024, P<0.05). Although our fabricated Gd-MCNs showed a certain increase in inflammatory factors secretion, it was lower than Gd-DTPA with a clinical dosage.
DNA Damage Assessment
Except the evaluation of organelle toxicity, genotoxicity study was also conducted. Long-term exogenous stimulations into the nucleus, which are not effectively cleared, will cause DNA damage. If the DNA damage is not repaired in time, it will affect the function or survival of cells, resulting in apoptosis, mutation, senescence, and even malignant cell changes.32 Thus, single-cell gel electrophoresis experiment, namely “comet experiment”, was conducted in vitro to detect whether DNA damage occurs in macrophages after co-incubated with Gd-MCNs or Gd-DTPA. Under alkaline conditions, the DNA double helix was damaged, and in the injured cells, DNA fragments were more likely to migrate to the anode and form a tail during electrophoresis. RAW264.7 cells treated with etoposide as a positive group presented a tail during electrophoresis, while no obvious tailing phenomena were observed in both Gd-MCNs and Gd-DTPA group, indicating that the two materials would not cause damage to genetic material (Figure 4D and E). All the above in vitro experimental results demonstrated that Gd-MCNs displayed weak influence on the morphology, survival, apoptosis, inflammatory reaction, and DNA damage of RAW264.7 cells, which is comparable and even better than Gd-DTPA, showing the excellent biocompatibility of Gd-MCNs to cells.
Animal Studies in vivo
Acute and Chronic Toxicity Tests
Based on the excellent cellular biocompatibility in vitro, the in vivo behaviors of Gd-MCNs were further studied. Acute and chronic toxicity tests were first carried out in adult Kunming mice. Gd-MCNs or Gd-DTPA were single injected into mice via caudal vein, with normal saline as the negative control. After 72 h, blood routine and blood biochemistry tests were performed. As shown in Figure 5A, compared with control, there was no statistical significance in each index of Gd-MCNs or Gd-DTPA (P > 0.05). At the same time, the treated mice were dissected. Paraffin sections and H&E staining were performed on their main organs (heart, liver, spleen, lung and kidney), and histological analysis was conducted. No significant inflammation, tissue pathological abnormalities or lesions were found in the mouse sections after a short-term single injection of Gd-MCNs or Gd-DTPA, which proved that there was no obvious acute toxicity after a short-term single injection of nano-CA (Figure 5B).
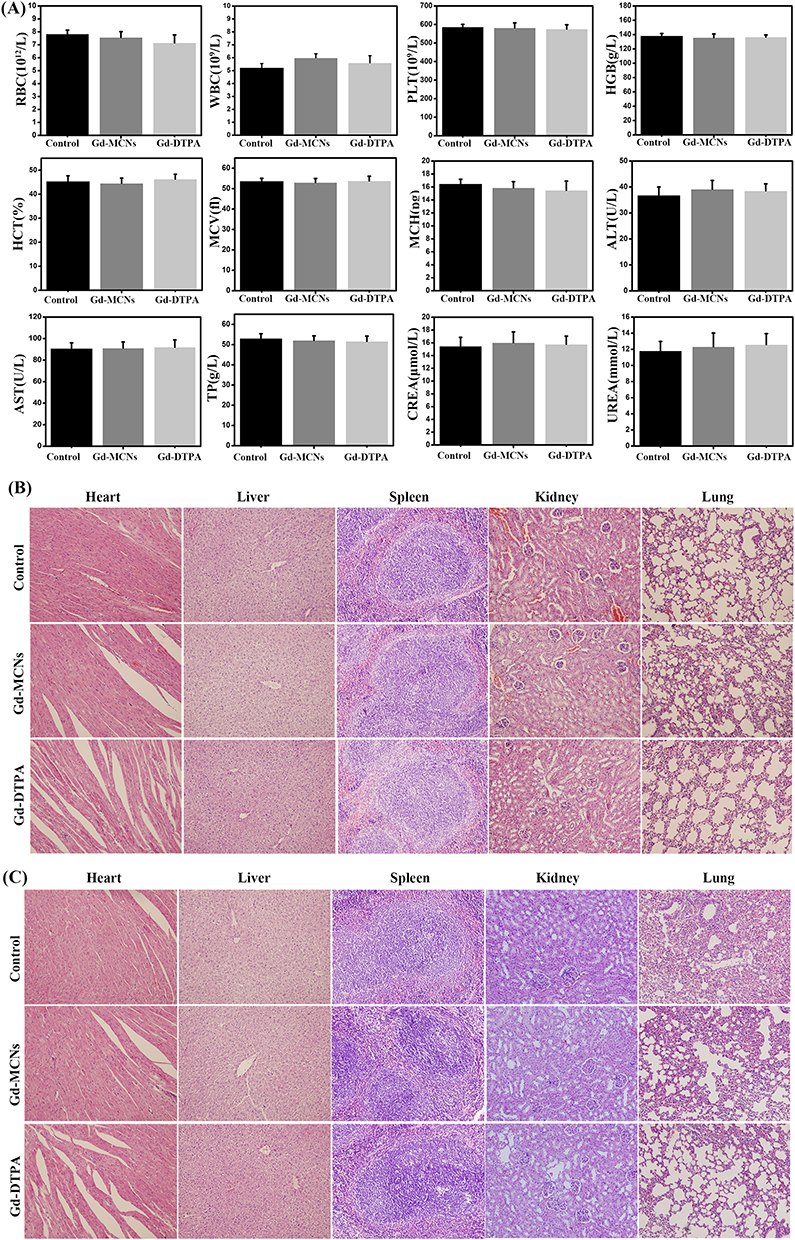 |
Figure 5 In vivo toxicity test. (A) Mouse serum blood routine and biochemistry analysis after treatment at 72 h; histological images of heart, liver, spleen, kidney and lung of mice after treatment at 72 h (B) and 12 weeks (C). |
Then, to evaluate the chronic toxicity, the weight change and behavior of the mice as well as histological analysis were studied after repeated injection of Gd-MCNs or Gd-DTPA for 12 weeks once a week. During this long time, the weight and behavior of the mice did not change significantly and no obvious histological damage and lesions in the main organs as well as no abnormal blood routine and blood biochemistry indexes were observed (Figure 5C, Figure S1, and Figure S2).
MR Imaging Behavior and Metabolism
The good in vivo biocompatibility encouraged us to compare their MRI effect as MRI CA with Gd-DTPA. MRI scanning was performed at different time points post-injection of Gd-MCNs and Gd-DTPA. As shown in the Figure 6A and B, the magnetic resonance imaging of the tumor area showed a significant brightening effect after administration, and the enhancement effect reached its peak in the Gd-MCNs group at 4 hours, while the Gd-DTPA group reached its peak at 0–1 hours, and then decreased with time. At the same Gd content, the relaxation values at the tumor site in the Gd-MCNs group were higher than those in the Gd-DTPA group at each time point (P0h = 0.0653, P > 0.05; P1h = 0.0184, P < 0.05; P4h = 0.00018, P < 0.001; P8h = 0.00093, P < 0.001; P12h = 0.0073, P < 0.01), confirming the in vivo tumor MRI performance of Gd-MCNs and the tumor site retention effect. The results indicated that the synthesized Gd-MCNs were expected to serve as an efficient nano-CA for tumor MRI. After that, the metabolized route of Gd-MCNs was further investigated. As illustrated in Figure 6C, Gd-MCNs were mainly metabolized by the hepatobiliary system, and the signal in gallbladder was enhanced with time passing by and was basically finished at about 12 h, which was different from Gd-DTPA with kidney clearance route. A slight signal from the kidney probably came from the small amount of released Gd from Gd-MCNs. The deposition of Gd-MCNs in liver was also observed by biological ultra-thin SEM. As shown in Figure 6D, Gd-MCNs could be clearly observed in liver tissue. In order to quantify the distribution of Gd-MCNs in various organs after injection, the Gd contents in the organs of the heart, liver, spleen, lung, and kidney were detected by ICP-MS. Similar with MRI result, Gd-MCNs deposited more in the liver, as shown in Figure 6E. The blood half-life of Gd-MCNs in mice was determined to be 95.89 min, which was longer than that of Gd-DTPA (25.23 min) (Figure 6F).33 This widens the time window of magnetic resonance examination and relieves the pressure of clinical examination.
 |
Figure 6 (A) T1 pseudo color images of tumor bearing mice pre- and post-injection of Gd-MCNs or Gd-DTPA at 1 h, 4 h, 8 h, and 12 h (The yellow arrows indicate the tumor); (B) the corresponding signal intensity of tumor; (C) T1 pseudo color images of mice pre- and post-injection of Gd-MCNs at 15 min, 0.5 h, 1 h, 2 h, 4 h, 8 h, and 12 h (The green arrows indicate gallbladder); (D) TEM image of liver (The red arrows indicate the deposited Gd-MCNs); (E) Gd amount deposited in major organs; (F) blood half-life determination of Gd-MCNs. *P < 0.05, **P < 0.01, ***P < 0.001. |
Discussion
The biosafety of nanomaterials is related to many factors and the shape of nanomaterials plays an important role. An in vivo study in mice reported that spherical NPs had the least acute toxicity after exposure. Nam et al reported that the toxicity of silver nanomaterials with different shapes in C. infusionum was in an order of silver nanoplates (40 nm diameter) > silver nanowires (21,000 nm length * 42 nm diameter) > silver nanospheres (57 nm diameter).34 Pure graphene was reported to be less toxic than highly purified single-walled carbon nanotubes (SWCNTs) exposed to PC 12 cells, while the phenomenon was reversed at low concentrations. The unique shape of CNTs can enter the cytoplasm via a “snaking effect”, inducing a stronger cytotoxic response as compared with graphene.35 Figarol et al also found that compared with carbon black nanoparticles, CNTs and nanographene produced stronger cellular toxicity and it was more obvious in nanographene.36 The hollow mesoporous carbon nanospheres studied in this experiment have a spherical and hollow mesoporous structure, with a diameter of about 150 nm. Compared with other carbon nanomaterials such as CNTs and nanographene, they have better shape advantages. The mechanism may be that the spherical nanoparticles increase the surface area of contact with the macrophages, enabling the macrophages to phagocytose them and thus clear them from the extracellular environment. Furthermore, Gd doping does not influence their shape and endows MRI ability.36
Before conducting biocompatibility experiments, it is necessary to specify the concentration of Gd-MCNs. Based on the clinical CA Gd-DTPA used in the human body at a concentration of 0.1 mmol/kg, we calculated that the in vivo concentration of Gd-MCNs with the same imaging effect was about 50 µg/mL, corresponding to a Gd concentration of 7 µM. Therefore, during our research process, a series of studies were conducted using 50 µg/mL as the intermediate concentration.
Most of the nanomaterials currently studied are injected into the body through intravenous injection. When nanomaterials enter the bloodstream, they first interact with various biomolecules in body fluids.37 Among them, the proportion of red blood cells in the whole blood can reach to 40% to 50%,38 which is relatively representative and is widely used as a research object to evaluate the blood compatibility of nanomaterials. In addition, the red blood cell membrane has enormous deformability and can pass through the microvascular system.39,40 Hemolysis rate is the most basic measure of blood compatibility. When nanomaterials come into contact with red blood cells, the surface hydrophobic bonds and irregular shapes may damage the red blood cell membrane, leading to the release of heme and causing hemolysis.41 However, for Gd-MCNs in our case, the hemolysis rate was below 3% with the concentration below 100 μg/mL (that is 14 μM Gd). Furthermore, nanomaterials can undergo electrostatic reactions with the surface charges of the red blood cell membrane, and directly contact with cell membrane proteins to cause damage to red blood cells. At this time, red blood cells will quickly deform, aggregate, and hemolyze. Therefore, scanning electron microscopy observation on red blood cells after Gd-MCNs treatment was carried out and it was found that red blood cells remained in a double concave disc shape without significant aggregation or fragmentation, which was consistent with the results of hemolysis experiments.
For particles, protein binding is also considered to be one of the most important factors affecting biological distribution. In the current preclinical testing of drug molecules, the evaluation of plasma protein binding is considered an important factor in evaluating drug efficacy, safety, and disposal. In particular, most materials, upon contact with biological matrices, are immediately coated by proteins, leading to a protein “corona”. Certain components of the nanoparticle crown, called opsonins, enhance the uptake of coating materials by cells of the reticuloendothelial system (RES).28,42 Plasma proteins are the second largest class of macromolecular substances in the blood, and nanomaterials entering the blood will inevitably come into contact with them, affecting their protein conformation. Albumin is an important drug-binding protein in plasma. It is also the plasma protein with the highest content. It can combine with acidic, alkaline and neutral drugs to further affect drug transport, metabolism and other processes.28 The influence of nanomaterials on the conformation of BSA might reflect their blood compatibility. UV absorption spectroscopy is an effective technical method for studying conformational changes in plasma proteins, and the Soret Band of BSA located at 280 nm can provide effective information about its secondary structural changes.28 The UV absorption spectrum of BSA has two peaks, 208 and 280 nm, respectively. The absorption peak at 280 nm is an endogenous absorption peak, which is due to the presence of amino acid residues of tryptophan. When the protein conformation changes, the position of the peak will shift or decrease.43 Circular dichroism (CD) is a very useful technical method for analyzing protein secondary conformations and folding information. Different protein secondary conformations will present different circular dichroism. Thus, by detecting protein circular dichroism, the content and variation of secondary conformations in proteins can be analyzed.44 In this experiment, we performed UV absorption spectrum and circular dichroism of BSA with or without Gd-MCNs or Gd-DTPA incubation. It showed that compared with pure BSA, the curve of BSA with the treatment of Gd-MCNs kept almost the same, which was a slightly red-shift and peak decrease with the treatment of Gd-DTPA, confirming the good blood compatibility of Gd-MNCs.
When nanoparticles enter the human body, as an exogenous substance, they will be recognized by the immune system and macrophages, as immune cells, are more sensitive to exposure to nanoparticles than other cells.45 Here, we showed that Gd-MCNs could be uptaken by RAW264.7 cells and existed in the cytoplasm in the form of vesicles, remaining the intact morphology of the cell membrane and nuclear membrane. Gd-MCNs can maintain a good spherical shape, are easy to phagocytize and keep relatively stable within the cell without decomposition into harmful substances to damage the cell structure in the short term. MTT assay of Gd-MCNs on RAW264.7 and NIH-3T3 cells further testified such cellular compatibility. The cell survival rate was above 85% under the concentration of 14 μM Gd, and no significant difference was observed between Gd-MCNs and Gd-DTPA. The live death experiment and flow cytometry further presented the cell state and the proportion of cells in different stages with different treatments, all confirming the cellular safety of Gd-MCNs. However, to understand the fate of the nanoparticles clearly, it is more important to devote to future studies to identify (1) which macrophage subtypes in these tissues are responsible for primary uptake; (2) how macrophage type and reactivity to particle phagocytosis affects the surrounding environment; (3) how nanoparticle secondary processing to produce particle elimination or accumulation occurs.
Mitochondria are a bilayer membrane organelle, to produce energy in cells and participate in processes such as cell differentiation, cell information transmission, and cell apoptosis. The functional state of mitochondria is closely related to mitochondrial membrane potential, mitochondrial channels, reactive oxygen generation, and DNA mutation.46,47 Among them, mitochondrial membrane potential is a sensitive index for evaluating mitochondrial function. We tested the changes of mitochondrial membrane potential to understand the initial mechanism of cell damage. Normal cells mainly contain JC-1 polymer in mitochondrial staining, which produces red fluorescence; when mitochondria are damaged, JC-1 changes from a polymer to a monomer, producing a green fluorescent material. The experiment found that there was no significant green fluorescence production in the mitochondrial staining after incubation with Gd-MCNs and Gd- DTPA,48 indicating that mitochondrial function was not damaged. Mitochondrial damage will lead to the production of reactive oxygen species, and medium to high concentrations of ROS will induce cell apoptosis and even necrosis through cellular oxidative stress response.49 Thus, fluorescent dye DCFH-DA was used to detect the level of reactive oxygen species inside cells. DCFH-DA itself does not emit fluoresce and can freely pass through the cell membrane. After entering the cell, it is hydrolyzed into DCFH by esterases inside the cell. However, DCFH cannot pass through the cell membrane and therefore accumulates inside the cell. The reactive oxygen species inside the cell oxidize it into fluorescent DCF, and the fluorescence intensity is proportional to the content of reactive oxygen species,50 The lower ROS production in Gd-MCNs group than Gd-DTPA group, indicating less stimulation of Gd-MCNs to the production of ROS in cells and smaller oxidative stress. Mitochondrial damage was positively related to cellular apoptosis and ROS release. Acid-MWCNTs and tau-MWCNTs were found to induce apoptosis of RAW264.7 via the mitochondrial pathway and scavenger receptor. Significant mitochondrial membrane potential decrease and cytochrome c leakage upon MWCNT treatment indicated the mitochondrial pathway might be involved in the mechanism of MWCNT-apoptosis. Furthermore, pristine SWCNTs induced apoptosis in RAW264.7 cells through mitochondrial dysfunction and the generation of ROS, apoptosis- and autophagy-related proteins were increased.51
Inflammatory factors are a family of cytokines that can bi-directionally regulate the immune system, mainly involved in the differentiation and activation of immune cells. The occurrence of inflammation is often accompanied by massive secretion of IL-1β and IL-6, and overexpression of TNF-α will promote the production of IL-1β and IL-6 and other factors. We used an ELISA kit to determine the content of pro-inflammatory cytokines in the supernatant of macrophages incubated with different materials. In previous studies, single-walled carbon nanotubes presented lower toxicity due to their ability to cause less lysosomal damage and less secretion of inflammatory factors than multi-walled carbon nanotubes.52 Although our fabricated Gd-MCNs showed a certain increase in inflammatory factors secretion, it was lower than Gd-DTPA with a clinical dosage. Considering the widely used Gd-DTPA in clinic, the increase in secretion of inflammatory factors by Gd-MCNs was clinically acceptable. It should be mentioned that no obvious DNA damage was found in the presence of Gd-MCNs, confirming their genetic compatibility, which might be ascribed to the fact that Gd-MCNs were not entered the nucleus and did not directly contact its genetic material. In the future, it is necessary to deeply study the role of the physicochemical properties of Gd-MCNs in inducing genotoxic responses in different cell lines and animal models, the long-term toxicity and effects on health of successive Gd-MCNs exposures, time- and dose-dependent studies to reveal the processes and directions of gene regulation.
For in vivo toxicity evaluation, the injection of Gd-MCNs did not have obvious effects on hematological indicators and major organs. Compared with control group, no obvious signs of inflammation or necrosis in the main organs of the mice even with 12 times injection for 12 weeks, indicating that Gd-MCNs did not cause significant acute or chronic damage to the mice. The blood biochemistry and blood routine tests also confirmed the acceptable in vivo biosafety of Gd-MCNs. Furthermore, under the safety dosage, Gd-MCNs produced a stronger contrast signal of tumor and a longer time window than Gd-DTPA in MRI. The main metabolic and excretory organs of Gd-MCNs were the liver and gallbladder system, which was different from the traditional clinical CA, mainly the kidney system metabolism, causing renal fibrosis and other related pathological changes.53,54 This implied that such metabolic route of Gd-MCNs might reduce kidney injury, which should be systematically evaluated in the future. Because most of the nanoparticles are distributed in the liver and excreted through the hepatobiliary system, the amount of nanoparticles filtered by the kidney is reduced, indicating that the stimulation of the nanoparticles on the glomeruli and renal tubule epithelium is reduced.
Conclusion
In conclusion, with clinically used MRI CA, Gd-DTPA as control, the blood, immunity, genetics, acute and chronic toxicity as well as MRI behavior of Gd-MCNs were evaluated systematically. Its improved MRI behavior, the extended half-life of blood, and different metabolic route to avoid kidney injury provided the impetus for clinical conversion. However, it should be mentioned that clinical conversion for nano-CA still requires multidisciplinary efforts. The assessments of quality and safety evaluations should be standardized and accepted worldwide. The synthesis and modification of nano-CAs still exist huge space to optimize their stability, signal enhancement ability, in vivo behavior, biosafety and so on. Although the process is complex, the rapid development of nanomedicine and excellent behaviors will promote their use in clinic.
Acknowledgments
This work was supported by the Natural Science Foundation of Jiangsu Province (BK20221391), Major Project of the University Natural Science Foundation of Jiangsu Province (23KJA310010), Six one project of Jiangsu Province (LGY2018083), Pengcheng Talent-Medical Key Talent Training Project.
Disclosure
The authors declare no competing interest in this work.
References
1. Tassa C, Shaw SY, Weissleder R. Dextran-coated iron oxide nanoparticles: a versatile platform for targeted molecular imaging, molecular diagnostics, and therapy. Acc Chem Res. 2011;44(10):842–852. doi:10.1021/ar200084x
2. Kim H-K, Jung H-Y, Park J-A, et al. Gold nanoparticles coated with gadolinium-DTPA-bisamide conjugate of penicillamine (Au@GdL) as a T1-weighted blood pool contrast agent. J Mater Chem. 2010;20(26):5411–5417. doi:10.1039/c0jm00163e
3. Bellin MF. MR contrast agents, the old and the new. Eur J Radiol. 2006;60(3):314–323. doi:10.1016/j.ejrad.2006.06.021
4. Weinmann HJ, Brasch RC, Press WR, Wesbey GE. Characteristics of gadolinium-DTPA complex: a potential NMR contrast agent. AJR Am J Roentgenol. 1984;142(3):619–624. doi:10.2214/ajr.142.3.619
5. Rose TA, Choi JW. Intravenous imaging contrast media complications: the basics that every clinician needs to know. Am J Med. 2015;128(9):943–949. doi:10.1016/j.amjmed.2015.02.018
6. Chopra T, Kandukurti K, Shah S, Ahmed R, Panesar M. Understanding nephrogenic systemic fibrosis. Int J Nephrol. 2012;2012:912189. doi:10.1155/2012/912189
7. Li L, Fu HY, Liu YH. The fibrogenic niche in kidney fibrosis: components and mechanisms. Nat Rev Nephrol. 2022;18(9):545–557. doi:10.1038/s41581-022-00590-z
8. Jin Y. Multifunctional compact hybrid Au nanoshells: a new generation of nanoplasmonic probes for biosensing, imaging, and controlled release. Acc Chem Res. 2014;47(1):138–148. doi:10.1021/ar400086e
9. Wu M, Hou P, Dong L, et al. Manganese dioxide nanosheets: from preparation to biomedical applications. Int J Nanomedicine. 2019;14:4781–4800. doi:10.2147/IJN.S207666
10. Tiburcius S, Krishnan K, Yang JH, et al. Silica-based nanoparticles as drug delivery vehicles for prostate cancer treatment. Chem Rec. 2021;21(6):1535–1568. doi:10.1002/tcr.202000104
11. Liao C, Li Y, Tjong SC. Graphene nanomaterials: synthesis, biocompatibility, and cytotoxicity. Int J Mol Sci. 2018;19(11):3564. doi:10.3390/ijms19113564
12. Bhattacharya K, Mukherjee SP, Gallud A, et al. Biological interactions of carbon-based nanomaterials: from coronation to degradation. Nanomedicine. 2016;12(2):333–351. doi:10.1016/j.nano.2015.11.011
13. Molaei MJ. Gadolinium-doped fluorescent carbon quantum dots as MRI contrast agents and fluorescent probes. Sci Rep. 2022;12(1):17681. doi:10.1038/s41598-022-22518-0
14. Yan JC, Lu ZZ, Xu MS, et al. A tumor-targeting and ROS-responsive iron-based T 1 magnetic resonance imaging contrast agent for highly specific tumor imaging. J Mater Chem B. 2023;11(14):3176–3185. doi:10.1039/D3TB00217A
15. Liu SE, Jiang YX, Liu PC, et al. Single-atom gadolinium nano-contrast agents with high stability for tumor T 1 magnetic resonance imaging. ACS nano. 2023;17(9):8053–8063. doi:10.1021/acsnano.2c09664
16. Urban P, Liptrott NJ, Bremer S. Overview of the blood compatibility of nanomedicines: a trend analysis of in vitro and in vivo studies. Wiley Interdiscip Rev Nanomed Nanobiotechnol. 2019;11(3):e1546. doi:10.1002/wnan.1546
17. Thangudu S, Huang EY, Su CH. Safe magnetic resonance imaging on biocompatible nanoformulations. Biomater Sci. 2022;10(18):5032–5053. doi:10.1039/D2BM00692H
18. Cameron SJ, Sheng J, Hosseinian F, Willmore WG. Nanoparticle effects on stress response pathways and nanoparticle-protein interactions. Int J Mol Sci. 2022;23(14):7962. doi:10.3390/ijms23147962
19. Ling X, Jiang XM, Li YY, et al. Sequential treatment of bioresponsive nanoparticles elicits antiangiogenesis and apoptosis and synergizes with a CD40 agonist for antitumor immunity. ACS nano. 2021;15(1):765–780. doi:10.1021/acsnano.0c07132
20. Deng CF, Zhang Q, He PH, et al. Targeted apoptosis of macrophages and osteoclasts in arthritic joints is effective against advanced inflammatory arthritis. Nat Commun. 2021;12(1):2174. doi:10.1038/s41467-021-22454-z
21. Zhao Q, Lin Y, Han N, et al. Mesoporous carbon nanomaterials in drug delivery and biomedical application. Drug Deliv. 2017;24(2):94–107. doi:10.1080/10717544.2017.1399300
22. Attia MS, Hassaballah MY, Abdelqawy MA, et al. An updated review of mesoporous carbon as a novel drug delivery system. Drug Dev Ind Pharm. 2021;47(7):1029–1037. doi:10.1080/03639045.2021.1988097
23. Godin B, Tasciotti E, Liu X, Serda RE, Ferrari M. Multistage nanovectors: from concept to novel imaging contrast agents and therapeutics. Acc Chem Res. 2011;44(10):979–989. doi:10.1021/ar200077p
24. Cordelli E, Bignami M, Pacchierotti F. Comet assay: a versatile but complex tool in genotoxicity testing. Toxicol Res. 2021;10(1):68–78. doi:10.1093/toxres/tfaa093
25. Chan JKC. The wonderful colors of the hematoxylin-eosin stain in diagnostic surgical pathology. Int J Surg Pathol. 2014;22(1):12–32. doi:10.1177/1066896913517939
26. Wick MR. The hematoxylin and eosin stain in anatomic pathology-An often-neglected focus of quality assurance in the laboratory. Semin Diagn Pathol. 2019;36(5):303–311. doi:10.1053/j.semdp.2019.06.003
27. Song XX, Zhang C, Xing MY, et al. Immunological gadolinium-doped mesoporous carbon nanoparticles for tumor-targeted MRI and photothermal-immune co-therapy. J Mater Chem B. 2023;11(26):6147–6158. doi:10.1039/D3TB00595J
28. Chen D, Ganesh S, Wang W, Amiji M. Plasma protein adsorption and biological identity of systemically administered nanoparticles. Nanomedicine. 2017;12(17):2113–2135. doi:10.2217/nnm-2017-0178
29. Yao H, Wynendaele E, Xu X, Kosgei A, De Spiegeleer B. Circular dichroism in functional quality evaluation of medicines. J Pharm Biomed Anal. 2018;147:50–64. doi:10.1016/j.jpba.2017.08.031
30. Zhou Y, Qi M, Yang M. Current status and future perspectives of lactate dehydrogenase detection and medical implications: a review. Biosensors. 2022;12(12):1145. doi:10.3390/bios12121145
31. Cruceriu D, Baldasici O, Balacescu O, Berindan-Neagoe I. The dual role of tumor necrosis factor-alpha (TNF-α) in breast cancer: molecular insights and therapeutic approaches. Cell Oncol. 2020;43(1):1–18. doi:10.1007/s13402-019-00489-1
32. Chatterjee N, Walker GC. Mechanisms of DNA damage, repair, and mutagenesis. Environ Mol Mutagen. 2017;58(5):235–263. doi:10.1002/em.22087
33. Dai Y, Wu C, Wang S, et al. Comparative study on in vivo behavior of PEGylated gadolinium oxide nanoparticles and Magnevist as MRI contrast agent. Nanomedicine. 2018;14(2):547–555. doi:10.1016/j.nano.2017.12.005
34. Nam SH, An YJ. Size- and shape-dependent toxicity of silver nanomaterials in green alga Chlorococcum infusionum. Ecotoxicol Environ Saf. 2019;168:388–393. doi:10.1016/j.ecoenv.2018.10.082
35. Zhang Y, Petibone D, Xu Y, et al. Toxicity and efficacy of carbon nanotubes and graphene: the utility of carbon-based nanoparticles in nanomedicine. Drug Metab Rev. 2014;46(2):232–246. doi:10.3109/03602532.2014.883406
36. Figarol A, Pourchez J, Boudard D, et al. In vitro toxicity of carbon nanotubes, nano-graphite and carbon black, similar impacts of acid functionalization. Toxicol In Vitro. 2015;30(1):476–485. doi:10.1016/j.tiv.2015.09.014
37. Liu Z, Jiao Y, Wang T, Zhang Y, Xue W. Interactions between solubilized polymer molecules and blood components. J Control Release. 2012;160(1):14–24. doi:10.1016/j.jconrel.2012.02.005
38. Mukhopadhyay S, Veroniaina H, Chimombe T, Han L, Zhenghong W, Xiaole Q. Synthesis and compatibility evaluation of versatile mesoporous silica nanoparticles with red blood cells: an overview. RSC Adv. 2019;9(61):35566–35578. doi:10.1039/C9RA06127D
39. Guo S, Shi Y, Liang Y, Liu L, Sun K, Li Y. Relationship and improvement strategies between drug nanocarrier characteristics and hemocompatibility: what can we learn from the literature. Asian J Pharm Sci. 2021;16(5):551–576. doi:10.1016/j.ajps.2020.12.002
40. Zadeh Mehrizi T, Shafiee Ardestani M. Application of non-metal nanoparticles, as a novel approach, for improving the stability of blood products: 2011–2021. Prog Biomater. 2022;11(2):137–161. doi:10.1007/s40204-022-00188-5
41. Wrobel D, Kolanowska K, Gajek A, et al. Interaction of cationic carbosilane dendrimers and their complexes with siRNA with erythrocytes and red blood cell ghosts. Biochim Biophys Acta. 2014;1838(3):882–889. doi:10.1016/j.bbamem.2013.11.017
42. Corbo C, Molinaro R, Tabatabaei M, Farokhzad OC, Mahmoudi M. Personalized protein Corona on nanoparticles and its clinical implications. Biomater Sci. 2017;5(3):378–387. doi:10.1039/C6BM00921B
43. Li L, Wang H, Wang H, et al. Interaction and oxidative damage of DVDMS to BSA: a study on the mechanism of photodynamic therapy-induced cell death. Sci Rep. 2017;7(1):43324. doi:10.1038/srep43324
44. Martos V, Castreno P, Valero J, de Mendoza J. Binding to protein surfaces by supramolecular multivalent scaffolds. Curr Opin Chem Biol. 2008;12(6):698–706. doi:10.1016/j.cbpa.2008.08.024
45. Tian X, Zeng A, Liu Z, et al. Carbon quantum dots: in vitro and in vivo studies on biocompatibility and biointeractions for optical imaging. Int J Nanomedicine. 2020;15:6519–6529. doi:10.2147/IJN.S257645
46. Kalpage HA, Bazylianska V, Recanati MA, et al. Tissue-specific regulation of cytochrome c by post-translational modifications: respiration, the mitochondrial membrane potential, ROS, and apoptosis. FASEB J. 2019;33(2):1540–1553. doi:10.1096/fj.201801417R
47. Wang Y, Li N, Zhang X, Horng T. Mitochondrial metabolism regulates macrophage biology. J Biol Chem. 2021;297(1):100904. doi:10.1016/j.jbc.2021.100904
48. Perry SW, Norman JP, Barbieri J, Brown EB, Gelbard HA. Mitochondrial membrane potential probes and the proton gradient: a practical usage guide. BioTechniques. 2011;50(2):98–115. doi:10.2144/000113610
49. Weindel CG, Martinez EL, Zhao X, et al. Mitochondrial ROS promotes susceptibility to infection via gasdermin D-mediated necroptosis. Cell. 2022;185(17):3214–31 e23. doi:10.1016/j.cell.2022.06.038
50. Balke J, Volz P, Neumann F, et al. Visualizing oxidative cellular stress induced by nanoparticles in the subcytotoxic range using fluorescence lifetime imaging. Small. 2018;14(23):e1800310. doi:10.1002/smll.201800310
51. Park EJ, Zahari NEM, Kang MS, et al. Toxic response of HIPCO single-walled carbon nanotubes in mice and RAW264.7 macrophage cells. Toxicol Lett. 2014;229(1):167–177. doi:10.1016/j.toxlet.2014.06.015
52. Yamaguchi SI, Xie Q, Ito F, et al. Carbon nanotube recognition by human Siglec-14 provokes inflammation. Nat Nanotechnol. 2023;18(6):628–636. doi:10.1038/s41565-023-01363-w
53. Ramalho J, Semelka RC, Ramalho M, Nunes RH, AlObaidy M, Castillo M. Gadolinium-based contrast agent accumulation and toxicity: an update. AJNR Am J Neuroradiol. 2016;37(7):1192–1198. doi:10.3174/ajnr.A4615
54. Weng Q, Hu X, Zheng J, et al. Toxicological risk assessments of iron oxide nanocluster- and gadolinium-based T1MRI contrast agents in renal failure rats. ACS nano. 2019;13(6):6801–6812. doi:10.1021/acsnano.9b01511
 © 2023 The Author(s). This work is published and licensed by Dove Medical Press Limited. The full terms of this license are available at https://www.dovepress.com/terms.php and incorporate the Creative Commons Attribution - Non Commercial (unported, v3.0) License.
By accessing the work you hereby accept the Terms. Non-commercial uses of the work are permitted without any further permission from Dove Medical Press Limited, provided the work is properly attributed. For permission for commercial use of this work, please see paragraphs 4.2 and 5 of our Terms.
© 2023 The Author(s). This work is published and licensed by Dove Medical Press Limited. The full terms of this license are available at https://www.dovepress.com/terms.php and incorporate the Creative Commons Attribution - Non Commercial (unported, v3.0) License.
By accessing the work you hereby accept the Terms. Non-commercial uses of the work are permitted without any further permission from Dove Medical Press Limited, provided the work is properly attributed. For permission for commercial use of this work, please see paragraphs 4.2 and 5 of our Terms.