Back to Journals » Clinical Epidemiology » Volume 9
Mortality in adults with and without diabetes: is the gap widening?
Authors Wang Z ![]() , Zhang H, Liu M
, Zhang H, Liu M
Received 2 August 2017
Accepted for publication 5 October 2017
Published 3 November 2017 Volume 2017:9 Pages 537—544
DOI https://doi.org/10.2147/CLEP.S148101
Checked for plagiarism Yes
Review by Single anonymous peer review
Peer reviewer comments 3
Editor who approved publication: Professor Vera Ehrenstein
Zhiqiang Wang,1 Huiying Zhang,2 Meina Liu2
1Centre for Clinical Research, Faculty of Medicine, The University of Queensland, Brisbane, QLD, Australia; 2Public Health College, Harbin Medical University, Harbin, China
Objective: We aimed to assess if the gap in mortality between adults with and without diabetes has widened over time in US adults.
Methods and study design: This cohort study included 44,041 adults with diabetes from the US National Health Interview Survey between 1986 and 2009 linked to the National Mortality Index data up to 2011. Each participant with diabetes was matched to two participants without diabetes by age, sex, race, survey year, and region of residence (88,082 persons without diabetes). Mortality differences and hazard ratios were calculated for different time periods defined by three methods, according to 1) survey years with original follow-up durations, 2) follow-up calendar years, and 3) survey years with a fixed 3-year follow-up duration.
Results: Different methods of defining time periods produced substantially different mortality rates and changing patterns over time. The decline in mortality was higher when time periods were defined according to survey years with original follow-up durations than with the fixed 3-year duration. Different time periods had comparable baseline and attained ages only when the fixed duration was used. With this method, the gap between adults with and without diabetes progressively decreased from 224 (95% confidence interval 188–260) in 1992–1994 to 99 (65–132) per 10,000 person-years in 2007–2009. Hazard ratios declined significantly from 2.12 (1.88–2.38) in 1995–1997 to 1.70 (1.44–2.00) in 2007–2009.
Conclusion: The decline in mortality over time was greater among adults with diabetes than those without diabetes. The gap in mortality between adults with diabetes and those without diabetes significantly narrowed in recent years, and was more than halved over the last 15 years.
Keywords: survival, matching, confounding, National Health Interview Survey, time trend
Introduction
The prevalence of diabetes has increased worldwide since 1980.1 The global diabetes epidemic continues to grow and it is expected that diabetes will affect >500 million adults by 2030.2 Adults with diabetes have a higher mortality than those without diabetes.3–17 Although previous studies reported a fall in mortality in adults with and without diabetes,3–5,11,17–19 it is still not known if the gap between adults with and without diabetes has been widening or narrowing over time. Two recent large studies reported that adults with type 2 diabetes had smaller reductions in mortality over time than their matched controls,3,4 suggesting a widening gap in mortality between adults with and without diabetes. Comparing mortality rates and time trends between adults with and without diabetes based on observational survey data can be challenging. In population-based survey or registry data, participants with diabetes are substantially different in age, some demographic factors, and preexisting health conditions from those without diabetes in the general population.5 With large population-based data available, an increasing number of studies have individually matched participants with diabetes to those without diabetes according to multiple factors to assess the excess mortality associated with diabetes.3,4,6,7 Such an approach improves the comparability between adults with and without diabetes. However, previous matched studies ignored another important aspect of assessing time trends – the comparability among different time periods. There have been mainly three different methods to define time periods for assessing time trends in previous studies.3–5 First, time periods were grouped according to original survey years and all participants of different survey periods were followed up to the same time point for mortality outcome.4 Second, the time periods were divided according to follow-up calendar years.3 Third, the time periods were divided according to baseline survey years with a fixed follow-up time for all time periods.5 It would be interesting to know if the different methods produce similar results on mortality time trends. Applying all three methods to the US National Health Interview Survey (NHIS) data of 24 years, we aimed to investigate the time trends in all-cause mortality in adults with diabetes as compared with individually matched persons without diabetes. We assessed whether the gap in mortality between US adults with and without diabetes widened (or narrowed) over time.
Methods and study design
Study design and data sources
This matched cohort study included 44,041 patients with diabetes and 88,082 persons without diabetes from the public-use NHIS data (1986–2009) which were linked to death records in the National Death Index through December 31, 2011.20 Data from the NHIS are weighted to account for different probabilities of selection and for nonresponse and are post-stratified to census control totals in order to provide estimates for the US civilian, noninstitutionalized population. More details of the NHIS design, methodology, and weighting have been published elsewhere.21,22 Among 1,156,032 original participants aged 20–84 years, 1,136,316 with sufficient identifying data were eligible to be linked to mortality events during the follow-up period.20 In the original survey, the presence of diabetes was determined by asking participants if a doctor or other health professional had ever told them that they had diabetes. A total of 45,160 participants were identified as having diabetes at the baseline survey. Mortality status and date of death were recorded in the linked public-use death records.
Based on a matched study design, each adult with diabetes was individually matched to two persons without diabetes according to five variables – age, sex, survey year, race, and region of residence. Participants were divided into three racial groups – white, black, and others as in a previous study.23 There were four regions of residence – Northeast, Midwest, South, and West. Within each matched set, two persons without diabetes had the same gender, race, survey year, and region of residence, and were closest in age within 2 years as the person with diabetes. When more than two identical eligible persons without diabetes for one case were identified, only two participants were randomly selected.
Statistical analysis
To assess time trend, we divided the time between 1986 and 2009 into eight periods: 1986–1988, 1989–1991, 1992–1994, 1995–1997, 1998–2000, 2001–2003, 2004–2006, and 2007–2009. We used three different methods to categorize the above time periods (Figure S1). In method 1, we categorized time periods according to baseline survey years with original follow-up durations. The follow-up time for each participant was the difference between the baseline survey date and December 31, 2011 if still alive or the date of death for those who died before December 31, 2011. In method 2, time periods were categorized according to follow-up calendar years. In this case, the data from one individual could contribute to multiple periods during the follow-up. Both methods 1 and 2 have been used previously in matched studies.3,4 In method 3, we categorized time periods according to baseline survey years as in method 1, but with a fixed follow-up duration of 3 years. The follow-up time was the difference between the baseline survey date and the end date of the 3-year duration for those who did not die within the first 3 years of follow-up or between the survey date and the date of death for those who died during the fixed follow-up duration. Adults who died after 3 years of follow-up were censored at 3 years.
We calculated differences and 95% confidence intervals (CIs) in mortality for different time periods with the 1986–1988 period as reference. The gap in mortality between adults with and without diabetes was measured by hazard ratios and absolute risk differences. We calculated hazard ratios and their 95% CIs using Cox proportional hazard regression for different time periods. Because those without diabetes were selected according to the characteristics of their individually matched participants with diabetes, the matched design was taken into consideration when estimating hazard ratios by setting each matched set as a cluster in the Cox proportional hazard regression. In addition to the matching variables, we also adjusted for other variables such as smoking status, income, education, and marital status. The interaction term between survey year as a continuous variable and diabetes was used to test if the association between diabetes and mortality changed over time for two periods: before and after 1995. Absolute mortality risk differences between participants with and without diabetes and 95% CIs were calculated for different time periods. All analyses were performed using Stata/SE 14.24 This project was approved by the University of Queensland Behavioural and Social Sciences Ethical Review Committee.
Results
Baseline characteristics and attained age during follow-up
We successfully matched 44,041 (97.5%) adults with diabetes to 88,082 participants without diabetes. Table 1 shows the distributions of baseline characteristics in adults with and without diabetes. Those matched participants without diabetes had the same sex, race, survey year, and region of residence as the person with diabetes within each matched set. They had the same age in years as the person with diabetes in 96.7% matched sets, and were 1 year older or younger than the person with diabetes in 3.3% matched sets. The mean age was 60.2 years for both adults with and without diabetes. Adults with diabetes had lower education and lower income levels than those without diabetes. The proportion of participants with cardiovascular disease was higher in those with diabetes (39.7%) than those without diabetes (24.1%).
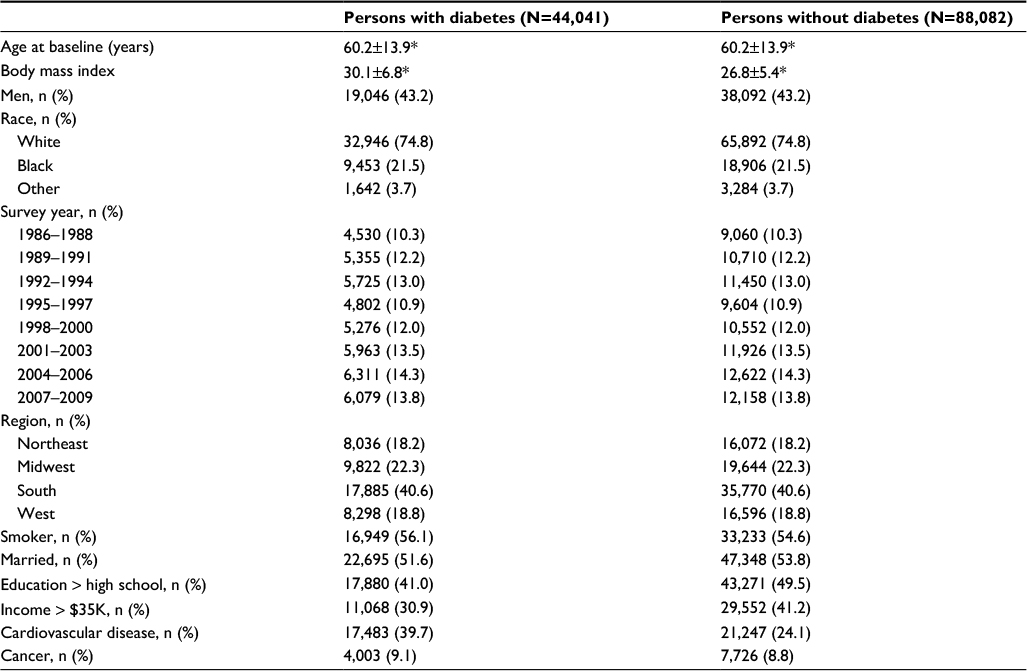 | Table 1 Baseline characteristics of adults with diabetes and matched adults without diabetes Note: *Mean ± standard deviation. |
Baseline age and attained age during follow-up
Although adults with and without diabetes had similar ages at the baseline survey, their attained ages at the end of the follow-up or the time of death varied substantially among different time periods defined using method 1 (Table S1). Participants in earlier time periods were older than those who participated in more recent periods. Those without diabetes were 14.3 years older in 1986–1988 (77.6 years) than in 2007–2009 (63.3 years) while adults with diabetes were 10.3 years older in 1986–1988 (73.9 years) than in 2007–2009 (63.6 years). On the other hand, using method 2 to define time periods, participants in earlier time periods were younger than those in more recent periods in both “baseline” and attained ages. Only when we used method 3 to categorize time periods, participants among different time periods had similar baseline ages and attained ages in both groups (Table S1).
Mortality rates in different time periods
Among 44,041 adults with diabetes, 19,389 died during 423,824 person-years of follow-up. Among 88,082 participants without diabetes, 26,681 died during 985,583 person-years of follow-up. The overall mortality rate was 457 per 10,000 person-years for adults with diabetes and 271 per 1,000 person-years for those without diabetes. Follow-up details and mortality rates in eight time periods categorized by the three methods are shown in Tables S2–S4. Applying different methods to categorize time periods produced substantially different mortality rates and changing patterns over time (Figure 1). Mortality rates decreased over time in adults with and without diabetes using methods 1 and 3, but not so when using method 2. Mortality rates decreased faster over time when the time periods were categorized using method 1 than using method 3 (Figure 2). When applying method 1, mortality dropped to 361 (95% CI 331–391) per 10,000 person-years in adults with diabetes and 222 (95% CI 207–238) per 10,000 person-years from 1986–1988 to 2007–2009 in those without diabetes. When applying method 3, mortality rates dropped to a lesser extent with 217 (95% CI 169–264) per 10,000 person-years reduction in those with diabetes and 100 (95% CI 75–125) per 10,000 person-years reduction in those without diabetes. When using method 2, there was no clear decreasing trend but mortality increased in those without diabetes (Figure 2).
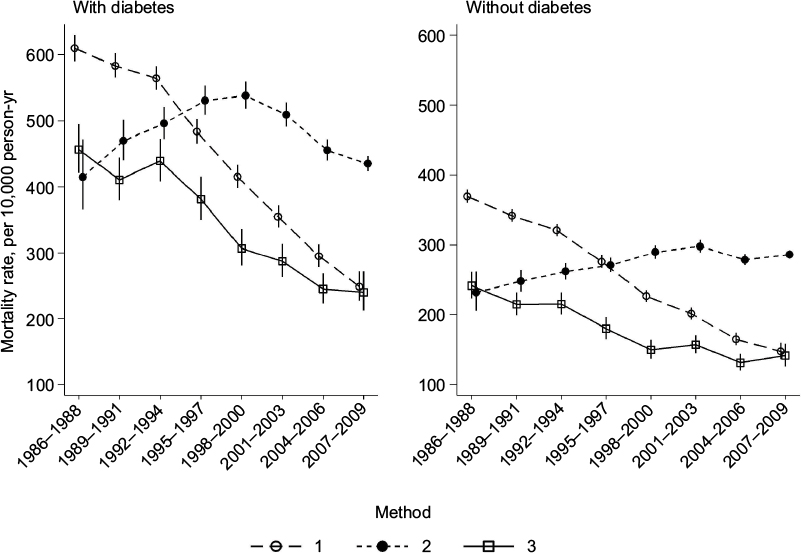 | Figure 1 Mortality (per 10,000 person-years) among adults with and without diabetes according to time periods defined by three different methods. Notes: Vertical bars represent 95% confidence intervals. Time periods were categorized according to method 1 (survey years with original follow-up durations), method 2 (follow-up calendar years), and method 3 (survey years with a fixed follow-up of 3 years). |
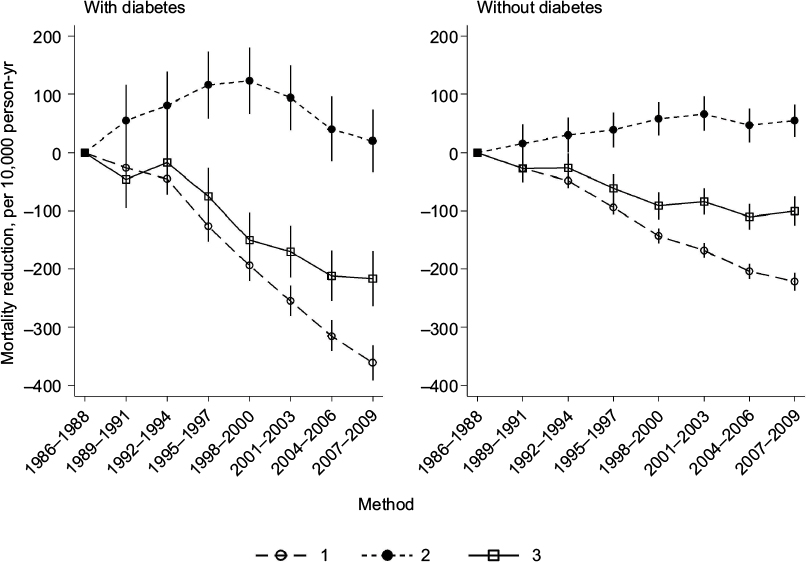 | Figure 2 Absolute mortality change over time compared with the mortality in 1986–1988 among adults with and without diabetes. Notes: Vertical bars represent 95% confidence intervals. Time periods were categorized according to method 1 (survey years with original follow-up durations), method 2 (follow-up calendar years), and method 3 (survey years with a fixed follow-up of 3 years). |
Trends in hazard ratios for mortality associated with diabetes
Hazard ratios as a relative measurement of the gap between adults with and without diabetes in different time periods are shown in Figure S2 and Table S5. Diabetes was significantly associated with higher mortality in all time periods. With a fixed follow-up of 3 years (method 3), it appeared that hazard ratios increased over time in the early four time periods (1986–1988, 1989–1991, 1992–1994, and 1995–1997) but decreased over time in the recent four time periods (1998–2000, 2001–2003, 2004–2006, and 2007–2009).
To further test the linear trend over time before and after 1995, we fitted Cox proportional hazard models with survey year as a continuous variable. Using the fixed follow-up duration of 3 years, the interaction term between diabetes and survey year was not statistically significant before 1995 (P for trend in hazard ratios for mortality associated with diabetes =0.13). The interaction term between diabetes and survey year was significant after 1995 (P for trend <0.05). Hazard ratio estimates dropped over time from 2.16 (95% CI 1.93–2.41) in 1995 to 1.71 (95% CI 1.52–1.92) in 2009. These hazard ratios estimated from the model with survey year as a continuous variable were consistent with the values estimated by categorizing survey time into eight periods. Further adjusting for potential confounding factors of age, sex, smoking status, marital status, education, and income, hazard ratio estimates dropped from 2.11 (95% CI 1.89–2.36) in 1995 to 1.64 (95% CI 1.46–1.84) in 2009 (P for trend <0.05).
Trends in absolute mortality difference between adults with and without diabetes
Figure 3 shows absolute differences in mortality between adults with and without diabetes in eight time periods defined by the three methods. There was no clear trend in the gap between those with and without diabetes during the early survey periods from 1986 to 1994. After 1994, the gap progressively decreased over time from 224 (95% CI 188–260) per 10,000 person-years in 1992–1994 to 99 (95% CI 65–132) per 10,000 person-years in 2007–2009 using a fixed 3-year follow-up duration (method 2). Similar trends were observed in both men and women (Figure S3) with method 3.
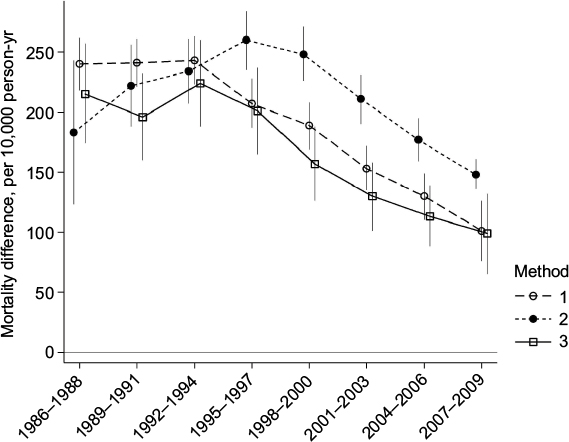 | Figure 3 Absolute mortality risk differences (per 10,000 person-years) between adults with and without diabetes. Notes: Vertical bars represent 95% confidence intervals. Time periods were categorized according to method 1 (survey years with original follow-up durations), method 2 (follow-up calendar years), and method 3 (survey years with a fixed follow-up of 3 years). |
Discussion
Applying three currently used methods to the same data to assess time trends in mortality in adults with and without diabetes, we found that different methods produced contradictory time trend patterns. Both baseline survey time and follow-up time should be considered for defining time periods to ensure comparability in both baseline and attained ages among time periods. We found that defining time periods solely based on baseline years with original follow-up durations overestimated the magnitude of risk reduction because the participants in more recent time periods were significantly younger than earlier periods. On the other hand, defining time periods based on follow-up calendar years would underestimate the magnitude of risk reduction because those in more recent surveys were older than those in earlier surveys. Defining time periods based on baseline survey years with a fixed follow-up duration ensured comparability in both baseline age and attained age among different time periods. Using this approach, we found that adults with diabetes experienced a larger mortality reduction than their matched persons without diabetes over time, particularly in the last 15 years. The gap in mortality between adults with and without diabetes significantly narrowed over time in recent years although those with diabetes still had higher mortality than those without diabetes by the end of the observation period.
Our findings contradict those from two recent studies in Sweden3 and the UK4 which showed that the gap in mortality between adults with and without diabetes widened over time in recent years. Those studies, like ours, adopted an individually matched design to ensure comparability between adults with and without diabetes. The Swedish study included 457,476 patients with type 2 diabetes during 1998–20123 and the UK study included 176,562 adults with type 2 diabetes during 2004–2014.4 Each case in those studies was matched to five controls. However, those studies used original follow-up durations which varied among different survey periods to assess the time trends in mortality. Their reported widening gap in mortality appeared to suggest that the improvement in adults with diabetes over time lagged behind the improvement in those without diabetes. The matched design in such a manner, although it did improve the comparability between adults with and without diabetes, might not improve the comparability among participants of different survey periods. Using the data with original follow-up durations tended to overstate the mortality reduction over time due to the younger attained ages in more recent survey periods. Such bias could affect adults with and without diabetes differently, and pose a threat to the validity of trend estimates in mortality gap between the two groups. A major advantage of using a fixed follow-up duration was to ensure that participants from different survey periods had similar attained ages during follow-up. We found that the reduction in mortality over time estimated using a fixed follow-up duration was substantially smaller than that estimated using original follow-up durations. This methodological difference could partly explain the contradictory findings among different studies although it is difficult to compare the trends of the gap in mortality across countries due to differences in diabetes care and changes in diabetes diagnosis over time among different countries. To better understand the extent to which the methodological difference plays a role in the contradictory findings, further analyses on the mortality trends in other populations need to take the comparability in both baseline and attained ages among different time periods into consideration.
Another interesting finding was that the gap between adults with and without diabetes narrowed unevenly over time during 24 years. The gap changed little in the early survey period from 1986 to 1994 but progressively narrowed over time after 1994 in both relative and absolute risk measurements. This implies a greater improvement in patients with diabetes than in those without diabetes in more recent years. A study of US adults with self-reported diabetes shows an increasing trend in diabetes care such as undergoing HbA1c tests and foot examination in recent years.25 It is encouraging to see that the gap was reduced by half from over the last 15 years although adults with diabetes still had a significantly higher mortality risk than those without diabetes by the end of the observation period.
Time trends of mortality among US adults with diabetes using survey data including NHIS have been previously reported.5,8,18,26 Unlike those previous studies using the NHIS data, our study adopted an individually matched design and had a wider survey period of 24 years. Gregg et al reported a significant reduction in all-cause mortality among adults with diabetes and no significant reduction among those without diabetes from 1997 to 2006.5 Since those without diabetes are over 15 years younger than participants with diabetes in their study, the time trends between adults with and without diabetes might not be directly comparable to those in this study. Through matching and fixing the follow-up duration, we compared adults with and without diabetes from the NHIS with similar ages at baseline and similar attained ages during follow-up. For the first time, with an individually matched design, we were able to demonstrate that the gap in mortality unevenly declined over time – remained relatively stable in the earlier years, and rapidly declined in more recent years in US adults.
Our estimates are subject to several limitations. First, diabetes cases in the NHIS were identified through self-reporting and we could not differentiate type 1 and type 2 diabetes. The magnitude of changes in mortality might differ between adults with type 1 and type 2 diabetes. Second, the group of participants without diabetes might contain individuals with undiagnosed diabetes. Such misclassification could attenuate the gap in mortality between adults with and without diabetes. Third, we were unable to assess if the time trends were influenced by the changes in diagnostic criteria over time during 1986 and 2009. Fourth, cardiovascular disease is a complication and cause of premature death among people with diabetes. The observed narrowing gap in mortality could be partly due to advances in the prevention and management of cardiovascular disease. Finally, as data on age at first diagnosis with diabetes were not available for early surveys (1986–1996), we did not estimate mortality according to age at diagnosis.
Conclusion
In summary, when assessing time trends in mortality between adults with and without diabetes using existing survey data, it is critical to ensure that participants of different time periods have similar attained ages during follow-up as well as similar baseline ages. When both baseline and attained ages were comparable among time periods, we found that the reduction in all-cause mortality was significantly higher in adults with diabetes than in those without diabetes. The gap in mortality between adults with and without diabetes significantly narrowed in recent years, and was more than halved over from 1992–1994 to 2007–2009.
Acknowledgments
We gratefully acknowledge the US National Center for Health Statistics for providing access to the NHIS public-use data. This project was supported by the National Health and Medical Research Council of Australia (APP1042343 to ZW).
Disclosure
The authors report no conflicts of interest in this work.
References
NCDRF Collaboration. Worldwide trends in diabetes since 1980: a pooled analysis of 751 population-based studies with 4.4 million participants. Lancet. 2016;387(10027):1513–1530. | ||
Whiting DR, Guariguata L, Weil C, Shaw J. IDF diabetes atlas: global estimates of the prevalence of diabetes for 2011 and 2030. Diabetes Res Clin Pract. 2011;94(3):311–321. | ||
Rawshani A, Rawshani A, Franzen S, et al. Mortality and cardiovascular disease in type 1 and type 2 diabetes. N Engl J Med. 2017;376(15):1407–1418. | ||
Zghebi SS, Steinke DT, Carr MJ, Rutter MK, Emsley RA, Ashcroft DM. Examining trends in type 2 diabetes incidence, prevalence and mortality in the UK between 2004 and 2014. Diabetes Obes Metab. 2017;19(11):1537–1545. | ||
Gregg EW, Cheng YJ, Saydah S, et al. Trends in death rates among U.S. adults with and without diabetes between 1997 and 2006: findings from the National Health Interview Survey. Diabetes Care. 2012;35(6):1252–1257. | ||
Tancredi M, Rosengren A, Svensson AM, et al. Excess mortality among persons with type 2 diabetes. N Engl J Med. 2015;373(18):1720–1732. | ||
Wang Z, Liu M. Life years lost associated with diabetes: an individually matched cohort study using the U.S. National Health Interview Survey data. Diabetes Res Clin Pract. 2016;118:69–76. | ||
Gregg EW, Li Y, Wang J, et al. Changes in diabetes-related complications in the United States, 1990–2010. N Engl J Med. 2014;370(16):1514–1523. | ||
Gulliford MC, Charlton J. Is relative mortality of type 2 diabetes mellitus decreasing? Am J Epidemiol. 2009;169(4):455–461. | ||
Narayan KM, Boyle JP, Thompson TJ, Sorensen SW, Williamson DF. Lifetime risk for diabetes mellitus in the United States. JAMA. 2003;290(14):1884–1890. | ||
Huang ES, Laiteerapong N, Liu JY, John PM, Moffet HH, Karter AJ. Rates of complications and mortality in older patients with diabetes mellitus: the diabetes and aging study. JAMA Int Med. 2014;174(2):251–258. | ||
Roper NA, Bilous RW, Kelly WF, Unwin NC, Connolly VM. Excess mortality in a population with diabetes and the impact of material deprivation: longitudinal, population based study. BMJ. 2001;322(7299):1389–1393. | ||
Seshasai SR, Kaptoge S, Thompson A, et al; Emerging Risk Factors Collaboration. Diabetes mellitus, fasting glucose, and risk of cause-specific death. N Engl J Med. 2011;364(9):829–841. | ||
Kelly PJ, Clarke PM, Hayes AJ, et al. Predicting mortality in people with type 2 diabetes mellitus after major complications: a study using Swedish National Diabetes Register data. Diabetic Med. 2014;31(8):954–962. | ||
Sarwar N, Gao P, Seshasai SR, et al; Emerging Risk Factors Collaboration. Diabetes mellitus, fasting blood glucose concentration, and risk of vascular disease: a collaborative meta-analysis of 102 prospective studies. Lancet. 2010;375(9733):2215–2222. | ||
Nwaneri C, Cooper H, Bowen-Jones D. Mortality in type 2 diabetes mellitus: magnitude of the evidence from a systematic review and meta-analysis. Br J Diabetes Vasc Dis. 2013;13(4):192–207. | ||
Lind M, Garcia-Rodriguez LA, Booth GL, et al. Mortality trends in patients with and without diabetes in Ontario, Canada and the UK from 1996 to 2009: a population-based study. Diabetologia. 2013;56(12):2601–2608. | ||
Gregg EW, Zhuo X, Cheng YJ, Albright AL, Narayan KM, Thompson TJ. Trends in lifetime risk and years of life lost due to diabetes in the USA, 1985–2011: a modelling study. Lancet Diabetes Endocrinol. 2014;2(11):867–874. | ||
Harding JL, Shaw JE, Peeters A, Davidson S, Magliano DJ. Age-specific trends from 2000–2011 in all-cause and cause-specific mortality in type 1 and type 2 diabetes: a cohort study of more than one million people. Diabetes Care. 2016;39(6):1018–1026. | ||
National Center for Health Statistics, Office of Analysis and Epidemiology. Public-use linked mortality file, 2015. Hyattsville, Maryland: NCHS. 2015. Available from: http://www.cdc.gov/nchs/data_access/data_linkage/mortality.htm. Accessed June 12, 2017. | ||
Parsons VL, Moriarity C, Jonas K, Moore TF, Davis KE, Tompkins L. Design and estimation for the National Health Interview Survey, 2006–2015. Vital Health Stat 2. 2014;165:1–53. | ||
Design and estimation for the National Health Interview Survey, 1995–2004. Vital Health Stat 2. 2000;130:1–31. | ||
Leung MY, Pollack LM, Colditz GA, Chang SH. Life years lost and lifetime health care expenditures associated with diabetes in the U.S., National Health Interview Survey, 1997–2000. Diabetes Care. 2015;38(3):460–468. | ||
StataCorp. Stata Statistical Software: Release 14. College Station, Texas: StataCorp LP; 2015. | ||
Williams JS, Bishu KG, St Germain A, Egede LE. Trends in sex differences in the receipt of quality of care indicators among adults with diabetes: United States 2002–2011. BMC Endocr Disord. 2017; 17(1):31. | ||
Gregg EW, Gu Q, Cheng YJ, Narayan KM, Cowie CC. Mortality trends in men and women with diabetes, 1971 to 2000. Ann Int Med. 2007;147(3):149–155. |
 © 2017 The Author(s). This work is published and licensed by Dove Medical Press Limited. The
full terms of this license are available at https://www.dovepress.com/terms
and incorporate the Creative Commons Attribution
- Non Commercial (unported, 3.0) License.
By accessing the work you hereby accept the Terms. Non-commercial uses of the work are permitted
without any further permission from Dove Medical Press Limited, provided the work is properly
attributed. For permission for commercial use of this work, please see paragraphs 4.2 and 5 of our Terms.
© 2017 The Author(s). This work is published and licensed by Dove Medical Press Limited. The
full terms of this license are available at https://www.dovepress.com/terms
and incorporate the Creative Commons Attribution
- Non Commercial (unported, 3.0) License.
By accessing the work you hereby accept the Terms. Non-commercial uses of the work are permitted
without any further permission from Dove Medical Press Limited, provided the work is properly
attributed. For permission for commercial use of this work, please see paragraphs 4.2 and 5 of our Terms.