Back to Journals » Neuropsychiatric Disease and Treatment » Volume 22
Morphometric Similarity Loss and Gray Matter Atrophy Align with Neurotransmitter and Mitochondrial Maps in Drug-Resistant Epilepsy
Authors Zhao J, Gao M ![]() , Zhou L, Wan S, Liao N, Yu S
, Zhou L, Wan S, Liao N, Yu S ![]() , Chen X
, Chen X ![]() , Shu H
, Shu H
Received 19 November 2025
Accepted for publication 7 March 2026
Published 24 March 2026 Volume 2026:22 582833
DOI https://doi.org/10.2147/NDT.S582833
Checked for plagiarism Yes
Review by Single anonymous peer review
Peer reviewer comments 2
Editor who approved publication: Dr Roger Pinder
Jiaxi Zhao,1,2 Mingjun Gao,2,3 Lanling Zhou,2,3 Shiming Wan,1,2 Nianshun Liao,2 Sixun Yu,1– 3,* Xin Chen,2,3,* Haifeng Shu1– 4,*
1Department of Neurosurgery, The Affiliated Hospital of Southwest Medical University, Luzhou, Sichuan, People’s Republic of China; 2Department of Neurosurgery, The General Hospital of Western Theater Command PLA, Chengdu, Sichuan, People’s Republic of China; 3College of Medicine, Southwest Jiaotong University, Chengdu, Sichuan, People’s Republic of China; 4T18-Issue Stress Injury and Functional Repair Key Laboratory of Sichuan Province, Chengdu, Sichuan, People’s Republic of China
*These authors contributed equally to this work
Correspondence: Haifeng Shu, Department of Neurosurgery, The Affiliated Hospital of Southwest Medical University, No. 319, Section 3, Zhongshan Road, Lianxi Road Community, Beicheng Street, Jiangyang District, Luzhou, Sichuan, People’s Republic of China, Tel +0086-28-13908052010, Email [email protected]
Background: Epilepsy imposes a substantial global burden, and drug-resistant epilepsy (DRE) accounts for a disproportionate share of morbidity due to persistent seizures and limited treatment options. Although MRI studies have reported gray-matter (GM) atrophy in DRE, its spatial specificity, accompanying changes in morphometric similarity network (MSN) connectivity strength, and the performance of an MRI-only supportive screening model for identifying DRE remain incompletely understood. We therefore tested whether GM atrophy clusters non-randomly in territories with high neurotransmitter-receptor, cellular, and mitochondrial distributions, whether MSNs are altered, and evaluated the feasibility of an MRI-only model to support DRE identification.
Methods: This study first used voxel-based morphometry (VBM) to map group GM atrophy, then constructed MSN from structural MRI features to analyze global, regional, and graph-theoretic metrics; we next tested the spatial correlation of the GM atrophy map with neurotransmitter receptor and cellular/mitochondrial distributions under family-wise FDR control. Finally, we trained classifiers using LASSO-selected MRI features to develop an MRI-based screening/support tool. All analyses were performed separately in two independent cohorts.
Results: Both cohorts showed temporo-limbic–anchored GM atrophy, with discovery-cohort stratification indicating broader thalamo–ventral temporal involvement in TLE and more focal cerebellar effects in non-TLE. MSNs showed preserved global indices with focal regional meanMS reductions (isthmus cingulate/medial orbitofrontal/pars triangularis), reproduced in TLE but not other subtype contrasts. The atrophy map co-localized with 5-HT1B and mGluR5 and with mitochondrial Complex I/IV (plus respiratory capacity and a neuronal subtype map) in discovery, while validation showed no FDR-significant correspondences and opposite directions for mGluR5 and respiratory capacity. The MRI-only panel achieved moderate external AUC (~0.75), consistent with a supportive screening application rather than diagnostic replacement.
Conclusion: GM atrophy in DRE aligns with neurotransmitter and mitochondrial distributions and coincides with regional meanMS reductions; an MRI-only model aids DRE identification, though causality and clinical utility await validation in larger longitudinal/interventional studies.
Keywords: voxel-based morphometry, morphometric similarity networks, JuSpace, clinical prediction model
Introduction
Epilepsy affects around 50 million people worldwide, and approximately 20–30% of individuals continue to have seizures despite adequate antiseizure medication trials, meeting criteria for drug-resistant epilepsy (DRE). DRE contributes disproportionately to cognitive morbidity and public-health burden due to persistent seizures and limited treatment options.1–3 Despite advances in antiseizure medications and emerging therapeutic approaches, a substantial proportion of patients remain drug-resistant, underscoring ongoing efforts to explore broader pharmacological strategies with careful attention to safety and toxicology.4,5 Pathophysiology spans multiple scales: GM atrophy and network disorganization at the macroscale,6 alongside alterations in neurotransmitter systems and cellular/mitochondrial biology at the micro/molecular levels.7–10 Accordingly, in imaging analyses, it is essential to link MRI findings to structural network organization and to neurochemical/cellular–energetic mechanisms, and to leverage these correspondences for interpretable, individualized assessment.
In macro-level imaging research, numerous studies based on GM volume and cortical morphometric indices have demonstrated marked morphological abnormalities in DRE.11,12 Further network investigations—including functional connectivity networks, morphometric similarity networks, and structural covariance networks also indicate convergent, cross-method alterations.13,14 Beyond descriptive mapping, large-scale network alterations in DRE can be interpreted in the context of experimentally established plasticity mechanisms. Recurrent seizures can drive maladaptive synaptic and homeostatic plasticity—often discussed as “learning-like” consolidation of pathological network states—thereby stabilizing epileptogenic circuits and shaping relapse-prone dynamics after transient control. This framework provides a translational rationale for linking MRI-derived network phenotypes to neurochemical and cellular–energetic systems that modulate plasticity and excitation–inhibition balance. At the biological level, evidence shows that disruptions of excitatory and inhibitory neurotransmitter systems, together with multiple modulatory pathways, jointly disturb the excitation–inhibition balance;15 meanwhile, region-specific distributions of different cell types and microstructural elements such as mitochondrial complexes determine spatial heterogeneity in energy supply and excitation–inhibition homeostasis.16,17
Despite substantial progress in understanding drug-resistant epilepsy (DRE), several critical gaps remain. It is still unclear whether DRE exhibits a reproducible and spatially specific pattern of gray-matter atrophy that can be robustly detected across independent cohorts; whether individual-level morphometric similarity networks (MSNs) show global reconfiguration or instead focal hub-level weakening; and to what extent MRI-derived structural patterns can be mechanistically contextualized using neurochemical and cellular–energetic reference maps. Against this background, we asked whether DRE-related MRI phenotypes yield non-random, cross-cohort–reproducible macrostructural and network-level signatures that can be meaningfully anchored to neurobiological reference systems. Specifically, we tested whether (i) the DRE–healthy control atrophy map demonstrates a consistent spatial patterns across cohorts, (ii) whether MSN alterations in DRE remain unclear at the global and regional level—specifically, whether they are better characterized by preserved global summaries with focal reductions in regional meanMS/strength within hub-like territories or by broader global reconfiguration, (iii) the group-level atrophy pattern shows selective spatial correspondence with pre-specified neurotransmitter-receptor and cellular/mitochondrial distributions—thereby motivating an interpretable MRI-only framework for screening/stratification and research cohort enrichment.
Multi-site, independently recruited cohorts offer a practical advantage for evaluating the robustness and generalizability of MRI-derived disease signatures, as cross-cohort replication helps distinguish stable, disease-related patterns from site- or sample-specific idiosyncrasies. MSN analysis yields an individual-level network phenotype by summarizing cross-regional morphometric similarity across multiple cortical features, enabling tests of whether case–control differences manifest as global shifts or as focal hub-level weakening that may not be evident from atrophy topography alone.18,19 JuSpace further supports mechanistic contextualization by assessing spatial correspondence between the group-level atrophy pattern and a pre-specified panel of neurotransmitter-receptor, cell-type, and mitochondrial reference maps with appropriate control of specificity.20 Finally, evaluating an MRI-only prediction framework under frozen feature definitions and decision thresholds across cohorts provides a pragmatic appraisal of translational feasibility, aligning with use cases in screening/stratification and research cohort enrichment rather than diagnostic replacement.
Accordingly, we applied voxel-based morphometry (VBM), individual-level MSN analysis, and JuSpace-based GM-to-map alignment, and evaluated an MRI-only prediction framework in independent discovery and validation cohorts. This integrated strategy is intended to support applicability and translational relevance in several ways. First, by prioritizing cross-cohort reproducibility, it addresses a key prerequisite for clinical generalization—namely, whether MRI-derived phenotypes remain stable under real-world heterogeneity across settings. Second, pairing macrostructural mapping with individual-level network phenotyping provides complementary readouts that could facilitate clinically meaningful stratification, for example, by distinguishing patients characterized by focal hub-level network vulnerability from those with more diffuse structural involvement. Third, anchoring structural patterns to established neurochemical and cellular–energetic reference systems offers a principled route to mechanism-oriented hypothesis generation, helping connect MRI observations to targets that are actionable in experimental and therapeutic research (eg., receptor- or metabolism-informed studies). Finally, if externally validated under frozen specifications, an MRI-only framework could be positioned as a practical, radiation-free tool for screening/triage and research cohort enrichment, complementing EEG and other modalities in presurgical evaluation and in the design of more targeted, mechanism-aware studies in DRE.
Materials and Methods
Participants
Discovery analyses were conducted using the Imaging Database for Epilepsy and Surgery (IDEAS), a recently established, publicly available neuroimaging repository.21 We retrieved structural MRI scans for 98 healthy controls (HC) and 116 patients with DRE. Groups were matched on sex. Per the IDEAS data-use policy, all images are anonymized and no additional ethics approval is required for secondary analyses.
To test reproducibility, we examined an independent cohort of 11 HC and 16 patients with refractory epilepsy recruited at the General Hospital of the Western Theater Command. Diagnoses followed International League Against Epilepsy (ILAE) criteria and were corroborated by clinical features and interictal/ictal EEG. Patient inclusion criteria were: (1) age 18–65 years; (2) confirmed epilepsy; (3) no intracranial or other neurological comorbidities on MRI (eg., cerebrovascular disease, tumors, neurodegenerative disorders); (4) no history of psychiatric illness, systemic disease, or substance/alcohol abuse; and (5) availability of high-quality 3D T1-weighted scans (Philips Achieva 3.0 T). HC were recruited from individuals undergoing routine health screening with no neurological or psychiatric history. All participants provided written informed consent. The protocol was approved by the hospital’s Ethics Committee and complied with the Declaration of Helsinki.
MRI Data Acquisition
Discovery T1-weighted structural scans were obtained from the IDEAS repository. Imaging was performed on 3 T GE systems using site-standard epilepsy protocols, predominantly 3D FSPGR (voxel size ≈0.9375 × 0.9375 × 1.1 mm) or MPRAGE (1.0 × 1.0 × 1.0 mm). Validation scans were acquired at the General Hospital of the Western Theater Command on a Philips Achieva 3 T scanner using a high-resolution 3D T1-weighted sequence (TR/TE = 9.8/4.6 ms; flip angle = 9°; matrix = 256 × 256; slice thickness = 1 mm; 170 sagittal slices). The same visual quality-control (QC) criteria were applied to exclude motion or intensity artifacts; one HC scan failed QC and was removed.
Image Preprocessing
All structural MRI data were preprocessed with a uniform voxel-based morphometry (VBM) pipeline in MATLAB R2020b, SPM12, and CAT12 (v12.8.2), applied identically to the discovery (IDEAS) and validation cohorts. Native 3D T1-weighted images underwent visual QC and were processed with CAT12’s Segment module for adaptive bias-field correction and probabilistic tissue classification (GM/white matter/cerebrospinal fluid). Spatial normalization used CAT12 geodesic shooting to the ICBM/IXI template in MNI space. Gray-matter maps were Jacobian-modulated to preserve local volumes, resampled to a constant isotropic resolution across cohorts, and smoothed with an 8-mm FWHM Gaussian kernel. QC followed a pre-specified workflow based on CAT12’s composite Image Quality Rating (IQR) and its noise, bias, and resolution components; all segmentations and normalizations were visually reviewed, and scans with motion/ghosting, marked inhomogeneity, tissue misclassification, or poor normalization were excluded.
Morphometric Feature Extraction
Morphometric measures were obtained with CAT12 (SPM12; MATLAB R2020b) using its surface-based pipeline executed via the toolbox interface. For each participant, CAT12 produced vertex-wise maps of four complementary features—cortical thickness (projection-based thickness), local gyrification index, sulcal depth, and fractal dimension—on the individual cortical surface. These maps were sampled to the Desikan–Killiany atlas (68 parcels, left/right), and parcel values were summarized as the robust mean of vertex values after excluding non-cortical vertices. The same CAT12 version, atlas, and extraction procedure were applied in both cohorts. This yielded a 68 × 4 region-by-feature matrix per subject that was used for subsequent group statistics and morphometric similarity network construction.
MSN Construction
For each participant, CAT12-derived maps of cortical thickness, gyrification, sulcal depth, and fractal dimension were parcellated using the Desikan–Killiany atlas, yielding a 68 × 4 region-by-feature matrix. To place features on a common scale, each feature was z-scored within-subject across regions. MSN edges were defined as pairwise Pearson correlations between each region’s four-dimensional feature vectors, producing a 68 × 68 weighted adjacency matrix (diagonal = 0; negative correlations set to 0). Negative correlations were set to zero (ie., treated as the absence of morphometric similarity), because MSNs are typically interpreted as non-negative similarity graphs and most subsequent network summaries (eg., AUC-based graph metrics) assume non-negative edge weights for interpretability and comparability across subjects.18,19 From each adjacency, we computed global meanMS (mean edge weight) and regional nodal strength (sum of incident weights) for statistical analyses. The pipeline—atlas, normalization, edge definition, and summary metrics—was held constant across cohorts, and all analyses were performed within cohort. Full details are provided in the Supplementary Methods (Supplementary Figure 1).
Neurobiological Reference Maps
We used a pre-specified panel to test whether gray-matter atrophy preferentially co-localizes with neurochemical, cellular, and bioenergetic architectures implicated in epilepsy. Neurotransmitter PET/SPECT maps comprised 5-HT1A,22 5-HT1B,22 D1,23 D2,24 DAT,25 FDOPA,26 GABAa,25 SERT,22 NMDA,27 mGluR5,28 and VAChT,28 covering inhibitory (GABAa) and major excitatory/monoaminergic systems known to modulate seizure threshold and network excitability.15,29–35 Cell-type transcriptional maps targeted key cortical classes—interneurons (PVALB/L4–5, SST/L5–6, VIP/L1–2), excitatory projection neurons (Ex6 subcortical-projecting L5/6; Ex7 corticothalamic), and glia (astrocytes, microglia, oligodendrocytes)36–38—reflecting circuit elements central to excitation–inhibition balance, propagation pathways, and neuroinflammatory/myelination processes.39–43 Mitochondrial indices included Complex I (NADH dehydrogenase), Complex IV (cytochrome-c oxidase), and respiratory capacity,44 given evidence that oxidative phosphorylation and redox state shape seizure vulnerability and pharmacoresistance.45,46
Neurotransmitter PET/SPECT templates and additional reference maps were taken from the JuSpace v2.0 distribution; the original sources for each template are listed in the accompanying Sources_templates_release.md file and were cited accordingly.
All subject-level MRI maps and reference templates were summarized within the same atlas (eg., Neuromorphometrics, 119 regions) using JuSpace’s internal extraction routine. Specifically, JuSpace derives the regional ordering from the atlas label IDs and applies the identical label set to extract regional values from both MRI data and template maps, ensuring consistent ROI alignment without manual re-ordering.
Model Construction and Evaluation
Supervised classifiers were developed to distinguish DRE from HC using a pre-specified feature set derived from the MSN and JuSpace pipelines. To reduce dimensionality and collinearity, candidate predictors first underwent feature selection via LASSO-penalized logistic regression, with the regularization parameter tuned by stratified k-fold cross-validation; only features with non-zero coefficients across training folds were retained. This sparsity constraint yields a compact set of clinically interpretable predictors, because each selected feature corresponds to a named network or biological measure (eg., regional meanMS/graph metrics and cross-modal alignment strengths) that can be directly mapped to specific brain regions and neurobiological systems. Using this fixed subset, we trained four models—logistic regression, support vector machine, random forest, and LightGBM—with hyperparameters optimized by nested cross-validation within the discovery cohort. All preprocessing and selection were performed exclusively on training splits to prevent information leakage. After model selection, the chosen model was refit on the full exploration cohort and evaluated once on the independent validation cohort. The primary endpoint was ROC–AUC (95% CI); balanced accuracy, sensitivity, specificity, F1-score, and Brier score were secondary metrics. The decision threshold was set on the discovery cohort and carried forward unchanged to validation.
Statistical Analyses
All analyses were conducted within each cohort (exploration and validation analyzed separately), with age, sex, and TIV included as covariates where applicable. Multiple comparisons were controlled using the Benjamini–Hochberg FDR as specified below.
Modulated, normalized, and smoothed GM maps were compared between DRE and HC using two-sample t-tests in SPM12, adjusting for age, sex, and TIV. Inference was performed at the cluster level with FWE correction; significant clusters are reported with peak MNI coordinates, cluster extent, and maximum t value.
In addition to the primary DRE–HC comparison, prespecified stratified analyses were performed to examine subtype-specific gray-matter volume alterations. Specifically, in discovery cohort, voxel-wise two-sample t-tests were conducted for temporal lobe epilepsy (TLE) vs HC, non-TLE vs HC, right TLE vs HC, and left TLE vs HC, using the same preprocessing outputs and GLM specification as the primary analysis, with age, sex, and TIV included as covariates. In validation cohort, voxel-wise comparisons were performed for TLE vs HC and non-TLE vs HC; due to the smaller sample size in validation cohort, we did not further stratify TLE by laterality (left vs right) to avoid underpowered and potentially unstable voxel-wise inference. For all subgroup contrasts, statistical inference was performed at the cluster level with FWE correction, and significant clusters were reported with peak MNI coordinates, cluster extent, and maximum t value.
Between-group effects on global meanMS, regional meanMS, and three graph measures (AUC-L, AUC-c, AUC-σ) were assessed using ANCOVA with HC3 heteroskedasticity-consistent standard errors, adjusting for age, sex. In addition to the primary DRE–HC comparison, prespecified stratified analyses were conducted for regional meanMS to characterize subtype-specific MSN alterations. In the discovery cohort, additional contrasts included TLE vs HC, non-TLE vs HC, right TLE vs HC, and left TLE vs HC; in the validation cohort, contrasts included TLE vs HC and non-TLE vs HC. Given the smaller sample size in the validation cohort, TLE was not further stratified by laterality (left vs right) to avoid underpowered and unstable estimates. For regional outcomes (68 regions), p-values were FDR-corrected across regions; for global and AUC summaries, FDR was applied across the family of MSN measures.
To relate atrophy to neurobiological reference maps, we used JuSpace (2.0) in two-group mode (list1 = DRE; list2 = HC). In addition, prespecified stratified analyses were conducted by redefining the two lists according to clinical subgroups: in the discovery cohort, we performed TLE vs HC, non-TLE vs HC, right TLE vs HC, and left TLE vs HC; in the validation cohort, we performed TLE vs HC and non-TLE vs HC.
For each PET/SPECT template, we computed Spearman rank correlations between the parcellated regional atrophy pattern and the template map. To avoid inflated significance due to spatial autocorrelation in map-to-map correspondence testing, statistical inference was based on spatial-null models rather than parametric p-values, following general recommendations for spatially informed correspondence analyses. Specifically, we used the exact spatial permutation procedure implemented in JuSpace, which generates an empirical null distribution for each template comparison; we used 10,000 permutations to obtain p_exact values, and we applied Benjamini–Hochberg FDR correction to these spatial-null p-values (p_exact_fdr_BH). Effects are reported as Spearman’s ρ with two-sided p_exact (and FDR-adjusted p_exact_fdr_BH).
As a sensitivity analysis, we additionally assessed statistical significance using Moran spectral randomization (MSR) as implemented in BrainSpace, which generates surrogate maps that preserve the spatial autocorrelation structure of the original parcellated volumetric map. We generated 10,000 MSR surrogates and computed two-sided empirical p-values for each template correlation, followed by BH-FDR correction across templates.47,48
Results
Cohort Characteristics
The discovery cohort comprised 116 DRE and 98 HC. Sex distribution did not differ between groups (female, 60.3% vs 63.3%; p = 0.657), whereas age distribution differed modestly across bins (p = 0.007). Age strata ranged from 20 to 54 years in both groups; a small proportion of HC were ≥55 years (13.3%), with no participants ≥55 years in DRE. Within the DRE group, epilepsy subtype was further classified as right TLE (n = 42, 36.2%), left TLE (n = 50, 43.1%), and non-TLE (n = 24, 20.7%) (Tables 1 and 2). The validation cohort comprised 15 DRE and 11 HC, with similar sex ratios (male, 9/6 vs 7/4; p = 1.00) and comparable ages (29.8 ± 9.6 vs 28.6 ± 6.2 years; p = 0.73). In the validation DRE group, epilepsy subtype was categorized as TLE (n = 11, 73.3%) and non-TLE (n = 4, 26.7%) (Tables 1 and 2). All statistical analyses were performed using R software (version 4.2.3) and Python (version 3.11.4), along with Xsmart software (https://www.xsmartanalysis.com/).
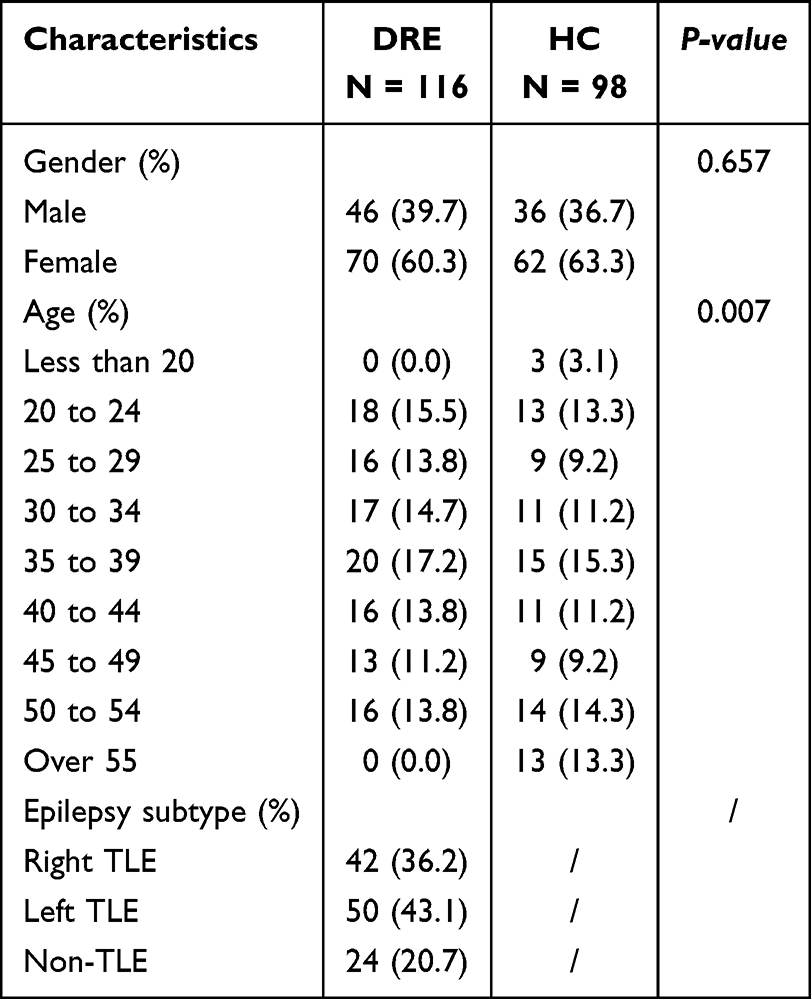 |
Table 1 Baseline Characteristics of the Discovery Cohort |
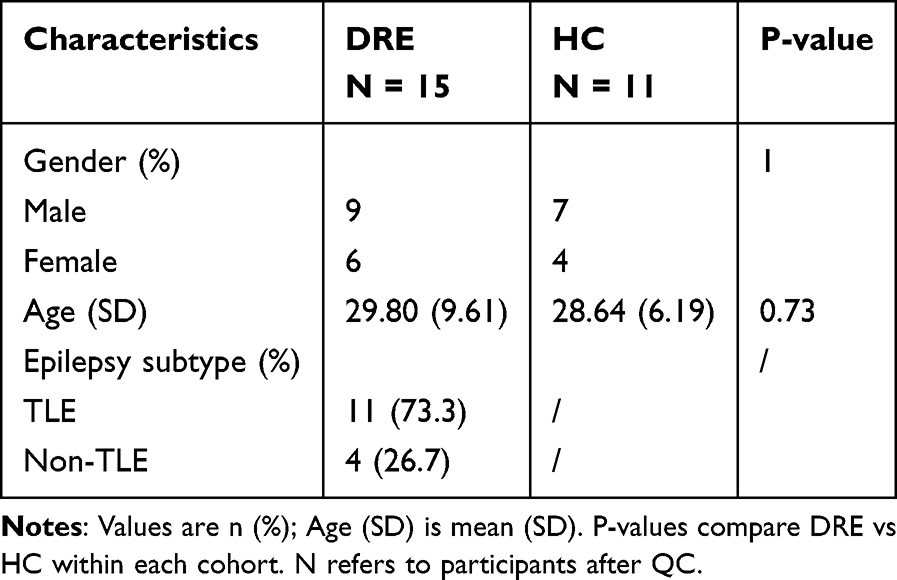 |
Table 2 Baseline Characteristics of the Validation Cohort |
Voxel-Based Morphometry
In the discovery cohort, VBM revealed widespread gray-matter reductions in DRE after cluster-level FWE correction, with prominent involvement of the ventral temporal cortex and extending into the occipital–parietal cortex and medial orbitofrontal/cingulate territories (Figure 1 and Supplementary Table 1). All models included age, sex, and TIV as covariates; only clusters surviving cluster-level FWE correction are displayed.
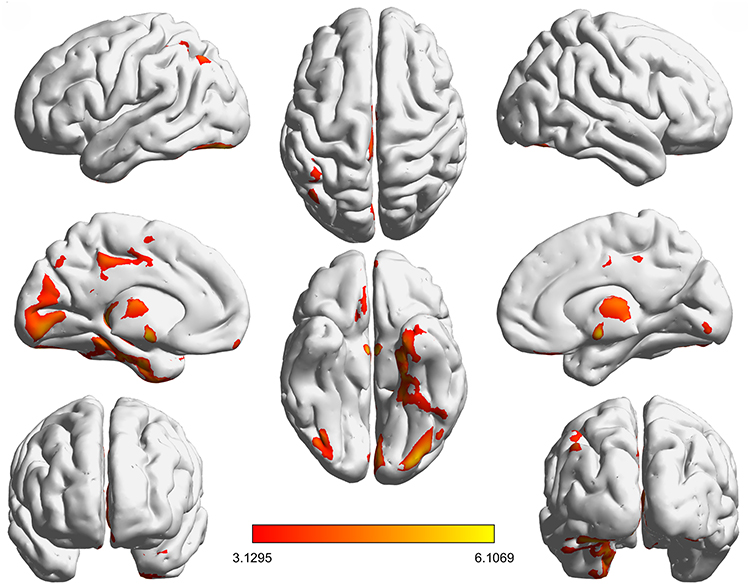 |
Figure 1 Spatial pattern of gray-matter abnormalities in drug-resistant epilepsy. Notes: Axial slice overlays of brain regions showing significant gray matter (GM) volume differences in the discovery cohort based on voxel-wise two-sample t-tests in SPM12. All models included age, sex, and TIV as covariates. Statistical maps were thresholded at p < 0.05, cluster-level family-wise error (FWE) correction (whole-brain). The color bar represents T values (higher values indicate stronger between-group effects). |
Prespecified stratified analyses further indicated subtype-specific atrophy topographies in the discovery cohort (Supplementary Figure 2 and Supplementary Table 2). Compared with HC, TLE showed a broader pattern encompassing thalamic and ventral temporal regions, with additional involvement of medial frontal/cingulate territories and cerebellar clusters. In contrast, non-TLE exhibited a more focal pattern, with effects predominantly centered on the cerebellum. Laterality-defined analyses suggested partially overlapping but non-identical distributions: left TLE was characterized by thalamic involvement accompanied by inferior temporal and inferior parietal extensions, whereas right TLE showed thalamic and ventral temporal involvement with additional cerebellar effects.
In the validation cohort, the overall spatial pattern was broadly concordant, with gray-matter loss centered on temporal–limbic regions and smaller effects in orbitofrontal areas (Supplementary Figure 3 and Supplementary Table 3).
Prespecified stratified analyses in the validation cohort likewise suggested subtype-specific atrophy patterns. Compared with HC, TLE exhibited significant GM volume reductions primarily concentrated in ventral and mesial temporal regions, including the left fusiform gyrus and right parahippocampal gyrus/hippocampus, with additional involvement of the right superior temporal pole (Supplementary Figure 4 and Supplementary Table 4). In contrast, the non-TLE vs HC comparison did not yield any significant clusters after whole-brain correction, indicating no detectable subtype-specific atrophy at the current sample size and statistical threshold.
Morphometric Similarity Network
In the discovery cohort, ANCOVA with HC3 heteroskedasticity-consistent standard errors (covariates: age, sex, TIV) found no between-group differences after FDR correction in the global MSN metrics—global meanMS and the graph measures AUC-C, AUC-L, and AUC-σ (Figure 2A). By contrast, regional meanMS (nodal strength) identified three FDR-significant regions with lower values in DRE: left isthmus cingulate, right medial orbitofrontal, and right pars triangularis (Figure 2B and Table 3). In prespecified stratified analyses within the discovery cohort, the TLE vs HC contrast reproduced the same regional meanMS reductions, localized to the left isthmus cingulate, right medial orbitofrontal cortex, and right pars triangularis (Supplementary Figure 5). In contrast, the non-TLE vs HC, left TLE vs HC, and right TLE vs HC contrasts showed no FDR-significant regional meanMS differences. The validation cohort tested these three parcels a priori and observed directionally concordant reductions in DRE, although they did not reach statistical significance (Supplementary Figure 6). In stratified analyses within the validation cohort, none of the subtype-specific contrasts yielded FDR-significant regional meanMS differences.
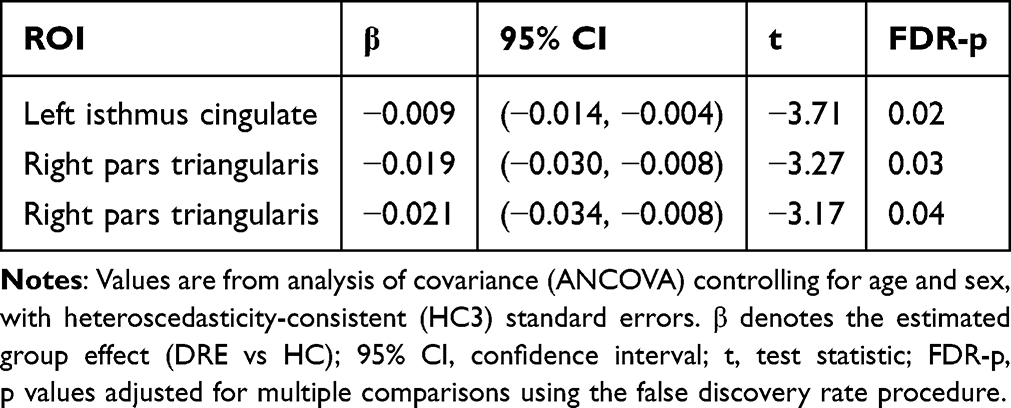 |
Table 3 Regional Nodal Strength Differences (MSN) Between DRE and HC |
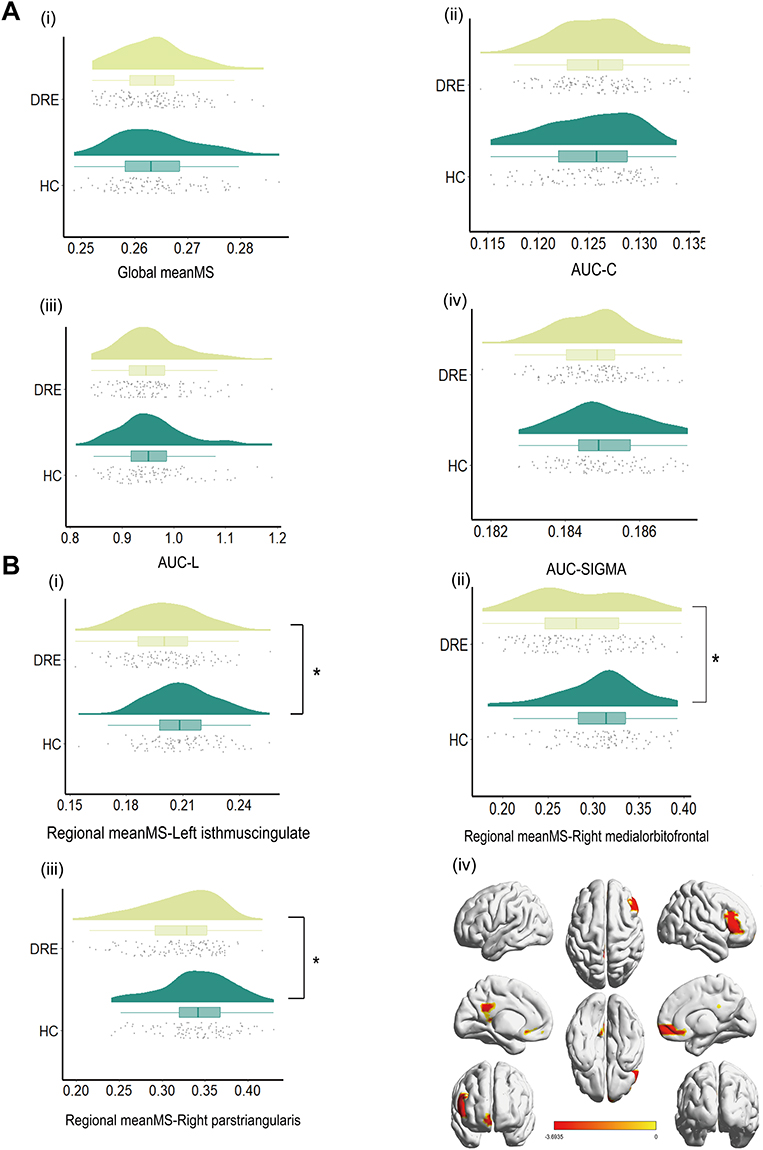 |
Figure 2 (A) Group comparison of global MSN metrics (DRE vs HC). (B) Group comparison of regional MSN metrics (DRE vs HC). Notes: (A) Distribution of four global morphometric similarity network (MSN) metrics in the discovery cohort is shown for DRE and HC: global meanMS, AUC-C (area-under-the-curve of clustering coefficient), AUC-L (area-under-the-curve of characteristic path length), and AUC-σ (area-under-the-curve of small-worldness). Violin plots are overlaid with boxplots and jittered points. Group differences were assessed using heteroskedasticity-consistent linear models (HC3), with age and sex included as covariates, and FDR correction was applied across the four tests; all tests were two-sided. No comparison survived multiple-comparison correction (q ≥ 0.05). (B) (i–iii) Distributions of regional_meanMS in the discovery cohort for the left isthmus cingulate, right medial orbitofrontal, and right pars triangularis; (iv) cortical projection of significant parcels. Group differences were tested using HC3-robust linear models with age and sex included as covariates, with two-sided testing and FDR correction across parcels. All three parcels showed lower regional_meanMS in DRE than in HC (q < 0.05), indicating focal MSN weakening in limbic/orbitofrontal and frontal territories. Significance symbols: *q < 0.05, **q < 0.01, ***q < 0.001. |
Spatial Correlations with Neurobiological Maps
In the discovery cohort, JuSpace analyses identified significant spatial coupling between the atrophy map and two neurotransmitter templates—5-HT1B, and mGluR5—with positive associations after FDR correction (Figure 3A and Table 4). The cellular/mitochondrial panel showed that mitochondrial Complex I (NADH dehydrogenase), Complex IV (cytochrome c oxidase), and respiratory capacity remained positively associated with the atrophy pattern and survived FDR correction, and a neuronal subtype map (neuron-Ex6-SubcortProject-L56) also showed a significant positive association. In contrast, the remaining neuronal and glial-class maps did not survive FDR correction (Figure 3B and Table 4). Applying the same specification to the validation cohort yielded no FDR-significant correlations. Nonetheless, effect directions were concordant with the discovery cohort for 5-HT1B, neuron-Ex6-SubcortProject-L56, Complex I, and Complex IV, whereas mGluR5 and mitochondria-RespiratoryCapacity showed the opposite sign, which may reflect cohort heterogeneity and/or sampling variability; this point is further discussed below. Full validation plots are provided in Supplementary Figure 7A and 7B.
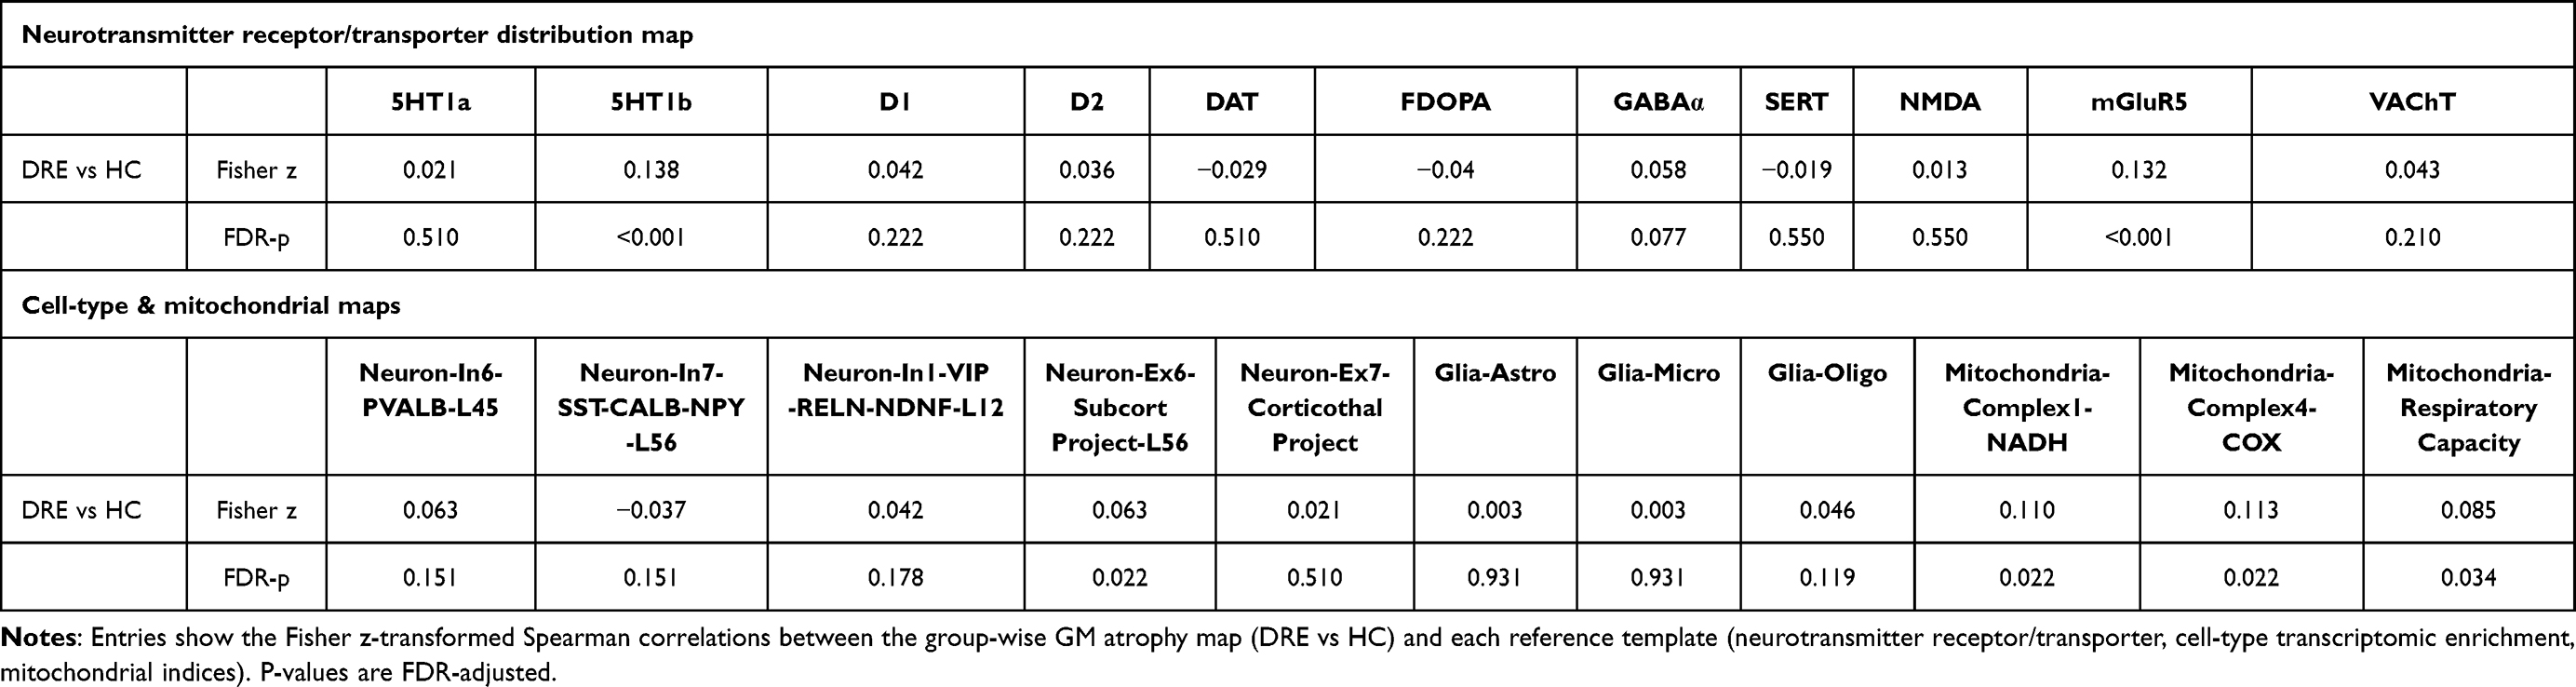 |
Table 4 Spatial Correspondence Between Group-Wise GM Atrophy and Neurotransmitter, Cell-Type, and Mitochondrial Maps |
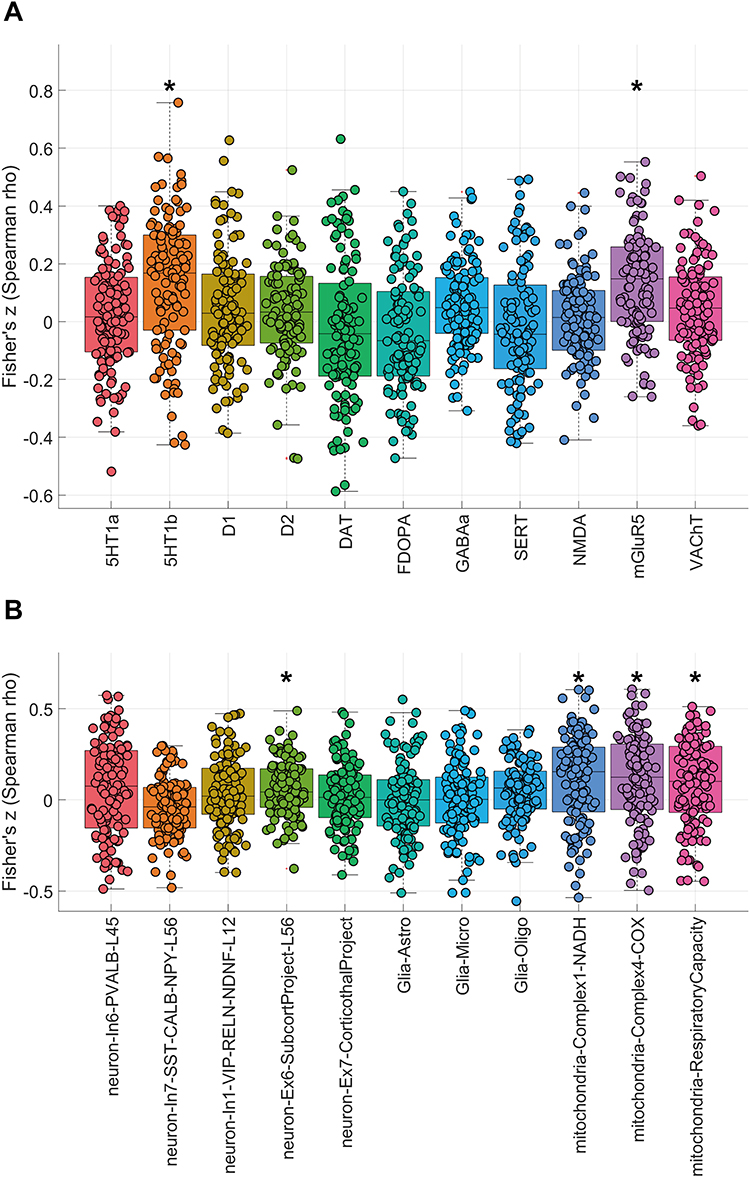 |
Figure 3 (A) Spatial coupling between gray-matter atrophy and neurotransmitter maps. (B) Spatial correlations between gray-matter atrophy and cell-type/mitochondrial maps. Notes: (A) Boxplots depict Fisher’s z-transformed Spearman correlation coefficients between the DRE vs HC regional gray-matter atrophy pattern and reference PET/SPECT neurotransmitter maps in the discovery dataset. Asterisks (*) denote associations surviving BH–FDR correction (q < 0.05). The atrophy pattern showed FDR-significant positive correlations with 5-HT1b and mGluR5, whereas correlations with the remaining neurotransmitter systems did not survive FDR correction. (B) Boxplots depict Fisher’s z-transformed Spearman correlation coefficients between the DRE vs HC regional gray-matter atrophy pattern and reference cell-type and mitochondrial maps in the discovery dataset. Asterisks (*) denote associations surviving BH–FDR correction (q < 0.05). The atrophy pattern showed FDR-significant positive correlations with neuron-Ex6-SubcortProject-L56, mitochondrial Complex I (NADH dehydrogenase), mitochondrial Complex IV (cytochrome c oxidase), and mitochondrial respiratory capacity, whereas correlations with the remaining neuronal and glial-class maps did not survive FDR correction. |
In prespecified stratified analyses within the discovery cohort, the TLE vs HC contrast showed FDR-significant spatial correlations between the atrophy pattern and the distributions of 5-HT1B and mGluR5, whereas no cell-type or mitochondrial maps survived FDR correction in this contrast. The same pattern was observed in left TLE vs HC and right TLE vs HC, where 5-HT1B and mGluR5 remained FDR-significant, while cellular/mitochondrial associations were not significant after FDR correction (Supplementary Figures 8–10).
By contrast, the non-TLE vs HC contrast yielded a broader set of FDR-significant associations in the neurotransmitter panel, including 5-HT1B, D1, D2, NMDA, mGluR5, and VAChT, all showing positive spatial correlations with the atrophy pattern. In the cellular/mitochondrial panel, the non-TLE atrophy map also showed FDR-significant positive correlations with neuron-In1-VIP-RELN-NDNF-L12, neuron-Ex6-SubcortProject-L56, Glia-Oligo, mitochondrial Complex I (NADH dehydrogenase), mitochondrial Complex IV (cytochrome c oxidase), and mitochondria–respiratory capacity (Supplementary Figures 11 and 12).
In the validation cohort, none of the subtype-specific contrasts (TLE vs HC; non-TLE vs HC) yielded FDR-significant spatial correlations in the neurotransmitter, cell-type, or mitochondrial panels.
Because the validation cohort yielded no FDR-significant map-to-map correspondences across the neurotransmitter and cellular/mitochondrial panels, we conducted an additional spatial-autocorrelation–aware sensitivity analysis (spatial-null inference) in the discovery cohort to mitigate inflation driven by spatial dependence. For DRE vs HC, the atrophy pattern remained significantly associated (after FDR correction) with the neurotransmitter maps of 5-HT1B and mGluR5, whereas no cell-type or mitochondrial maps survived FDR correction (Supplementary Table 5). In stratified analyses, the right TLE vs HC contrast retained an FDR-significant correspondence for 5-HT1B, while the mGluR5 association was not significant under the sensitivity analysis. In contrast, the TLE vs HC and left TLE vs HC contrasts showed no FDR-significant correspondences for 5-HT1B or mGluR5, and the non-TLE vs HC contrast yielded no FDR-significant associations across the neurotransmitter or cellular/mitochondrial panels.
Predictive Modeling
From the MSN/JuSpace matrix, LASSO retained a compact set of nonzero predictors for DRE–HC classification (Figure 4). The most negative coefficient was for mGluR5, whereas the right pars triangularis had the largest positive coefficient; predictors reduced to zero were not displayed. Using this fixed subset, we trained logistic regression, LightGBM, random forest, and SVM under the same preprocessing pipeline and a fixed train/internal-test/external-validation split. ROC curves (Figure 5A–D) showed that logistic regression had the lowest discrimination, whereas the nonlinear models achieved higher AUCs in both internal testing and external validation. Calibration was model-dependent: logistic regression exhibited the greatest deviation from the reference line, LightGBM showed moderate miscalibration, and random forest and SVM were closer to ideal calibration across most probability ranges (Figure 5E–H). Overall, a parsimonious set of MSN- and JuSpace-derived features yielded reproducible out-of-sample discrimination between DRE and HC (Table 5).
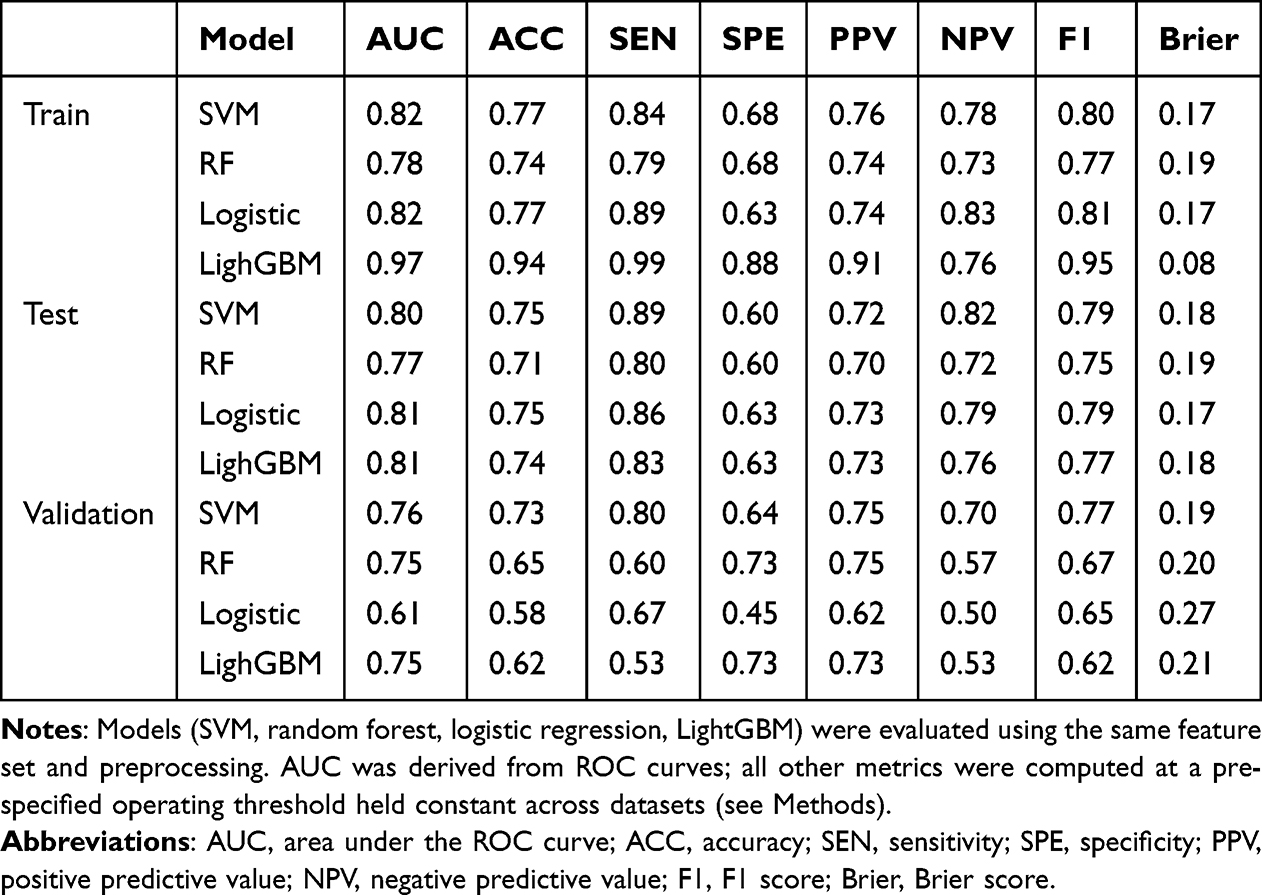 |
Table 5 Discrimination and Calibration Metrics of Four Classifiers Across Train, Internal Test, and External Validation Sets |
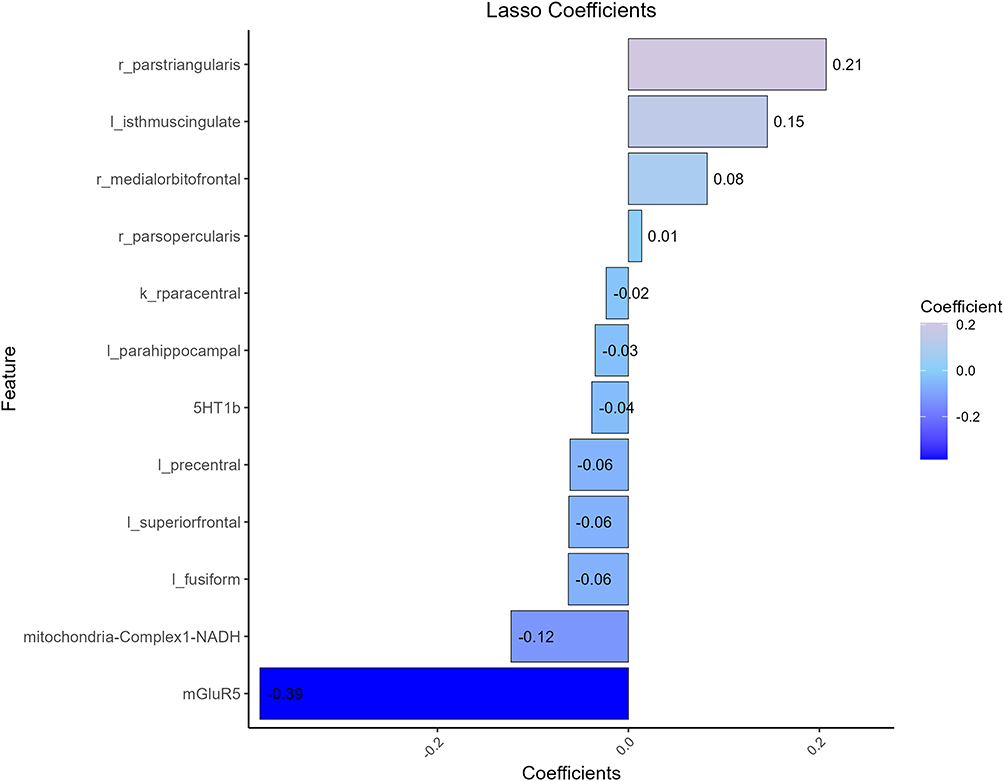 |
Figure 4 LASSO-selected features and their weights. Notes: LASSO retained non-zero coefficient predictors to distinguish DRE from HC. Bar length denotes standardized coefficients, ordered by absolute magnitude; positive indicates greater values favor DRE, negative indicates the opposite. Variables shrunk to zero are omitted. Notably, mGluR5 and mitochondrial Complex I (NADH) showed the strongest negative weights, whereas right pars triangularis, left isthmus cingulate, and right medial orbitofrontal showed the leading positive weights. |
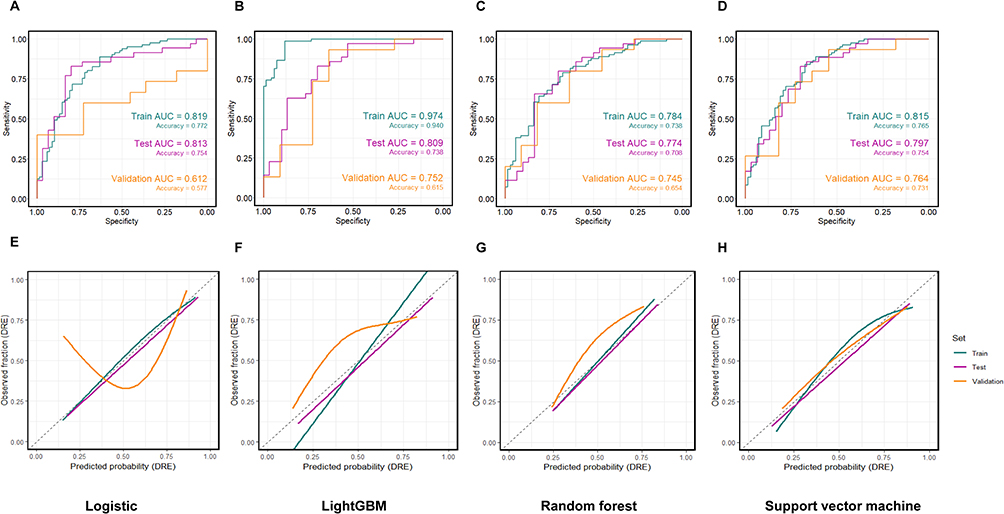 |
Figure 5 Discrimination and calibration of four classifiers (DRE vs HC). Notes: (A–D) ROC curves for logistic regression, LightGBM, random forest, and support vector machine on the training, internal test, and external validation sets; AUC and accuracy are shown on the plots. (E–H) Corresponding probability calibration curves (observed vs predicted; dashed line indicates perfect calibration; curves are smoothed fits). All models used the same feature set and preprocessing and were evaluated on a fixed train/test/validation split. Full metrics are reported in Table 5. |
Discussion
In this study, we delineate a cross-center macrostructural signature of DRE: VBM shows temporo-limbic gray-matter loss; MSNs indicate relative global stability with focal reductions in regional meanMS (cingulate, medial orbitofrontal, inferior frontal pars triangularis). In parallel, group-wise atrophy showed spatial correspondence—under family-wise FDR control—with two neurotransmitter templates (5-HT1B and mGluR5) in the discovery cohort, while the cellular/mitochondrial panel identified positive associations with mitochondrial Complex I/IV, respiratory capacity, and one neuronal subtype map (neuron-Ex6-SubcortProject-L56). Applying the same JuSpace specification in the validation cohort yielded no FDR-significant correspondences; however, effect directions remained concordant for 5-HT1B, neuron-Ex6-SubcortProject-L56, and mitochondrial Complex I/IV, whereas mGluR5 and respiratory capacity showed opposite directions, suggesting cohort heterogeneity and/or sampling variability (discussed further below). Together, these findings answer our three questions by (i) demonstrating reproducible MSN reorganization at the regional—but not global—level, (ii) linking macrostructural change to specific neurochemical/bioenergetic geographies with controlled specificity, and (iii) supporting interpretable, cross-cohort discrimination from a pre-specified MSN-derived feature subset under fixed analysis settings, external evaluation, and calibration. This constitutes a testable imaging-to-biology framework in which subject-level MSNs enable group-level inference and GM-to-map alignment anchors macro-phenotypes to candidate neurochemical and bioenergetic axes, yielding near-term, falsifiable predictions (eg., receptor-specific PET or metabolic modulation targeted to overlapping cortical territories).
At the GM level, both cohorts exhibited a temporo-limbic–anchored pattern of loss that delineates a cortical vulnerability landscape rather than a wholesale cortical decline.12 Within a purely macrostructural account, recurrent seizure activity and activity-dependent plasticity can concentrate tissue stress in hippocampal–paralimbic and ventral frontal extensions, where high recurrence, hubness, and long-range convergence make regions more exposed to excitotoxic load and cumulative metabolic demand.16,49,50 The resulting focal volume loss provides a parsimonious substrate for lowered seizure threshold and efficient propagation routes, and it coheres with the clinical pattern of memory and executive–affective comorbidities.51 Our findings are in agreement with large multisite reports in epilepsy—most notably ENIGMA-Epilepsy—which highlight temporo-limbic-anchored atrophy.12,52
Building on this shared temporo-limbic anchor, the prespecified subtype analyses further suggest that atrophy topographies are not uniform across clinical localization phenotypes, but instead track the dominant seizure network and its downstream propagation routes. In the discovery cohort, the broader thalamo–ventral temporal pattern in TLE (with additional medial frontal/cingulate and cerebellar involvement) is mechanistically compatible with a hippocampo–thalamo–cortical axis in which recurrent limbic discharges engage thalamic relay/association nuclei,53–55 recruit medial prefrontal–cingulate control circuitry,56 and entrain cerebello-thalamo-cortical loops that may support compensatory timing57 and inhibition.58 The preferential involvement of cerebellar territories in non-TLE, as opposed to the circumscribed temporo-limbic pattern in TLE, likely reflects two complementary processes.59,60 First, the inherent etiologic heterogeneity of extra-temporal epilepsies may preclude the detection of a convergent cortical signature at the group level, leaving only common downstream nodes—such as the cerebellum—detectable.59 Second, the cerebellum may serve as a “vulnerability bottleneck” within the cerebello-thalamo-cortical loops; its prominent atrophy may result from a combination of transsynaptic degeneration secondary to widespread extra-temporal insults and the cumulative metabolic stress of chronic seizure modulation.58,61,62 The laterality-stratified TLE maps showed substantial overlap but were not mirror images.63–66 This pattern is compatible with known left–right asymmetries in limbic circuitry and side-dependent propagation routes,67 such that hippocampal–parahippocampal abnormalities on each side may preferentially extend to partially distinct thalamic and associative cortical regions.68 In the validation cohort, the TLE vs HC comparison reproduced a temporo-limbic/ventral temporal signature (fusiform, parahippocampal/hippocampal, and temporal pole involvement), whereas non-TLE vs HC did not survive correction, plausibly reflecting reduced power and greater subtype heterogeneity rather than true absence of effects. Notably, these mechanistic interpretations should be viewed as anatomically informed inferences rather than direct evidence of dynamic seizure propagation; without concurrent electrophysiological or functional measures (eg., intracranial EEG/EEG–fMRI), cross-sectional macrostructural maps cannot adjudicate the directionality or temporal dynamics of spread.
These subtype-dependent patterns broadly align with prior network-oriented and multisite evidence. ENIGMA-Epilepsy and related large-scale morphometric studies consistently report a temporo-limbic predilection in TLE, often implicating mesial temporal structures and extending toward ventral temporal and limbic association cortices,60,69 with variable thalamic engagement depending on disease burden and phenotyping granularity.54,70 The additional thalamic and medial frontal/cingulate components observed in our discovery TLE subgroup are likewise compatible with prior observations that thalamic involvement scales with long-standing or more severe epileptic activity and that fronto-limbic circuitry is frequently implicated in executive–affective comorbidity profiles. Conversely, the weaker and more focal signal in non-TLE is in line with reports emphasizing the heterogeneity of extra-temporal epilepsies and the consequent challenge of identifying a single convergent morphometric signature at the group level. Taken together, the stratified results refine the cohort-level “vulnerability landscape” by indicating that the temporo-limbic anchor is robust.
Building on this macrostructural landscape, we next asked whether network organization—captured by morphometric similarity—shows global reconfiguration or focal weakening. The observation of unchanged global MSN indices alongside lower regional meanMS in the cingulate, medial orbitofrontal cortex, and pars triangularis points to a selective weakening of morphometric affinity rather than a system-wide topological shift.18 In the discovery cohort, prespecified stratified analyses indicated that this three-parcel signature was most evident in the TLE vs HC contrast, while non-TLE vs HC and laterality-defined contrasts did not yield FDR-significant regional meanMS effects; in the validation cohort, these parcels showed directionally concordant reductions but did not reach statistical significance. Within the MSN framework—where similarity indexes the alignment of local microarchitectural profiles with the cortex-wide scaffold—these reductions suggest regional decoupling from integrative backbones that bridge default-mode and fronto-limbic streams. This pattern is consistent with our a priori view that high-traffic, integrative junctions carry disproportionate hub load (recurrent activation, cross-network transfer, context-dependent plasticity),49 making them prone to profile dispersion even when the mesoscale scaffold remains intact. Functionally, such focal disalignment on a preserved backbone offers a parsimonious account of efficient propagation corridors71 and the prominence of executive-affective/self-referential disturbances anchored to cingulo-frontal systems.72
More specifically, focal MSN weakening in cingulo–orbitofrontal and inferior frontal territories may be relevant to domains often impaired in chronic epilepsy, including behavioral flexibility and affective regulation.73–75 Mechanistically, reduced regional meanMS suggests that these hub-like parcels become less morphometrically “aligned” with the cortex-wide scaffold—their multifeature profiles (thickness/gyrification/sulcal depth/fractal dimension) diverge from those of other regions. This divergence is plausibly driven by activity-dependent and seizure-related remodeling (recurrent excitation, excitotoxic/metabolic stress, neuroinflammation, and maladaptive synaptic/structural plasticity), which can be spatially concentrated in temporo-limbic and fronto-cingulate circuits and progressively disrupt coordinated microarchitectural organization.76 However, the stratified and validation results caution against treating this mechanism as uniformly expressed across all phenotypes: extra-temporal epilepsies are etiologically and anatomically heterogeneous, and splitting by subtype/laterality reduces effective sample size while increasing the multiple-testing burden under FDR control, together lowering sensitivity to modest focal effects. Accordingly, the three-parcel pattern is best interpreted as a circuit-selective vulnerability most detectable in TLE-enriched comparisons, pending larger subtype-balanced validation. Functionally, because orbitofrontal–cingulate systems support updating of action–outcome contingencies and adaptive control,77 decoupling within these hubs may bias the system toward reduced flexibility and poorer affective regulation,78 consistent with executive–affective comorbidities in DRE. More broadly, repeated cycles of seizure recurrence and transient control may consolidate maladaptive network configurations, making it easier for the system to re-enter seizure-permissive states—a conceptual parallel to relapse-prone network states described in experimental neuropsychopharmacology.4
Our findings converge with reports in epilepsy describing local decreases in coupling within posterior–anterior cingulate links79 and diminished interactions between medial temporal and fronto-orbitocingulate territories, and they are compatible with diffusion/structural-covariance evidence for fronto-limbic and peri-temporal disconnection.14 Beyond epilepsy, a comparable “global preservation with regional disruption” motif has been noted in major depressive disorder (fronto-limbic hypoconnectivity),72 schizophrenia (regional morphometric-similarity anomalies amid modest global change),80 and Alzheimer’s disease (limbic-anchored network downstream effects),81 supporting a circuit-selective, hub-stress account rather than a unitary global deficit. In contrast to studies reporting differences in global efficiency or small-worldness, we detected no group effect on global MSN metrics; this divergence could reflect cohort composition (syndrome mix, disease stage), analytic choices (atlas grain, handling of negative edges, MST and density ranges, covariate strategy), site/medication heterogeneity, or statistical power.
To anchor macrostructural observations to putative mechanisms, we examined spatial correspondence between the group-wise atrophy pattern and reference neurotransmitter, cell-type, and mitochondrial templates using JuSpace with BH–FDR control. Throughout, we interpret significant map-to-map correspondence as shared spatial vulnerability rather than evidence of receptor up-/down-regulation or direct causal mediation, because our neurotransmitter and cellular/mitochondrial maps are normative reference templates and the atrophy pattern is derived from structural MRI.20,47
The positive spatial correspondence with the 5-HT1B template suggests that the DRE atrophy landscape preferentially overlaps territories characterized by dense serotonergic modulatory architecture, consistent with a neuromodulatory “gain-control” account in which serotonergic signaling shapes cortical excitability, synchrony, and the propensity for seizure recruitment and spread.82–85 Although spatial alignment does not imply receptor availability changes in our cohort, it supports the view that regions embedded in 5-HT–rich circuitry may be disproportionately exposed to recurrent activity-dependent remodeling and cumulative metabolic stress.86 This interpretation is compatible with preclinical evidence linking 5-HT1B signaling to seizure dynamics, where pharmacological manipulation of 5-HT1B can modulate seizure threshold and propagation in rodent models, providing a plausible mechanistic bridge between serotonergic topography and propagation-prone networks.87,88
In humans, serotonergic involvement in focal epilepsy is most robustly supported by PET studies of 5-HT1A, which commonly report reduced binding in temporal lobe epilepsy and related limbic territories, consistent with a broader role of serotonergic modulation in seizure susceptibility and network instability.89,90 Direct 5-HT1B PET evidence in focal epilepsy is comparatively limited; therefore, the present 5-HT1B correspondence is best viewed as extending the serotonergic PET literature (which is dominated by 5-HT1A) by implicating a presynaptic serotonergic axis as a spatial constraint on macrostructural vulnerability.91
The mGluR5 correspondence is mechanistically coherent with glutamate-dependent plasticity and excitability control. Group-I mGluRs, including mGluR5, can be pro-convulsant under hyperexcitable conditions, shape synaptic potentiation, and participate in epileptogenesis.92,93 Importantly, convergent human imaging and tissue evidence supports mGluR5 abnormalities in epilepsy. Lam et al (2019, Annals of Neurology) reported that [11C]ABP688 PET reveals focally reduced mGluR5 availability in the epileptogenic zone in MTLE, interpreted as receptor internalization and/or conformational changes under excessive glutamatergic drive.94 Complementing in vivo PET, Zimmermann et al (2022) reported reduced ABP688 binding in epileptogenic tissue, consistent with altered receptor state.95 Longitudinal preclinical PET further indicates that mGluR5 changes can evolve across epileptogenesis, supporting a stage-dependent relationship between glutamatergic signaling and the evolving structural phenotype.96
In the discovery cohort, the primary JuSpace specification yielded FDR-significant positive correspondences with mitochondrial Complex I, Complex IV, and respiratory capacity, and with one neuronal subtype map (neuron-Ex6-SubcortProject-L56). A mechanistic reading is that repeated seizure activity imposes sustained bioenergetic demand, calcium loading, and oxidative stress, making regions with higher oxidative phosphorylation requirements more vulnerable to cumulative tissue loss.97,98 This interpretation is consistent with classic human tissue evidence in TLE: Kunz et al (2000, Annals of Neurology) reported a specific deficiency of mitochondrial Complex I in the epileptic focus, directly linking seizure networks to respiratory chain99 vulnerability.
Notably, however, the spatial-autocorrelation–aware sensitivity analysis using Moran spectral randomization did not preserve FDR-significant cell-type/mitochondrial correspondences in DRE vs HC, whereas the transmitter correspondences did. This divergence suggests a hierarchy of robustness: neurotransmitter alignments appear comparatively stable to stricter spatial-null inference, while mitochondrial/cell-type associations may be more sensitive to spatial dependence, subgrouping, and sampling variability. Accordingly, the mitochondrial/cell-type findings are best framed as biologically plausible, hypothesis-generating enrichments that motivate targeted replication in larger, harmonized, and subtype-balanced cohorts.
Subtype-stratified analyses further suggested phenotype-dependent correspondence profiles. In the discovery cohort, TLE vs HC showed selective transmitter alignment with 5-HT1B and mGluR5 after FDR correction, while no cell-type or mitochondrial maps survived FDR correction in this contrast. The same pattern was observed in left TLE vs HC and right TLE vs HC, where 5-HT1B and mGluR5 remained FDR-significant but cellular/mitochondrial associations did not. Under spatial-null sensitivity testing, stratified correspondences were largely attenuated: right TLE vs HC retained an FDR-significant correspondence for 5-HT1B, whereas mGluR5 was no longer significant, and TLE vs HC and left TLE vs HC showed no FDR-significant transmitter correspondences. This pattern is consistent with expected reductions in effective sample size and increased multiplicity under subgrouping, compounded by stricter spatial-null inference.47,100
By contrast, non-TLE vs HC in the discovery cohort yielded a broader set of positive transmitter correspondences in the primary analysis (including 5-HT1B, D1, D2, NMDA, mGluR5, and VAChT) alongside several cell-type/mitochondrial associations (including neuron-In1-VIP-RELN-NDNF-L12, neuron-Ex6-SubcortProject-L56, Glia-Oligo, Complex I/IV, and respiratory capacity). A conservative synthesis is that extra-temporal epilepsies may exhibit greater etiologic and network heterogeneity,59 such that group-level convergence can appear as broader—but potentially less stable—molecular enrichments when evaluated under the primary specification. The subsequent attenuation of these non-TLE correspondences under spatial-null sensitivity analysis, together with the absence of FDR-significant correspondences in the validation cohort, supports interpreting the broader non-TLE alignment profile as exploratory rather than definitive.
The direction inconsistency for mGluR5 and mitochondrial respiratory capacity—across cohorts is likely multifactorial. First, the validation cohort is modest in size and yielded no FDR-significant correspondences overall, making weak map-to-map correlations particularly susceptible to sampling variability and sign instability when effect sizes are close to zero. Second, cohort differences in clinical composition (eg., disease stage and seizure burden, focus distribution/laterality, antiseizure medication exposure, and neuropsychiatric comorbidity) may shift the balance between excitatory drive and compensatory adaptations, thereby altering the apparent glutamatergic/energetic alignment under identical analysis settings. Third, cross-site heterogeneity in MRI acquisition and processing (scanner vendor/field strength, sequence and coil, reconstruction, motion, and residual registration biases) can influence parcel-wise gray-matter estimates and their alignment with reference templates; in this regime, even small systematic differences are sufficient to flip the sign of borderline correspondences. Taken together, these sign reversals most plausibly reflect a combination of limited power and cohort/site heterogeneity, and they argue for a cautious interpretation of directionality in template-based correspondences.
Finally, to gauge practical utility, we tested whether an a priori subset of MSN- and alignment-derived features supports interpretable out-of-sample discrimination between DRE and HC. All features of our predictive model are derived from routine, non-invasive, and repeatable T1 MRI: atlas-based morphometry (CT/SA/GI/SD) to build MSNs, plus alignment to public receptor/mitochondrial maps (JuSpace/Complex I/IV). This makes the pipeline radiation-free, low-cost, batchable on standard workstations, and feasible across centers. Relative to prior DRE studies emphasizing radiomics or EEG, we systematically introduce regional morphometric similarity and neurochemical/energetic geography as interpretable features; discrimination is jointly driven by meanMS reductions in cingulate/orbitofrontal/pars triangularis and alignment to 5-HT1B/D2/mGluR5 and Complex I/IV, consistent with a “circuit-vulnerability × molecular/energetic” substrate. In a heterogeneous setting (stage, laterality, medication, mood), an external AUC of 0.745 is realistic and useful; because features/thresholds were fixed in discovery and validation was single-shot, this estimate likely reflects transferable performance. Accordingly, we position the model as an aid for screening/triage and cohort enrichment, rather than a diagnostic replacement—prioritizing candidates for receptor-PET/metabolic imaging or presurgical work-ups and indicating putative sampling/modulation territories. In multimodal pathways, the approach complements radiomics/EEG; further multicenter work should quantify net clinical benefit via decision-curve analysis and PPV/NPV at clinical thresholds.
While these findings address our three questions, it should be noted that our study has several limitations. First, because this is a cross-sectional study, the observed imaging results and MSN findings reflect associations rather than causation; likewise, the JuSpace analyses quantify spatial correspondence between the group-level GM map and reference templates without implying directional or mechanistic causality. Second, the validation cohort is modest in size, so effects near zero—most visibly the mGluR5 alignment—are more sensitive to sampling variation. Third, information on potential clinical effect modifiers (disease stage, seizure-focus laterality, medication exposure, mood comorbidity) was incomplete in our cohorts, precluding stratified analyses and limiting subgroup-specific inferences. Fourth, our classifier targets DRE–HC separation and shows moderate generalization (AUC = 0.745), making it better suited for screening/triage and cohort enrichment than diagnostic replacement. Finally, MSN results can be method-dependent (atlas granularity, correlation metric, handling of negative edges, MST/density range); we mitigated flexibility with a pre-specified pipeline and family-wise corrections, but replication under alternative constructions remains important.
Conclusion
In conclusion, we found that GM atrophy in DRE is spatially correlated with neurotransmitter receptor and mitochondrial complex distributions, and MSN analyses indicated regional reductions in meanMS. Finally, we propose an MRI-only prediction model intended as a supportive tool for screening, stratification, and research cohort enrichment, rather than a diagnostic replacement, to help prioritize patients for further clinical evaluation. However, establishing the causal relationship between GM and the distributions of neurotransmitters and mitochondrial complexes, and further enhancing the clinical utility of the prediction model, will require larger-scale longitudinal and interventional studies.
Ethical Publication Statement
This retrospective study complied with the Declaration of Helsinki. Ethics approval was obtained from the General Hospital of Western Theater Command PLA IRB(s) (Approval No. [2025EC9-ky019]). All authors meet ICMJE authorship criteria, approve the final manuscript, and agree to publication.
Acknowledgments
We acknowledge all individuals who were responsible for the IDEAS. We thank the Xsmart Analysis Platform (https://www.xsmartanalysis.com/) for the analytical and visualization support provided in our research.
Author Contributions
All authors made a significant contribution to the work reported, whether that is in the conception, study design, execution, acquisition of data, analysis and interpretation, or in all these areas; took part in drafting, revising or critically reviewing the article; gave final approval of the version to be published; have agreed on the journal to which the article has been submitted; and agree to be accountable for all aspects of the work.
Funding
This work was supported by Joint key project of the General Hospital of the Western Theater Command of China [2019LH01], Project of Technology Innovation Talent Project of Sichuan Provincial Department of Science and Technology [2022JDRC0041], Medical Innovation Project [21WQ040], High-level scientific and technological innovation talent project [No number], and Department of Science and Technology of Sichuan Province [2024NSFSC0619].
Disclosure
The authors report no conflicts of interest in this work.
References
1. Perucca E, Perucca P, White HS, Wirrell EC. Drug resistance in epilepsy. Lancet Neurol. 2023;22(8):723–21. doi:10.1016/S1474-4422(23)00151-5
2. Novak A, Vizjak K, Rakusa M. Cognitive impairment in people with epilepsy. J Clin Med. 2022;11(1):267. doi:10.3390/jcm11010267
3. Feigin VL, Stark BA, Johnson CO. Global, regional, and national burden of stroke and its risk factors, 1990-2019: a systematic analysis for the Global Burden of Disease Study 2019. Lancet Neurol. 2021;20(10):795–820. doi:10.1016/S1474-4422(21)00252-0
4. Yunusoğlu O, Kalfa I, Demirel ME, et al. A comprehensive review of the pharmacological, therapeutic, and toxicological properties of boric acid and other boron-containing compounds: current landscape and future perspectives. Pharm Pharmacol. 2025;13:202–238. doi:10.19163/2307-9266-2025-13-3-202-238
5. Allahverdiyev O, Dzhafar S, Berköz M, Yıldırım M. Advances in current medication and new therapeutic approaches in epilepsy. East J Med. 2018;23(1).
6. Bernhardt BC, Bonilha L, Gross DW. Network analysis for a network disorder: the emerging role of graph theory in the study of epilepsy. Epilepsy Behav. 2015;50:162–170.
7. Koepp MJ, Hammers A, Labbé C, Woermann FG, Brooks DJ, Duncan JS. 11C-flumazenil PET in patients with refractory temporal lobe epilepsy and normal MRI. Neurology. 2000;54(2):332–339. doi:10.1212/WNL.54.2.332
8. Zhao H, Lin Y, Chen S, Li X, Huo H. 5-HT3 receptors: a potential therapeutic target for epilepsy. Curr Neuropharmacol. 2018;16(1):29–36. doi:10.2174/1570159X15666170508170412
9. Xie W, Koppula S, Kale MB, et al. Unraveling the nexus of age, epilepsy, and mitochondria: exploring the dynamics of cellular energy and excitability. Front Pharmacol. 2024;15:1469053. doi:10.3389/fphar.2024.1469053
10. Wood H. Cortical thinning in epilepsy is linked to microglial activation. Nat Rev Neurol. 2021;17(10):595. doi:10.1038/s41582-021-00559-9
11. Bonilha L, Rorden C, Castellano G, et al. Voxel-based morphometry reveals gray matter network atrophy in refractory medial temporal lobe epilepsy. Arch Neurol. 2004;61(9):1379–1384. doi:10.1001/archneur.61.9.1379
12. Sisodiya SM, Whelan CD, Hatton SN, et al. The ENIGMA-Epilepsy working group: mapping disease from large data sets. Human Brain Mapp. 2020;43(1):113–128. doi:10.1002/hbm.25037
13. Chiang S, Haneef Z. Graph theory findings in the pathophysiology of temporal lobe epilepsy. Clin Neurophysiol. 2014;125(7):1295–1305. doi:10.1016/j.clinph.2014.04.004
14. Larivière S, Royer J, Rodríguez-Cruces R, et al. Structural network alterations in focal and generalized epilepsy assessed in a worldwide ENIGMA study follow axes of epilepsy risk gene expression. Nat Commun. 2022;13(1):4320. doi:10.1038/s41467-022-31730-5
15. Perucca E, Bialer M, White HS. New GABA-Targeting therapies for the treatment of seizures and epilepsy: i. role of GABA as a modulator of seizure activity and recently approved medications acting on the GABA system. CNS Drugs. 2023;37(9):755–779. doi:10.1007/s40263-023-01027-2
16. Sumadewi KT, Harkitasari S, Tjandra DC. Biomolecular mechanisms of epileptic seizures and epilepsy: a review. Acta epileptologica. 2023;5(1):28. doi:10.1186/s42494-023-00137-0
17. Lopriore P, Gomes F, Montano V, Siciliano G, Mancuso M. Mitochondrial epilepsy, a challenge for neurologists. Int J Mol Sci. 2022;23(21):13216. doi:10.3390/ijms232113216
18. Seidlitz J, Váša F, Shinn M, et al. Morphometric similarity networks detect microscale cortical organization and predict inter-individual cognitive variation. Neuron. 2018;97(1):231–47.e7. doi:10.1016/j.neuron.2017.11.039
19. King DJ, Wood AG. Clinically feasible brain morphometric similarity network construction approaches with restricted magnetic resonance imaging acquisitions. Network Neurosci. 2020;4(1):274–291. doi:10.1162/netn_a_00123
20. Dukart J, Holiga S, Rullmann M, et al. JuSpace: A Tool for Spatial Correlation Analyses of Magnetic Resonance Imaging Data with Nuclear Imaging Derived Neurotransmitter Maps. Wiley Online Library;2021. Report No.: 1065-9471.
21. Taylor PN, Wang Y, Simpson C, et al. The Imaging Database for Epilepsy and Surgery (IDEAS). Epilepsia. 2025;66(2):471–481. doi:10.1111/epi.18192
22. Savli M, Bauer A, Mitterhauser M, et al. Normative database of the serotonergic system in healthy subjects using multi-tracer PET. NeuroImage. 2012;63(1):447–459. doi:10.1016/j.neuroimage.2012.07.001
23. Kaller S, Rullmann M, Patt M, et al. Test-retest measurements of dopamine D(1)-type receptors using simultaneous PET/MRI imaging. Eur J Nucl Med Mol Imaging. 2017;44(6):1025–1032. doi:10.1007/s00259-017-3645-0
24. Alakurtti K, Johansson JJ, Joutsa J, et al. Long-term test-retest reliability of striatal and extrastriatal dopamine D2/3 receptor binding: study with [(11)C]raclopride and high-resolution PET. J Cereb Blood Flow Metab. 2015;35(7):1199–1205. doi:10.1038/jcbfm.2015.53
25. Dukart J, Holiga Š, Chatham C, et al. Cerebral blood flow predicts differential neurotransmitter activity. Sci Rep. 2018;8(1):4074. doi:10.1038/s41598-018-22444-0
26. Gómez FJG, Huertas I, Ramírez JAL, Solís DG. Elaboración de una plantilla de SPM para la normalización de imágenes de PET con 18F-DOPA. Imagen Diagnóstica. 2018;9(01):23–25.
27. Galovic M, Al-Diwani A, Vivekananda U, Walker MC, Irani SR, Koepp MJ. In vivo N-Methyl-d-Aspartate receptor (NMDAR) density as assessed using positron emission tomography during recovery from NMDAR-Antibody encephalitis. JAMA Neurol. 2023;80(2):211–213. doi:10.1001/jamaneurol.2022.4352
28. Hansen JY, Shafiei G, Markello RD, et al. Mapping neurotransmitter systems to the structural and functional organization of the human neocortex. Nat Neurosci. 2022;25(11):1569–1581. doi:10.1038/s41593-022-01186-3
29. Hanada T. Ionotropic glutamate receptors in epilepsy: a review focusing on AMPA and NMDA receptors. Biomolecules. 2020;10(3):464. doi:10.3390/biom10030464
30. Sivakumar S, Ghasemi M, Schachter SC. Targeting NMDA receptor complex in management of epilepsy. Pharmaceuticals. 2022;15(10):1297. doi:10.3390/ph15101297
31. Bozzi Y, Borrelli E. The role of dopamine signaling in epileptogenesis. Front Cell Neurosci. 2013;7:157. doi:10.3389/fncel.2013.00157
32. Barone P, Palma V, DeBartolomeis A, Tedeschi E, Muscettola G, Campanella G. Dopamine D1 and D2 receptors mediate opposite functions in seizures induced by lithium-pilocarpine. Eur J Pharmacol. 1991;195(1):157–162. doi:10.1016/0014-2999(91)90394-6
33. Giovacchini G, Toczek MT, Bonwetsch R, et al. 5-HT 1A receptors are reduced in temporal lobe epilepsy after partial-volume correction. J Nucl Med. 2005;46(7):1128–1135.
34. Hasler G, Bonwetsch R, Giovacchini G, et al. 5-HT1A receptor binding in temporal lobe epilepsy patients with and without major depression. Biol. Psychiatry. 2007;62(11):1258–1264. doi:10.1016/j.biopsych.2007.02.015
35. Wang Y, Tan B, Wang Y, Chen Z. Cholinergic signaling, neural excitability, and epilepsy. Molecules. 2021;26(8).
36. Hawrylycz MJ, Lein ES, Guillozet-Bongaarts AL, et al. An anatomically comprehensive atlas of the adult human brain transcriptome. Nature. 2012;489(7416):391–399. doi:10.1038/nature11405
37. Lake BB, Ai R, Kaeser GE, et al. Neuronal subtypes and diversity revealed by single-nucleus RNA sequencing of the human brain. Science. 2016;352(6293):1586–1590. doi:10.1126/science.aaf1204
38. Darmanis S, Sloan SA, Zhang Y, et al. A survey of human brain transcriptome diversity at the single cell level. Proc Natl Acad Sci USA. 2015;112(23):7285–7290. doi:10.1073/pnas.1507125112
39. Yao Z, van Velthoven CTJ, Nguyen TN, et al. A taxonomy of transcriptomic cell types across the isocortex and hippocampal formation. Cell. 2021;184(12):3222–41.e26. doi:10.1016/j.cell.2021.04.021
40. Tasic B, Yao Z, Graybuck LT, et al. Shared and distinct transcriptomic cell types across neocortical areas. Nature. 2018;563(7729):72–78. doi:10.1038/s41586-018-0654-5
41. Tremblay R, Lee S, Rudy B. GABAergic interneurons in the neocortex: from cellular properties to circuits. Neuron. 2016;91(2):260–292. doi:10.1016/j.neuron.2016.06.033
42. Fishell G, Kepecs A. Interneuron types as attractors and controllers. Ann Rev Neurosci. 2020;43:1–30. doi:10.1146/annurev-neuro-070918-050421
43. Sanz P, Rubio T, Garcia-Gimeno MA. Neuroinflammation and epilepsy: from pathophysiology to therapies based on repurposing drugs. Int J Mol Sci. 2024;25(8):4161. doi:10.3390/ijms25084161
44. Mosharov EV, Rosenberg AM, Monzel AS, et al. A human brain map of mitochondrial respiratory capacity and diversity. Nature. 2025;641(8063):749–58.
45. Burtscher J, Zangrandi L, Schwarzer C, Gnaiger E. Differences in mitochondrial function in homogenated samples from healthy and epileptic specific brain tissues revealed by high-resolution respirometry. Mitochondrion. 2015;25:104–112. doi:10.1016/j.mito.2015.10.007
46. Aguiar CC, Almeida AB, Araújo PV, et al. Oxidative stress and epilepsy: literature review. Oxid Med Cell Longev. 2012;2012:795259. doi:10.1155/2012/795259
47. Alexander-Bloch AF, Shou H, Liu S, et al. On testing for spatial correspondence between maps of human brain structure and function. NeuroImage. 2018;178:540–551. doi:10.1016/j.neuroimage.2018.05.070
48. de Wael R V, Benkarim O, Paquola C, et al. BrainSpace: a toolbox for the analysis of macroscale gradients in neuroimaging and connectomics datasets. Commun Biol. 2020;3(1):103. doi:10.1038/s42003-020-0794-7
49. Van Den Heuvel MP, Sporns O. Network hubs in the human brain. Trend Cognit Sci. 2013;17(12):683–696. doi:10.1016/j.tics.2013.09.012
50. Choy M, Dadgar-Kiani E, Cron GO, et al. Repeated hippocampal seizures lead to brain-wide reorganization of circuits and seizure propagation pathways. Neuron. 2022;110(2):221–36.e4. doi:10.1016/j.neuron.2021.10.010
51. Vinti V, Dell’Isola GB, Tascini G, et al. Temporal lobe epilepsy and psychiatric comorbidity. Front Neurol. 2021;12:775781. doi:10.3389/fneur.2021.775781
52. Liu M, Bernhardt BC, Bernasconi A, Bernasconi N. Gray matter structural compromise is equally distributed in left and right temporal lobe epilepsy. Human Brain Mapp. 2016;37(2):515–524. doi:10.1002/hbm.23046
53. Mueller SG, Laxer KD, Barakos J, et al. Involvement of the thalamocortical network in TLE with and without mesiotemporal sclerosis. Epilepsia. 2010;51(8):1436–1445. doi:10.1111/j.1528-1167.2009.02413.x
54. Bernhardt BC, Bernasconi N, Kim H, Bernasconi A. Mapping thalamocortical network pathology in temporal lobe epilepsy. Neurology. 2012;78(2):129–136. doi:10.1212/WNL.0b013e31823efd0d
55. Barron DS, Fox PM, Laird AR, Robinson JL, Fox PT. Thalamic medial dorsal nucleus atrophy in medial temporal lobe epilepsy: a VBM meta-analysis. NeuroImage Clin. 2012;2:25–32. doi:10.1016/j.nicl.2012.11.004
56. Danielson NB, Guo JN, Blumenfeld H. The default mode network and altered consciousness in epilepsy. Behav Neurol. 2011;24(1):55–65. doi:10.1155/2011/912720
57. Ivry RB, Spencer RM. The neural representation of time. Curr Opin Neurobiol. 2004;14(2):225–232. doi:10.1016/j.conb.2004.03.013
58. Streng ML, Krook-Magnuson E. The cerebellum and epilepsy. Epilepsy Behav. 2021;121(Pt B):106909. doi:10.1016/j.yebeh.2020.106909
59. Hall GR, Hutchings F, Horsley J, et al. Epileptogenic networks in extra temporal lobe epilepsy. Network Neurosci. 2023;7(4):1351–1362. doi:10.1162/netn_a_00327
60. Whelan CD, Altmann A, Botía JA, et al. Structural brain abnormalities in the common epilepsies assessed in a worldwide ENIGMA study. Brain. 2018;141(2):391–408. doi:10.1093/brain/awx341
61. Kros L, Eelkman Rooda OH, Spanke JK, et al. Cerebellar output controls generalized spike-and-wave discharge occurrence. Ann Neurol. 2015;77(6):1027–1049. doi:10.1002/ana.24399
62. Ibdali M, Hadjivassiliou M, Grünewald RA, Shanmugarajah PD. Cerebellar degeneration in epilepsy: a systematic review. Int J Environ Res Public Health. 2021;18(2):473. doi:10.3390/ijerph18020473
63. Park BY, Larivière S, Rodríguez-Cruces R, et al. Topographic divergence of atypical cortical asymmetry and atrophy patterns in temporal lobe epilepsy. Brain. 2022;145(4):1285–1298. doi:10.1093/brain/awab417
64. Yu Y, Chu L, Liu C, Huang M, Wang H. Alterations of white matter network in patients with left and right non-lesional temporal lobe epilepsy. Eur Radiol. 2019;29(12):6750–6761. doi:10.1007/s00330-019-06295-5
65. Vanicek T, Hahn A, Traub-Weidinger T, et al. Insights into intrinsic brain networks based on graph theory and PET in right- compared to left-sided temporal lobe epilepsy. Sci Rep. 2016;6:28513. doi:10.1038/srep28513
66. Pizzanelli C, Pesaresi I, Milano C, et al. Distinct limbic connectivity in left and right benign mesial temporal lobe epilepsy: evidence from a resting state functional MRI study. Front Neurol. 2022;13:943660. doi:10.3389/fneur.2022.943660
67. Robinson JL, Salibi N, Deshpande G. Functional connectivity of the left and right hippocampi: evidence for functional lateralization along the long-axis using meta-analytic approaches and ultra-high field functional neuroimaging. NeuroImage. 2016;135:64–78. doi:10.1016/j.neuroimage.2016.04.022
68. Tung H, Pan SY, Lan TH, Lin YY, Peng SJ. Characterization of hippocampal-thalamic-cortical morphometric reorganization in temporal lobe epilepsy. Front Neurol. 2021;12:810186. doi:10.3389/fneur.2021.810186
69. Larivière S, Rodríguez-Cruces R, Royer J, et al. Network-based atrophy modeling in the common epilepsies: a worldwide ENIGMA study. Sci Adv. 2020;6(47). doi:10.1126/sciadv.abc6457
70. Coan AC, Appenzeller S, Bonilha L, Li LM, Cendes F. Seizure frequency and lateralization affect progression of atrophy in temporal lobe epilepsy. Neurology. 2009;73(11):834–842. doi:10.1212/WNL.0b013e3181b783dd
71. Chiang S, Stern JM, Engel J, Haneef Z. Structural-functional coupling changes in temporal lobe epilepsy. Brain Res. 2015;1616:45–57. doi:10.1016/j.brainres.2015.04.052
72. Kaiser RH, Andrews-Hanna JR, Wager TD, Pizzagalli DA. Large-Scale network dysfunction in major depressive disorder: a meta-analysis of resting-state functional connectivity. JAMA Psychiatry. 2015;72(6):603–611. doi:10.1001/jamapsychiatry.2015.0071
73. Tsuchida A, Doll BB, Fellows LK. Beyond reversal: a critical role for human orbitofrontal cortex in flexible learning from probabilistic feedback. J Neurosci. 2010;30(50):16868–16875. doi:10.1523/JNEUROSCI.1958-10.2010
74. Schoenbaum G, Saddoris MP, Stalnaker TA. Reconciling the roles of orbitofrontal cortex in reversal learning and the encoding of outcome expectancies. Ann NY Acad Sci. 2007;1121:320–335. doi:10.1196/annals.1401.001
75. Shackman AJ, Salomons TV, Slagter HA, Fox AS, Winter JJ, Davidson RJ. The integration of negative affect, pain and cognitive control in the cingulate cortex. Nat Rev Neurosci. 2011;12(3):154–167. doi:10.1038/nrn2994
76. Duma GM, Pellegrino G, Rabuffo G, et al. Altered spread of waves of activities at large scale is influenced by cortical thickness organization in temporal lobe epilepsy: a magnetic resonance imaging-high-density electroencephalography study. Brain Comm. 2024;6(1):fcad348. doi:10.1093/braincomms/fcad348
77. Wang BA, Veismann M, Banerjee A, Pleger B. Human orbitofrontal cortex signals decision outcomes to sensory cortex during behavioral adaptations. Nat Commun. 2023;14(1):3552. doi:10.1038/s41467-023-38671-7
78. Monosov IE, Haber SN, Leuthardt EC, Jezzini A. Anterior cingulate cortex and the control of dynamic behavior in primates. Curr Biol. 2020;30(23):R1442–r54. doi:10.1016/j.cub.2020.10.009
79. Liao W, Zhang Z, Pan Z, et al. Altered functional connectivity and small-world in mesial temporal lobe epilepsy. PLoS One. 2010;5(1):e8525. doi:10.1371/journal.pone.0008525
80. Joo SW, Jo YT, Choi W, et al. Topological abnormalities of the morphometric similarity network of the cerebral cortex in schizophrenia. Schizophrenia. 2024;10(1):57. doi:10.1038/s41537-024-00477-x
81. Qing Z, Chen F, Lu J, et al. Causal structural covariance network revealing atrophy progression in Alzheimer’s disease continuum. Human Brain Mapp. 2021;42(12):3950–3962. doi:10.1002/hbm.25531
82. Carlos-Lima E, Higa GSV, Viana FJC, et al. Serotonergic modulation of the excitation/inhibition balance in the visual cortex. Int J Mol Sci. 2023;25(1):519. doi:10.3390/ijms25010519
83. Sourbron J, Lagae L. Serotonin receptors in epilepsy: novel treatment targets? Epilepsia Open. 2022;7(2):231–246. doi:10.1002/epi4.12580
84. Cheng HM, Gao CS, Lou QW, Chen Z, Wang Y. The diverse role of the raphe 5-HTergic systems in epilepsy. Acta Pharmacol Sin. 2022;43(11):2777–2788. doi:10.1038/s41401-022-00918-2
85. Duma GM, Cuozzo S, Danieli A, et al. Dynamic excitation/inhibition balance preceding seizure onset and its link to functional and structural brain architecture. BMC Med. 2025;23(1):604. doi:10.1186/s12916-025-04447-7
86. Theodore WH. Does serotonin play a role in epilepsy? Epilepsy Curr. 2003;3(5):173–177. doi:10.1046/j.1535-7597.2003.03508.x
87. Stean TO, Atkins AR, Heidbreder CA, Quinn LP, Trail BK, Upton N. Postsynaptic 5-HT1B receptors modulate electroshock-induced generalised seizures in rats. Br J Pharmacol. 2005;144(5):628–635. doi:10.1038/sj.bjp.0706027
88. Wesołowska A, Nikiforuk A, Chojnacka-Wójcik E. Anticonvulsant effect of the selective 5-HT1B receptor agonist CP 94253 in mice. Eur J Pharmacol. 2006;541(1–2):57–63. doi:10.1016/j.ejphar.2006.04.049
89. Toczek MT, Carson RE, Lang L, et al. PET imaging of 5-HT1A receptor binding in patients with temporal lobe epilepsy. Neurology. 2003;60(5):749–756. doi:10.1212/01.WNL.0000049930.93113.20
90. Savic I, Lindström P, Gulyás B, Halldin C, Andrée B, Farde L. Limbic reductions of 5-HT1A receptor binding in human temporal lobe epilepsy. Neurology. 2004;62(8):1343–1351. doi:10.1212/01.WNL.0000123696.98166.AF
91. Gilliam FG, Hecimovic H, Gentry MS. Serotonergic therapy in epilepsy. Curr Opin Neurol. 2021;34(2):206–212. doi:10.1097/WCO.0000000000000901
92. Wong RK, Bianchi R, Chuang SC, Merlin LR. Group I mGluR-induced epileptogenesis: distinct and overlapping roles of mGluR1 and mGluR5 and implications for antiepileptic drug design. Epilepsy Curr. 2005;5(2):63–68. doi:10.1111/j.1535-7597.2005.05207.x
93. Huang L, Xiao W, Wang Y, et al. Metabotropic glutamate receptors (mGluRs) in epileptogenesis: an update on abnormal mGluRs signaling and its therapeutic implications. Neural Regenerat Res. 2024;19(2):360–368. doi:10.4103/1673-5374.379018
94. Lam J, DuBois JM, Rowley J, et al. In vivo metabotropic glutamate receptor type 5 abnormalities localize the epileptogenic zone in mesial temporal lobe epilepsy. Ann Neurol. 2019;85(2):218–228. doi:10.1002/ana.25404
95. Zimmermann M, Minuzzi L, Aliaga Aliaga A, et al. Reduced metabotropic glutamate receptor type 5 availability in the epileptogenic hippocampus: an in vitro study. Front Neurol. 2022;13:888479. doi:10.3389/fneur.2022.888479
96. Choi H, Kim YK, Oh SW, et al. In vivo imaging of mGluR5 changes during epileptogenesis using [11C]ABP688 PET in pilocarpine-induced epilepsy rat model. PLoS One. 2014;9(3):e92765. doi:10.1371/journal.pone.0092765
97. Kovács R, Gerevich Z, Friedman A, et al. Bioenergetic mechanisms of seizure control. Front Cell Neurosci. 2018;12:335. doi:10.3389/fncel.2018.00335
98. Rho JM, Boison D. The metabolic basis of epilepsy. Nat Rev Neurol. 2022;18(6):333–347. doi:10.1038/s41582-022-00651-8
99. Kunz WS, Kudin AP, Vielhaber S, et al. Mitochondrial complex I deficiency in the epileptic focus of patients with temporal lobe epilepsy. Ann Neurol. 2000;48(5):766–773. doi:10.1002/1531-8249(200011)48:5<766::AID-ANA10>3.0.CO;2-M
100. Wang X, Piantadosi S, Le-Rademacher J, Mandrekar SJ. Statistical considerations for subgroup analyses. J Thorac Oncol. 2021;16(3):375–380. doi:10.1016/j.jtho.2020.12.008
 © 2026 The Author(s). This work is published and licensed by Dove Medical Press Limited. The
full terms of this license are available at https://www.dovepress.com/terms
and incorporate the Creative Commons Attribution
- Non Commercial (unported, 4.0) License.
By accessing the work you hereby accept the Terms. Non-commercial uses of the work are permitted
without any further permission from Dove Medical Press Limited, provided the work is properly
attributed. For permission for commercial use of this work, please see paragraphs 4.2 and 5 of our Terms.
© 2026 The Author(s). This work is published and licensed by Dove Medical Press Limited. The
full terms of this license are available at https://www.dovepress.com/terms
and incorporate the Creative Commons Attribution
- Non Commercial (unported, 4.0) License.
By accessing the work you hereby accept the Terms. Non-commercial uses of the work are permitted
without any further permission from Dove Medical Press Limited, provided the work is properly
attributed. For permission for commercial use of this work, please see paragraphs 4.2 and 5 of our Terms.