Back to Journals » Infection and Drug Resistance » Volume 15
Molecular Epidemiology and Polymorphism Analysis in Drug-Resistant Genes in M. tuberculosis Clinical Isolates from Western and Northern India
Authors Rana V, Singh N, Nikam C, Kambli P, Singh PK, Singh U ![]() , Jain A, Rodrigues C, Sharma C
, Jain A, Rodrigues C, Sharma C ![]()
Received 9 December 2021
Accepted for publication 2 March 2022
Published 8 April 2022 Volume 2022:15 Pages 1717—1732
DOI https://doi.org/10.2147/IDR.S345855
Checked for plagiarism Yes
Review by Single anonymous peer review
Peer reviewer comments 2
Editor who approved publication: Prof. Dr. Héctor Mora-Montes
Vibhuti Rana,1 Nittu Singh,1 Chaitali Nikam,2 Priti Kambli,2 Pravin K Singh,3 Urmila Singh,3 Amita Jain,3 Camilla Rodrigues,2 Charu Sharma1
1CSIR- Institute of Microbial Technology, Chandigarh, 160036, India; 2Department of Microbiology, P. D. Hinduja National Hospital and Medical Research Centre, Mumbai, 400016, Maharashtra, India; 3Department of Microbiology, King George Medical University, Lucknow, 226003, Uttar Pradesh, India
Correspondence: Charu Sharma, CSIR-Institute of Microbial Technology, Sector 39-A, Chandigarh, 160036, India, Tel +911722880309/310, Fax +911722690585, Email [email protected]
Introduction: The mechanistic details of first line drug (FLD) resistance have been thoroughly explored but the genetic resistance mechanisms of second line injectables, which form the backbone of the combinatorial drug resistant tuberculosis therapy, are partially identified. This study aims to highlight the genetic and spoligotypic differences in the second line drug (SLD) resistant and sensitive Mycobacterium tuberculosis (Mtb) clinical isolates from Mumbai (Western India) and Lucknow (Northern India).
Methods: The rrs, eis, whiB7, tlyA, gyrA and gyrB target loci were screened in 126 isolates and spoligotyped.
Results: The novel mutations were observed in whiB7 loci (A43T, C44A, C47A, G48T, G59A and T152G in 5’-UTR; A42C, C253T and T270G in gene), tlyA (+CG200, G165A, C415G, and +G543) and gyrB (+G1359 and +A1429). Altogether, the rrs, eis, and whiB7 loci harbored mutations in ∼ 86% and ∼ 47% kanamycin resistant isolates from Mumbai and Lucknow, respectively. Mumbai strains displayed higher prevalence of mutations in gyrA (∼ 85%) and gyrB loci (∼ 13%) as compared to those from Lucknow (∼ 69% and ∼ 3.0%, respectively). Further, spoligotyping revealed that Beijing lineage is distributed equally amongst the drug resistant strains of Mumbai and Lucknow, but EAI-5 is existed at a higher level only in Mumbai. The lineages Manu2, CAS1-Delhi and T1 are more prevalent in Lucknow.
Conclusion: Besides identifying novel mutations in whiB7, tlyA and gyrB target loci, our analyses unveiled a potential polymorphic and phylogeographical demarcation among two distinct regions.
Keywords: drug resistant tuberculosis, single nucleotide polymorphism, rrs, eis, whiB7, spoligotyping
Introduction
Mycobacterium tuberculosis (Mtb) poses an intimidating and hazardous environment, affecting millions of lives each year globally. More so, the specter of drug resistance, owing to its resilience, presents a portentous global health threat to the mankind. Multidrug Resistant Tuberculosis (MDR TB), i.e., resistance to the two primary first line drugs (FLD) Isoniazid and Rifampicin, has complicated the treatment options for tuberculosis (TB). Furthermore, extensively drug resistant TB (XDR TB), wherein the MDR mycobacteria develop additional resistance to a second line drugs (SLDs), i.e., fluoroquinolone (FQ; e.g., ofloxacin, OFX; moxifloxacin; levofloxacin) and either of the three second line injectable (SLI) aminoglycosides (kanamycin, KAN; amikacin, AMK; or capreomycin, CAP), has worsened the scenario.1 Lately, Pre-XDR TB (resistance to either a FQ or an injectable aminoglycoside along with MDR-TB) presents another perilous threat for the high TB burden countries like India and China.2,3 At present, the SLDs also include bedaquiline, delamanid, linezolid, and pretomanid for the treatment of drug resistant TB.4 Though the use of SLIs is slowly being discouraged owing to their adverse side effects, they are still required in case of shorter treatment regimen and the lesser availability of newer SLDs in resource limited or developing countries like India.5
The slow growth of Mtb and diverse drug resistance mechanisms affects its successful management. Some of the drug resistance mechanisms are due to modification in the drug target site, structural and functional changes in the efflux pumps, etc. Resistance arises partly due to treatment errors, poor adherence by patients for long treatment, toxic side effects, incorrect/inconsistent use of SLIs in patients where FLDs fail, and timely unavailability of the drug susceptibility profiles.
Attempts towards rapid measurement of phenotypic drug resistance using modern day diagnostic techniques significantly diminish erroneous treatments. Besides, the state-of-the-art TB diagnostic programs are now transitioning from phenotypic to advanced genotypic levels, emphasizing the significance of genetic mutations in resistance determination. The genetic mutation-drug resistance relationships are quite evident in case of isoniazid (inhA, katG) and rifampicin (rpoB).6–8 The association between rrs and eis promoter mutations to SLI resistance has been widely noted.9–12 In addition, WhiB7 transcription regulator-mediated gene regulation serves as an aid to facilitate drug resistance and is linked to low level KAN resistance by transcriptional activation of eis.13,14 Loss of the methylation activity of the tlyA methyltransferase due to mutations disrupts the drug-ribosomal interaction conferring CAP resistance.15,16 The gyrAB quinolone resistance determining region (QRDR) mutations have also been attributed to FQ resistance in diverse geographical regions.17–19 Nonetheless, a clearer picture regarding the association of genetic mutations in eis, whiB7, tlyA, and gyrB loci in SLI and FQ resistance is required.
Single Nucleotide Polymorphisms (SNP) and genotypic co-analyses of drug resistance and specific lineages are increasingly being undertaken globally.20–26 Most of the reports correlating the drug resistant mutations with specific genotypes in India are based on the FLD and streptomycin (STR) resistance.27–30 The Indian geographical diversity with respect to lineage prevalence has been evaluated only to a limited extent, therefore, the true representation is lacking in global scenario.31–33 Although, an attempt by the recent review about the major distribution of different lineages in India has assigned Manu/Beijing/CAS to Western, Beijing to North-Eastern, CAS/Beijing to Northern and EAI to Southern India,34 inadequate information still exists on the relationships of SLD resistant mutation with different lineages.24,35,36 Therefore, this study aims to analyze and understand the mutational characteristics and lineages of clinical Mtb isolates from Mumbai, Western India and Lucknow, Northern India (Figure 1).
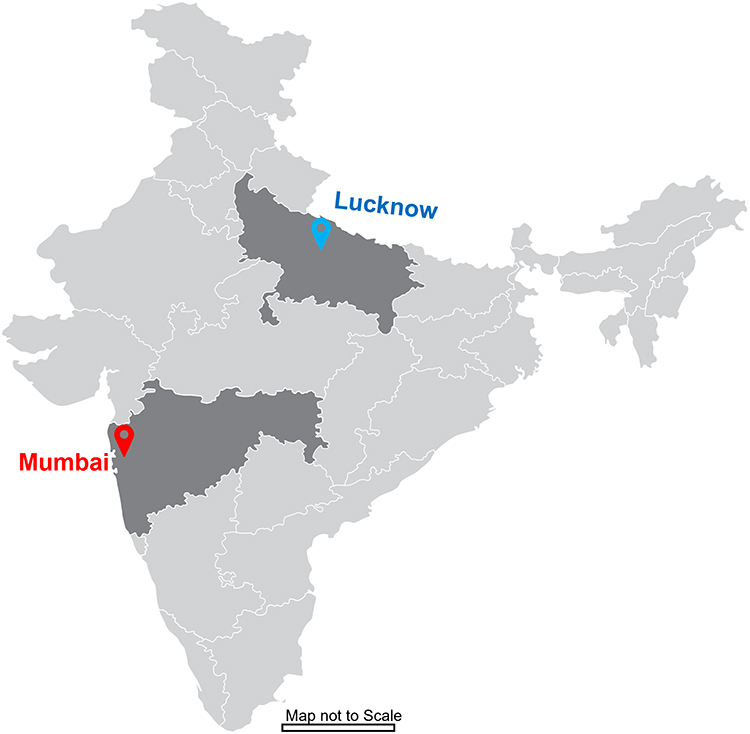 |
Figure 1 Geospatial Map of India indicating the location of two areas from where the clinical strains of M. tuberculosis have been obtained. |
Materials and Methods
Clinical Isolates of M. tuberculosis
Fifty-eight clinical isolates isolated from September 2015 to April 2016 were obtained from P. D. Hinduja National Hospital and Research Centre, Mumbai, Maharashtra. From these, two, eight, 20, and 28 isolates were pan-susceptible, MDR, Pre-XDR, and XDR, respectively. Sixty-eight isolates from February 2013 to March 2016 were obtained from Tertiary Care Centre Tuberculosis Laboratory, Department of Microbiology, King George Medical University (KGMU), Lucknow, Uttar Pradesh. Among these, 15, 28, and 23 isolates were MDR, Pre-XDR, and XDR, respectively and two isolates were sensitive to all the tested drugs. Out of these 68 isolates, the mutational analysis with respect to KAN resistance has been reported earlier for 58 isolates from Lucknow.37 Remaining 10 new SLD resistant isolates were obtained in March 2016 from Lucknow and evaluated in this study. Therefore, a total of 68 isolates from Lucknow have been compared with 58 isolates of Maharashtra for analyzing the target specific mutational prevalence and lineage identification. All the isolates were isolated consecutively from different patients in the reported period and each isolate corresponded to individual TB patient. The research was conducted following the national and institutional standards in accordance with the Declaration of Helsinki.
The number of resistant and sensitive isolates for each drug included in this study is listed in Table 1. The FLD and SLD resistance profiles of all the isolates from Mumbai and Lucknow are mentioned in Supplementary Table 1. For a few strains, the complete drug susceptibility testing (DST) profile could not be determined. Hence, they were not included in the mutational occurrence calculation, and therefore, only numbers have been provided in such cases.
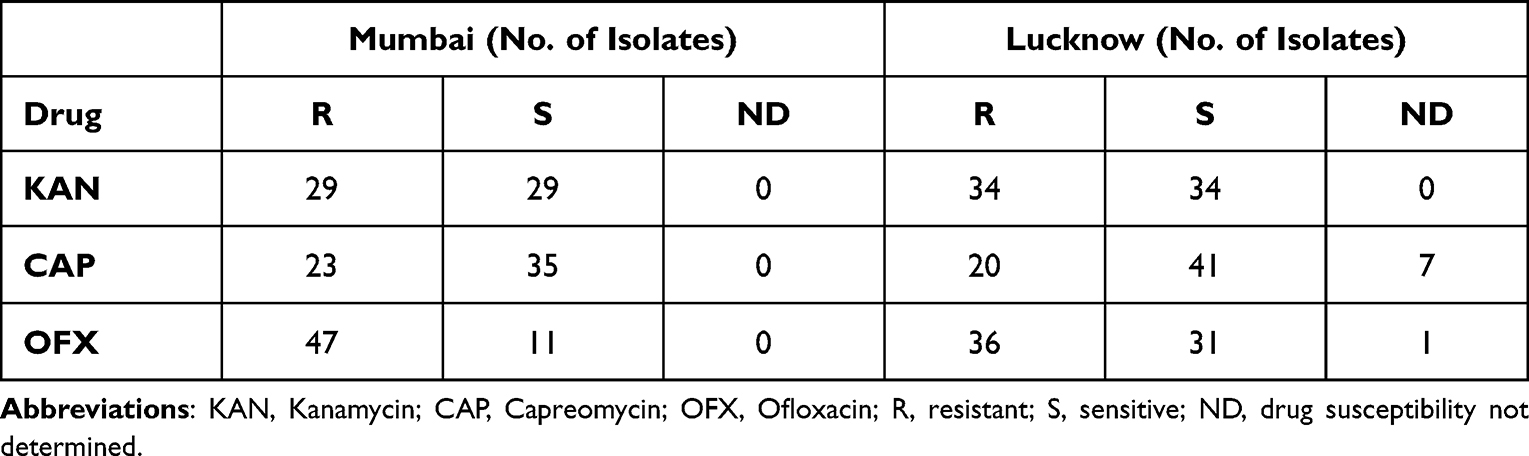 |
Table 1 Number of Drug Resistant and Drug Sensitive Isolates for Each Drug from Mumbai and Lucknow |
Ethical Statement
Consent was waived off by the Institutional Review board of P. D. Hinduja National Hospital and Research Centre, Mumbai, Maharashtra and the Ethics Committee of KGMU, Lucknow as deanonymized banked isolates with unique identification numbers with no link to patients were revived for the study.
Culture Growth and Determination of Minimum Inhibitory Concentration (MIC)
The mycobacterial cultures isolated and grown from the patient sputum samples at the tertiary care laboratories at KGMU, Lucknow and P.D. Hinduja National Hospital, Mumbai were inoculated and subcultured by streaking either on Lowenstein Jensen (LJ) media or Middlebrook 7H9 broth (BD Difco) followed by incubation at 37°C. The contamination was checked for after 24 h and 48 h. All the procedures dealing with Mtb isolates were handled in the standard Biosafety Level III laboratories (BSL-III) at the respective hospitals.
The resistance to the FLDs was determined using 1% proportional method described previously.38 The susceptibilities towards the SLIs, i.e., KAN, AMK, and CAP, were determined using Resazurin Microtiter Assay (REMA). The range of concentrations used was 1.25 µg/mL to 20 µg/mL for KAN/CAP; 0.25 µg/mL to 4.0 µg/mL for AMK; and 0.25 µg/mL to 8.0 µg/mL for OFX.39–41 Drug cut-off points by REMA were 2.5 µg/mL for KAN/CAP, 1.0 µg/mL for AMK, and 2.0 µg/mL for OFX. MIC was defined as the minimum concentration of respective drug required to prevent the change in the color of dye from oxidized blue to reduced pink state, indicative of mycobacterial growth.
Isolation of Genomic DNA from the Clinical Isolates
The genomic DNA was isolated from all resistant and sensitive isolates as described previously.37,42 Briefly, loopful of freshly subcultured colonies from each of the LJ medium bottles were resuspended in 200 µL of double distilled water in 1.5 mL microcentrifuge tubes (MCTs). The bacterial suspension was vortexed thrice for 10sec at 30sec intervals to allow proper dissolution of colonies and lysed by boiling at 95°C for 20 min in water bath. After cooling, 200 µL of chloroform was added and the lysates were centrifuged at 13,000 rpm for 10 min. The aqueous supernatant was transferred to fresh MCTs and used as templates for PCR.
PCR Amplification
The Pfu (M7741, Promega) and Q5 Polymerase (M0491, New England Biolabs) were used to amplify the target gene loci with the help of corresponding primers procured from Bioserve Biotechnologies Pvt. Ltd. The details of the primer sequences are provided in Supplementary Table 2. The cycling conditions were as follows: initial denaturation at 98°C for 30s; followed by 25 cycles of denaturation at 98°C for 20s, annealing at 55°C (rrs); 67°C (eis); 71°C (whiB7); 55°C (gyrA and gyrB); 65.5°C (tlyA) for 30s, extension at 72°C for 30s, and a final extension at 72°C for 2 min.
DNA Sequence Analyses
Sequencing of purified PCR products was performed using Applied Biosystems analyzer with ABI BigDye v3.1 Cycle Sequencing kit. Chromatograms obtained were analyzed using Finch TV version 1.4.0 software (Geospiza Inc.). Mutations were detected in the respective genes by sequence alignment with wild-type MtbH37Rv (NC_000962.3; GI: 448814763) (www.ncbi.nih.nlm.gov/blastn). Validations of all the mutations were done using forward as well as reverse sequencing reactions. Heterogeneous mutations in the chromatogram were comprehended as two peaks of different colors at a single peak position showing the presence of wild type and polymorphic nucleotide. The cut off called by the KBTM Basecaller for SNP calling was 25% for mixed bases. The quality value, which is per base estimate of the Basecaller accuracy, was 20 for pure bases and ranged between 10 and 20. The relative occurrence of SNPs for each isolate were calculated by dividing the number of genotypically resistant isolates carrying the mutation by the total number of phenotypically resistant isolates. The isolates with unknown drug susceptibility (not determined [ND]) profile were excluded from mutational prevalence calculation for the respective drug.
Spoligotyping
The spoligotyping of 58 clinical isolates of Mtb from Mumbai (2015 to 2016) and 68 isolates from Lucknow (2013 to 2016) was carried out by amplification of the 43 spacer sequences using DRa and DRb primers (DRa, 5’-GGTTTTGGGTCTGACGAC-3’ (biotinylated 5’ end) and DRb, 5’-CCGAGAGGGGACGGAAAC-3’) provided in the spoligotyping kit (Ocimum Biosolutions, Hyderabad). The standardized spoligotyping protocol has been described previously.43 Briefly, the cycling conditions used for spoligotyping were: initial denaturation at 95°C for 30s; followed by 35 cycles of denaturation at 95°C for 30s, annealing at 58°C for 30s, extension at 68°C for 30s, and a final extension at 68°C for 5 min. The amplified direct repeats were hybridized using MN45 Miniblotter and the manufacturer’s instructions were used for the chemiluminescent detection of the bound probes (BioRad Clarity Western ECL Blotting Substrate). The ambiguous patterns in the spoligotypes of 21 isolates were resolved using the spoligotyping services of Mapmygenome India Ltd. The results of the spoligotypic patterns were converted into binary format; with “0” representing no hybridization of the spacer and “1” representing hybridization (presence of spacer). The genomic DNA of MtbH37Rv and Mycobacterium bovis were used in this experiment as positive controls while reaction buffer was used as the negative control. Use of controls in each spoligotyping run ensured no cross contamination of samples or reagents.
Analyses of Spoligotypes
The SITVIT2 database was employed to identify their existence as known or orphan (not determined) spoligotypes.44 Spoligotype results of the clinical isolates used in this study were compared to the reference patterns available in the SITVIT2 database; and Shared International Types (SITs) were assigned to those which matched with the reference spoligotype patterns. The unmatched patterns which did not exist in the database at the time of analysis were termed as “Orphan or New”.
Clustering of Spoligotypes
The possible phylogenetic relationships between different isolates were deduced by clustering analysis using spolTools which generated spoligoforest trees with hierarchical layout for the two geographical locations.45 A cluster was defined as a spoligotype pattern shared by more than one isolate. This hierarchical representation has a “ranked” design where spoligotypes derived from the inferred parent are drawn below the parent.
Correlation Between Spoligotypes and Mutation Harboring Isolates
To understand the possible correlation of spoligotypic prevalence with isolates harboring the drug resistant mutations, a region-based evaluation was carried out. For each drug category, the percentage of relative lineage distribution among mutation-bearing drug resistant strains was calculated for the corresponding target loci. The significance of association of unique SLD mutations with different observed lineages was statistically analyzed using Chi-square test. Based on the absolute numbers of respective drug resistant strains carrying distinct mutations (Supplementary Table 3), the Chi-square test criterion of expected value to be ≥5 could not be fulfilled for CAP resistance in Mumbai strains and for all the drugs in Lucknow strains. Therefore, p-value for these two categories were not considered. For other two drugs in Mumbai strains, p-values of < 0.05 were considered significant. For statistical analysis, the mutation frequencies of Manu related spoligotypes for each of the unique drugs have been combined together.
GenBank Accession Numbers
The accession numbers of novel mutation harboring loci were MN131053-MN131064 for Mumbai isolates and MN166763-MN166777 for Lucknow isolates.
Results
KAN Resistance
rrs
In Mumbai, 16 out of 29 KANR isolates (55.1%) exhibited A1401G and C1402T in the rrs hot spot. The most prevalent mutation, A1401G, was found in 15 isolates (51.7%), followed by C1402T in one isolate (3.4%), (Table 2). None of the 29 KANS isolates displayed any polymorphism in the rrs loci.
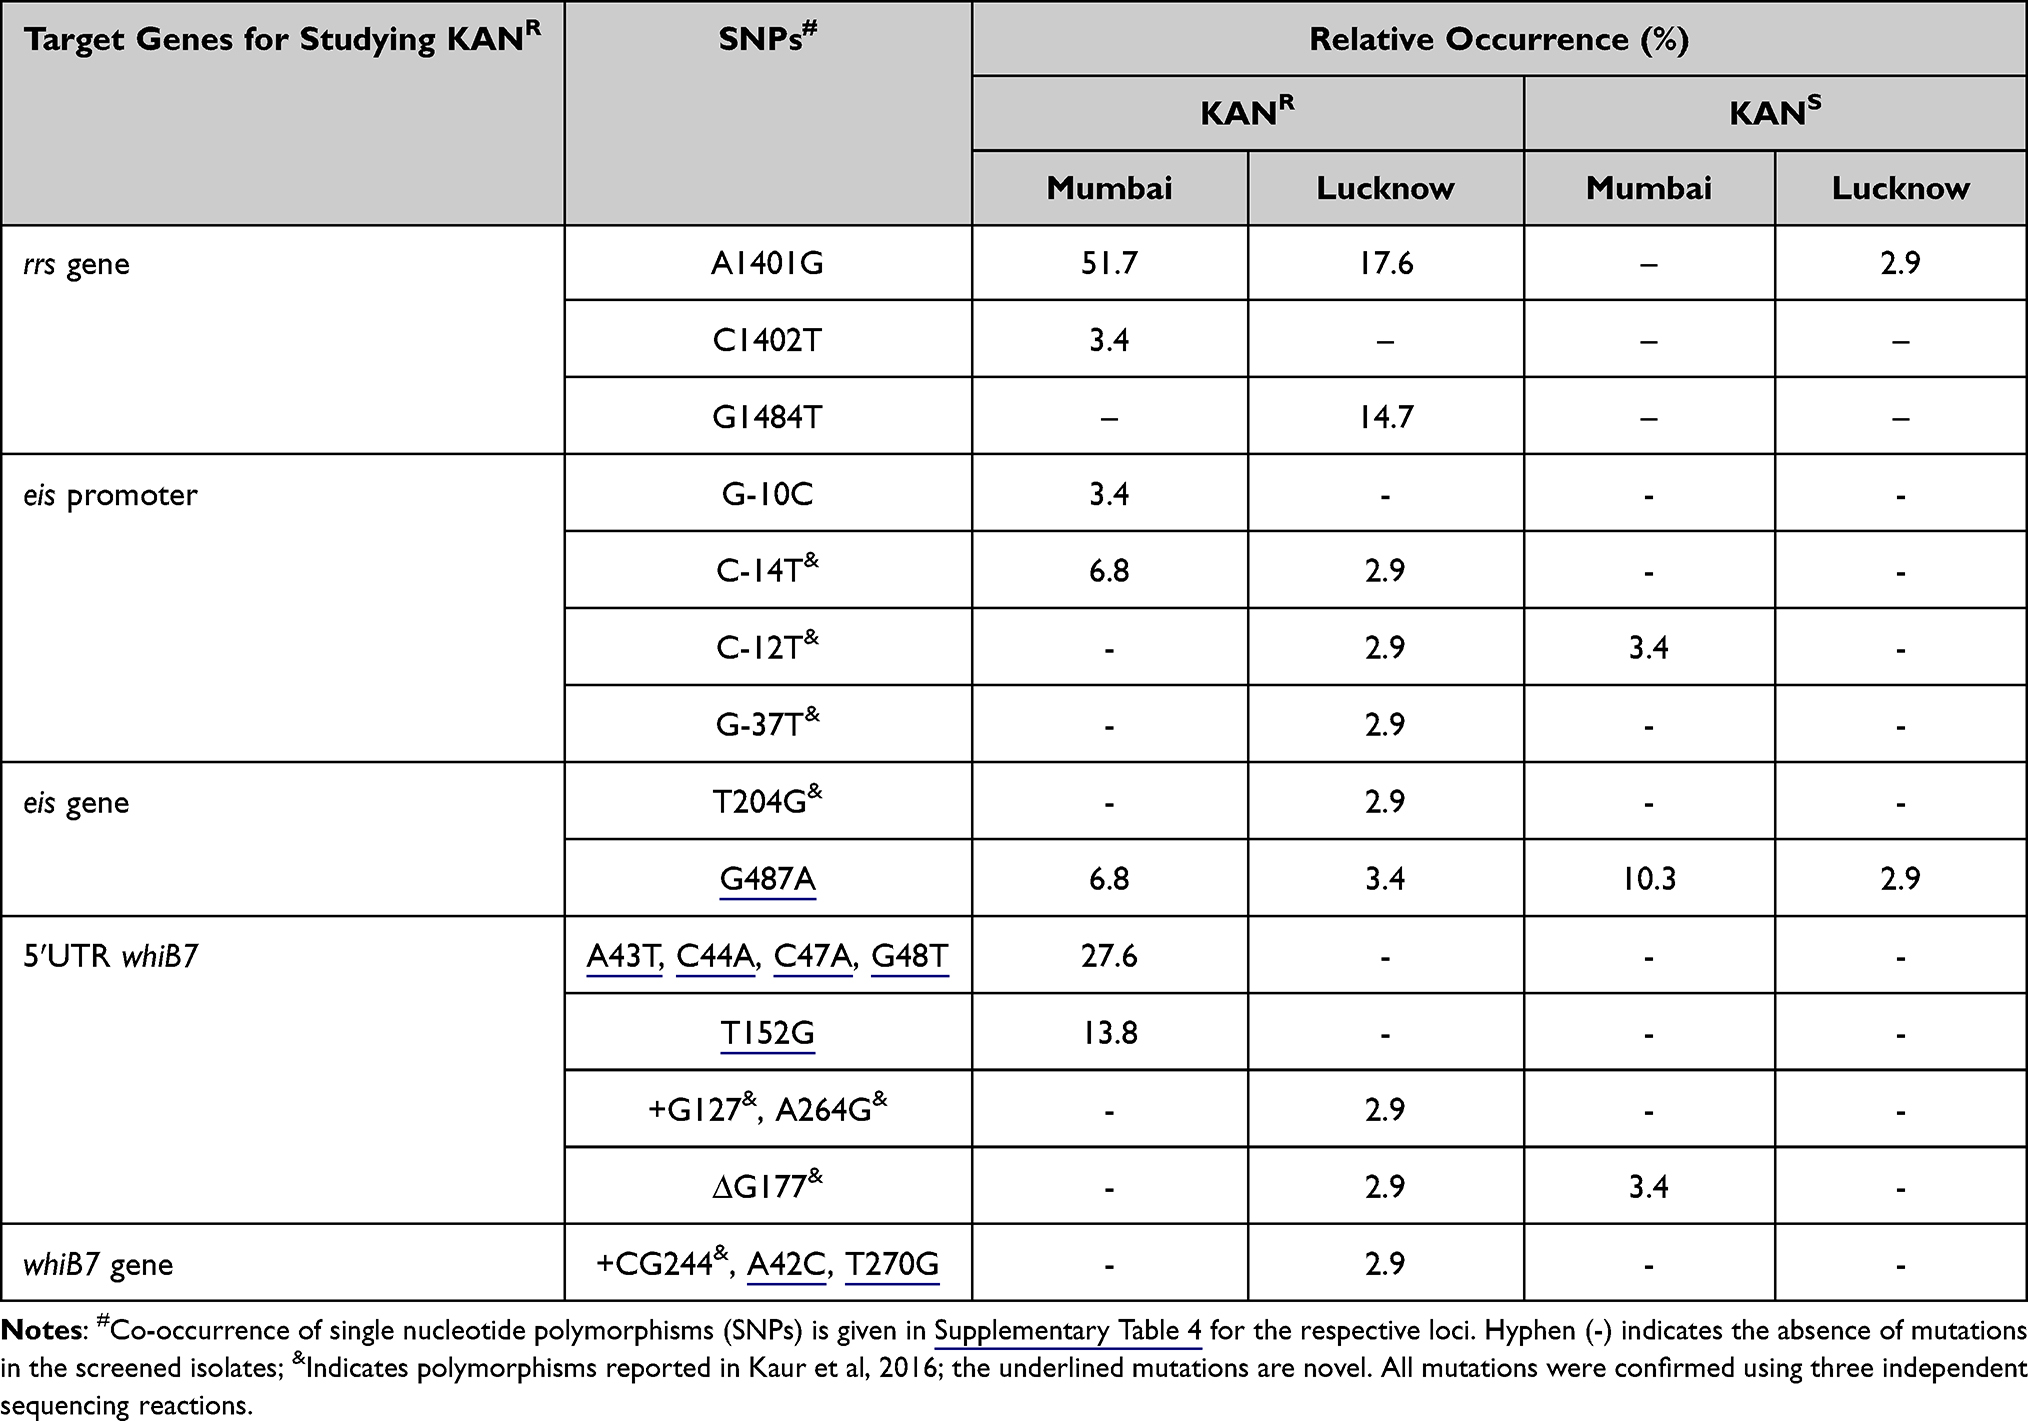 |
Table 2 Observed SNP Distribution in Mumbai and Lucknow for rrs, eis, and whiB7 Target Loci |
In addition to the SNPs reported earlier by our group,37 three out of five new KANR isolates from Lucknow exhibited A1401G. In all, twelve (35.3%) of the 34 KANR isolates from Lucknow exhibited A1401G in six isolates (17.6%) and G1484T in five isolates (14.7%) (Table 2). Only one KANS isolate (2.9%) displayed A1401G mutation (Supplementary Table 4).
eis and Its Promoter
Three KANR isolates (10.3%) from Mumbai harbored mutations in either the eis promoter or the eis gene. Two (6.8%) and one isolates (3.4%) carried the reported C-14T and the G-10C promoter mutations, respectively (Table 2). The Open Reading Frame (ORF) of eis exhibited G487A transition (Val163Ile) in two isolates, which was also observed in three of the KANS isolates. One KANS isolate (3.4%) harbored a C-12T mutation (Supplementary Table 4).
In addition to our previously reported eis promoter and ORF mutations,37 the G487A mutation was displayed in one KANR and one KANS isolate of Lucknow (Supplementary Table 4).
whiB7 and 5’ UTR
Nine KANR isolates (31%) from Mumbai exhibited five unique mutations in the whiB7 5ʹUTR, seen as heterogeneous peaks in chromatograms. Eight isolates (27.6%) co-harbored the novel A43T, C44A, C47A and G48T; and four (13.8%) isolates exhibited novel T152G mutation in the 5ʹUTR. One KANS isolate harbored the ∆G177 5ʹUTR deletion. Two other novel mutations were randomly distributed in KANR and KANS isolates of Mumbai. These were G59A in 5ʹUTR in 16 KANR and 7 KANS isolates; and C253T in whiB7 gene (possibly leading to Arg85Cys in the WhiB7 protein) in 4 KANR and 21 KANS isolates (Supplementary Table 4).
Apart from mutations reported by our group in Kaur et al,37 one KANR strain showed novel A42C (Arg14Ser) and T270G (Ala90Ala) in Lucknow strains. The G59A 5ʹUTR and C253T ORF novel mutations were seen in three KANR isolates. One strain presented coexistence of these SNPs with A42C (Arg14Ser). All polymorphisms seen in the 34 KANR (14.7%) isolates are listed in Table 2 and Supplementary Table 4. One KANS isolate displayed C253T gene mutation (Supplementary Table 4).
CAP Resistance
tlyA
From a total of 58 isolates of Mumbai, 23 were CAPR while 35 were CAPS. None of the isolates displayed any polymorphisms specific to CAP resistance. The A33G (Leu11Leu) transition reported earlier was seen in 15 CAPR and all the 35 CAPS isolates, indicating no role in determining CAP resistance.46 Two CAPS isolates (5.7%) also co-harbored novel mutation G165A (Val55Val) transition (Table 3 and Supplementary Table 5). In addition, 15 CAPR isolates harboring rrs 1400 region hotspot polymorphisms A1401G and C1402T exhibited cross resistance to KAN (Supplementary Table 5).
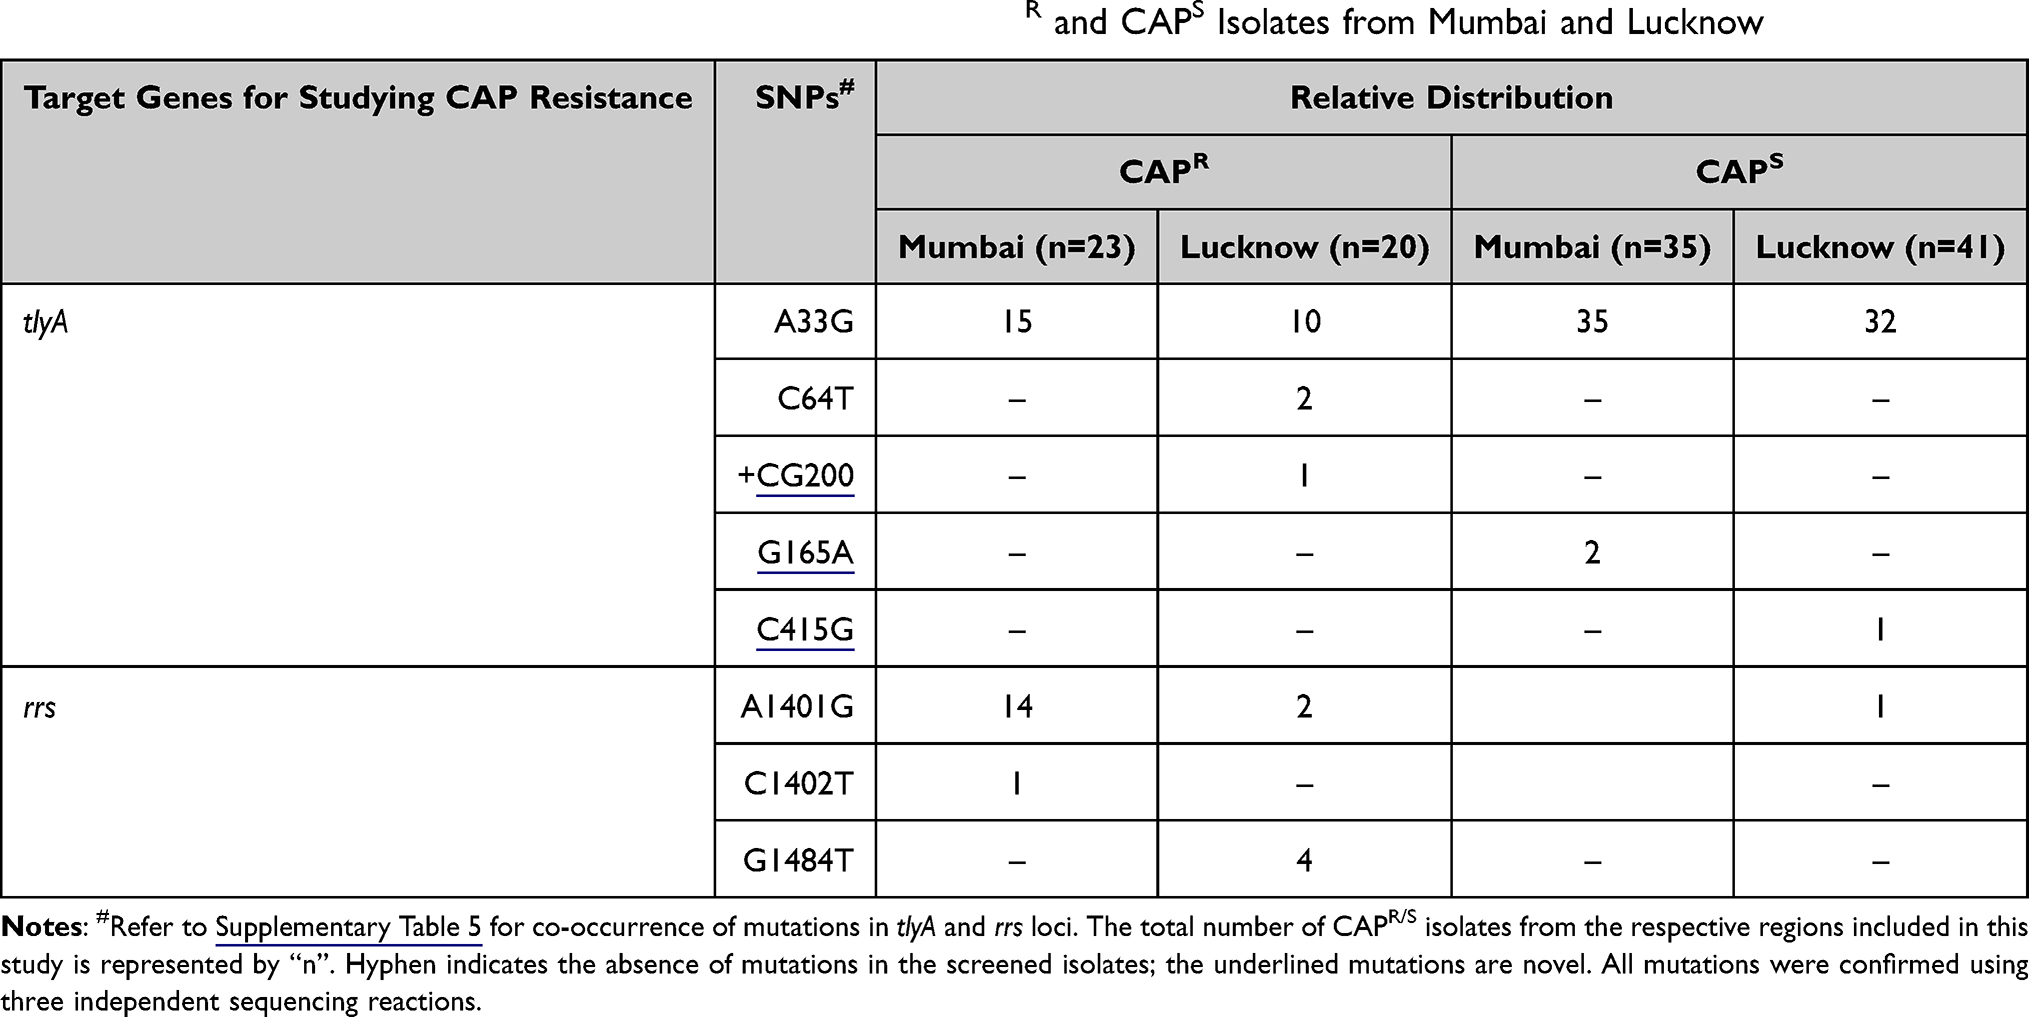 |
Table 3 Relative Distribution of tlyA and rrs Mutations in the CAPR and CAPS Isolates from Mumbai and Lucknow |
Amongst the 68 isolates of Lucknow, 20 were CAPR, 41 were CAPS, while the DST profile for 7 of the isolates could not be determined (CAPND). Two CAPR isolates harbored previously reported C64T transition leading to the Glu22Stop non-sense mutation.15 One CAPR isolate co-exhibited C64T along with novel +CG200 insertion mutation (Table 3, Supplementary Table 5). Only one CAPS isolate showed novel C415G (Leu139Val) mutation. The A33G was seen in 10 CAPR, 32 CAPS isolates and all seven CAPND isolates. One CAPND isolate co-displayed novel +G543 mutation along with A33G. All the six CAPR isolates harboring rrs 1400 hotspot mutations A1401G and G1484T were also cross resistant to KAN (Supplementary Table 5).
OFX Resistance
gyrA
Out of 58 isolates from Mumbai, 47 were OFX resistant (OFXR) while 11 were OFX sensitive (OFXS). Twenty-seven isolates (57.4%) carried mutations in the 94th codon (Asp94X), where Asp was substituted with Gly (19 isolates; 40.4%), Ala (six isolates; 12.8%), His (one isolate; 2.1%), or Tyr (one isolate; 2.1%). Eleven isolates (23.4%) displayed Ala90Val substitution while one isolate, each (2.1%), exhibited Gly88Cys and Ser91Pro substitutions. Forty-four OFXR strains (93.6%) and 11 OFXS strains (100%) harbored Ser95Thr (Table 4 and Supplementary Table 6).
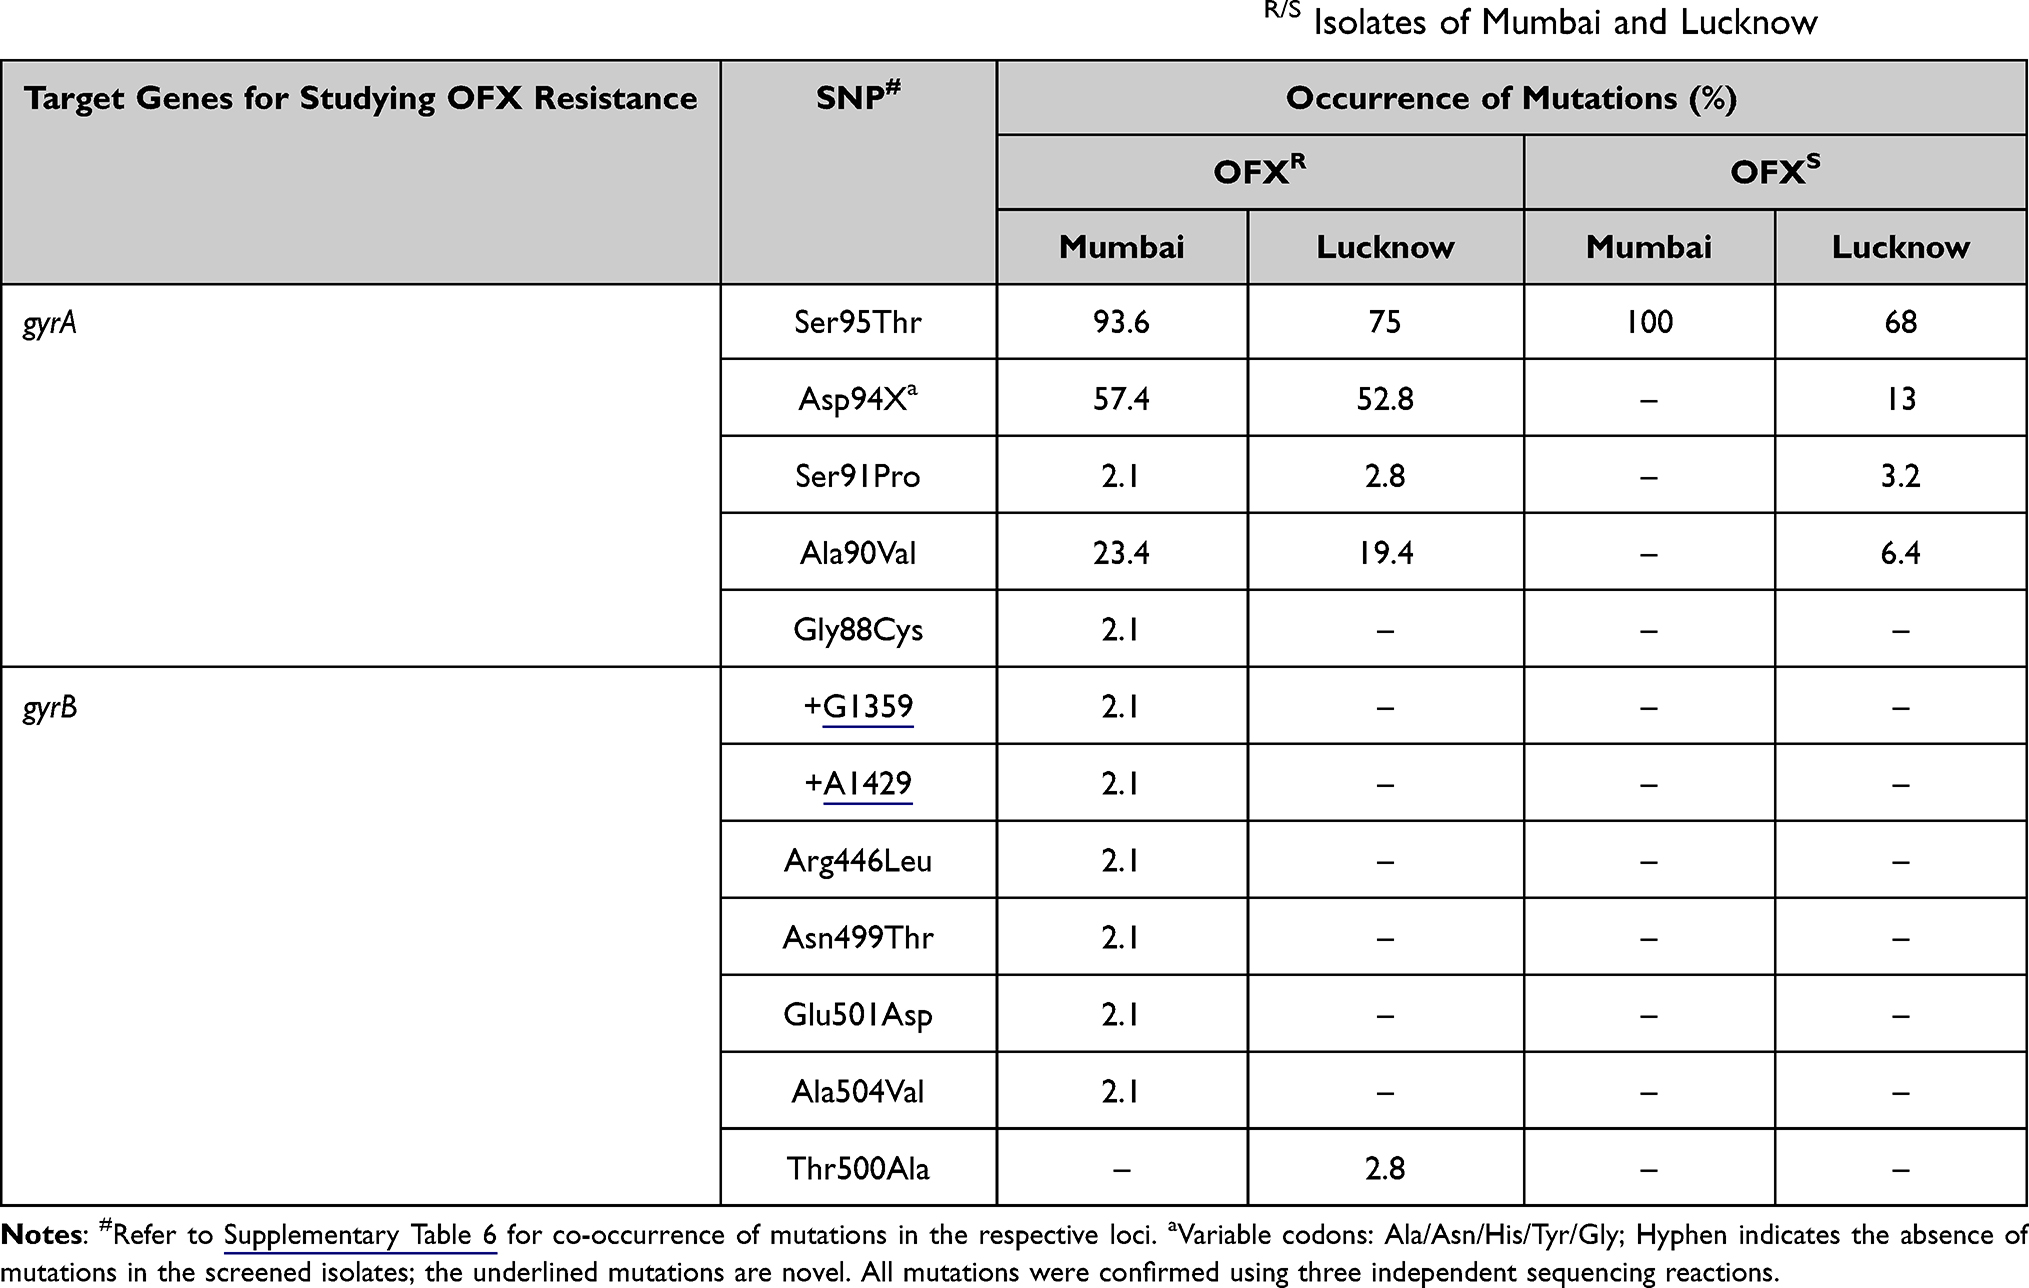 |
Table 4 Distribution of Mutations (%) Observed in gyrA and gyrB QRDRs in OFXR/S Isolates of Mumbai and Lucknow |
In Lucknow, 36 isolates were OFXR, 31 isolates were OFXS, and one isolate was OFXND. Nineteen OFXR isolates (52.8%) carried mutations in the 94th codon (Asp94X), where Asp was substituted with Asp94Gly (12 isolates; 33.3%), Asp94Tyr (one isolate; 2.8%), Asp94Asn (four isolates; 11.1%) or Asp94His (two isolates; 5.5%). The mutations Ser91Pro and Ala90Val were observed in one (2.8%) and seven (19.4%) OFXR isolates, respectively. Besides, two OFXR isolates (5.8%) co-exhibited Ala90Val and Asp94Gly (Table 4). Amongst 31 OFXS isolates of Lucknow, Asp94X was found in four isolates (13%) and Ala90Val in two isolates (6.4%). One OFXS isolate (3.2%) displayed co-occurrence of Ser91Pro and Asp94Asn. The most frequent mutation, Ser95Thr, was seen in 27 out of 36 OFXR strains (75%) and 21 out of 31 OFXS (67.7%), (Table 4 and Supplementary Table 6). The Ser95Thr mutation, which fails to discriminate between resistant and sensitive samples, was widely distributed in isolates from both the regions and, therefore, excluded from the frequency calculations.
gyrB
Six OFXR isolates of Mumbai collectively displayed two novel mutations, i.e., +G1359 (one isolate; 2.1%) and +A1429 (one isolate; 2.1%); along with four known mutations, namely, Ala504Val (one isolate; 2.1%), Glu501Asp (one isolate; 2.1%), Arg446Leu (one isolate; 2.1%) and Asn499Thr (one isolate; 2.1%) in the gyrB QRDR (Table 4). The gyrB QRDR harbored no mutations in all the 11 OFXS strains (Table 4 and Supplementary Table 6).
In Lucknow, only one OFXR isolate (2.8%) exhibited Thr500Ala substitution (A1498G), as shown in Table 4. All the 31 OFXS strains harbored no mutations in gyrB QRDR (Table 4 and Supplementary Table 6).
All the six OFXR strains of Mumbai carrying gyrB polymorphisms also co-displayed either Ala90Val or Asp94X or Ser91Pro gyrA mutations. Similarly, the OFXR strain from Lucknow bearing Thr500Ala gyrB polymorphism co-harbored Ala90Val in gyrA QRDR (Supplementary Table 6).
Spoligotyping Analysis of Clinical Isolates
The international genotyping SITVIT2 database was used for analyzing the spoligotyping binary patterns. All the spoligotypic binary codes of each isolate along with their SIT numbers are listed in Supplementary Tables 7 and 8. Thirty-four and 54 different spoligotypic patterns were detected for Mumbai and Lucknow, respectively. In Mumbai, the East African Indian (EAI5) and Beijing spoligotypes were relatively more prevalent whereas the EAI3-IND, CAS, Manu, and Euro American (“T” and “X3”) clades were sparsely distributed (Figure 2A). In Mumbai, the EAI5 clade comprised of SIT236 (13 isolates), SIT380 (two isolates), SIT1900 and SIT126 (one isolate each). One orphan/new SIT belonging to the EAI5 clade was unavailable in SITVIT2. One isolate each displayed SIT11 (EAI3-IND) and SIT26 (CAS1-Delhi). A new SIT representing Manu1 was detected in one isolate. Three and two isolates represented the Manu2 (SIT54) and Manu ancestor (SIT523) clades, respectively. The East Asian Beijing lineage was represented by SIT1 in seven isolates and SIT1941 in one isolate. Amongst the isolates belonging to Euro American lineage, SIT1077 (the ill-defined T clade), SIT200 (X3 clade) and a new unknown SIT1196 were found in one isolate each. Twenty-one isolates of Mumbai for which the spoligotype pattern has not been defined in the SITVIT2 database were termed as “Orphan or New”.
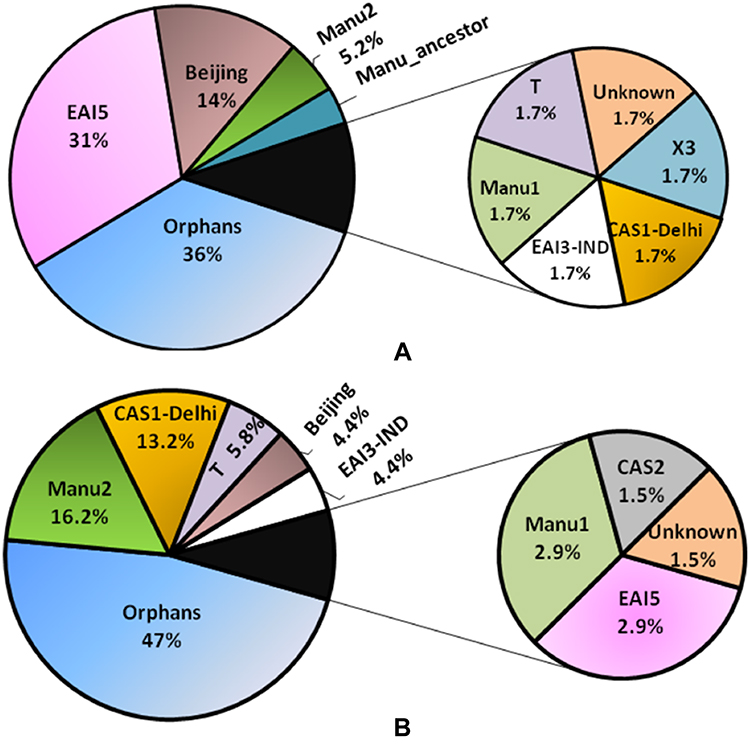 |
Figure 2 Percentage of different lineages for the isolates of Mumbai (A) and Lucknow (B) upon spoligotyping analyses using SITVIT2. CAS-Central Asian clade; EAI-East African Indian clade; T- ill-defined T clade; Beijing- East Asian Beijing clade; Orphans- unique patterns within any of the major clades listed in SITVIT2. |
In Lucknow, the presence of CAS1-Delhi, Manu2, and T1 spoligotypes was more pronounced (Figure 2B). The EAI5 was observed only in two isolates, with SIT3370 and SIT380. The spoligotype pattern of two and one isolates corresponded to SIT652 and SIT11 of EAI3-IND clade. There were nine isolates of Lucknow exhibiting the CAS1-Delhi clade: SIT26 in four isolates; and SIT2696, SIT1091, SIT357, SIT1942, SIT1401 in one isolate each. The CAS2 lineage corresponding to SIT288 in SITVIT2 was displayed by one isolate. The Manu2 clade was seen in 11 isolates: SIT54 in six isolates; SIT226, SIT1484, SIT1634, SIT1247 in one isolate each; and an orphan SIT in a single isolate. The East Asian Beijing lineage (SIT1) was observed in three isolates. The T1 clade of the Euro American lineage was observed in one and three isolates represented by SIT154 and SIT53, respectively. One T1 clade member also showed an orphan SIT. The remaining 32 isolates exhibited the orphan lineages which are undefined in SITVIT2.
Distribution and Clustering of Spoligotypes
The possible phylogenetic relationships between different isolates were deduced by clustering analysis using spolTools which generated spoligoforest trees with hierarchical layout for the two geographical locations. From the 34 spoligotype signatures found in 58 isolates of Mumbai, 30 isolates accounted for six clusters (C1, C2, C12, C14, C18 and C23) and 28 singletons displayed unshared unique spoligotypes (Figure 3A). In case of 68 isolates of Lucknow, 54 different spoligotypes corresponded to 48 singletons having only one isolate representative of a particular pattern, whereas six clusters (C1, C3, C10, C15, C24 and C45) were obtained from 20 isolates (Figure 3B).
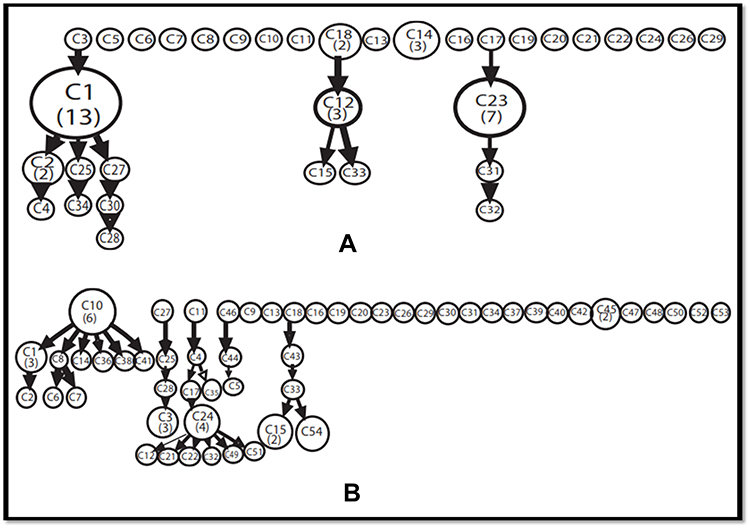 |
Figure 3 Cluster Analysis of different spoligotypic patterns obtained using spolTools. A hierarchical pattern of spoligoforest representation is provided here. (A) Mumbai; (B) Lucknow. The size of each node is represented by the number of isolates belonging to the cluster. |
Association of Spoligotypes with Unique Drug Resistance
Further, to understand the possible correlation of spoligotypic prevalence with isolates harboring the drug resistant mutations, a region-based evaluation was carried out. For each drug category, the percent relative lineage distribution among mutation-bearing drug resistant strains was calculated for the corresponding target loci. The distinct differences between Mumbai and Lucknow strains were observed. In Mumbai strains, although EAI5 lineage was particularly associated with OFX, KAN and CAP resistance, Beijing lineage was observed only with strains resistant to OFX; and Manus were distributed amongst all the three drugs resistant strains harboring mutations (Table 5). The spoligotypes T1, EAI3-IND and CAS1-Delhi were associated only with OFX resistance. However, only the association of EAI5, Manu and Beijing lineages with the mutations corresponding to OFX resistance; and KAN resistance with EAI5 and Manu were found to be statistically significant with p-value of 0.02 and 0.008, respectively.
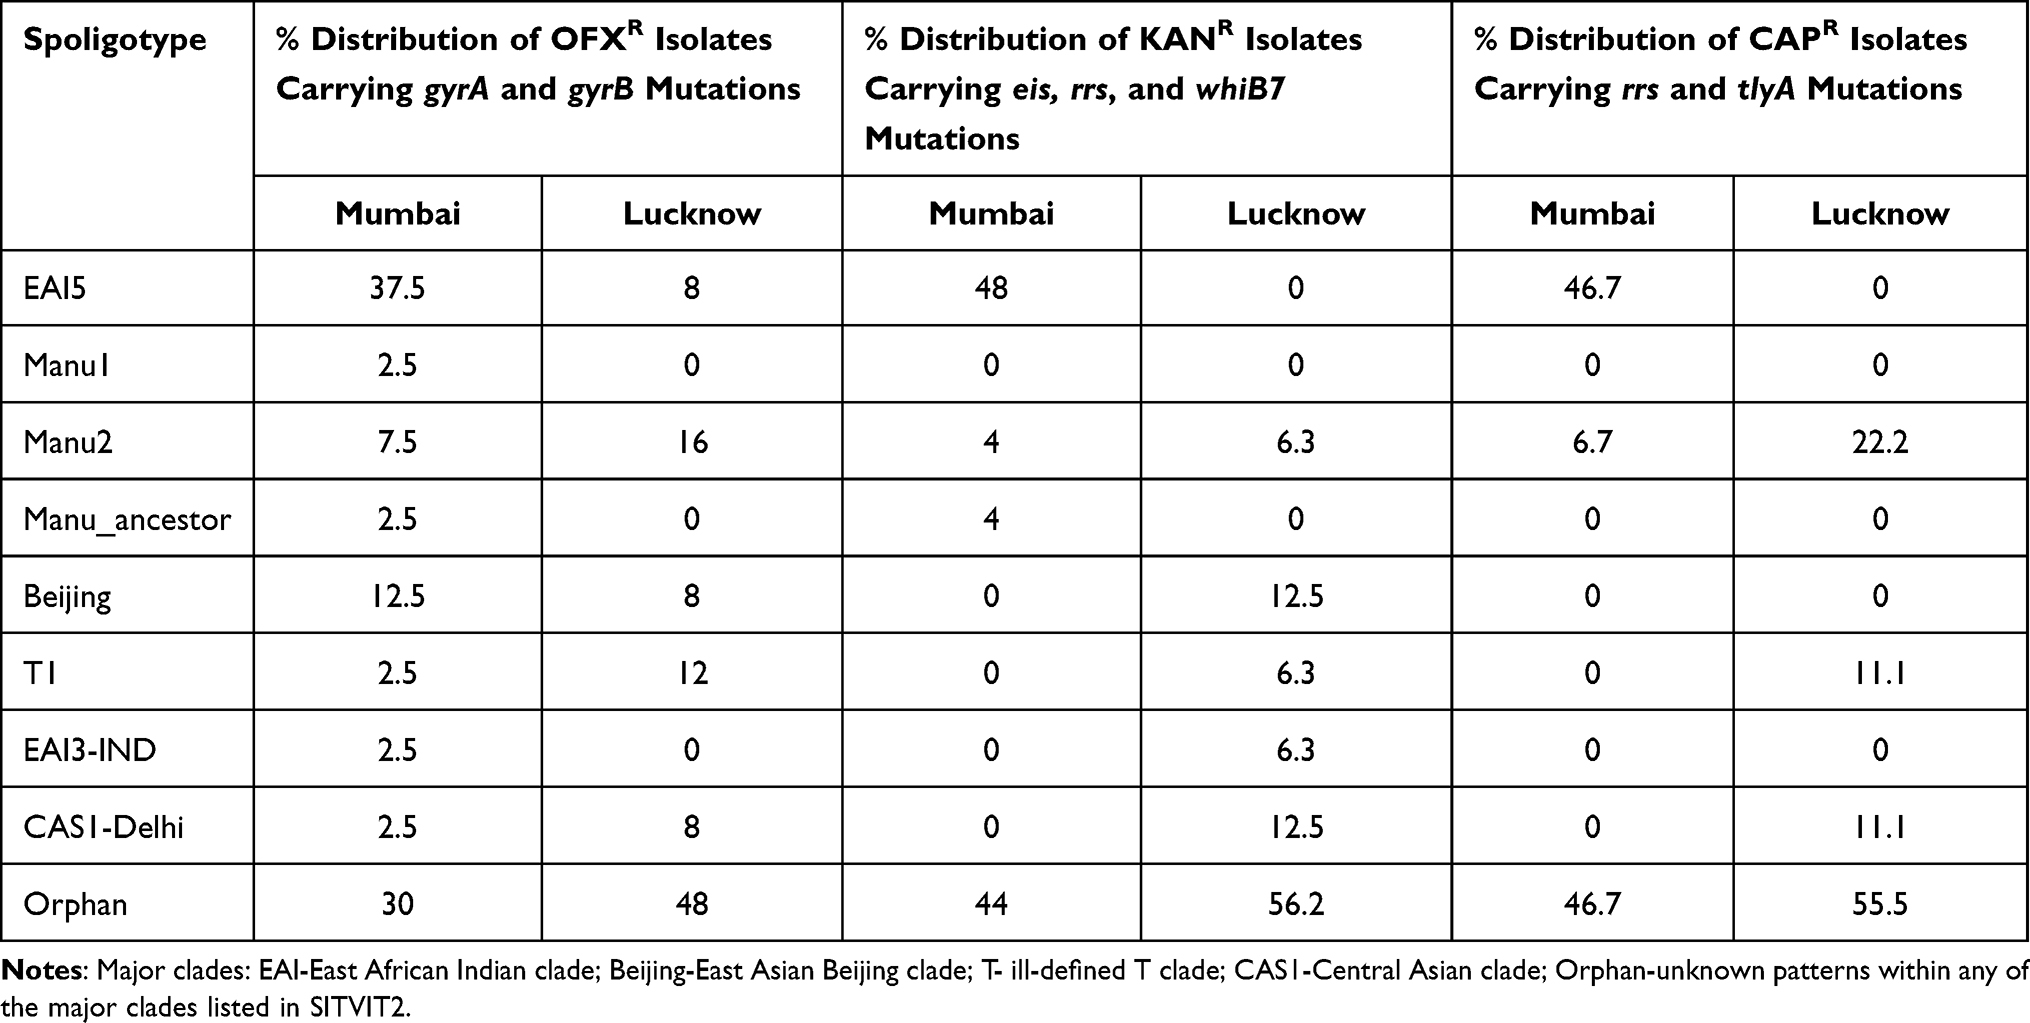 |
Table 5 Percent Distribution of Major Lineages Observed Among the Respective Drug Resistance Groups in Mumbai and Lucknow |
For Lucknow isolates, the mutations were found to be scattered majorly amongst Manu2 and T1 followed by EAI5, Beijing and CAS1-Delhi for OFX resistance; Beijing and CAS1-Delhi followed by Manu2, T1 and EAI3-IND for KAN resistance; and Manu2 followed by T1 and CAS1-Delhi for CAP resistance (Table 5). The statistical analysis could not be performed on Lucknow strains due to the high scattering of different strains of lineages amongst all the three drug resistant strains (Supplementary Table 3).
Discussion
Different geographical areas are expected to have diversity in the genetic nature of Mtb strains. Although few reports on the comparative studies on drug resistance from some highly endemic resource-limited countries are available, the SLI resistant isolates of Mtb from Western and Northern India have never been compared.47,48 This study not only compares the prevalence of mutations in SLI resistant target loci, but also elucidates the lineage specific details of the Mtb clinical isolates from two geographically diverse states of India.
The new antimycobacterial agents such as bedaquiline, delamanid, pretomanid etc. have been discovered recently but SLI aminoglycosides along with fluoroquinolones constitute the most used second-line drugs for the treatment of MDR-TB in India.49 Therefore, the drug susceptibility profiles for these new drugs were not determined routinely in the strain collection centers during the stated period. Thus, this study is limited to the preexisting treatment regimen of second line injectables and fluoroquinolones.
A few studies have reported the role of rrs loci mutations in conferring KAN, AMK, and CAP mono-resistance or cross-resistance.24,50–54 Our study exhibited a higher prevalence of rrs mutations in isolates of Mumbai than those in Lucknow (55% vs. 32%). The most reliable SNP reported globally is A1401G for tracing KAN or AMK resistance.52,55,56 In our analysis of the rrs hotspot, A1401G occurred at a significantly higher frequency (~52%) for the Mumbai isolates than in Lucknow region (~18%). The prevalence of rrs mutations analyzed in our studies is relatively lower when compared with the global status,19 suggesting the need to screen additional SLD-resistance-associated loci for the Indian clinical isolates. A few studies have debated on the inclusion of the G1484T polymorphism in determining CAP resistance in absence of tlyA mutations.9,53 In our investigation, the G1484T mutation was not observed in any of the CAPR isolates of Mumbai compared to a 20% distribution in the CAPR strains of Lucknow, suggesting its skewed prevalence in India.
The role of eis promoter mutations in context to KAN resistance has already been elucidated.9,11,46,54,57 However, these may hold little relevance if a mutation in the eis ORF renders the protein non-functional. Studies on the identification of eis ORF polymorphisms have been minimal.24,37 No other gene alteration besides the reported mutations, T204G and G487A, were identified.37,58 The T204G mutation reported earlier by us in Lucknow strains was found to be missing in isolates of Mumbai.37 Another mutation G487A observed in the KANR and KANS isolates of the two regions has already been reported in KANS isolates of China, marking a low confidence in this mutation for justifying KAN resistance.58 In case of eis promoter mutations, the relative frequencies among the isolates of Mumbai and Lucknow were comparable (~10% in Mumbai vs. ~9% in Lucknow). In accordance with previous reports, C-14T, G-10C, C-12T, and G-37T promoter mutations were found in the KANR isolates of both regions under study.10,11 However, the C-12T mutation in the KANS isolate supports its reported insensitivity in determining high level KAN resistance.19,40 Considering the occurrence of mutations in eis promoter, the screening of specific polymorphisms in this locus may attribute low or moderate KAN resistance in Indian clinical isolates.
The over-expression of Eis protein in the absence of mutations in eis promoter suggests an alternate mechanism for its transcriptional regulation.59 Apart from our previous study from Lucknow,37 not much has been reported regarding the prevalence of mutations in the whiB7 5ʹUTR and ORF in Indian isolates. Five novel mutations in whiB7 5ʹUTR and two novel mutations in whiB7 ORF were specific to the KANR isolates indicating their significant association with KAN resistance. The G59A and ΔG177 (5ʹUTR) and C253T (whiB7 ORF) mutations were equally pronounced in the KANR and KANS isolates, therefore, these mutations must not be considered for KAN resistance.
Association of CAP resistance with mutations in tlyA 2’-O-methyltransferase and rrs has been discussed in the past.15,16,60,61 The novel mutations +CG200, C415G, and +G543 were more pronounced only in isolates of Lucknow. The synonymous novel mutation in the tlyA ORF, G165A, seen in two of the CAPS isolates of Mumbai was absent in all the isolates of Lucknow and might not be useful in defining CAP resistance. Gln22Stop, found in CAPR isolates of Lucknow, has been reported as a spontaneous polymorphism linked to CAP resistance.15 Compared to tlyA, the rrs mutations (A1401G, C1402T, and G1484T) marked a greater confidence in defining CAP resistance. The tlyA and rrs mutations were observed to be mutually exclusive in the CAPR isolates of Mumbai and Lucknow.
The mutations in the gyrAB QRDR culminate into FQ resistance, hampering its usage in combating MDR-TB.62 All the OFX resistance-associated gyrA mutations observed in our study have been reported previously.10,63,64 On the other hand, two novel gyrB QRDR mutations, i.e., +G1359 and +A1429 apparently cause the premature stop codon generation at residues 477 and 453, respectively. Favorable survival of mycobacteria despite gyrB distortion/depletion has already been documented and attributed to the activation of the RecA/LexA mediated SOS response, further enhancing the drug tolerance and induction of persister cells.65 None of the OFXS isolates from the two states carried any polymorphism in gyrB QRDR, indicating its specificity towards FQ resistance. Besides, co-existence of gyrB with gyrA mutations indicates that the inclusion of novel gyrB mutations might be crucial in reframing the fluoroquinolone resistance in SNP based assays. This study could not comment on the association of gyrAB mutations with respect to newer drugs like moxifloxacin, gatifloxacin, and levofloxacin owing to the lack of availability of the respective DST profiles at the time of analysis. However, reports suggest that the mutations in codons 90 and 94 of gyrA are also responsible for rendering Mtb resistant to the newer FQs.66,67
Besides noteworthy differences observed in our SNP analysis, the spoligotyping evaluation also suggested region dependent differential lineage patterns. While a notably higher prevalence of EAI5 (31%) and East Asian Beijing (14%) lineage was recorded in isolates of Mumbai, the Manu2 (16%), Central Asian (CAS1-Delhi, 13%) and T (6%) spoligogroups were higher in Lucknow. Numerous studies have reported the predominance of CAS lineages in North Indian regions.27,32,68–71 In contrast to the reported lower frequencies of Manu/SIT54 in North India,68,70 a higher percentage of Manu2 lineage (~55%) is seen in Lucknow isolates. In our study, the predominance of EAI5 family (31%) shows a divergence from the mostly reported Manu1, CAS, and Beijing lineages from Western India.35,72,73 The significant proportion of Orphan spoligotypes in the current study also points towards large number of unidentified spoligotypes which can only be confirmed by larger sample size and regular cluster investigation to monitor the shifting course of spoligotypes in India.
A recent study points out to the mixed or polyclonal infections in India that may occur due to infection by more than one genotypes during treatment, making drug resistance even a bigger nuisance.74 While some reports discuss Manu ancestral lineage as an artefact due to co-infection by strains of Lineage 2 and 4, we are not in a position to comment, as this study did not examine any co-infection or polyclonal infections.75,76
Conclusion
On a comprehensive note, although the present study was limited by a small sample size and unknown CAP susceptibility for a few isolates, our findings reflect pronounced lineage and mutational diversity among the two distant geographical locations within India. The novel mutations observed in our study contribute to the existing pool of information on genetic polymorphisms in the drug resistant strains from India. For the isolates lacking mutations in target loci, other determinants with unfamiliar resistance mechanisms are likely responsible. In addition, our studies showcased a higher prevalence of EAI and Beijing in Mumbai and CAS1-Delhi and Manu in Lucknow. Finally, a higher correlation of specific lineages with resistance patterns is necessary to provide a deeper insight into the chromosomally governed genotypic blueprints of resistance.
Ethical Approval
Waiver of consent was obtained from Ethics Committee of KGMU, Lucknow, Uttar Pradesh and Institutional Review Board of P. D. Hinduja National Hospital and Research Centre, Mumbai, Maharashtra, India.
Acknowledgments
Mapmygenome India Ltd. India is acknowledged for their spoligotyping services for 21 isolates. Dr. Richa Sharma, USOL, Panjab University, Chandigarh, India, is acknowledged for the help in analyzing statistical significance of the studies. Ms. Simerpreet Kaur and Dr. Pooja Singh are acknowledged for their assistance during Lucknow isolate analysis.
Author Contributions
All authors made a significant contribution to the work reported, whether that is in the conception, study design, execution, acquisition of data, analysis and interpretation, or in all these areas; took part in drafting, revising or critically reviewing the article; gave final approval of the version to be published; have agreed on the journal to which the article has been submitted; and agree to be accountable for all aspects of the work.
Funding
This work was supported by funding from Council of Scientific and Industrial Research, CSIR-OLP109, to CS; FIND to AJ and CR. VR is a recipient of DST-INSPIRE Senior Research Fellowship from Department of Science and Technology (DST), New Delhi. NS receives her Senior Research Fellowship (SRF) from Department of Biotechnology, New Delhi.
Disclosure
Dr Camilla Rodrigues reports grants from FIND, Geneva, grants from CRyPTIC, Oxford UK, grants from Johns Hopkins, USA, during the conduct of the study. The authors report no other conflicts of interest in this work.
References
1. World Health Organization. WHO Global Tuberculosis Report 2018. Geneva: World Health Organization; 2016.
2. Porwal C, Kaushik A, Makkar N, et al. Incidence and risk factors for extensively drug-resistant tuberculosis in Delhi region. PLoS One. 2013;8(2):e55299. doi:10.1371/journal.pone.0055299
3. Banerjee R, Allen J, Westenhouse J, et al. Extensively drug-resistant tuberculosis in California, 1993–2006. Clin Infect Dis. 2008;47(4):450–457. doi:10.1086/590009
4. World Health Organization. WHO Consolidated guidelines on tuberculosis. module 4: treatment - drug-resistant tuberculosis treatment. Online annexes; 2020.
5. Ramakrishna V, Singh PK, Prakash S, Jain A. Second line injectable drug resistance and associated genetic mutations in newly diagnosed cases of multidrug-resistant tuberculosis. Microb Drug Resist. 2020;26(8):1–5. doi:10.1089/mdr.2019.0215
6. Banerjee A, Dubnau E, Quemard A, et al. inhA, a gene encoding a target for isoniazid and ethionamide in Mycobacterium tuberculosis. Science (80-). 1994;263:227–230. doi:10.1126/science.8284673
7. Da Silva PEA, Palomino JC. Molecular basis and mechanisms of drug resistance in Mycobacterium tuberculosis: classical and new drugs. J Antimicrob Chemother. 2011;66:1417–1430. doi:10.1093/jac/dkr173
8. Yao C, Zhu T, Li Y, et al. Detection of rpoB, katG and inhA gene mutations in Mycobacterium tuberculosis clinical isolates from Chongqing as determined by microarray. Clin Microbiol Infect. 2010;16(11):1639–1643. doi:10.1111/j.1469-0691.2010.03267.x
9. Georghiou SB, Magana M, Garfein RS, Catanzaro DG, Catanzaro A, Rodwell TC. Evaluation of genetic mutations associated with Mycobacterium tuberculosis resistance to amikacin, kanamycin and capreomycin: a systematic review. PLoS One. 2012;7(3):e33275. doi:10.1371/journal.pone.0033275
10. Rodwell TC, Valafar F, Douglas J, et al. Predicting extensively drug-resistant Mycobacterium tuberculosis phenotypes with genetic mutations. J Clin Microbiol. 2014;52(3):781–789. doi:10.1128/JCM.02701-13
11. Zaunbrecher MA, Sikes RD, Metchock B, Shinnick TM, Posey JE. Overexpression of the chromosomally encoded aminoglycoside acetyltransferase eis confers kanamycin resistance in Mycobacterium tuberculosis. Proc Natl Acad Sci USA. 2009;106(47):20004–20009. doi:10.1073/pnas.0907925106
12. Islam MM, Tan Y, Hameed HMA, et al. Prevalence and molecular characterization of amikacin resistance among Mycobacterium tuberculosis clinical isolates from southern China. J Glob Antimicrob Resist. 2020;22:290–295. doi:10.1016/j.jgar.2020.02.019
13. Reeves AZ, Campbell PJ, Sultana R, et al. Aminoglycoside cross-resistance in Mycobacterium tuberculosis due to mutations in the 5’ untranslated region of whiB7. Antimicrob Agents Chemother. 2013;57(4):1857–1865. doi:10.1128/AAC.02191-12
14. Morris RP, Nguyen L, Gatfield J, et al. Ancestral antibiotic resistance in Mycobacterium tuberculosis. Proc Natl Acad Sci USA. 2005;102(34):12200–12205. doi:10.1073/pnas.0505446102
15. Maus CE, Plikaytis BB, Thomas M, Shinnick TM. Mutation of tlyA confers capreomycin resistance in mycobacterium tuberculosis mutation of tlyA confers capreomycin resistance in Mycobacterium tuberculosis. Antimicrob Agents Chemother. 2005;49(404):571–577. doi:10.1128/AAC.49.2.571
16. Johansen SK, Maus CE, Plikaytis BB, Douthwaite S. Capreomycin binds across the ribosomal subunit interface using tlyA-encoded 2’-O-methylations in 16S and 23S rRNAs. Mol Cell. 2006;23(2):173–182. doi:10.1016/j.molcel.2006.05.044
17. Sirgel FA, Warren RM, Streicher EM, Victor TC. gyrA mutations and phenotypic susceptibility levels to ofloxacin and moxifloxacin in clinical isolates of Mycobacterium tuberculosis. J Antimicrob Chemother. 2012;67(February):1088–1093. doi:10.1093/jac/dks033
18. Avalos E, Catanzaro D, Catanzaro A, et al. Frequency and geographic distribution of gyrA and gyrB mutations associated with fluoroquinolone resistance in clinical Mycobacterium tuberculosis isolates: a systematic review. PLoS One. 2015;10:1–24. doi:10.1371/journal.pone.0120470
19. Bablishvili N, Tukvadze N, Shashkina E, et al. Impact of gyrB and eis mutations in improving detection of second-line- drug resistance among Mycobacterium tuberculosis isolates from Georgia. Antimicrob Agents Chemother. 2017;61(September):1–9. doi:10.1128/AAC.01921-16
20. Ballif M, Harino P, Ley S, et al. Drug resistance-conferring mutations in Mycobacterium tuberculosis from Madang, Papua New Guinea. BMC Microbiol. 2012;12(191). doi:10.1186/1471-2180-12-191
21. Spies FS, Ribeiro AW, Ramos DF, et al. Streptomycin resistance and lineage-specific polymorphisms in Mycobacterium tuberculosis gidB gene. J Clin Microbiol. 2011;49(July 2011):2625–2630. doi:10.1128/JCM.00168-11
22. Baker L, Brown T, Maiden MC, Drobniewski F. Silent nucleotide polymorphisms and a phylogeny for Mycobacterium tuberculosis. Emerg Infect Dis. 2004;10(September):1568–1577. doi:10.3201/eid1009.040046
23. Casali N, Nikolayevskyy V, Balabanova Y, et al. Microevolution of extensively drug-resistant tuberculosis in Russia. Genome Res. 2012;22:735–745. doi:10.1101/gr.128678.111.22
24. Campbell PJ, Morlock GP, Sikes RD, et al. Molecular detection of mutations associated with first- and second-line drug resistance compared with conventional drug susceptibility testing of Mycobacterium tuberculosis. Antimicrob Agents Chemother. 2011;55(5):2032–2041. doi:10.1128/AAC.01550-10
25. Perizzolo PF, Dalla Costa ER, Ribeiro AW, et al. Characteristics of multidrug-resistant Mycobacterium tuberculosis in southern Brazil. Tuberculosis. 2012;92(1):56–59. doi:10.1016/j.tube.2011.09.008
26. Ford CB, Shah RR, Maeda MK, et al. Mycobacterium tuberculosis mutation rate estimates from different lineages predict substantial differences in the emergence of drug-resistant tuberculosis. Nat Genet. 2013;45(7):784–790. doi:10.1038/ng.2656
27. Gupta A, Kulkarni S, Rastogi N, Anupurba S. A study of Mycobacterium tuberculosis genotypic diversity & drug resistance mutations in Varanasi, north India. Ind J Med Res. 2014;139:892–902.
28. Gupta A, Prakash P, Singh SK, Anupurba S. Rapid genotypic detection of rpoB and katG gene mutations in Mycobacterium tuberculosis clinical isolates from Northern India as determined by MAS-PCR. J Clin Lab Anal. 2013;27(1):31–37. doi:10.1002/jcla.21558
29. Gupta R, Amrathlal RS, Prakash R, Jain S, Tiwari PK. Spoligotyping, phenotypic and genotypic characterization of katG, rpoB gene of M. tuberculosis isolates from Sahariya tribe of Madhya Pradesh India. J Infect Public Heal. 2019;12(3):395–402. doi:10.1016/j.jiph.2018.12.009
30. Vashistha H, Hanif M, Chopra KK, Shrivastava D, Khanna A. Genetic polymorphism of rare mutations in Mycobacterium tuberculosis-infected patients in Delhi. Biomed Biotechnol Res J. 2018;2:74–81. doi:10.4103/bbrj.bbrj
31. Gutierrez MC, Ahmed N, Willery E, et al. Predominance of ancestral lineages of Mycobacterium tuberculosis in India. Emerg Infect Dis. 2006;12:1367–1374. doi:10.3201/eid1209.050017
32. Singh UB, Suresh N, Bhanu NV, et al. Predominant tuberculosis spoligotypes, Delhi, India. Emerg Infect Dis. 2004;10(June):1138–1142. doi:10.3201/eid1006.030575
33. Singh J, Sankar MM, Kumar P, et al. Genetic diversity and drug susceptibility profile of Mycobacterium tuberculosis isolated from different regions of India. J Infect. 2015;71(2):207–219. doi:10.1016/j.jinf.2015.04.028
34. Poonawala H, Kumar N, Peacock SJ. A review of published spoligotype data indicates the diversity of Mycobacterium tuberculosis from India is under-represented in global databases. Infect Genet Evol. 2020;78(May2019):104072. doi:10.1016/j.meegid.2019.104072
35. Ajbani K, Rodrigues C, Shenai S, Mehta A. Mutation detection and accurate diagnosis of extensively drug-resistant tuberculosis: report from a tertiary care center in India. J Clin Microbiol. 2011;49(4):1588–1590. doi:10.1128/JCM.00113-11
36. Desikan P, Panwalkar N, Chaudhuri S, et al. Burden of baseline resistance of Mycobacterium tuberculosis to fluoroquinolones and second-line injectables in central India. Trans R Soc Trop Med Hyg. 2019:1–6. doi:10.1093/trstmh/trz121
37. Kaur S, Rana V, Singh P, et al. Novel mutations conferring resistance to kanamycin in Mycobacterium tuberculosis clinical isolates from Northern India. Tuberculosis. 2016;96(2016):96–101. doi:10.1016/j.tube.2015.10.012
38. Shah NS, Moodley P, Babaria P, et al. Rapid diagnosis of tuberculosis and multidrug resistance by the microscopic-observation drug-susceptibility assay. Am J Respir Crit Care Med. 2011;183(10):1427–1433. doi:10.1164/rccm.201009-1449OC
39. Dixit P, Singh U, Sharma P, Jain A. Evaluation of nitrate reduction assay, resazurin microtiter assay and microscopic observation drug susceptibility assay for first line antitubercular drug susceptibility testing of clinical isolates of M. tuberculosis. J Microbiol Methods. 2012;88(1):122–126. doi:10.1016/j.mimet.2011.11.006
40. Gikalo MB, Nosova EY, Krylova LY, Moroz AM. The role of eis mutations in the development of kanamycin resistance in Mycobacterium tuberculosis isolates from the Moscow region. J Antimicrob Chemother. 2012;67(9):2107–2109. doi:10.1093/jac/dks178
41. Martin A, Palomino JC. Rapid detection of ofloxacin resistance in Mycobacterium tuberculosis by two low-cost colorimetric methods: resazurin and nitrate reductase assays. J Clin Microbiol. 2005;43(4):1612–1616. doi:10.1128/JCM.43.4.1612
42. Aslan G, Tezcan S, Serin MS, Emekdas G. Genotypic analysis of isoniazid and rifampin resistance in drug-resistant clinical Mycobacterium tuberculosis complex isolates in southern Turkey. Jpn J Infect Dis. 2008;61(4):255–260.
43. Kamerbeek J, Schouls L, Kolk A, et al. Simultaneous detection and strain differentiation of Mycobacterium tuberculosis for diagnosis and epidemiology. J Clin Microbiol. 1997;35(4):907–914. doi:10.1016/S0305-4403(02
44. Couvin D, David A, Zozio T, Rastogi N. Macro-geographical specificities of the prevailing tuberculosis epidemic as seen through SITVIT2, an updated version of the Mycobacterium tuberculosis genotyping database. Infect Genet Evol. 2019;72:31–43. doi:10.1016/j.meegid.2018.12.030
45. Tang C, Reyes JF, Luciani F, Francis AR, Tanaka MM. spolTools: online utilities for analyzing spoligotypes of the Mycobacterium tuberculosis complex. Bioinformatics. 2008;24(20):2414–2415. doi:10.1093/bioinformatics/btn434
46. Sowajassatakul A, Prammananan T, Chaiprasert A, Phunpruch S. Molecular characterization of amikacin, kanamycin and capreomycin resistance in M/XDR-TB strains isolated in Thailand. BMC Microbiol. 2014;14(165):1–7. doi:10.1186/1471-2180-14-165
47. Zignol M, Cabibbe AM, Dean AS, et al. Genetic sequencing for surveillance of drug resistance in tuberculosis in highly endemic countries: a multi-country population-based surveillance study. Lancet Infect Dis. 2018;18:675–683. doi:10.1016/S1473-3099(18
48. Coll F, Phelan J, Hill-Cawthorne G, et al. Genome-wide analysis of multi- and extensively drug-resistant Mycobacterium tuberculosis. Nat Genet. 2018;50:307–316. doi:10.1038/s41588-017-0029-0
49. World Health Organization. The selection and use of essential medicines. twentieth report of the WHO expert committee 2015 (including 19th WHO model list of essential medicines and 5th WHO model list of essential medicines for children). World Health Organization; 2012.
50. Alangaden GJ, Kreiswirth BN, Aouad A, et al. Mechanism of resistance to amikacin and kanamycin in Mycobacterium tuberculosis. Antimicrob Agents Chemother. 1998;42(5):1295–1297. doi:10.1128/AAC.42.5.1295
51. Brossier F, Pham A, Bernard C, et al. Molecular investigation of resistance to second line injectable drugs in multidrug-resistant clinical isolates of Mycobacterium tuberculosis in France. Antimicrob Agents Chemother. 2017;61(2):
52. Du Q, Dai G, Long Q, et al. Mycobacterium tuberculosis rrs A1401G mutation correlates with high-level resistance to kanamycin, amikacin, and capreomycin in clinical isolates from mainland China. Diagn Microbiol Infect Dis. 2013;77(2):138–142. doi:10.1016/j.diagmicrobio.2013.06.031
53. Maus CE, Plikaytis BB, Shinnick TM. Molecular analysis of cross-resistance to capreomycin, kanamycin, amikacin, and viomycin in Mycobacterium tuberculosis. Antimicrob Agents Chemother. 2005;49(8):3192–3197. doi:10.1128/AAC.49.8.3192-3197.2005
54. Goyal A, Gadhavi H, Aring B, Mullan S. A study on molecular detection of mutations associated with second line anti-tuberculosis drug resistance. JAMB. 2019;19:1–7. doi:10.9734/jamb/2019/v19i130181
55. Suzuki Y, Katsukawa C, Tamaru A, et al. Detection of kanamycin-resistant Mycobacterium tuberculosis by identifying mutations in the 16S rRNA gene. J Clin Microbiol. 1998;36(5):1220–1225. doi:10.1128/JCM.36.5.1220-1225.1998
56. Ramaswamy S, Musser J. Molecular genetic basis of antimicrobial agent resistance in Mycobacterium tuberculosis: 1998 update. Tuber Lung Dis. 1998;79(1):3–29. doi:10.1054/tuld.1998.0002
57. Chakravorty S, Lee JJS, Cho EJ, et al. Genotypic susceptibility testing of Mycobacterium tuberculosis isolates for amikacin and kanamycin resistance by use of a rapid sloppy molecular beacon-based assay identifies more cases of low-level drug resistance than phenotypic Lowenstein-Jensen testing. J Clin Microbiol. 2015;53:43–51. doi:10.1128/JCM.02059-14
58. Fang H, Jia-yun L, Yue-yun M, Ming-quan S, Xiao-ke H. Relationship between enhanced intracellular survival gene mutation in Mycobacterium tuberculosis and aminoglycoside-resistance. Prog Mod Biomed. 2011;11(7):1213–1215.
59. Sowajassatakul A, Prammananan T, Chaiprasert A, Phunpruch S. Overexpression of eis without a mutation in promoter region of amikacin- and kanamycin-resistant Mycobacterium tuberculosis clinical strain. Ann Clin Microbiol Antimicrob. 2018;17:1–7. doi:10.1186/s12941-018-0285-6
60. Engström A, Perskvist N, Werngren J, Hoffner SE, Juréen P. Comparison of clinical isolates and in vitro selected mutants reveals that tlyA is not a sensitive genetic marker for capreomycin resistance in Mycobacterium tuberculosis. J Antimicrob Chemother. 2011;66(6):1247–1254. doi:10.1093/jac/dkr109
61. Hoshide M, Qian L, Rodrigues C, et al. Geographical differences associated with single-nucleotide polymorphisms (SNPs) in nine gene targets among resistant clinical isolates of Mycobacterium tuberculosis. J Clin Microbiol. 2014;52(5):1322–1329. doi:10.1128/JCM.00857-13
62. Ginsburg AS, Grosset JH, Bishai WR. Fluoroquinolones, tuberculosis, and resistance. Lancet Infect Dis. 2003;3:432–442. doi:10.1016/S1473-3099(03)00671-6
63. Jnawali HN, Hwang SC, Park YK, et al. Characterization of mutations in multi- and extensive drug resistance among strains of Mycobacterium tuberculosis clinical isolates in Republic Of Korea. Diagn Microbiol Infect Dis. 2013;76(2):187–196. doi:10.1016/j.diagmicrobio.2013.02.035
64. Engström A, Morcillo N, Imperiale B, Hoffner SE, Juréen P. Detection of first- and second-line drug resistance in Mycobacterium tuberculosis clinical isolates by pyrosequencing. J Clin Microbiol. 2012;50(6):2026–2033. doi:10.1128/JCM.06664-11
65. Choudhary E, Sharma R, Kumar Y, Agarwal N. Conditional silencing by CRISPRi reveals the role of DNA gyrase in formation of drug-tolerant persister population in Mycobacterium tuberculosis. Front Cell Infect Microbiol. 2019;9:1–13. doi:10.3389/fcimb.2019.00070
66. El Sahly HM, Teeter LD, Jost KC, Dunbar D, Lew J, Graviss EA. Incidence of moxifloxacin resistance in clinical Mycobacterium tuberculosis isolates in Houston, Texas. J Clin Microbiol. 2011;49:2942–2945. doi:10.1128/JCM.00231-11
67. Nosova EY, Bukatina A, Isaeva YD, Makarova MV, Yu K, Moroz AM. Analysis of mutations in the gyrA and gyrB genes and their association with the resistance of mycobacterium tuberculosis to levofloxacin, moxifloxacin and gatifloxacin. J Med Microbiol. 2013;62:108–113. doi:10.1099/jmm.0.046821-0
68. Varma-basil M, Kumar S, Arora J, et al. Comparison of spoligotyping, mycobacterial interspersed repetitive units typing and IS6110-RFLP in a study of genotypic diversity of Mycobacterium tuberculosis in Delhi, North India. Mem Inst Oswaldo Cruz. 2011;106(5):524–535. doi:10.1590/S0074-02762011000500002
69. Stavrum R, Myneedu VP, Arora VK, Ahmed N, Grewal HMS. In-depth molecular characterization of Mycobacterium tuberculosis from New Delhi - Predominance of drug resistant isolates of the “modern” (TbD1-) type. PLoS One. 2009;4:2–8. doi:10.1371/journal.pone.0004540
70. Singh UB, Arora J, Suresh N, et al. Genetic biodiversity of Mycobacterium tuberculosis isolates from patients with pulmonary tuberculosis in India. Infect Genet Evol. 2007;7(2007):441–448. doi:10.1016/j.meegid.2007.01.003
71. Mathuria JP, Srivastava GN, Sharma P, et al. Prevalence of Mycobacterium tuberculosis Beijing genotype and its association with drug resistance in North India. J Infect Public Heal. 2017;10(4):409–414. doi:10.1016/j.jiph.2016.06.007
72. Chatterjee A, D’Souza D, Vira T, et al. Strains of Mycobacterium tuberculosis from Western Maharashtra, India, exhibit a high degree of diversity and strain-specific associations with drug resistance, cavitary disease, and treatment failure. J Clin Microbiol. 2010;48:3593–3599. doi:10.1128/JCM.00430-10
73. Kulkarni S, Sola C, Filliol I, Rastogi N, Kadival G. Spoligotyping of Mycobacterium tuberculosis isolates from patients with pulmonary tuberculosis in Mumbai, India. Res Microbiol. 2005;156:588–596. doi:10.1016/j.resmic.2005.01.005
74. Pandey P, Bhatnagar AK, Mohan A, et al. Mycobacterium tuberculosis polyclonal infections through treatment and recurrence. PLoS One. 2020;15(8):1–15. doi:10.1371/journal.pone.0237345
75. Kargarpour Kamakoli M, Khanipour S, Hadifar S, et al. Challenge in direct Spoligotyping of Mycobacterium tuberculosis: a problematic issue in the region with high prevalence of polyclonal infections. BMC Res Notes. 2018;11(1):1–6. doi:10.1186/s13104-018-3579-z
76. Masoud K, Araj GF, Reslan L, et al. Spoligotyping of Mycobacterium tuberculosis isolates using Luminex®based method in Lebanon. J Infect Dev Count. 2020;14(8):878–885. doi:10.3855/jidc.12072
 © 2022 The Author(s). This work is published and licensed by Dove Medical Press Limited. The
full terms of this license are available at https://www.dovepress.com/terms
and incorporate the Creative Commons Attribution
- Non Commercial (unported, 3.0) License.
By accessing the work you hereby accept the Terms. Non-commercial uses of the work are permitted
without any further permission from Dove Medical Press Limited, provided the work is properly
attributed. For permission for commercial use of this work, please see paragraphs 4.2 and 5 of our Terms.
© 2022 The Author(s). This work is published and licensed by Dove Medical Press Limited. The
full terms of this license are available at https://www.dovepress.com/terms
and incorporate the Creative Commons Attribution
- Non Commercial (unported, 3.0) License.
By accessing the work you hereby accept the Terms. Non-commercial uses of the work are permitted
without any further permission from Dove Medical Press Limited, provided the work is properly
attributed. For permission for commercial use of this work, please see paragraphs 4.2 and 5 of our Terms.