Back to Journals » OncoTargets and Therapy » Volume 15
Molecular Changes in Chronic Myeloid Leukemia During Tyrosine Kinase Inhibitors Treatment. Focus on Immunological Pathways
Authors Janowski M, Ulańczyk Z, Łuczkowska K, Sobuś A, Rogińska D, Pius-Sadowska E, Gniot M ![]() , Kozłowski K, Lewandowski K, Helbig G, Machaliński B, Paczkowska E
, Kozłowski K, Lewandowski K, Helbig G, Machaliński B, Paczkowska E ![]()
Received 11 May 2022
Accepted for publication 29 August 2022
Published 10 October 2022 Volume 2022:15 Pages 1123—1141
DOI https://doi.org/10.2147/OTT.S371847
Checked for plagiarism Yes
Review by Single anonymous peer review
Peer reviewer comments 2
Editor who approved publication: Dr Sanjeev K. Srivastava
Michał Janowski,1,* Zofia Ulańczyk,2,* Karolina Łuczkowska,2 Anna Sobuś,2 Dorota Rogińska,2 Ewa Pius-Sadowska,2 Michał Gniot,3 Krzysztof Kozłowski,4 Krzysztof Lewandowski,3 Grzegorz Helbig,5 Bogusław Machaliński,2 Edyta Paczkowska2
1Department of Hematology and Transplantology, Pomeranian Medical University, Szczecin, Poland; 2Department of General Pathology, Pomeranian Medical University, Szczecin, Poland; 3Department of Hematology and Bone Marrow Transplantation, Poznan University of Medical Sciences, Poznań, Poland; 4Department of Constitutional Law, Faculty of Law and Administration, Jagiellonian University in Krakow, Krakow, Poland; 5Department of Hematology and Bone Marrow Transplantation, Medical University of Silesia, Katowice, Poland
*These authors contributed equally to this work
Correspondence: Edyta Paczkowska, Email [email protected]
Introduction: The aim of our research was to investigate changes in the molecular background of the immune response in the chronic phase (CP) of chronic myeloid leukaemia (CML) during treatment with tyrosine kinase inhibitors (TKIs).
Methods: Global gene and miRNA expression profiles were assessed using genome-wide RNA and miRNA microarray technology in bone marrow mononuclear cells. Fifty-one patients were recruited, and bone marrow samples were taken at diagnosis before treatment with TKIs and after 3, 6, and 12 months of treatment with TKIs. The largest number of upregulated genes was observed when the 0-month group (time of diagnosis) was compared to the 3-month group; 1774 genes were significantly upregulated, and 390 genes were significantly downregulated.
Discussion: Upregulated biological processes according to gene ontology (GO) classification involved basic cellular processes such as cell division, cell cycle, cell–cell adhesion, protein transport, mitotic nuclear division, apoptosis, and DNA replication. Differentially expressed miRNAs were annotated using GO classification to several immunity-related processes, including the T cell receptor signalling pathway, T cell costimulation, immune response, and inflammatory response. TKI therapy exerts a significant impact on cellular cycle processes and T-cell activation, which was proven at the molecular level.
Keywords: chronic myeloid leukaemia, tyrosine kinase inhibitor, immune response, gene microarrays, miRNAs
Introduction
Chronic myeloid leukaemia (CML) is a clonal myeloproliferative disorder that arises after a balanced reciprocal translocation involving chromosomes 9 and 22, t(9; 22) (q34; q11).1 This rearrangement produces the BCR-ABL1 transcript and consequently oncoprotein, which acts as a constitutively expressed defective tyrosine kinase. The downstream pathways affected include JAK/STAT, PI3K/AKT, and RAS/MEK, which involve cell growth, cell survival, inhibition of apoptosis, and activation of transcription factors.2 The BCR-ABL1 oncoprotein is a target for tyrosine kinase inhibitors (TKIs). The BCR-ABL1 transcript is a precise parameter for evaluating treatment response. The most common BCR-ABL1 transcripts are the e13a2 and e14a2 transcripts.3,4 In the vast majority of patients, treatment with TKIs results in suppression of leukaemic clone proliferation and achievement of complete haematologic remission with restoration of the proportion of the cell population present in the blood. This revolutionary targeted therapy has significantly improved the survival rates of patients affected with CML, which are now comparable to those of age-matched healthy individuals.5 However, the risk of a refractory chronic phase or even progression to an accelerated phase and blast crisis of CML still occurs and remains a serious clinical challenge. Despite attempts at safe therapy cessation, called treatment-free remission (TFR), which is now the therapeutic goal, the disease remains incurable.6 Considering the possibility of discontinuing treatment with TKIs without relapse and the phenomenon of a so-called “functional cure”, much attention has been given to the role of the immune system in CML pathophysiology. The immune system seems to be responsible for the control of residual leukaemic cells and the lack of relapse of CML in patients without treatment. They exhibit low levels of BCR-ABL1 transcript as measured by highly sensitive BCR-ABL DNA detection methods.7 Since leukaemic stem cell LSCs are TKI resistant and genetically unstable, they are a potential target for new immunotherapeutic approaches.8 The important role of immune surveillance over this population of TKI-resistant cells in maintaining a profound molecular response after cessation of therapy has been postulated. To date, cell-mediated immunity in the control of leukaemic cells patients has been most extensively studied.9 Considerably less is known about molecular changes in response to TKI treatment, especially the expression of genes and microRNAs. MicroRNAs (miRNAs, miRs), 20–22 nucleotide long noncoding RNA molecules, have recently emerged as key regulators of various genes, and their role in immune regulation has also been suggested.10 MiRNAs regulate gene expression at the posttranscriptional level and are involved in almost every biological process as well as neoplasm-associated processes. Recently, the role of miRNAs in the progression of CML and the development of TKI resistance, based on their important regulatory function in cell homeostasis, has been implicated.11 Differentially expressed miRNAs have been reported in several diseases and as a response to treatment.12 To better understand the underlying molecular mechanisms of immune restoration during TKI treatment, in the present study, we investigated global mRNA and miRNA expression in bone marrow cells in CML patients at different time points during the first 12 months of therapy with imatinib (IM). To date, a wide panel of mRNAs/miRNAs has not been tested at different time points of CML treatment to provide insight into the immune changes and treatment response. The aim of this study was to elucidate possible correlations between miRNAs and their target gene expression profiles in CML patients treated with TKIs at the time of diagnosis compared with several time points during the first year of therapy.
Materials and Methods
The Study Cohort
The study was conducted on 51 patients with CML enrolled from the Department of Haematology and Bone Marrow Transplantation, Pomeranian Medical University, Szczecin, Poland. Prior to enrolment, all patients signed informed consent in accordance with the Declaration of Helsinki. Before patient enrolment, we obtained appropriate approval from the local ethics committee of the Pomeranian Medical University (approval code: KB-0012/11/2021). We enrolled adult patients in the chronic phase of CML. Consecutive patients in whom a diagnosis of chronic phase CML was established were recruited for the study. The inclusion criteria for the study were as follows: age from 18 to 80 years, diagnosed chronic myeloid leukemia in the chronic phase. The exclusion criteria were as follows: age under 18 or over 80 years, diagnosis chronic myeloid leukaemia in accelerated or blastic phase, coexistence of another myeloid or lymphoid neoplasm or suspected secondary chronic leukaemia to prior conducted therapy (eg radiotherapy). The median age of the patients was 54.5. Patients received IM (76%) or second-generation TKIs as a second-line treatment (24%, nilotinib=3, dasatinib=9). All patients started IM therapy, and some patients changed treatment. The study cohort is summarized in Table 1.
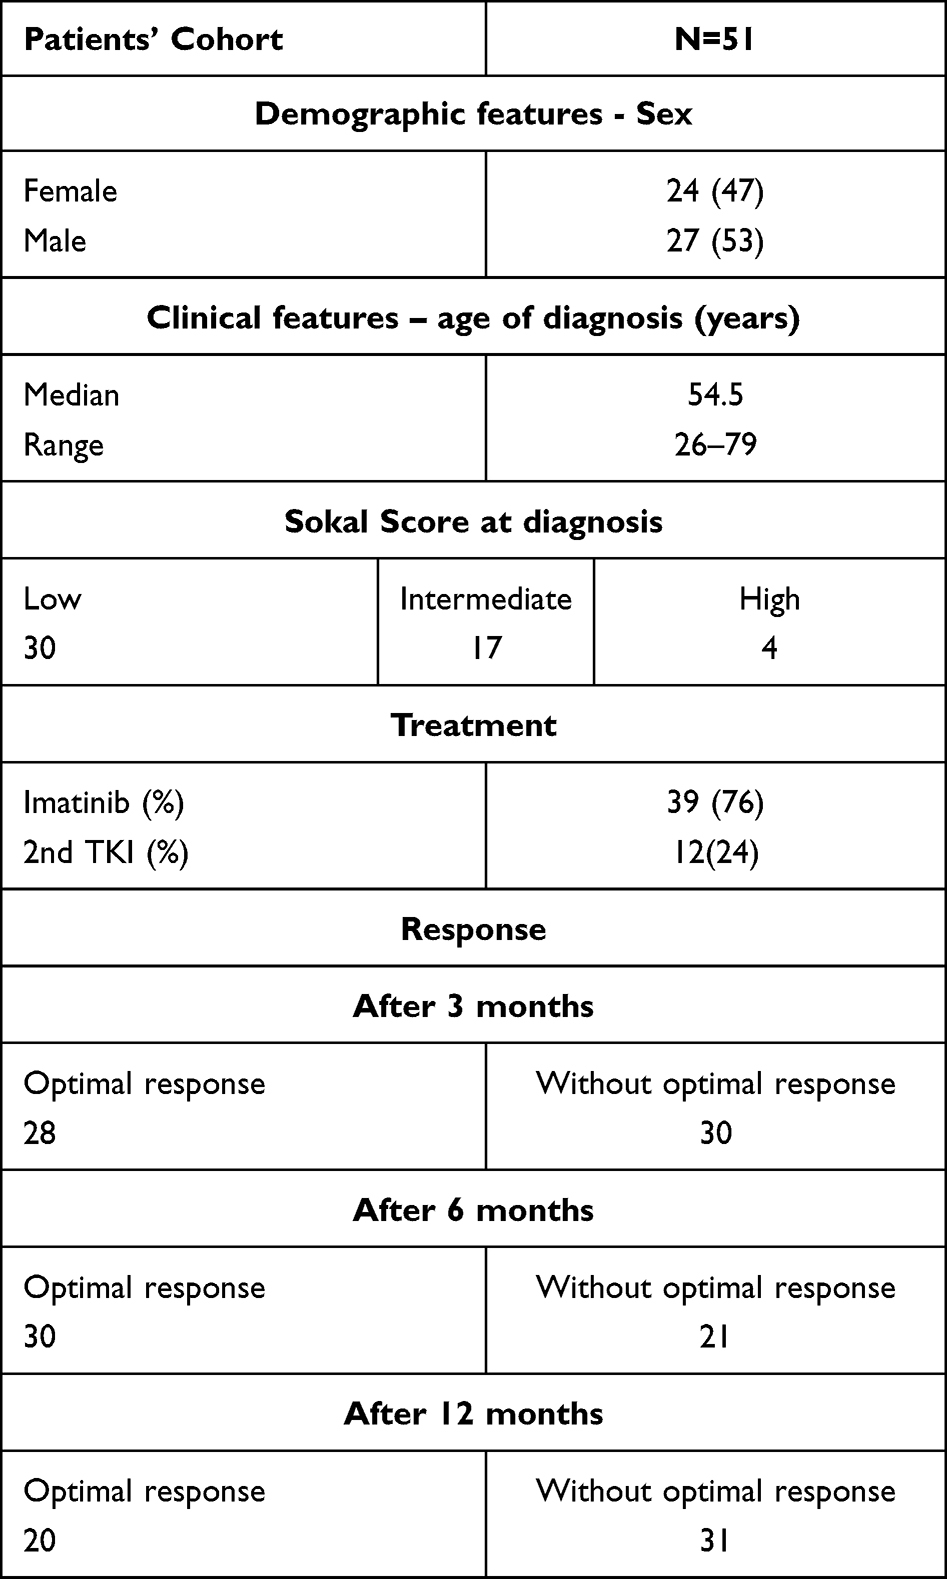 |
Table 1 Characteristics of Study Cohort |
To assess the effect of TKI treatment on the molecular mechanisms regulating the immune response, we collected bone marrow (BM) samples at four consecutive time points. BM was aspirated at 0, 3, 6 and 12 months from the posterior iliac crest from diagnosis. Next, the BM sample was diluted 1:1 with phosphate-buffered saline (PBS) and layered on Lymphocyte Separation Medium (MP Biomedicals, Santa Ana, CA, USA). The obtained mononuclear cell suspension was then subjected to RNA and miRNA isolation.
RNA and miRNA Isolation
Total RNA enriched in miRNAs was isolated from bone marrow mononuclear cells (1 × 10⁶) using the mirVana™ miRNA Isolation Kit (Thermo Fisher, Waltham, MA, USA) following the manufacturer’s instructions. An Epoch spectrophotometer (Biotek, Winooski, VT, USA) was used to assess the concentration and quality of the obtained RNA. For subsequent miRNA and whole transcriptome microarray analysis, total RNA enriched in miRNAs isolated from bone marrow samples from three patients was pooled to generate one sample per group.
Affymetrix GeneChip Microarrays
RNA and miRNAs isolated from BM mononuclear cells of patients at different time points were pooled to generate one sample per group for microarray experiments. Affymetrix miRNA 4.1 Array Strip (Affymetrix, Santa Clara, CA) and Affymetrix Human Gene 2.1 ST Array Strip (Affymetrix) was used for the study. Generation of sense strand cDNA from the total RNA and subsequent fragmentation and labelling steps were performed using the GeneChip™ WT PLUS Reagent Kit (Thermo Fisher Scientific, Waltham, MA, USA). Finally, the sample was hybridized onto an Affymetrix Human Gene 2.1 ST Array Strip. The Affymetrix GeneAtlas System was used for hybridization, fluidics and scanning steps. Subsequent analyses were performed using BioConductor software. We used the Robust Multiarray Average (RMA) normalization algorithm (from the “Affy” library) for normalization, background correction, and calculation of the expression levels of the examined genes. Microarrays were made and analysed according to the methods described in previous studies.37,38
DAVID
For functional annotation and enrichment analysis, we used DAVID Bioinformatics Resources (Database for Annotation, Visualization, and Integrated Discovery) at http://david.abcc.ncifcrf.gov, as previously described 25, 26. Functional annotation charts generated by DAVID with overrepresented gene annotations are shown as bubble plots from the BACA BioConductor package (https://cran.r-project.org/web/packages/BACA/BACA.pdf). The following criteria were applied to generate bubble plots: p value < 0.5, adjusted method = Benjamini 27, and minimal number of genes per group = 5. Groups of genes that met these criteria are shown in a graph, where the bubble size is indicative of the number of genes represented in the corresponding annotation and their down- or upregulation.
Statistical Analysis
The nonparametric Mann–Whitney test was used to compare values between study groups, because in the majority of cases the quantitative variable distribution notably differed from the normal distribution. Spearman’s rank correlation coefficient (Rs) was used to measure the strength of associations between gestational age and concentrations of each tested complement component. The sign of the Rs value indicates the direction of the association (positive or negative), while a higher absolute value (closer to -1 or +1) indicates a stronger association. We considered p<0.05 statistically significant. Statistica 13 software (Dell Inc., OK, USA) was used for statistical analysis.
Results
Gene Expression Profile in Mononuclear Cells Derived from Bone Marrow Aspirates
We distinguished three separate groups based on the time from CML diagnosis (3, 6, 12 months) and compared their gene expression profiles with the group at diagnosis (“Group 0”). Microarray analysis revealed that the highest number of differentially expressed genes in this comparison was observable for the 0-month group when compared to the 3-month group. In this case, 1774 genes were at least 2-fold upregulated and 390 genes were at least 2-fold downregulated in the 0-month group compared to the 3-month group (Figure 1). When we analysed gene expression profiles in the 6- and 12-month groups, the number of genes that were differentially expressed was smaller. Figure 2 presents 211 upregulated and 152 downregulated genes in the 0-month group compared to the 6-month group. Figure 3 presents 304 upregulated and 138 downregulated genes in the 0-month group compared to the 12-month group.
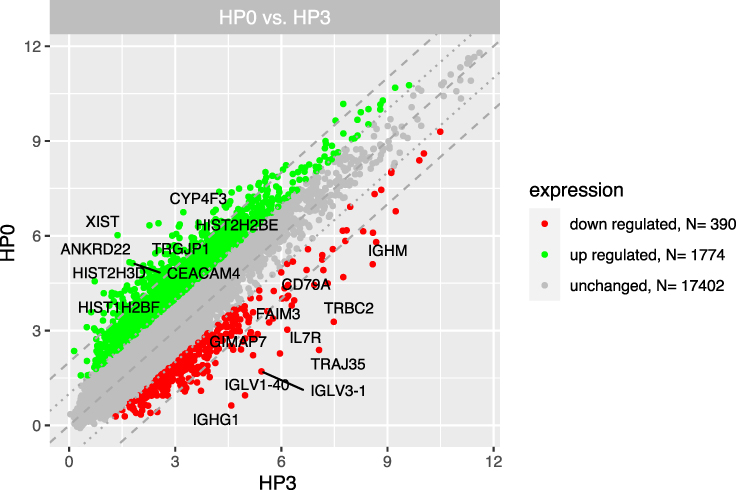 |
Figure 1 The scatterplot of global gene expression in mononuclear cells derived from bone marrow aspirates at the diagnosis (HP0) compared to 3 months after diagnosis (HP3). Red points show downregulated genes (at least 2-fold change, p < 0.05), green points show upregulated genes (at least 2-fold change, p < 0.05). The grey dotted lines mark the border of significantly higher or significantly lower expression (log2(fold)>2), whereas the grey dashed lines correspond to log2(fold)>4. The graph also comprises the names of genes with the largest change in expression. |
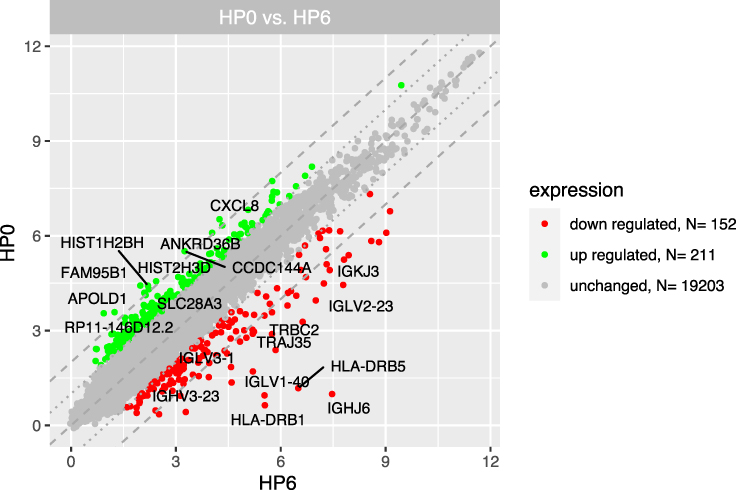 |
Figure 2 The scatterplot of global gene expression in mononuclear cells derived from bone marrow aspirates at the diagnosis (HP0) compared to 6 months after diagnosis (HP6). Red points show downregulated genes (at least 2-fold change, p < 0.05), green points show upregulated genes (at least 2-fold change, p < 0.05). The grey dotted lines mark the border of significantly higher or significantly lower expression (log2(fold)>2), whereas the grey dashed lines correspond to log2(fold)>4. The graph also comprises the names of genes with the largest change in expression. |
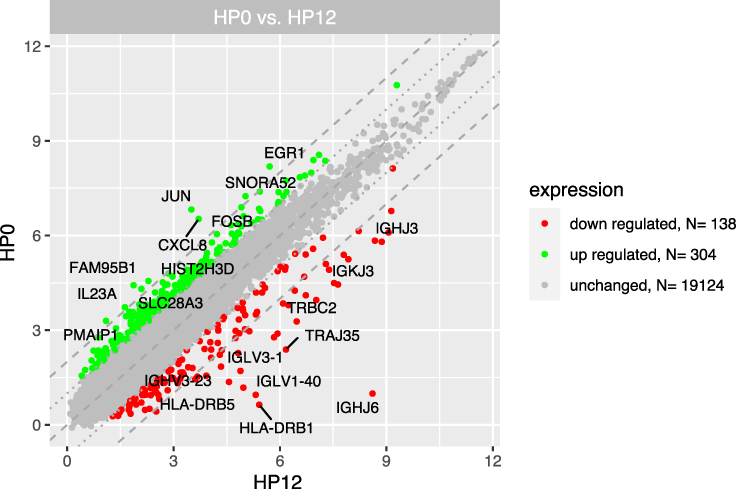 |
Figure 3 The scatterplot of global gene expression in mononuclear cells derived from bone marrow aspirates at the diagnosis (HP0) compared to 12 months after diagnosis (HP12). Red points show downregulated genes (at least 2-fold change, p < 0.05), green points show upregulated genes (at least 2-fold change, p < 0.05). The grey dotted lines mark the border of significantly higher or significantly lower expression (log2(fold)>2), whereas the grey dashed lines correspond to log2(fold)>4. The graph also comprises the names of genes with the largest change in expression. |
Next, we looked at the most significantly up- and downregulated genes in the 0-month group compared to the 3-, 6- and 12-month groups (Tables 2–7). Interestingly, several genes showed similar expression profiles. For example, HIST2H3D was significantly upregulated in all analyses; however, the highest fold change (FC) equal to 14.30 was observed when the 0-month group was compared to the 3-month group (FC 4, 37 for 0 vs 6 months and 4, 82 for 0 vs 12 months). On the other hand, the expression of FAM95B1, CXCL8 and SLC28A3 was significantly upregulated only when the 0-month group was compared to both the 6- and 12-month groups. The lists of the ten most downregulated genes when the 0-month group was compared to the 6- and 12-month groups were distinctly similar, as 9 out of 10 genes were the same and differed only slightly in their FCs: IGHV3-23, IGKJ3, TRBC2, TRAJ35, IGLV3-1, IGLV1-40, HLA-DRB1, HLA-DRB5, and IGHJ6 (Tables 5 and 7). Four of these genes were also significantly downregulated in the 0-month group compared to the 3-month group: IGLV3-1, IGLV1-40, TRBC2, and TRAJ35 (Table 3). In Table 8, we summarized genes whose expression changed similarly at diagnosis compared to each subsequent time point (3, 6 and 12 months).
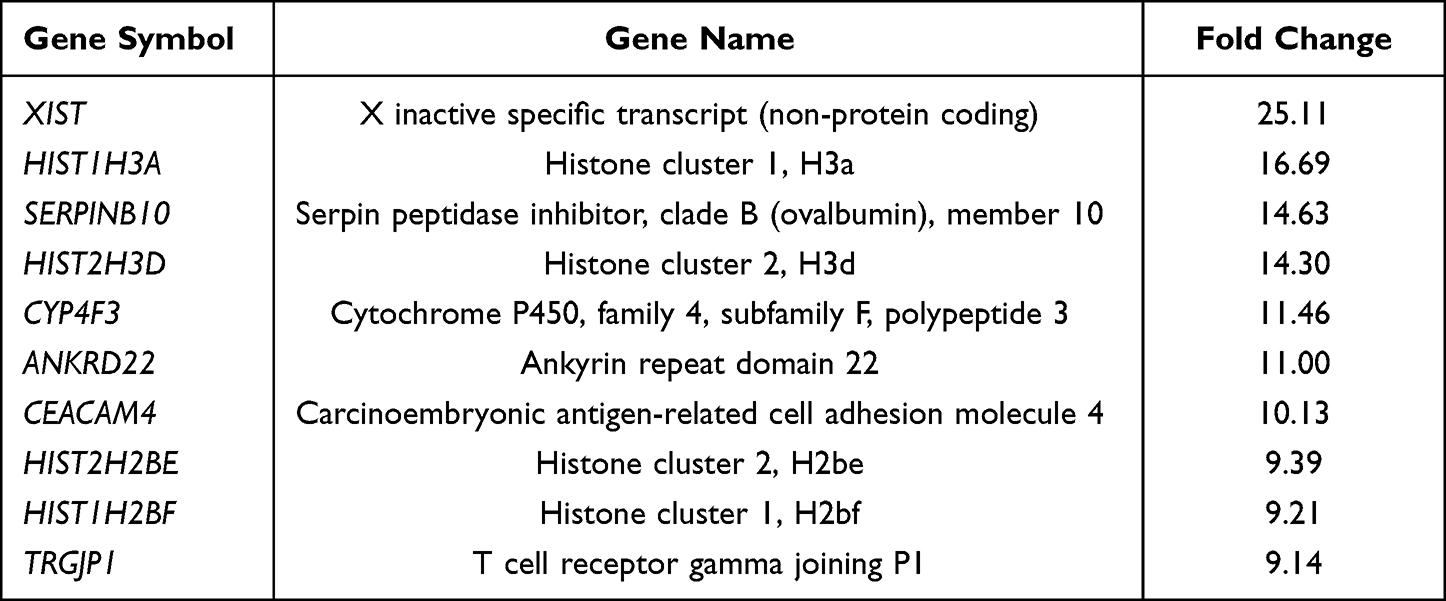 |
Table 2 The List of 10 Most Upregulated Genes in 0-Month Group in Comparison to 3-Month Group |
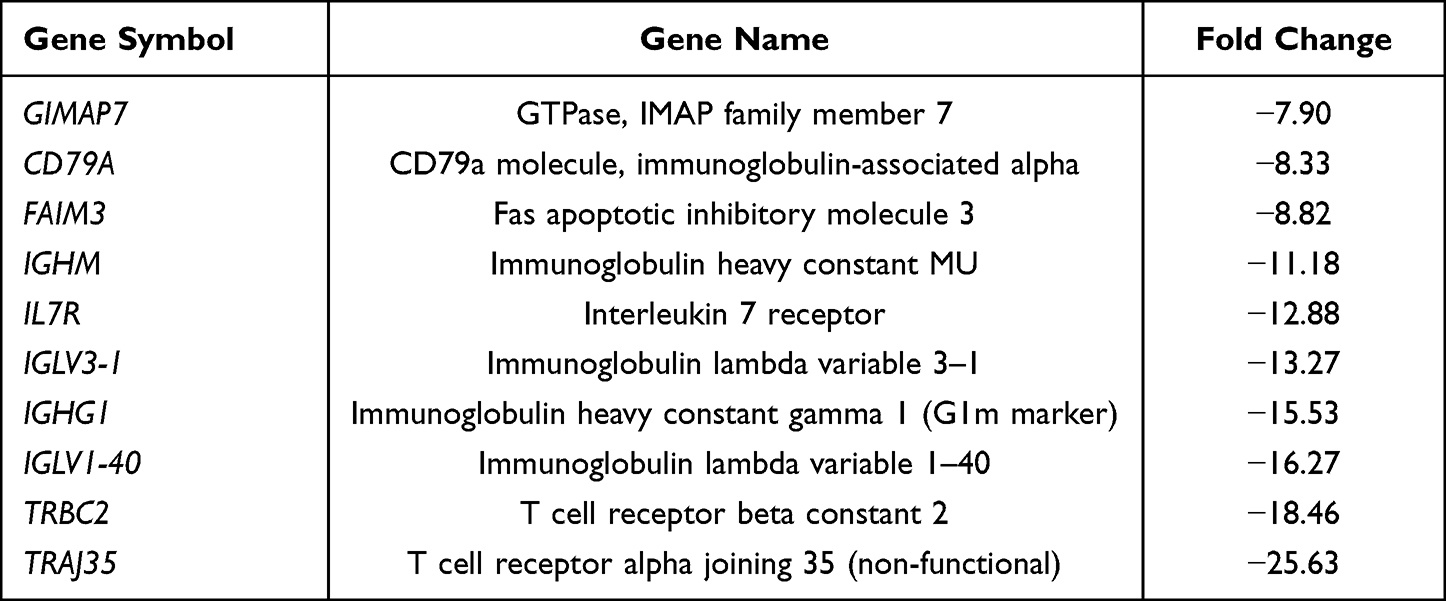 |
Table 3 The List of 10 Most Downregulated Genes in 0-Month Group in Comparison to 3-Month Group |
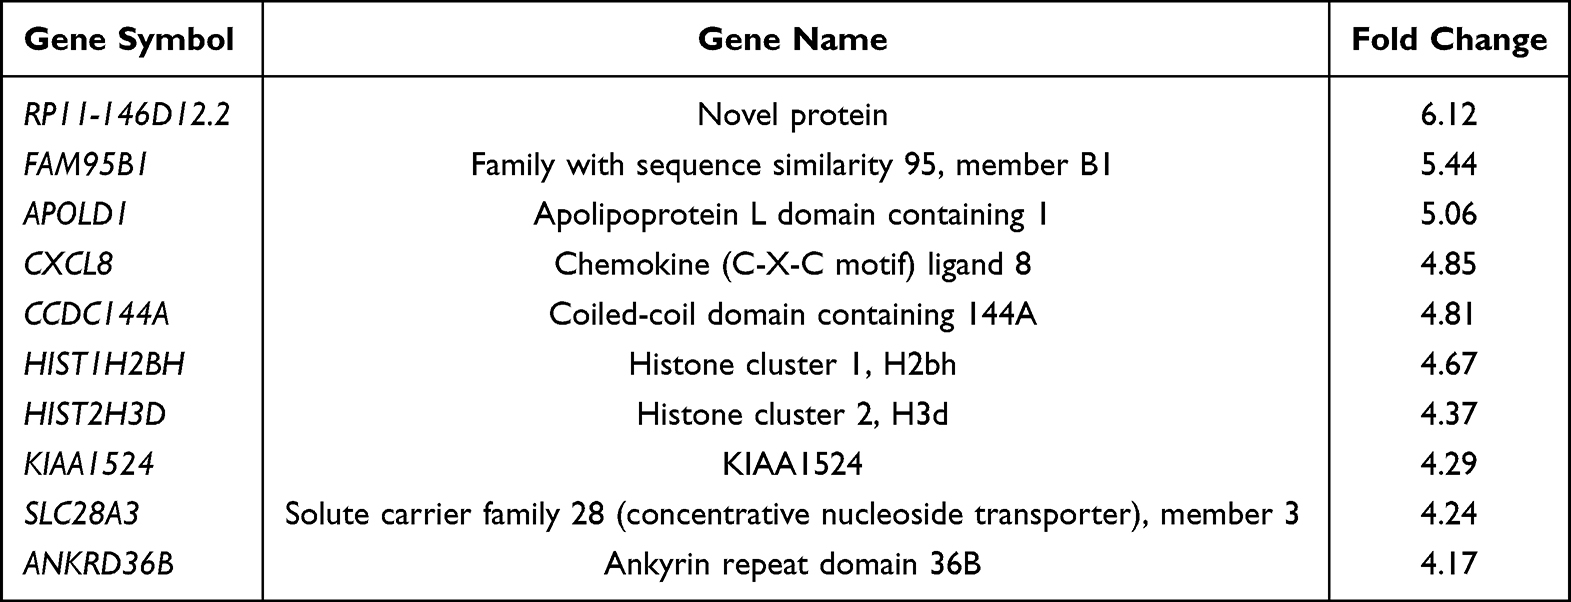 |
Table 4 The List of 10 Most Upregulated Genes in 0-Month Group in Comparison to 6-Month Group |
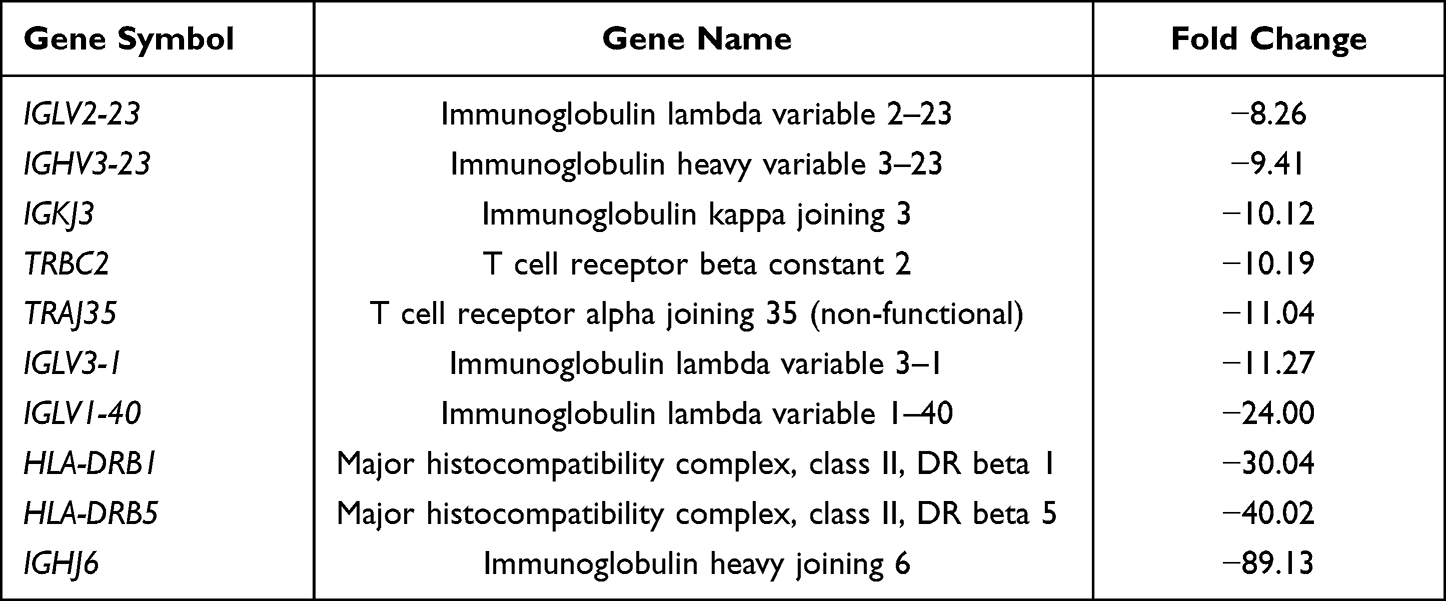 |
Table 5 The List of 10 Most Downregulated Genes in 0-Month Group in Comparison to 6-Month Group |
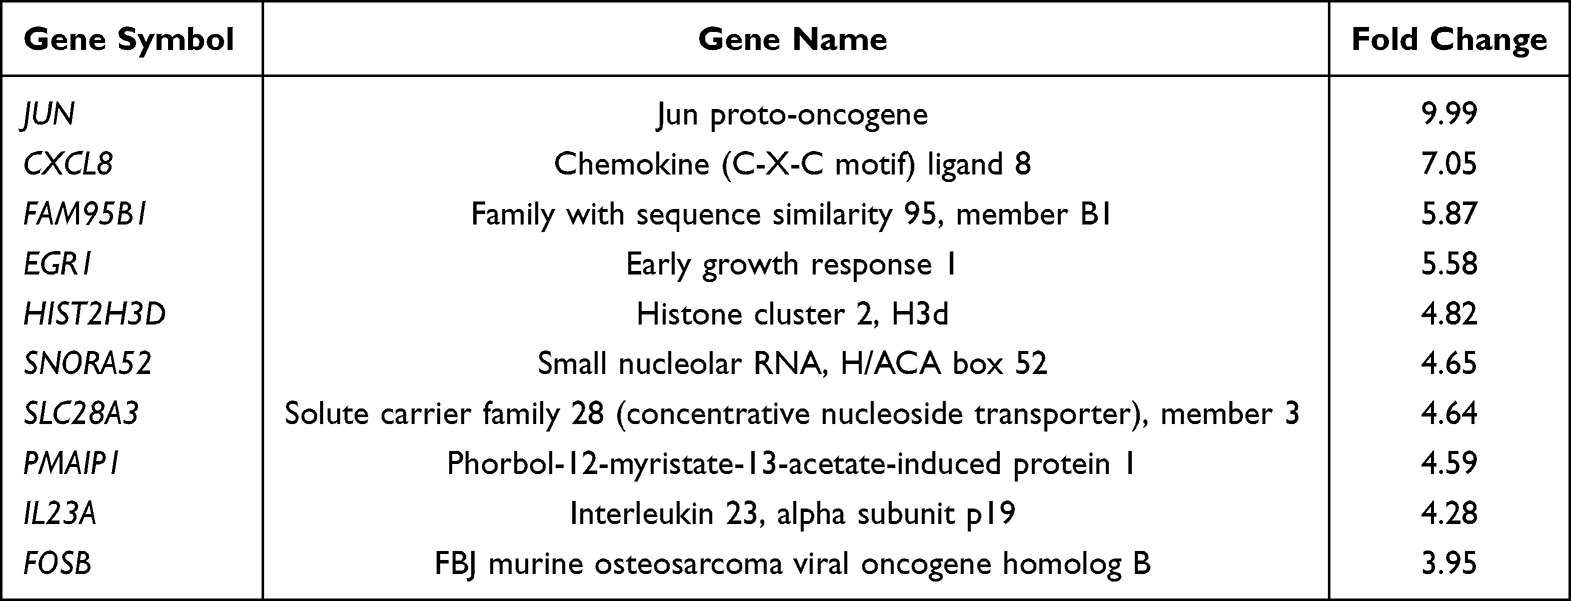 |
Table 6 The List of 10 Most Upregulated Genes in 0-Month Group in Comparison to 12-Month Group |
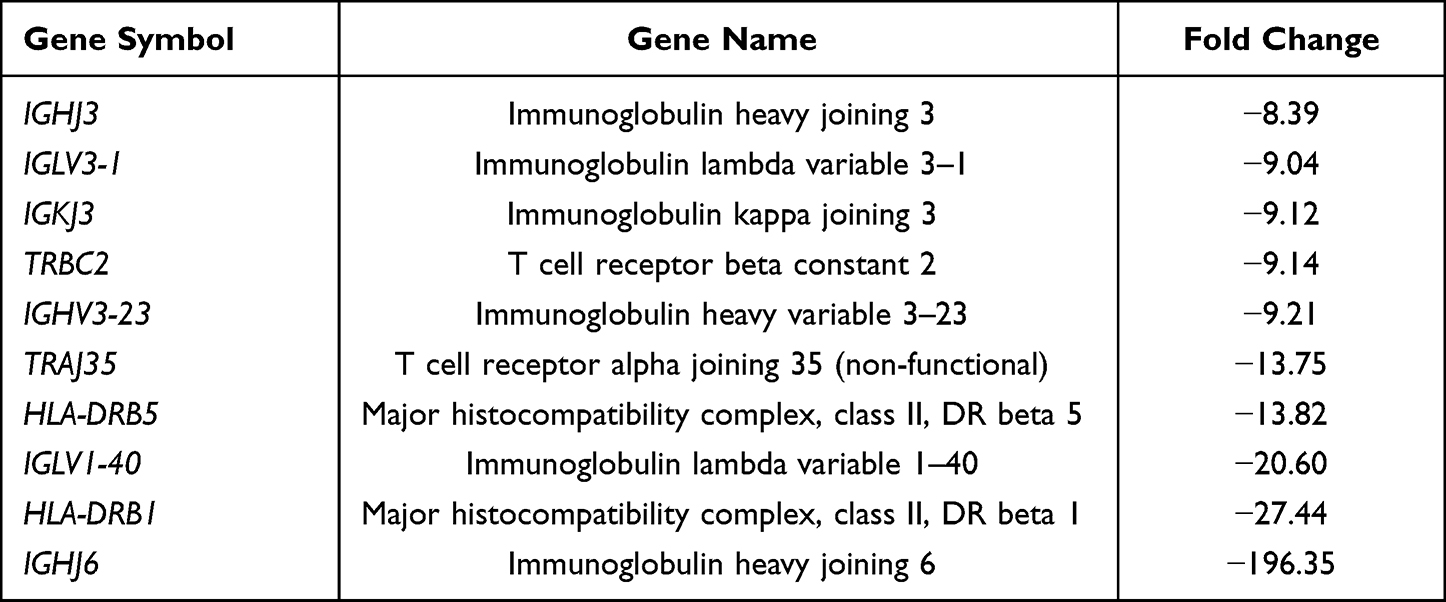 |
Table 7 The List of 10 Most Downregulated Genes in 0-Month Group in Comparison to 12-Month Group |
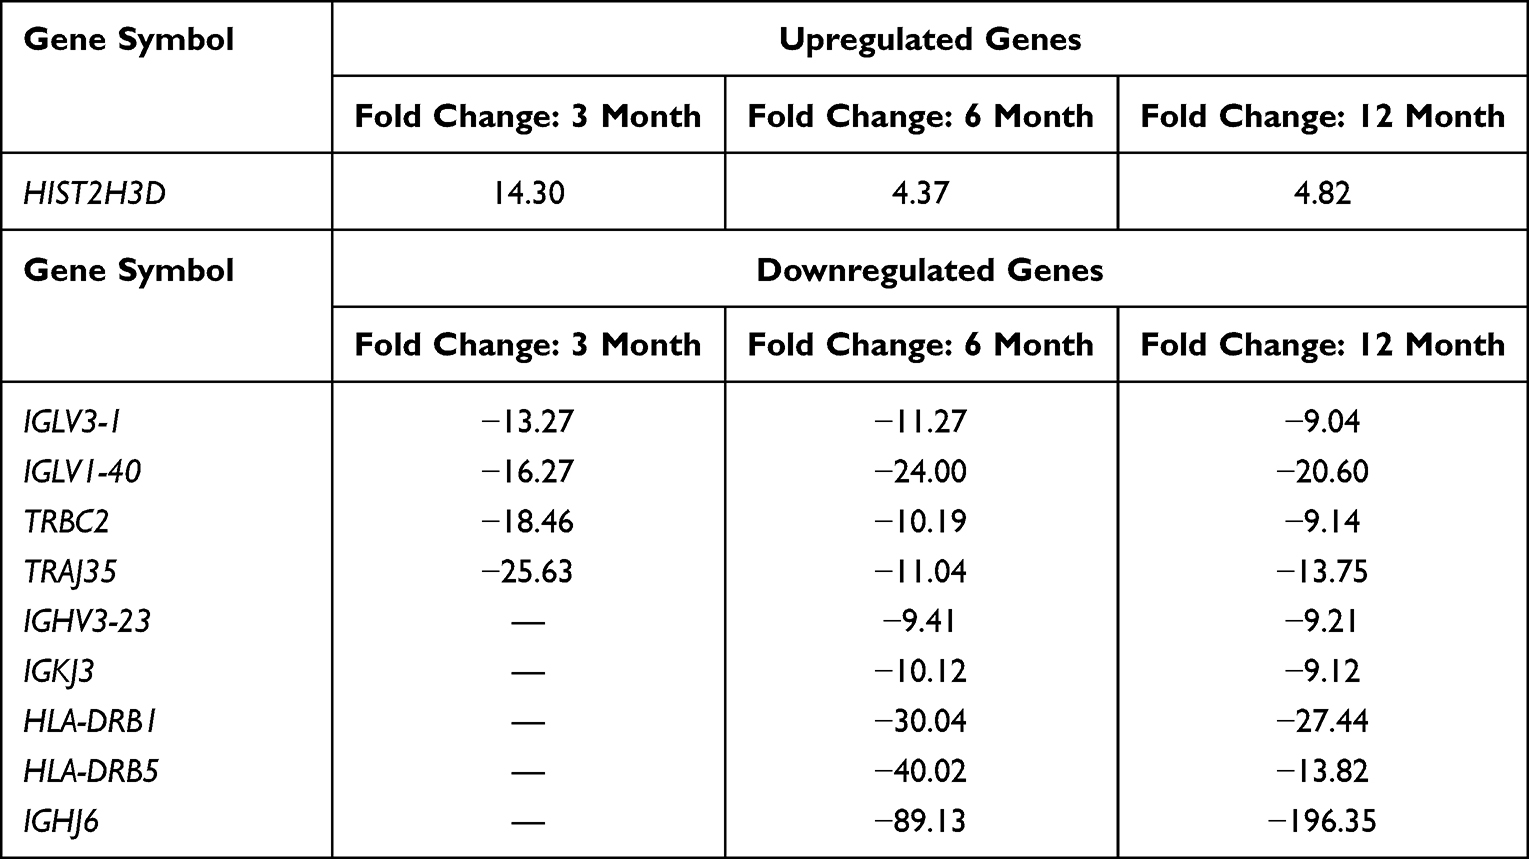 |
Table 8 Summary of Genes Whose Expression Changed Significantly and Similarly at Diagnosis Compared to Each Subsequent Time Point (3, 6 and 12 Months) |
Since these significantly up- and downregulated genes encode proteins important to the immune system (immunoglobulins, MHC, T cell receptors), we aimed to take a broader look at the gene expression profiles in our patients and investigate whether immunity-related processes were dysregulated. Therefore, in the next part of our analysis, the differentially expressed genes were classified according to the gene ontology (GO) classification of biological processes (Figure 4). The largest number of upregulated processes was observed when the 0-month group was compared to the 3-month group, which corresponds to the high number of differentially expressed genes between these groups, as discussed earlier (Figure 1). These upregulated processes mainly included basic cellular processes: cell division, cell cycle, cell-cell adhesion, protein transport, mitotic nuclear division, autophagy, apoptosis and DNA replication. Next, we analysed the dynamics of changes in different groups of genes associated with biological processes. The changes in gene expression and their biological processes at the 6th month of treatment revealed a similar trend as at the 3rd month. There was a noticeable upregulation of genes involved in regulation of the cell cycle, DNA repair processes. The t-cell signalling pathway and regulation of the adaptive immune response were the biological processes most altered at the 12-month time point. The majority of downregulated processes in all of the comparisons were related to immunity: T cell receptor signalling pathway, regulation of immune response, T cell costimulation, immune response and adaptive immune response. Interestingly, the number of these downregulated processes and genes involved was the highest when the 0-month and 3-month groups were compared and decreased in subsequent time points.
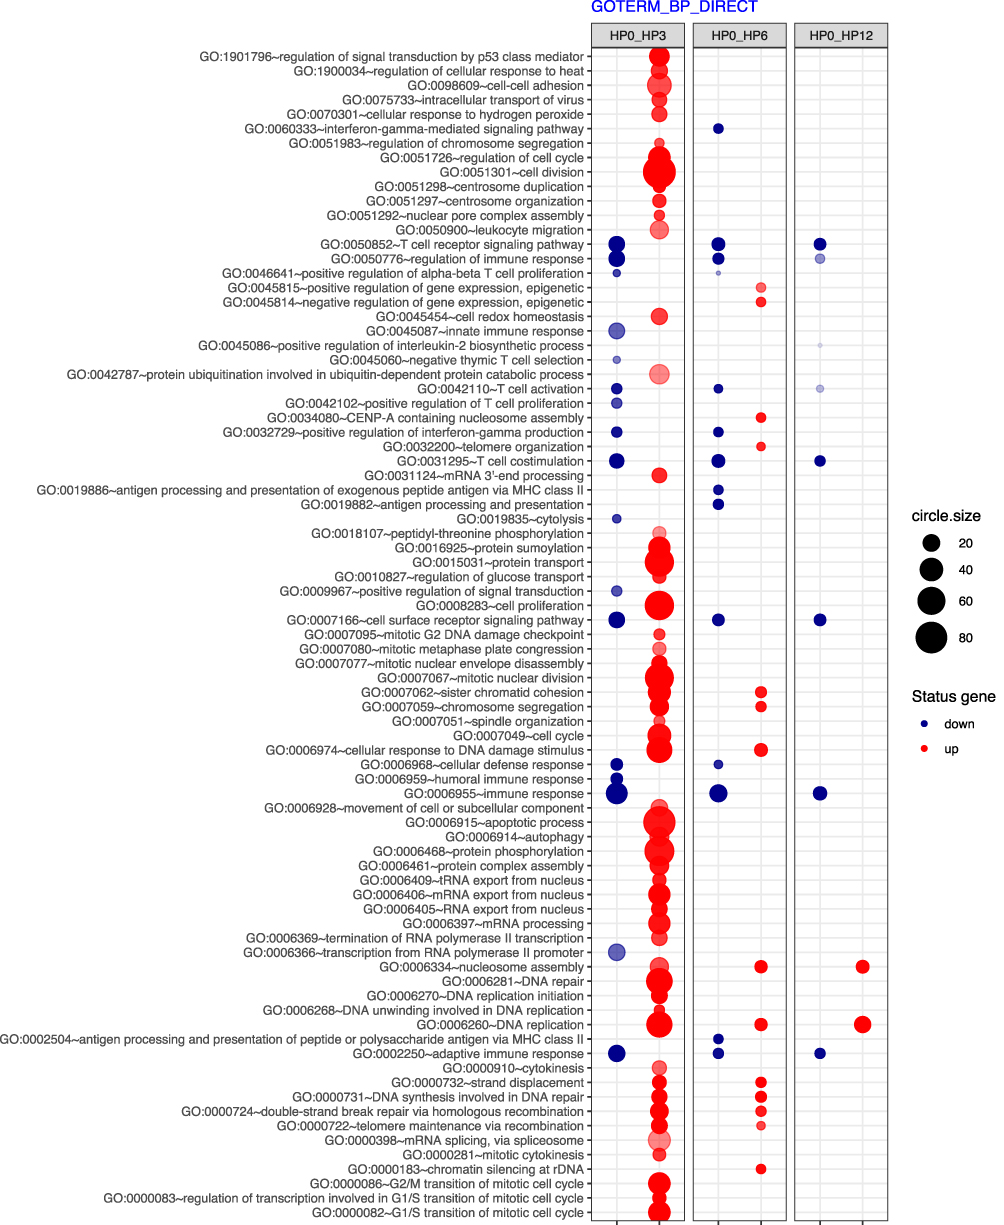 |
Figure 4 The bubble plot of overrepresented biological processes according to gene ontology (GO) classification in 0-moths group (HP0) compared to 3- (HP3), 6- (HP6) and 12-month (HP12) groups. Genes assigned to individual processes fulfilling the criteria: adjusted p < 0.05, method = Benjamini, and minimum number of genes per group = 5, are presented. The bubble size indicates the number of genes represented in the corresponding annotation. The up- and downregulation is indicated by colors, with red corresponding to upregulation and blue corresponding to downregulation. |
Next, we implemented the obtained results to assess global shifts in gene expression at the subsequent time points analysed. The K-clustering approach distinguished five clusters of significantly changed genes in four analysed groups (0, 3, 6, 12 months). This approach enabled us to analyse groups of genes similarly expressed at subsequent time points. As shown in Figure 5, genes grouped in Cluster 1 and 4 showed the opposite trend in expression, whereas Cluster 2 and 3 were similar and opposite to Cluster 5.
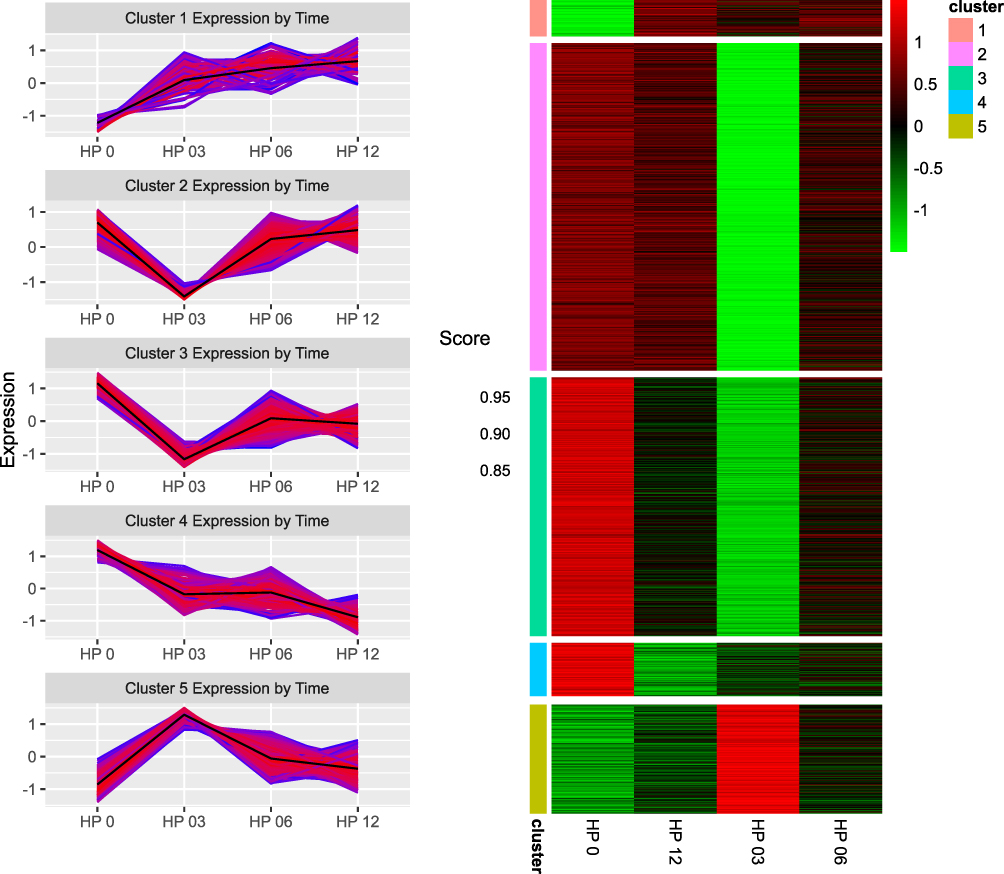 |
Figure 5 Changes in the expression of genes assigned to each of the 5 clusters at each time point: 0 month (HP0), 3 month (HP03), 6 month (HP06), 12 month (HP12). On the right, heatmaps representing the expression of genes assigned to each gene cluster in all analyzed time points. |
The assignment of differentially expressed genes to relevant Gene Ontology terms revealed that Cluster 2 and 3, which shared a similar pattern of expression at subsequent time points, also contained genes involved in related processes: cell division, regulation of the cell cycle, cell proliferation and protein phosphorylation (Figure 6). The cluster that grouped genes with increasing expression in subsequent points, Cluster 1, contained genes involved in processes related to immunity: T cell receptor signaling, T cell activation, T cell costimulation, antigen processing and presentation.
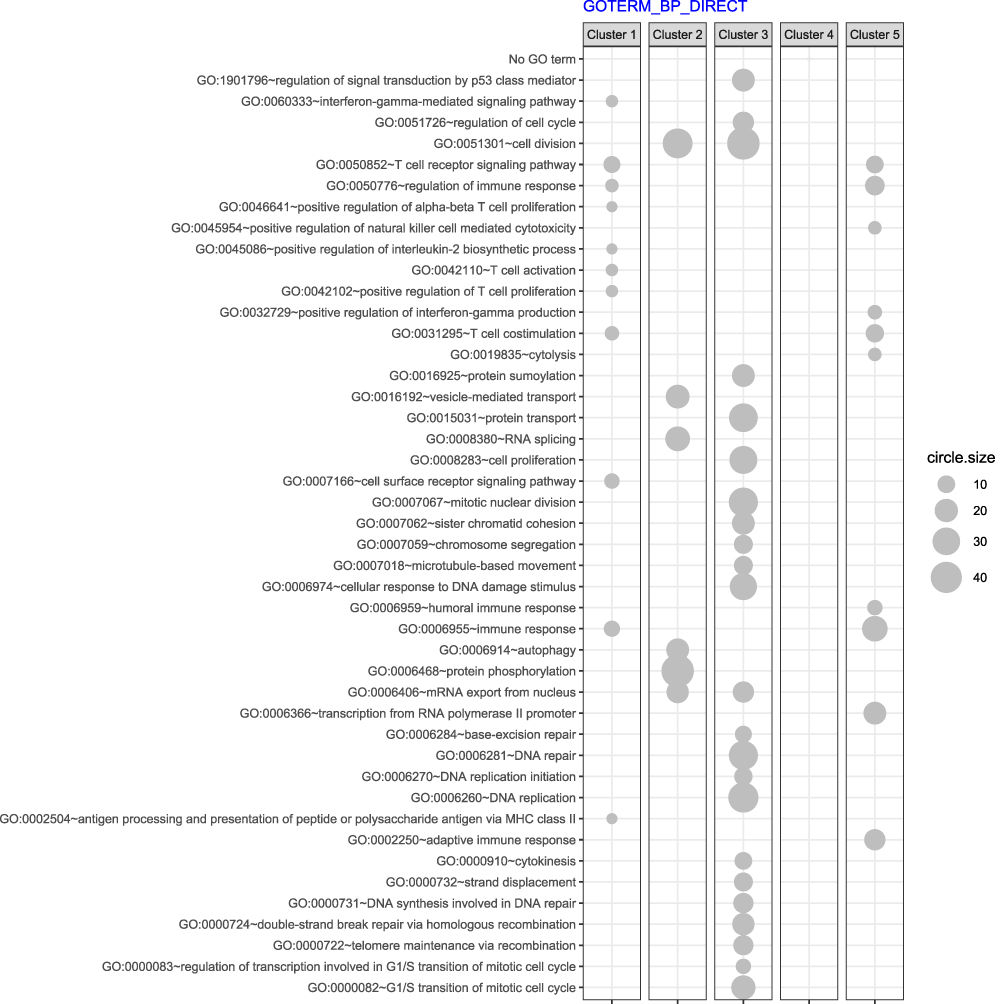 |
Figure 6 The bubble plot depicts the assignment of genes in each cluster to biological processes based on gene ontology (GO) classification. Groups of genes fulfilling criteria: adjusted p < 0.05, method = Benjamini, and minimum number of genes per group = 5, are presented. Bubble size indicates the number of genes represented in corresponding annotation. |
MiRNA Expression Profile in Mononuclear Cells Derived from Bone Marrow Aspirates
The results of the miRNA expression analysis showed a similar number of differentially expressed genes (at least 2-fold) in the group at diagnosis compared to the 3-, 6-, 12-month group: 146 significantly upregulated and 32 downregulated miRNAs compared to the 3-month group (Figure 7), 116 significantly upregulated and 31 downregulated miRNAs compared to the 6-month group (Figure 8) and 91 significantly upregulated and 39 downregulated miRNAs compared to the 12-month group (Figure 9).
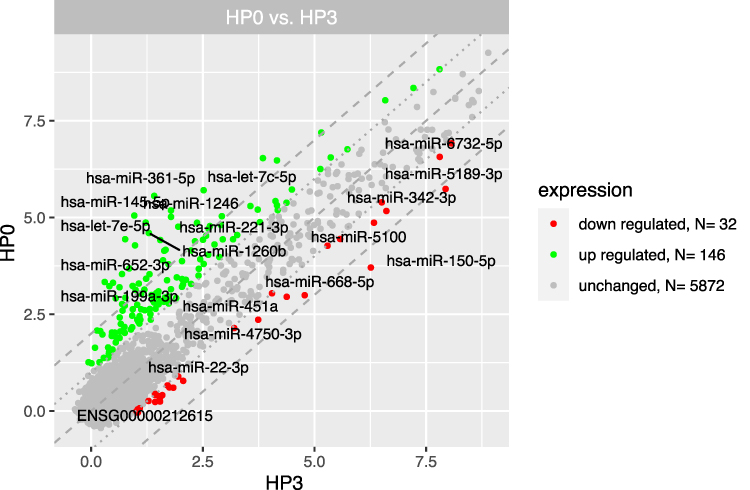 |
Figure 7 The scatterplot of miRNAs expression in mononuclear cells derived from bone marrow aspirates at the diagnosis (HP0) compared to 3 months after diagnosis (HP3). Red points show downregulated miRNAs (at least 2-fold change, p < 0.05), green points show upregulated miRNAs (at least 2-fold change, p < 0.05). The grey dotted lines mark the border of significantly higher or significantly lower expression (log2(fold)>2), whereas the grey dashed lines correspond to log2(fold)>4. The graph also comprises the names of miRNAs with the largest change in expression. |
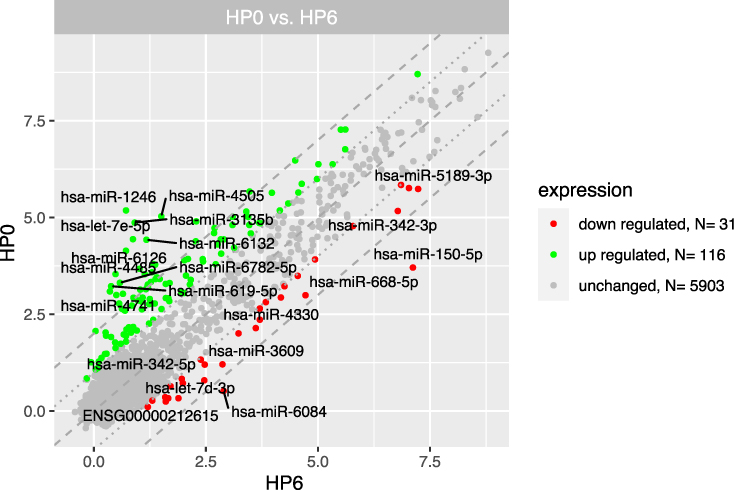 |
Figure 8 The scatterplot of miRNAs expression in mononuclear cells derived from bone marrow aspirates at the diagnosis (HP0) compared to 6 months after diagnosis (HP6). Red points show downregulated miRNAs (at least 2-fold change, p < 0.05), green points show upregulated miRNAs (at least 2-fold change, p < 0.05). The grey dotted lines mark the border of significantly higher or significantly lower expression (log2(fold)>2), whereas the grey dashed lines correspond to log2(fold)>4. The graph also comprises the names of miRNAs with the largest change in expression. |
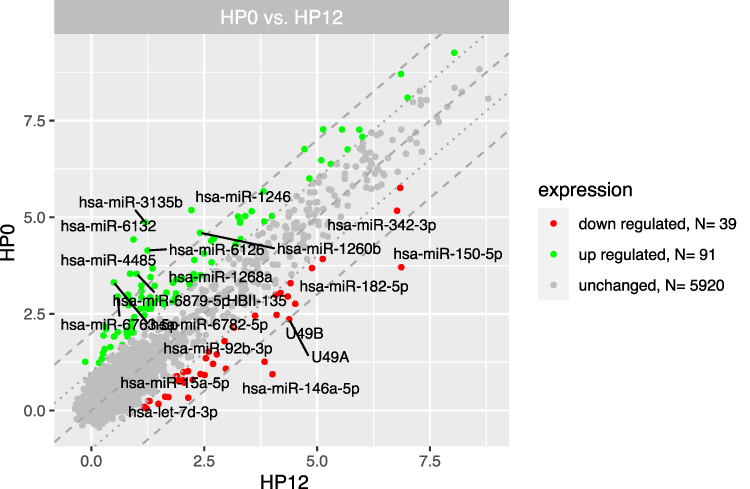 |
Figure 9 The scatterplot of miRNAs expression in mononuclear cells derived from bone marrow aspirates at the diagnosis (HP0) compared to 12 months after diagnosis (HP12). Red points show downregulated miRNAs (at least 2-fold change, p < 0.05), green points show upregulated miRNAs (at least 2-fold change, p < 0.05). The grey dotted lines mark the border of significantly higher or significantly lower expression (log2(fold)>2), whereas the grey dashed lines correspond to log2(fold)>4. The graph also comprises the names of miRNAs with the largest change in expression. |
Since miRNAs regulate gene expression, we decided to conduct an analysis comparing the outcomes of miRNA microarray expression data to the obtained mRNA data, with a particular focus on immunity-related processes. Figure 10 presents a network of connections between miRNAs and their target mRNAs, all involved in T cell activation.
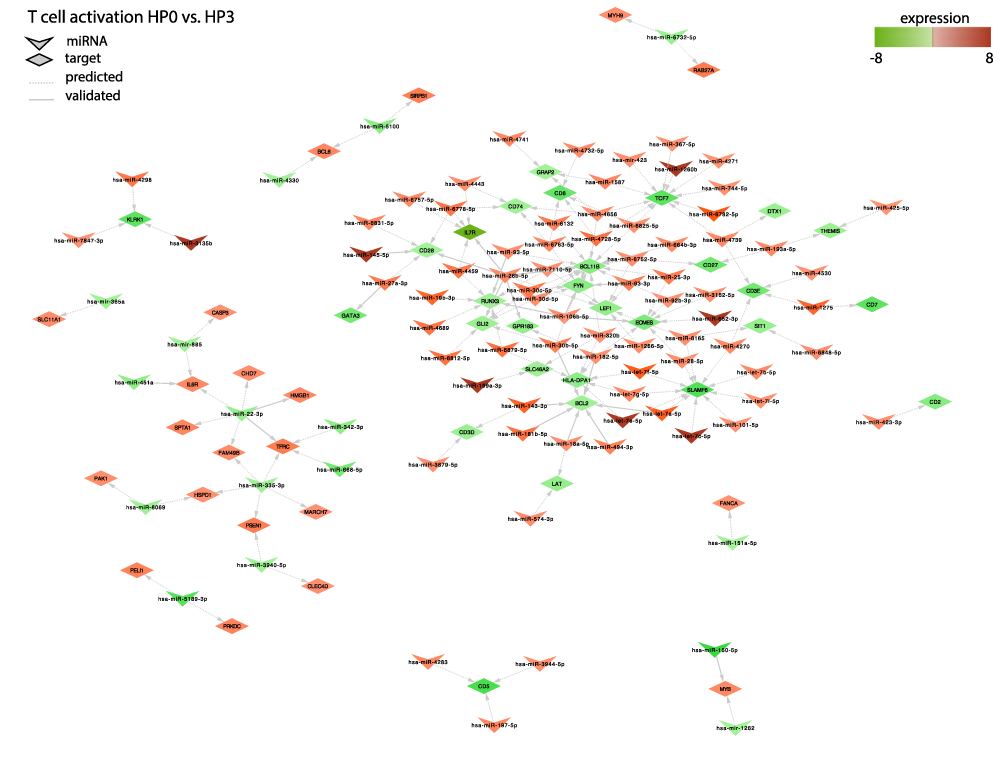 |
Figure 10 The diagram shows significantly up- or downregulated miRNAs and their target genes involved in T cell activation in 0-month group when compared to 3-month group. Target genes are assigned to each miRNA with a marked change in expression (at least fold 2 or −2) (red indicates upregulation and green indicates downregulation). The solid lines correspond to the validated genes, and the dashed lines corresponds to the predicted genes. |
Discussion
The latest achievements in the treatment of CML allow for the discontinuation of pharmacotherapy and the maintenance of a deep molecular response. It is thought that recovery from CML is the consequence of two parallel processes: halting the transduction of proliferative signals and renewing the immune response. We hypothesized that TKIs also play an important role also in this second process. The first step of our study was to analyse the global gene expression in BM cells from CML patients at different time points during TKI treatment and to compare it with the time of diagnosis. The most pronounced gene expression upregulation was observed in comparison to 0-month and 3 months after introducing treatment with TKI. The gene with the highest fold change, equal to 25.11 in this comparison was XIST, a long noncoding RNA (lncRNA) essential for the initiation of X chromosome inactivation (XCI), which in turn plays an important role in silencing one X chromosome in female mammals to balance gene expression between the sexes.13 Selective excision of XIST in murine haematopoietic stem cells (HSCs) leads to progressive myelofibrosis, proliferation of granulocytic lineage, myelodysplastic changes and appearance of extramedullary haematopoiesis revealed as splenomegaly as presented by Yildirim et al.14 The changes in haematopoiesis accompanying the knockdown of XIST are consistent with the clinical presentation of myeloproliferative neoplasms, including CML. Our study provides quite different data and we demonstrated XIST downregulation three months after treatment with TKIs. This is the moment of the most significant recovery of normal haematopoiesis, which is particularly evident in the first months of treatment and is related to the achievement of a complete haematological response. Wang et al15 proved that XIST was highly expressed in acute myeloid leukaemia (AML) bone marrow cells and that silencing XIST could reduce the drug resistance of AML bone marrow cells via downregulation of MYC. However, in light of the aforementioned data, the role of XIST expression in bone marrow niche is not clear; it is noteworthy, that XIST is overexpressed in gliomas compared to normal brain tissues and is related to miR-204-5p downregulation.16 In other human cancers, such as non-small cell lung, cancer breast cancer, pancreatic and gastric cancer, XIST also acts as an oncogene.17 Conversely, in breast cancer, XIST has been found to act as a tumour-suppressor. In this context, our study provided evidence against the hypothesis developed by Yildirim et al regarding the suppressive role of XIST in haematologic malignancies. Here, we demonstrated for the first time that X–inactive specific transcripts were significantly downregulated after introduction of TKI treatment in CML patients. In further analyses compared to diagnosis, the fold change in XIST expression was as follows - at 6-months, XIST expression increased with a fold 0.73 and at 12-month XIST expression slightly decreased with a fold change of -1, 33. We suggest that the potential clinical implications of the results we presented are related to the high level of XIST gene expression at diagnosis and its reduction following treatment. Given the observations of other research teams that have demonstrated that XIST inhibition can reduce the viability and drug resistance of acute myeloid leukemia cells by reducing MYC expression and increasing miR-29a expression.15 Strategies leading to decreased expression of this gene may improve the efficacy of new therapies.
Another significantly upregulated gene at the moment of diagnosis was HIST1H3A (histone cluster 1, H3a gene). Its role in the pathomechanism of CML is unknown, but it seems to play a role in the progression of Fanconi anaemia to acute myeloid leukaemia.18 Of the ten most downregulated genes in the 0-month group compared to the 3-month group, a significant proportion of genes were responsible for forming immunoglobulins. This downregulation trend deepened 6 and 12 months after the initiation of TKI treatment. Our results obtained at the molecular level contradicted clinical observations in which imatinib-treated patients showed a significant decrease in IgA and IgG levels, and dasatinib-treated patients showed decreased IgM levels.19 Then, using a clustering approach, we were able to detect groups of genes that were significantly changed at the assessed time points. The analysis revealed five clusters of differentially expressed genes (DEGs) in all four analysed groups included in the analysis (0, 3, 6 and 12-months). The two clusters presented a similar pattern of dynamics of change over time in patient treatment (Clusters 2 and 3). These clusters comprised genes assigned to corresponding processes involved in cell division, regulation of the cell cycle, cell proliferation and protein phosphorylation. Patients treated with TKIs had significantly lower expression of these genes after 3 months of treatment, resulting in apparent suppression of these processes. Considering the clinical features, this is the period where the most significant reduction of leukocytosis occurs, to achieve a complete haematological response in the vast majority of patients. It is also the time where the most pronounced hematologic toxicity of TKIs is observed, expressed by cytopenias visible in the peripheral blood. At months 6 and 12 of therapy, the expression of these genes increased and reached a level of approximately half the activity compared to that seen at the time of diagnosis. Cluster 1 contained genes involved in processes related to cell immunity: T cell receptor signalling ~GO:0050852, T cell activation ~GO:0042110, T cell costimulation ~GO:0031295, antigen processing and presentation and signalling pathway mediated by interferon gamma ~GO:006033. Interestingly, we observed an increase in the expression of genes grouped in Cluster 1 after 3 months of TKI introduction. The activation of signalling pathways responsible for immunity related to T cells is not reflected in changes in the populations of these lymphocytes. Lu et al demonstrated that during treatment with TKIs, the absolute number of total T cells and CD4+ T and CD8+ T cells was decreased compared with the time of diagnosis.20 Analysis of genes classified in Cluster 5 in the context of biological processes in GO revealed changes in cell immunity mediated mainly by CD8+ T cells and NK cells. In Cluster 5, we observed a renewal of the pathways responsible for T cell receptor signalling ~GO:0050852, positive regulation of natural killer cell mediated toxicity ~GO:0045086, and T cell costimulation ~GO:0031295. The gene expression landscape is consistent with the observations of other authors, as briefly discussed below. It has been well proven that programmed cell death protein 1/programmed death ligand-1 (PD-1/PD-L1), an immune checkpoint regulator, plays a significant negative role, inhibiting the activation, anergy, and eventually causing the apoptosis of T cells. TKIs decrease PD-1 expression levels on CD8+ T cells. PD-1 expression in CD8+ T cells is lower at the time of achieving a complete haematological response than in patients in the chronic phase of CML at diagnosis.21 Importantly, in the aforementioned study, a significant change in PD-1 expression occurred when patients achieved complete haematologic response (CHR). CML-specific cytotoxic T lymphocytes are another population of lymphocytes that increase in parallel to the depth of the molecular response.22 Likewise, the analysis of the expression of analogous signaling pathways in our patient group indicated a similar interaction. Our observations indicate that in Clusters 1 and 5, which contain genes responsible for the immune system, the greatest dynamics of changes occurred during the first three months of treatment. In subsequent observation, gene expression either reached a plateau phase as in Cluster 1 or decreased as in Cluster 5. On this basis, we conclude that the first period of TKI use is the most important for the achievement of immunological effects, and the continued use of TKIs only enhances this effect. Perhaps this observation will be helpful in further research related to TFR. NK cells constitute a significant component of innate immunity, acting against malignant cells by recognizing the downregulation of HLA-class I molecules.23 In vitro studies with immune cell exposure to different TKIs have suggested their immunosuppressive effects on T cell and NK-cell activation.24 In another study, it was demonstrated that all TKIs exert an inhibitory effect on CD56+ cell restoration, and dasatinib reduces the cytolytic activity of NK cells.25 Hughes et al demonstrated an increased number of NK cells with a more mature phenotype, an increased number of CML-specific cytotoxic T lymphocytes, and reduced immune suppressor myeloid-derived suppressor cells (MDSCs) and regulatory T cells (Tregs) in TKI-treated patients compared to time at diagnosis.22 We suggest that the increased expression of genes involved in the positive regulation of NK cell-mediated immunity is involved in the maturation of the phenotype of NK cells during TKI treatment, as previously demonstrated by Hughes.22 An increasing NK cell population is observed in the bone marrow niche during treatment and impacts the clinical response.26 On the other hand, a higher number of NK cells at the moment of TKI discontinuation is a predictive factor for maintaining a response despite treatment withdrawal.24 Similarly, positive changes in humoral immunity were observed in the form of an upregulation of the interferon-gamma production pathway in Cluster 5. As in other clusters, the most important changes in gene expression occurred at 3 months of TKI treatment, and the dynamics of changes in the expression of these genes in the following months were substantially lower. Emerging reports about the combination of TKIs with interferon-alpha suggest not only different sites of action of these drugs but also additional immunomodulatory effects of interferon.27 It has been well documented that interferon pretreatment is significantly associated with the success of imatinib cessation.28 This observation corresponds to the hypothesis of regaining control by the immune system. In the future, it may also lead to the control of a residual clone of leukaemic cells. In summary, in the analysis of global gene expression, we reviewed studies in this field, and we did not find studies with a similar design. We found that Radich et al29 identified genes that can influence CML progression and annotated HIST1H2AE as a “progression” gene. This observation is consistent with ours. We found deregulation of several histone-coding genes, such as HIST1H3A, HIST2H3D, HIST2H2BE, and HIST1H2BF, during treatment with TKIs.
In contrast, the current knowledge of humoral immune response-related molecular events in CML is very limited. MiRNAs, which are 20–22 nucleotide long noncoding RNA fragments, have an impressive regulatory impact on gene expression. The search for markers of various malignancies among miRNAs has continued since their discovery in the 1990s, and it has brought encouraging results.10 MiRNAs that have fundamental regulatory impacts on both innate and adaptive immune cells in health and disease are called “immune-miRs”.10 Immune miRs regulate immune processes as well as central inflammatory signalling pathways. Thus, we analysed the global expression of miRNAs in BM cells from CML patients at different time points during TKI treatment. The miRNA with the highest fold change at diagnosis compared to 3 months of treatment was miR-361-5p. This molecule suppresses angiogenesis by reducing the expression of VEGF-A, and it modulates the inflammatory response by downregulating IL-6 and IL-8 expression.30 Both mechanisms are involved in the pathogenesis of CML; thus, downregulation of miR-361-5p positively correlated with CML treatment. The expression fold change of miR-145-5p was 17 times greater in diagnosis than after 3 months of treatment. This miRNA silences Semaphorin 3A, which acts as a terminator of T and B cells. MiR-145-5p decreases the concentration of proinflammatory cytokines, and this cascade is observed in autoimmune diseases.31 It has also been shown that radiation injury of BM upregulates the expression of the gene encoding Semaphorin 3A, which can negatively regulate vascular recovery following radiation injury.32 In our study, the miRNA expression profile of BM cells revealed significant upregulation of miR-652-3p in naïve CML patients. A similar tendency was observed in bladder cancer tissue, where miR-652-3p promotes the proliferation, migration, and invasion of cancer cells.33 The opposite trend was observed in a cohort of paediatric patients treated for acute lymphoblastic leukaemia (ALL).34 In that study, it was shown that miR-652-3p was downregulated at diagnosis compared with healthy controls, and the level of miR652-3p was restored in complete remission of ALL, negatively correlating with disease severity. However, the BCR/ABL1 rearrangement was rare in the study group and accounted for 2.3%. It was suggested that miR-652-3p may be a potentially useful biomarker for ALL in children, but the clinical usefulness of this miRNA in CML remains to be elucidated. Flamant et al observed increased expression of miR-150 after two weeks of imatinib therapy; the results of our study provided evidence for decreased expression of miR-150 at the time of diagnosis compared to 3, 6 and 12 months of treatment with IM, with the highest fold change of -10.64 at 6 months.35 Several miRNAs may have predictive value. We found that miR-221-3p was significantly upregulated at diagnosis compared to 3-month treatment. It has been also demonstrated that miR-221 is upregulated in CML blast crisis. These observation may suggest its potential role as therapeutic target. When considering different miRNA, our results are in line with previous reports showing that miR-451 can be useful as a diagnostic factor, since we observed downregulation of this molecule at diagnosis compared to 3-month.36
Analysis of functional annotations of differentially expressed miRNAs was assigned to specific biological processes according to the gene ontology (GO) classification (Figure 6). Interestingly, similar to our mRNA analysis, differentially expressed miRNAs were annotated to several immunity-related processes, including the T cell receptor signalling pathway, T cell costimulation, immune response, and inflammatory response. The list of the most up- or downregulated miRNAs detected in our study are specified in Tables 9–11. The list of the most dysregulated miRNAs with their target genes, which are involved in the immune response at diagnosis compared to 3, 6 and 12 months of treatment, is presented in Table 12.
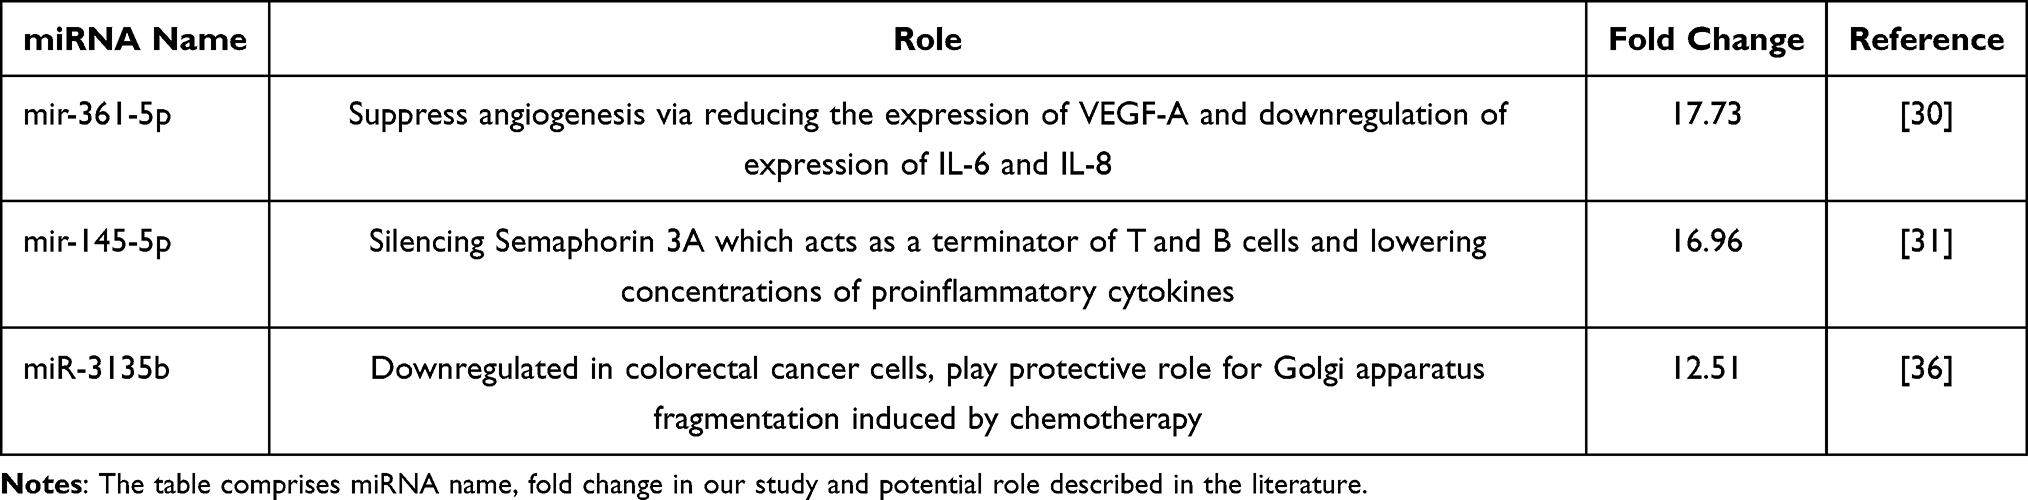 |
Table 9 The List of the Most Upregulated/Downregulated miRNAs in Mononuclear Cells of Bone Marrow in the 0-Month Group Compared to the 3-Month-Group |
 |
Table 10 The List of the Most Upregulated/Downregulated miRNAs in Mononuclear Cells of Bone Marrow in the 0-Month Group Compared to the 6-Month-Group |
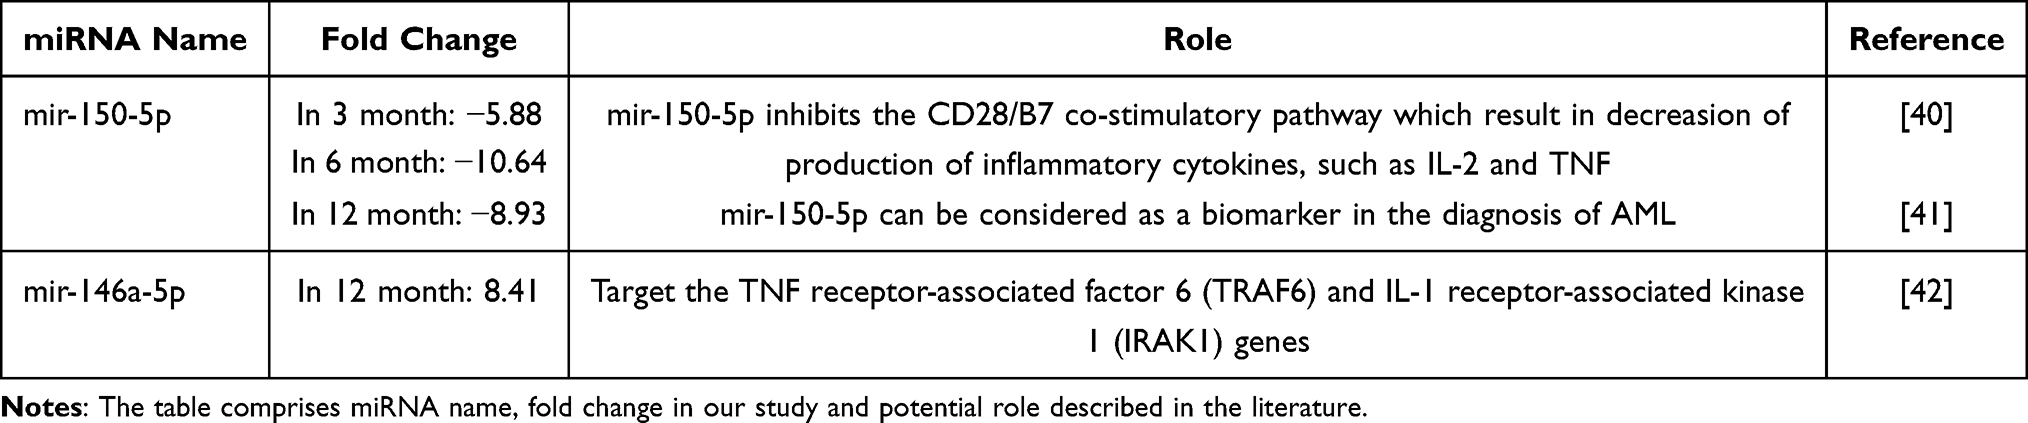 |
Table 11 The List of the Most Upregulated/Downregulated miRNAs in Mononuclear Cells of Bone Marrow in the 0-Month Group Compared to the 12-Month-Group |
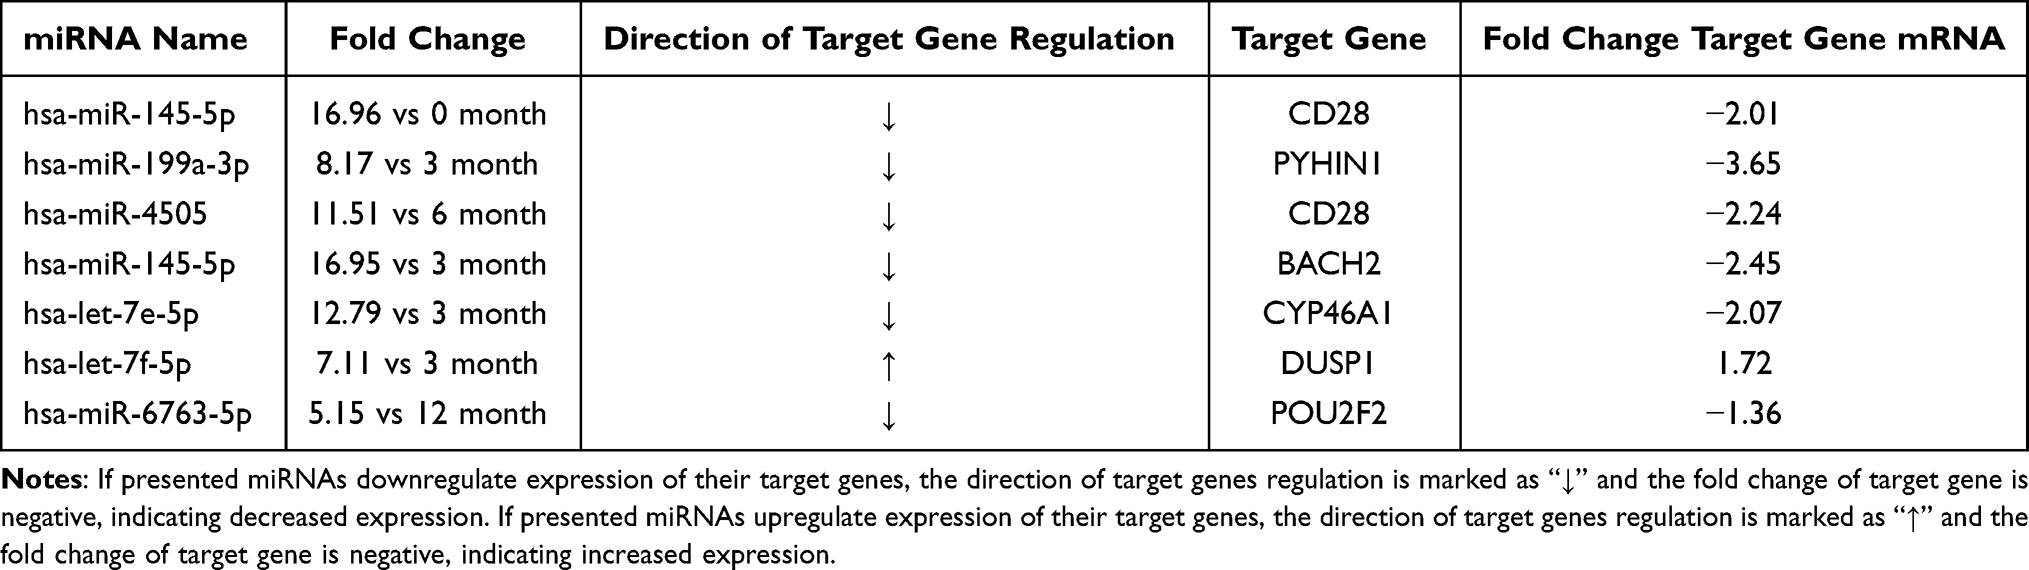 |
Table 12 The List of Most Dysregulated miRNAs with Their Target Genes, Which are Involved in Immune Response at Diagnosis Compared to 3, 6 and 12 Month of Treatment |
Conclusions
Our research provides new data on significant molecular changes in BM cells during TKI treatment in CML patients, using analysis of global expression of RNA as well as miRNAs and their target genes. We observed the greatest changes in gene expression at month 3 compared to diagnosis (0-month), with the XIST gene being the most affected. The extremely high expression of this gene at the time of diagnosis suggests possible implications for future therapies affecting the inhibition of expression of this gene. Cluster analysis revealed downregulation of genes involved in cell proliferation after 3 months of TKI treatment. However, it is more interesting that using this approach, we have demonstrated upregulation of genes responsible for T cell functioning eg, T cell activation, T cell costimulation and antigen processing and presentation. This phenomenon can be interpreted as the gradual renewal of immune system function. miRNAs are being considered as candidates for biomarkers of early response, which is significant for achieving good treatment outcomes. Our results indicate that major changes in the immune system in CML patient occurred in the first three months of treatment with TKIs. We found that miRNAs expression such as miR-361-5p, miR-145-5p, miR-652-3p, are markedly changed during successful TKI treatment. Other findings suggest miR-221 as prognostic factor of the success of therapy. Our results also implied diagnostic relevance of miR-451a in CML. It is possible that the application of our results in the future will be helpful in selecting patients with resistant disease or in predicting the success of the TKI treatment or even treatment discontinuation. However, further research in this interesting field is needed to provide a basis for novel approaches in treatment of this group of patients.
Study Limitations
Although our study provided valuable results, it did have some drawbacks. The first is the small number of samples in the array experiment. Moreover, the experiment was carried out on mononuclear bone marrow cells, thus it remains unknown whether the upregulation of T-cell related gene expression is due to T cell percentage increase in the sample or actual cellular response to TKI treatment. However, the presented study is basic and preliminary in nature, therefore we must be rather cautious when interpreting the obtained data. Further studies are required to fully elucidate the role of immunological pathways in the course of TKI treatment for CML.
Data Sharing Statement
The datasets used and/or analyzed during the current study available from the corresponding author on reasonable request.
Informed Consent Statement
Informed consent was obtained from all subjects involved in the study. Written informed consent has been obtained from the patients to publish this paper.
Institutional Review Board Statement
The study was conducted according to the guidelines of the Declaration of Helsinki, and approved by the Ethics Committee of Pomeranian Medical University (protocol code KB-0012/11/2021, date of approval: 31.05.2021). All procedures followed were in accordance with the ethical standards of the responsible committee on human experimentation (institutional and national) and with the Helsinki Declaration of 1975, as revised in 2008.
Funding
This research received no external funding.
Disclosure
Dr Krzysztof Kozłowski reports grants from Medical Research Agency—Poland, during the conduct of the study. The authors declare no other conflicts of interest in this work.
References
1. Minciacchi VR, Kumar R, Krause DS. Chronic myeloid leukemia: a model disease of the past, present and future. Cells. 2021;10(1):1–23. doi:10.3390/CELLS10010117
2. Steelman LS, Pohnert SC, Shelton JG, Franklin RA, Bertrand FE, McCubrey JA. JAK/STAT, Raf/MEK/ERK, PI3K/Akt and BCR-ABL in cell cycle progression and leukemogenesis. Leukemia. 2004;18(2):189–218. doi:10.1038/SJ.LEU.2403241
3. Castagnetti F, Gugliotta G, Breccia M. The BCR-ABL1 transcript type influences response and outcome in Philadelphia chromosome-positive chronic myeloid leukemia patients treated frontline with imatinib. Am J Hematol. 2017;92(8):797–805. doi:10.1002/AJH.24774
4. Wacław J, Sacha T. Nowe metody diagnostyczne w prognozowaniu i śledzeniu odpowiedzi na leczenie inhibitorami kinaz tyrozynowych przewlekłej białaczki szpikowej. Acta Haematol Pol. 2016;47(2):121–127. doi:10.1016/J.ACHAEM.2016.04.007
5. Bower H, Björkholm M, Dickman PW, Höglund M, Lambert PC, Andersson TML. Life expectancy of patients with chronic myeloid leukemia approaches the life expectancy of the general population. J Clin Oncol. 2016;34(24):2851–2857. doi:10.1200/JCO.2015.66.2866
6. Hochhaus A, Baccarani M, Silver RT, et al. European LeukemiaNet 2020 recommendations for treating chronic myeloid leukemia. Leukemia. 2020;34(4):966–984. doi:10.1038/s41375-020-0776-2
7. Ross DM, Branford S, Seymour JF, et al. Safety and efficacy of imatinib cessation for CML patients with stable undetectable minimal residual disease: results from the TWISTER study. Blood. 2013;122:515–522. doi:10.1182/blood-2013-02-483750
8. Valent P, Sadovnik I, Eisenwort G, et al. Immunotherapy-based targeting and elimination of leukemic stem cells in AML and CML. Int J Mol Sci. 2019;20(17):4233. doi:10.3390/ijms20174233
9. Ureshino H. Treatment-free remission and immunity in chronic myeloid leukemia. Int J Hematol. 2021;113:642–647. doi:10.1007/s12185-021-03117-7
10. Hirschberger S, Hinske LC, Kreth S. MiRNAs: dynamic regulators of immune cell functions in inflammation and cancer. Cancer Lett. 2018;431:11–21. doi:10.1016/j.canlet.2018.05.020
11. Litwińska Z, Machaliński B. miRNAs in chronic myeloid leukemia: small molecules, essential function. Leuk Lymphoma. 2017;58(6):1297–1305. doi:10.1080/10428194.2016.1243676
12. Schraml E, Hackl M, Grillari J. MicroRNAs and toxicology: a love marriage. Toxicol Rep. 2017;4:634–636. doi:10.1016/J.TOXREP.2017.11.001
13. Wutz A. Gene silencing in X-chromosome inactivation: advances in understanding facultative heterochromatin formation. Nat Rev Genet. 2011;12(8):542–553. doi:10.1038/nrg3035
14. Yildirim E, Kirby JE, Brown DE, et al. Xist RNA is a potent suppressor of hematologic cancer in mice. Cell. 2013;152(4):727–742. doi:10.1016/j.cell.2013.01.034
15. Wang C, Li L, Li M, Wang W, Liu Y, Wang S. Silencing long non-coding RNA XIST suppresses drug resistance in acute myeloid leukemia through down-regulation of MYC by elevating microRNA-29a expression. Mol Med. 2020;26(1). doi:10.1186/S10020-020-00229-4
16. Shen J, Xiong J, Shao X, et al. Knockdown of the long noncoding RNA XIST suppresses glioma progression by upregulating miR-204-5p. J Cancer. 2020;11(15):4550–4559. doi:10.7150/jca.45676
17. Yang Z, Jiang X, Jiang X, Zhao H. X-inactive-specific transcript: a long noncoding RNA with complex roles in human cancers. Gene. 2018;679:28–35. doi:10.1016/j.gene.2018.08.071
18. Hou H, Li D, Gao J, et al. Proteomic profiling and bioinformatics analysis identify key regulators during the process from fanconi anemia to acute myeloid leukemia. Am J Transl Res. 2020;12(4):1415–1427.
19. Rajala HLM, El Missiry M, Ruusila A, et al. Tyrosine kinase inhibitor therapy-induced changes in humoral immunity in patients with chronic myeloid leukemia. J Cancer Res Clin Oncol. 2017;143(8):1543–1554. doi:10.1007/s00432-017-2378-6
20. Lu Z, Xu N, Zhou X, et al. Therapeutic immune monitoring of CD4+CD25+T cells in chronic myeloid leukemia patients treated with tyrosine kinase inhibitors. Oncol Lett. 2017;14(2):1363–1372. doi:10.3892/ol.2017.6294
21. Lee MY, Park CJ, Cho YU, et al. Differences in PD-1 expression on CD8+ T-cells in chronic myeloid leukemia patients according to disease phase and TKI medication. Cancer Immunol Immunother. 2020;69(11):2223–2232. doi:10.1007/s00262-020-02617-5
22. Hughes A, Clarson J, Tang C, et al. CML patients with deep molecular responses to TKI have restored immune effectors and decreased PD-1 and immune suppressors. Blood. 2017;129(9):1166–1176. doi:10.1182/blood-2016-10-745992
23. Damele L, Montaldo E, Moretta L, Vitale C, Mingari MC. Effect of tyrosin kinase inhibitors on NK Cell and ILC3 development and function. Front Immunol. 2018;9:2433. doi:10.3389/fimmu.2018.02433
24. Storti F, Rea D, Henry G, et al. Natural killer-cell counts are associated with molecular relapse-free survival after imatinib discontinuation in chronic myeloid leukemia: the IMMUNOSTIM study. Haematologica. 2017;102(8):1368–1377. doi:10.3324/haematol.2017.165001
25. Salih J, Hilpert J, Placke T, et al. The BCR/ABL-inhibitors imatinib, nilotinib and dasatinib differentially affect NK cell reactivity. Int J Cancer. 2010;127(9):2119–2128. doi:10.1002/ijc.25233
26. El Missiry M, Adnan Awad S, Rajala HL, et al. Assessment of bone marrow lymphocytic status during tyrosine kinase inhibitor therapy and its relation to therapy response in chronic myeloid leukaemia. J Cancer Res Clin Oncol. 2016;142(5):1041–1050. doi:10.1007/s00432-015-2101-4
27. Westerweel PE, te Boekhorst PAW, Levin MD, Cornelissen JJ. New approaches and treatment combinations for the management of chronic myeloid leukemia. Front Oncol. 2019;9. doi:10.3389/fonc.2019.00665
28. Saussele S, Richter J, Guilhot J, et al. Discontinuation of tyrosine kinase inhibitor therapy in chronic myeloid leukaemia (EURO-SKI): a prespecified interim analysis of a prospective, multicentre, non-randomised, trial. Lancet Oncol. 2018;19(6):747–757. doi:10.1016/S1470-2045(18)30192-X
29. Radich JP, Dai H, Mao M, et al. Gene expression changes associated with progression and response in chronic myeloid leukemia. Proc Natl Acad Sci U S A. 2006;103(8):2794. doi:10.1073/PNAS.0510423103
30. Xu D, Dong P, Xiong Y, et al. MicroRNA-361: a multifaceted player regulating tumor aggressiveness and tumor microenvironment formation. Cancers. 2019;11(8):1130. doi:10.3390/CANCERS11081130
31. Rezaeepoor M, Ganjalikhani-hakemi M, Shapoori S, et al. Semaphorin-3A as an immune modulator is suppressed by microRNA-145-5p. Cell J. 2018;20(1):113–119. doi:10.22074/CELLJ.2018.4842
32. Chute JP, Termini C, Schlussel L, et al. Inhibition of semaphorin 3A signaling promotes regeneration of hematopoietic stem cells and their bone marrow vascular niche. Blood. 2018;132(Supplement1):1292. doi:10.1182/BLOOD-2018-99-118790
33. Zhu QL, Zhan DM, Chong YK, Ding L, Yang YG. MiR-652-3p promotes bladder cancer migration and invasion by targeting KCNN3. Eur Rev Med Pharmacol Sci. 2019;23(20):8806–8812. doi:10.26355/EURREV_201910_19275
34. Jiang Q, Lu X, Huang P, et al. Expression of miR-652-3p and effect on apoptosis and drug sensitivity in pediatric acute lymphoblastic leukemia. Biomed Res Int. 2018;2018:1–10. doi:10.1155/2018/5724686
35. Flamant S, Ritchie W, Guilhot J, et al. Micro-RNA response to imatinib mesylate in patients with chronic myeloid leukemia. Haematologica. 2010;95(8):1325. doi:10.3324/HAEMATOL.2009.020636
36. Navabi A, Akbari B, Abdalsamadi M, Naseri SS. The role of microRNAs in the development, progression and drug resistance of chronic myeloid leukemia and their potential clinical significance. Life Sci. 2022;296:120437. doi:10.1016/J.LFS.2022.120437
37. Łuczkowska K, Rogińska D, Ulańczyk Z, Paczkowska E, Schmidt CA, Machaliński B. Molecular mechanisms of bortezomib action: novel evidence for the miRNA–mRNA interaction involvement. Int J Mol Sci. 2020;21(1):350. doi:10.3390/ijms21010350
38. Łuczkowska K, Rogińska D, Ulańczyk Z, Machaliński B. Effect of bortezomib on global gene expression in PC12-derived nerve cells. Int J Mol Sci. 2020;21(3):751. doi:10.3390/IJMS21030751
39. Z. yao Zhang, Y. chen Li, C. ying Geng, H. xing Zhou, W. Gao, and W. ming Chen, “Serum exosomal microRNAs as novel biomarkers for multiple myeloma,” Hematological oncologyvol. 37, no. 4, pp. 409417, Oct. vol. 37, no. 4, pp. 409417, Oct. 2019, doi:10.1002/HON.2639
40. H. FayyadKazan et al., “Circulating miR150 and miR342 in plasma are novel potential biomarkers for acute myeloid leukemia,” Journal of Translational Medicinevol. 172, pp. 110, Apr. vol. 172, pp. 110, Apr. 2016, doi:10.1016/J.IMLET.2015.11.001
41. W. Sang et al., “MiR150 impairs inflammatory cytokine production by targeting ARRB2 after blocking CD28/B7 costimulatory pathway,” Immunology lettersvol. 11, no. 1, p. 31, Feb. 2013, doi:10.1186/1479–5876–11–31
42. N. Rusca and S. Monticelli, “MiR146a in Immunity and Disease,” Molecular biology international vol. 2011, pp. 17, Apr. 2011, doi:10.4061/2011/437301
 © 2022 The Author(s). This work is published and licensed by Dove Medical Press Limited. The
full terms of this license are available at https://www.dovepress.com/terms
and incorporate the Creative Commons Attribution
- Non Commercial (unported, 3.0) License.
By accessing the work you hereby accept the Terms. Non-commercial uses of the work are permitted
without any further permission from Dove Medical Press Limited, provided the work is properly
attributed. For permission for commercial use of this work, please see paragraphs 4.2 and 5 of our Terms.
© 2022 The Author(s). This work is published and licensed by Dove Medical Press Limited. The
full terms of this license are available at https://www.dovepress.com/terms
and incorporate the Creative Commons Attribution
- Non Commercial (unported, 3.0) License.
By accessing the work you hereby accept the Terms. Non-commercial uses of the work are permitted
without any further permission from Dove Medical Press Limited, provided the work is properly
attributed. For permission for commercial use of this work, please see paragraphs 4.2 and 5 of our Terms.