Back to Journals » Drug Design, Development and Therapy » Volume 14
Modulation of Drug Release from Natural Polymer Matrices by Response Surface Methodology: in vitro and in vivo Evaluation
Authors Moin A, Gangadharappa HV, Adnan M ![]() , Rizvi SM
, Rizvi SM ![]() , Ashraf SA, Patel M
, Ashraf SA, Patel M ![]() , Abu Lila AS
, Abu Lila AS ![]() , Allam AN
, Allam AN ![]()
Received 4 September 2020
Accepted for publication 28 October 2020
Published 1 December 2020 Volume 2020:14 Pages 5325—5336
DOI https://doi.org/10.2147/DDDT.S279955
Checked for plagiarism Yes
Review by Single anonymous peer review
Peer reviewer comments 5
Editor who approved publication: Dr Tuo Deng
Afrasim Moin,1 Hosahalli V Gangadharappa,2 Mohd Adnan,3 Syed M Rizvi,1 Syed A Ashraf,4 Mitesh Patel,5 Amr S Abu Lila,1,6 Ahmed N Allam7
1Department of Pharmaceutics, College of Pharmacy, University of Hail, Hail, Saudi Arabia; 2Department of Pharmaceutics, JSS College of Pharmacy, JSS Academy of Higher Education and Research, Mysuru, India; 3Department of Biology, College of Science, University of Hail, Hail, Saudi Arabia; 4Department of Clinical Nutrition, College of Applied Medical Sciences, University of Hail, Hail, Saudi Arabia; 5Bapalal Vaidya Botanical Research Centre, Department of Biosciences, Veer Narmad South Gujarat University, Surat, Gujarat, India; 6Department of Pharmaceutics, Faculty of Pharmacy, Zagazig University, Zagazig, Egypt; 7Department of Pharmaceutics, Faculty of Pharmacy, Alexandria University, Alexandria, Egypt
Correspondence: Ahmed N Allam
Department of Pharmaceutics, Faculty of Pharmacy, Alexandria University, Alexandria 21521, Egypt
Tel +20 100 5422491
Email [email protected]
Purpose: The present work aimed at challenging the efficacy of natural gums, karaya and locust bean gum, as matrix-forming polymers for the formulation of sustained-release tablets of diltiazem, a model drug.
Methods: Central design composite was adopted for the formulation and optimization of tablet formulations. The two gums have been selected as independent variables. The dependent factors chosen were the amount of drug released in 1st hour (Y1), amount of drug released after 12 h (Y2), diffusion exponent (Y3), and time for half of the total drug released (T50%) (Y4). Wet granulation approach was used for the formulation of tablets. FT-IR, DSC, in vitro dissolution, swelling-erosion investigations, SEM, and stability studies were carried out.
Results and Discussion: It was evident that the release pattern from the prepared formulations was significantly influenced by the quantity of gum(s) in the tablet. FT-IR and DSC results confirm drug–polymer compatibility. Polynomial equations were used for the prediction of quantitative impact of independent factors at different levels on response variables. After ANOVA analysis, the significant factors were considered for constrained optimization to get the optimized formula. The optimized formula generated by the response surface methodology was evaluated both for in vitro and in vivo properties. The optimized formula and a sustained-release marketed product were subjected to in vivo studies in rabbits and the results of the t-test demonstrated insignificant variation in pharmacokinetic parameters among the two formulations, confirming that the prepared tablet showed sustained-release profile.
Conclusion: The results indicated that karaya and locust bean gum can be effectively used to formulate sustained-release tablets.
Keywords: locust bean gum, karaya gum, diltiazem hydrochloride, response surface methodology, sustained release
Introduction
Oral drug delivery is the most preferred route for drug administration due to cost-effectiveness, convenience and high patient compliance.1,2 Nevertheless, for the treatment of chronic diseases, long-term therapy with multiple doses of conventional formulations is required, which might result in many disadvantages.3,4 Instead, sustained-release formulations has surged to improve the drug therapy by prolonging the duration of action, increasing safety, reducing side effects, reducing dosing frequency and improving patient compliance.5,6 Most prominently, compared to conventional dosage forms, sustained-release dosage forms are designed to maintain a uniform drug plasma concentration, alleviating the fluctuation in the drug plasma concentration and, thereby, ensuring a uniform therapeutic effect.7
Different types of oral sustained-release formulations have been developed to improve drug efficacy and patient compliance.8–10 The introduction of matrix tablets has been considered a breakthrough in the field of pharmaceutical technology. Matrix tablets are widely used for the purpose of sustained release of both water-soluble and insoluble drugs.11,12 The method involves direct compression of a mixture of drug, retardant material (polymer) and additives to formulate a tablet in which the drug is uniformly dispersed into the polymeric matrix.13,14 Alternatively, a drug and polymer blend might be granulated before tablet compression.15 On contact with water, the retardant polymer swells to form a hydrated matrix layer which acts as a barrier against further uptake of water and/or the release of the drug. The drug gets released from matrices by a complex interaction between swelling, diffusion and erosion depending on the nature of the drug.16 For hydrophilic drugs, release is mediated mostly by diffusion mechanism.17 While, in case of hydrophobic drugs, drug release is mediated via a combination of matrix erosion and dissolution.18
The polymeric matrices are generally made up of synthetic, semi-synthetic or natural polymers.19–21 Among them, polymers of natural origin, which are commonly utilized in the cosmetic and food industry, are extensively adopted in pharmaceutical research and are currently used in matrix tablet technology.17,22,23 Polysaccharide gums, including karaya gum and locust bean gum, are one of the natural polymers, which are biodegradable, non-toxic, biocompatible, non-immunogenic and naturally abundant. Karaya gum is a desiccated exudate of the Sterculia urens tree and other species, which belong to the family Sterculiaceae.24 It is a large molecular weight complex polysaccharide that swells in water to yield highly viscous solutions. On hydrolysis, it produces galactose, galacturonic acid and rhamnose. Locust bean gum, also known as algaroba, carob flour, Ceratonia gum, carob bean gum or St. John’s bread, is a galactomannan vegetable gum extracted from the seeds of the locust bean plant.25 It is commonly used as an alternate to tragacanth or other related gums. Due to its viscosity-increasing feature, it is said to be two times more effective than tragacanth and five times more than starch.26 Data regarding the adoption of both karaya gum and locust bean gum for the preparation of sustained-release matrix tablets are few and still under investigation.
The aim of the present study was, therefore, to investigate the efficacy of karaya and locust bean gum as matrix-forming polymers for the formulation of sustained-release tablets of diltiazem (DTZ), a model drug. Central design composite was adopted for the formulation and optimization of tablet formulations. Characterization of the prepared tablets was investigated. The in vitro release pattern of DTZ from natural gum-based matrix tablets was investigated. In addition, the in vivo pharmacokinetics of the formulated matrix tablets was evaluated.
Materials and Methods
Materials
Diltiazem hydrochloride (commercial grade) was obtained from Microlabs (Bangalore, India). Karaya gum and locust bean gum were obtained from Sigma-Aldrich (Germany). All the other chemicals and reagents used in the study were of analytical and pharmaceutical grade.
Methods
Preparation of Tablets
The tablets were prepared by wet granulation using PVPK30 as binder, and the weight was fixed to 250 mg. To maintain tablet weight constant microcrystalline cellulose (MCC) was used as a diluent that does not interfere with the sustained-release properties of the tablet. Magnesium stearate and talc were used as glidant and lubricant, respectively. Tablets were compressed (Rimek mini-press I, Frankfurt, Germany) using 9 mm biconvex shape punches. The formulation recipe of the karaya and locust bean gum matrix tablets are shown in Table 1.
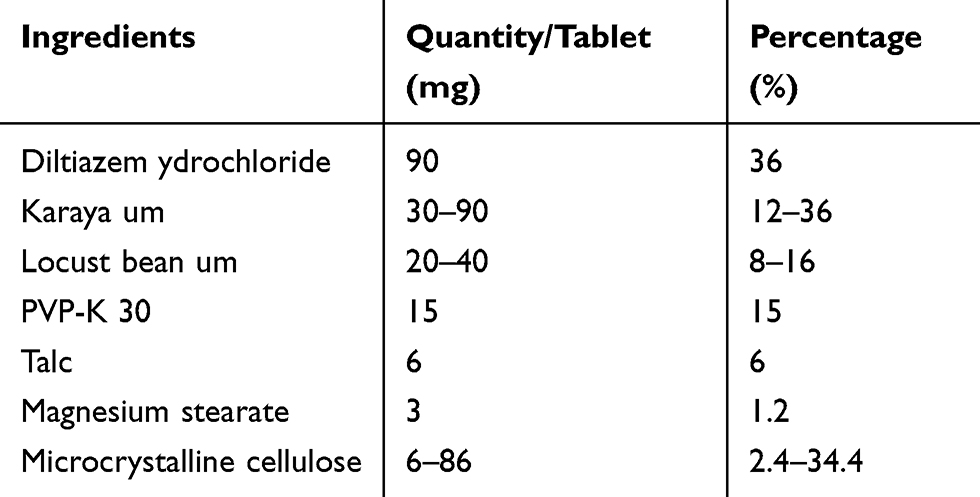 |
Table 1 Model Formula of the Diltiazem Tablet |
Central Composite Design
Response surface methodology was used in this study, and two factors were evaluated, each at four levels. The amount of karya gum and locust bean gum was selected as the independent variables studied at 3 levels. According to the model, it contains four full factorial design points, four axial and three centre points. Table 2 summarizes the 11 trial runs studied and their factor combinations. It also states the translation of the coded levels to the experimental units employed during the study. The percent of drug released in 1 h and 12 h, diffusion exponent (n) and time for 50% of drug release from the tablets (T50%) were taken as response variables Y1, Y2, Y3 and Y4, respectively.
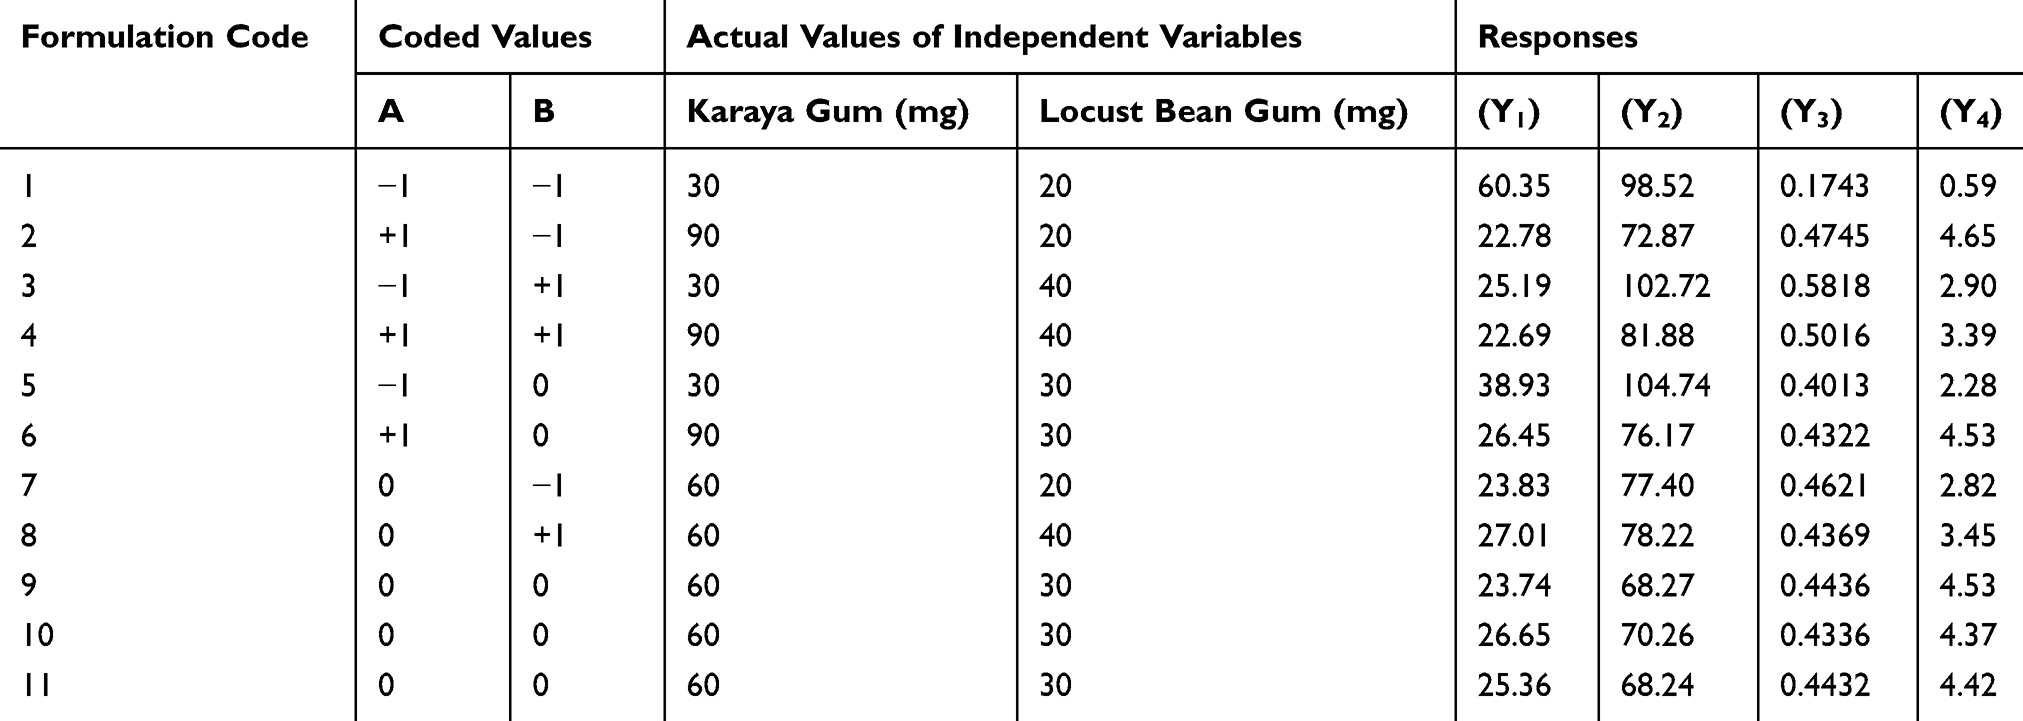 |
Table 2 Experimental Design Matrix of the Central Composite Design with Experimental Results |
Fourier Transform Infrared (FT-IR) Spectrophotometric Analysis
A FT-IR spectrophotometer type FT-IR 8400S (Shimadzu, Japan) was used, and the spectrum was recorded in the wavelength region of 4000–500 cm−1. The procedure consisted of dispersing a sample (DTZ, polymers and prepared formulation) in KBr and compressing into discs by applying a pressure of 5 t for 5 min in a hydraulic press. The pellet was placed in the light path, and the spectrum was recorded. All spectra were collected as an average of three scans.
Differential Scanning Calorimetry (DSC) Analysis
Mettler DSC20 was used for the DSC analysis for DTZ, polymers and the prepared formulation. Pure metal indium was used as a standard for the instrument calibration. Nitrogen atmosphere at a constant heating rate (10°C per minute) was used for obtaining dynamic DSC thermograms.18
In vitro Evaluation of the Prepared Tablets
Hardness
Tablet hardness, defined as the compressional force required to break the tablet, was determined using Erweka hardness tester (Erweka IHT 100, GmbH, Heusenstamm, Germany).
Friability
Roche friabilator (Electrolab, Mumbai, India) was used to estimate the friability of tablets. Here, 10 arbitrarily chosen tablets were weighed and subjected to impact testing at 25 rpm up to 4 min. The percentage of friability was then calculated as follows:
F= (WInitial-WFinal/WInitial) × 100
Weight Variation
The average weight of 20 randomly selected tablets was estimated. The weight variation of each individual tablet was examined regarding standard limits stated in Indian Pharmacopoeia.
Assay
Ten tablets containing DTZ were randomly selected, and the average weight was calculated and powdered. Assay was performed according to the Indian Pharmacopoeia by taking the 100 mg equivalent tablet triturate and consequently diluting by simulated gastric fluid (pH 1.2). The resultant solution was filtered through 0.45 μm membrane filter, and the absorbance was measured spectrophotometrically at 237 nm.27
In vitro Release Profile
USP XXIV, type I apparatus (model TDT-08L, Electrolab, Mumbai, India) was used for in vitro drug release profile estimation.28 The instrument was set up at 37±0.5°C and 100 rpm, for initial 2 h in pH 1.2 (900 mL) buffer followed by pH 7.4 (900 mL) phosphate buffer for a further 10 h. The samples were examined spectrophotometrically at 237 nm for DTZ after diluting it with blank dissolution fluid.
Erosion and Water Uptake Analysis
Erosion and water uptake of the DTZ tablet formulations were estimated under conditions similar to those described for dissolution testing. Water uptake (swelling %) and mass loss (erosion %) was determined gravimetrically according to the following equations:
(%) Swelling = (Ts – T)/T × 100
Where initial tablet wt. is represented as T, and swollen tablet wt. is represented as Ts.
(%) Erosion = (T – Tf)/T × 100
Where initial tablet wt. is represented as T, and tablet wt. after the erosion test is represented as Tf.
Statistical Analysis and Optimization
One-way ANOVA analysis, at 0.05 level, was performed to statistically calculate the impact of independent variables on the response variables. The design was evaluated by the quadratic model equation as follows:
Y= b0 + b1A+ b2B + b3A2 + b4B2 + b5AB
The response values are subjected to multiple regression analysis to find out the relationship between the factors used and the response values obtained. The response values subjected to this analysis were: Y1, the drug % released at first hour; Y2, the drug % released at twelfth hour; Y3, the diffusion exponent (n); and Y4, the time taken for half of the drug release in hours (T50%). The terms b1 to b5 are the coefficients of regression, while b0 is the constant. A and B represent the independent variables, while AB represents the interface terms and demonstrates how the responses change as the two factors change concurrently. A2 and B2 are quadratic terms of the independent variables to evaluate the nonlinearity. The polynomial equation for the response is developed by using regression coefficient of factors, wherein only prominent contributing factors are taken into consideration.
Scanning Electron Microscopy (SEM) Analysis
Scanning electron microscope (JEOL-JSM-840A, Japan) was used to analyse the apparent morphological features of the optimized formulations prior and after 8 h dissolution.
In vivo Pharmacokinetic Study
In vivo study was performed on healthy albino rabbits (2.5 to 3 kg). Animals were kept in cages made of polypropylene having paddy husk bedding material under sterile conditions. Standard food pellets and water ad libitum were given as feed to them. CPCSEA rules were followed for handling and taking care of animals. Prior approval from the Institutional Animal Ethics Committee (IAEC) proposal No. 028, JSS College of Pharmacy, Mysuru, India was received for the animal study. For in vivo study, optimized formulation (product A) and marketed sustained-release tablets (product B), both containing 90 mg of DTZ, were orally administered. Blood samples (500 μL) were withdrawn at different time intervals and plasma concentrations of DTZ quantified by HPLC analysis as described previously.29 Briefly, chromatographic separation was conducted using HPLC (Shimadzu, Kyoto, Japan) equipped with a C18 column (250 mm 3 4.6 mm ID; particle size 5 mm). The mobile phase consisted of a mixture of acetonitrile and water (containing 0.35% trimethylamine, 37:63, v/v). The column temperature was kept at 40°C, and the flow rate was set at 0.95 mL/min. The detection was conducted using a UV-VIS detector at a wavelength of 240 nm. Pharmacokinetic parameters (Cmax, tmax, Kel, t1/2 and AUC0-24h) were estimated from the individual plasma concentrations versus time profiles both the products.
Stability Analysis
Stability analysis was performed on the optimized formulation to evaluate the hardness, physical appearance, drug content and drug release attributes upon storage at 25°C/60% RH and 30°C/66% RH according to ICH Q1A regulations for 6 months with sampling time of 2 months.
Results and Discussion
FT-IR Spectroscopy
DTZ, polymers and prepared formulation were subjected to FT-IR studies, and the spectra obtained are shown in Figure 1. Both DTZ and tablet formulation have shown characteristic peaks at 3433 cm−1 (aliphatic C-H stretching), 2932 cm−1 (O-CH3, C-H stretching), 2388 cm−1 (amine HCl, N-H stretching), 1742 cm−1 (acetate C=O stretching) and 1678 cm−1 (lactam C=O stretching). Results of spectra indicated no new peaks or absence of existing peaks, confirming drug–polymer compatibility.
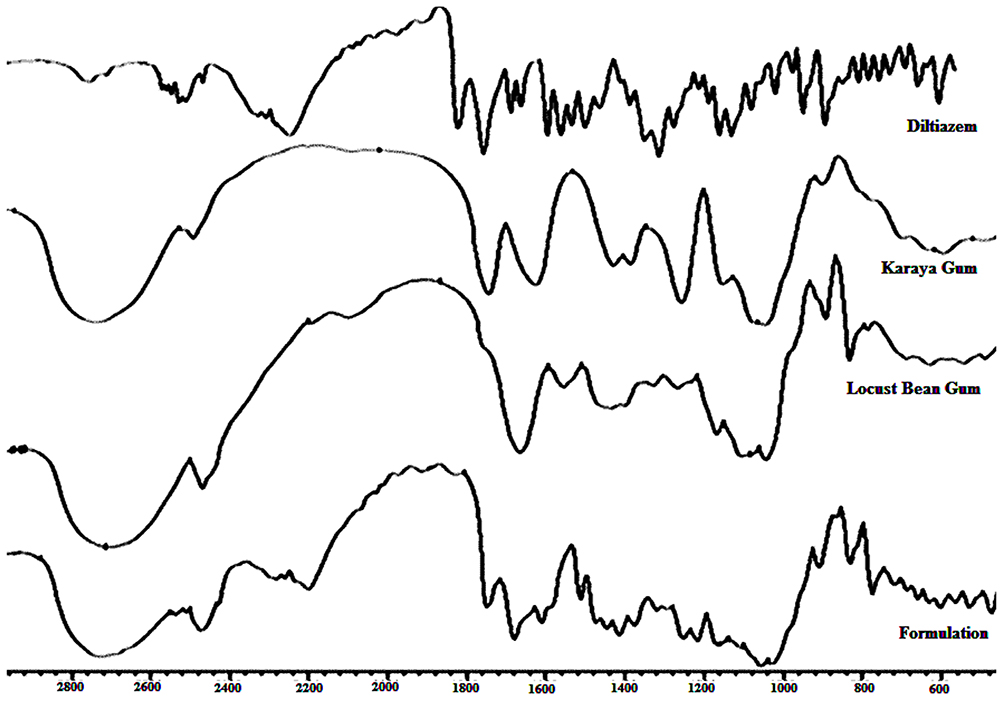 |
Figure 1 FT-IR spectra of diltiazem, locust bean gum, karaya gum and formulation. |
Differential Scanning Calorimetry (DSC)
The DSC thermograms of pure DTZ, polymer and that of the crushed optimized tablet formulation are shown in Figure 2. Pure DTZ showed endothermic peak starting at 180.33°C and ending at 220.25°C, with peak maximum at 214.14°C. Except for the slight shift and the drug peak widening (214.9°C) in the formulation, no other effects were visible, indicating absence of obvious interaction and good drug–polymer compatibility.
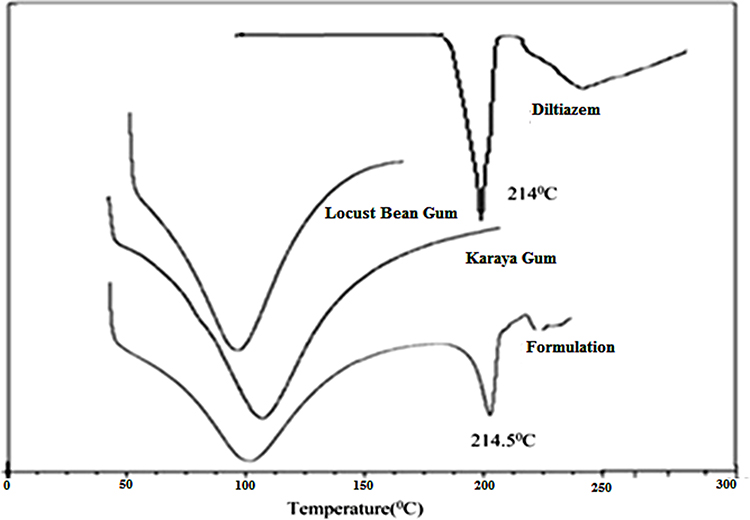 |
Figure 2 DSC thermogram of diltiazem, locust bean gum, karaya gum and formulation. |
Evaluation of the Prepared Tablets
The mean percentage deviation of each formulation (20 tablets) was within ± 5% of the average tablet weight, conforming to BP specification. The content of uniformity of various tablet batches was found to be between 97.6% and 104.61% of the theoretical value. Hardness was observed to be in between 5.34 kg and 6.46 kg, with friability range of 0.24% to 0.68%, which was below specified limit of 1%.
In vitro Dissolution Studies
The cumulative % drug release versus time plot for sustained-release tablet formulations of DTZ prepared using karaya and locust bean gum, as shown in Figure 3, illustrates that initial drug release for the first hour ranged between 22.68% and 60.35% for all the formulations. The drug release from the tablet at the end of 12 h ranged between 68.24% and 102.72%. It was found that with a rise in the total polymer concentrations, the drug release decreased at 1 h and 12 h. Increasing karaya gum concentration remarkably reduced the release rate; on the other hand, the impact of locust bean gum was observed to be antagonistic, which resulted in increased drug release for formulations (F1–F4). The axial point formulations of the design (F5–F8) showed a sustained release towards the end of 12 h except for formulation F5, which showed more than 80% of drug release at the end of 6 h. Most importantly, there was no significant difference in drug release profile for the formulations of three centre points (F9 to F11), demonstrating the well fitness of the data in the model. In addition, it was evident that the release pattern from the prepared formulations was significantly influenced by the quantity of gum(s) in the tablet; as the amount of gum in the matrix increased, there would be a greater degree of gum hydration with concomitant swelling that caused consistent increase in drug diffusion pathlength, which in turn would lead to a remarkable reduction in drug release.30 The incorporation of locust bean gum aided in maintaining a balance between matrix swelling and erosion, modifying the drug release as per the desired requirement. Nevertheless, at a low level of karaya gum, the increase in locust bean gum resulted in faster drug release (F1 and F5). This is because the locust bean gum hastens the swelling followed by erosion, resulting in a burst effect as well as a faster release rate.
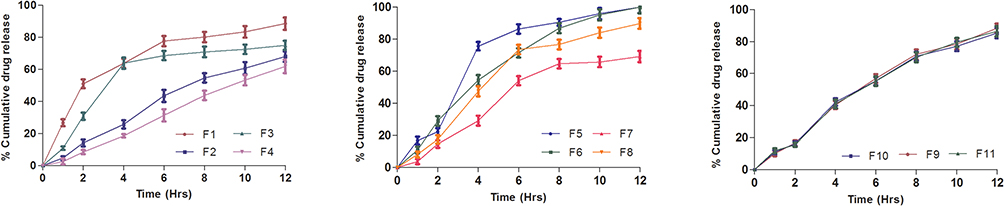 |
Figure 3 In vitro dissolution profile of formulations F1–F4 (Factor points), F5–F8 (Axial points), F9–F11 (Centre points). Each point represents the mean ± SD (n = 3). |
Kinetic Analysis of Dissolution Data
The diffusion exponent values were within the range of 0.17 to 0.581, demonstrating that the drug release followed Fickian to non-Fickian anomalous kinetics depending on gum concentration. High correlation coefficient (R2) value with a good fit in both the Peppas and the Higuchi equations was observed for the release data. However, the Peppas model was the best fit, indicating that the release was directed by both diffusion and erosion.
In vitro Swelling and Erosion Study
The rate of swelling profile, shown in Figure 4, ranged between 28.89% ± 5.3 and 148.26% ± 3.7 at the end of 1st h and between 28% and 286% at the end of 12 h. The erosion presented in Figure 5 was found to be between 7.28% ± 2.8 and 34.21%± 2.7 at the 1st h and between 69% and 100% at the end of 12 h. The rate of swelling was gradual with slower erosion rate in formulations containing a higher concentration of karaya, total blend polymer concentration, and the opposite process was detected as the locust bean gum concentration increased. The formulations containing low total polymer concentration rapidly swelled at 3 h and also showed the highest erosion at the end of the study period in contrast to formulations F2, F4 and F7. This is because they had more karaya gum and overall total polymer concentration.
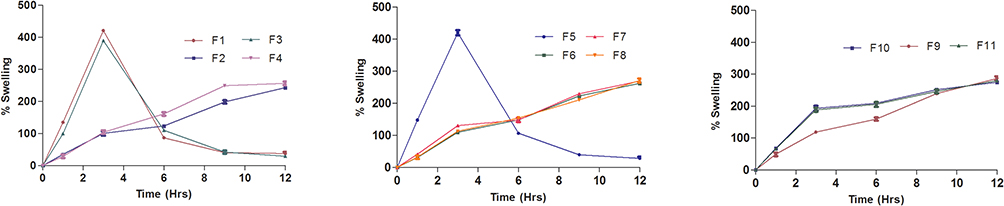 |
Figure 4 In vitro swelling data of formulations F1–F4 (Factor points), F5–F8 (Axial points), F9–F11 (Centre points). Each point represents the mean ± SD (n = 3). |
 |
Figure 5 In vitro erosion data of formulations F1–F4 (Factor points), F5–F8 (Axial points), F9–F11 (Centre points). Each point represents the mean ± SD (n = 3). |
Statistical Analysis Using Central Composite Design Regression Model
DTZ tablets were formulated using a central composite design. Eleven formulations were prepared with the tablet weight fixed to 250 mg. The experimental design summary is shown in Table 2. The percentage cumulative drug release at 1 h (Y1) ranged between 22.68% and 60.35% and at 12 h (Y2) ranged between 68.24% and 104.74% for all formulations. The diffusion exponent (n) values Y3 ranged between 0.17 and 0.58, while T50% (Y4) ranged between 0.059% and 4.65%. To create the polynomial equations, only coefficients that were statistically significant (p<0.05) were involved.
The regression coefficients for each term in the regression model are summarized in the following equations:
Y1 = 30.50–8.14 A – 7.26 B + 7.76 AB
Y2 = 69.74–11.51 A + 3.48 B + 16.48 A2 + 3.39 B2
Y3 = 0.37 + 0.043 A + 0.06 B – 0.05 AB
Y4 = 4.26 + 1.13 A – 0.61 A2 – 0.87 B2 –0.88 AB
Table 3 describes the model parameters affecting the response variables. The two-factor interaction (2FI) model was found to be significant with a probability value of 0.001 indicating adequate fitting for the response Y1. All the variables studied and interaction factors were found to be significant. Among all, factors A and B exhibited a negative effect, and interaction factor AB exhibited a positive effect. The % drug release after 1 h was predominantly dominated by factor A. At a low level of B, as factor A was increased from low to high level, the drug release decrease from 60.353% to 22.782%. At a high level of factor B, drug release did not show any significant change (25.185% to 22.686%). At a low level of A, as factor B was increased from low to high, drug release significantly decreased (60.353% to 25.185%). The release at 1 h was not significantly affected at a high level of A (22.782% to 22.686%). The interaction effect was prominent with 0.0067 probability value, which is shown in the surface response graph in Figure 6A.
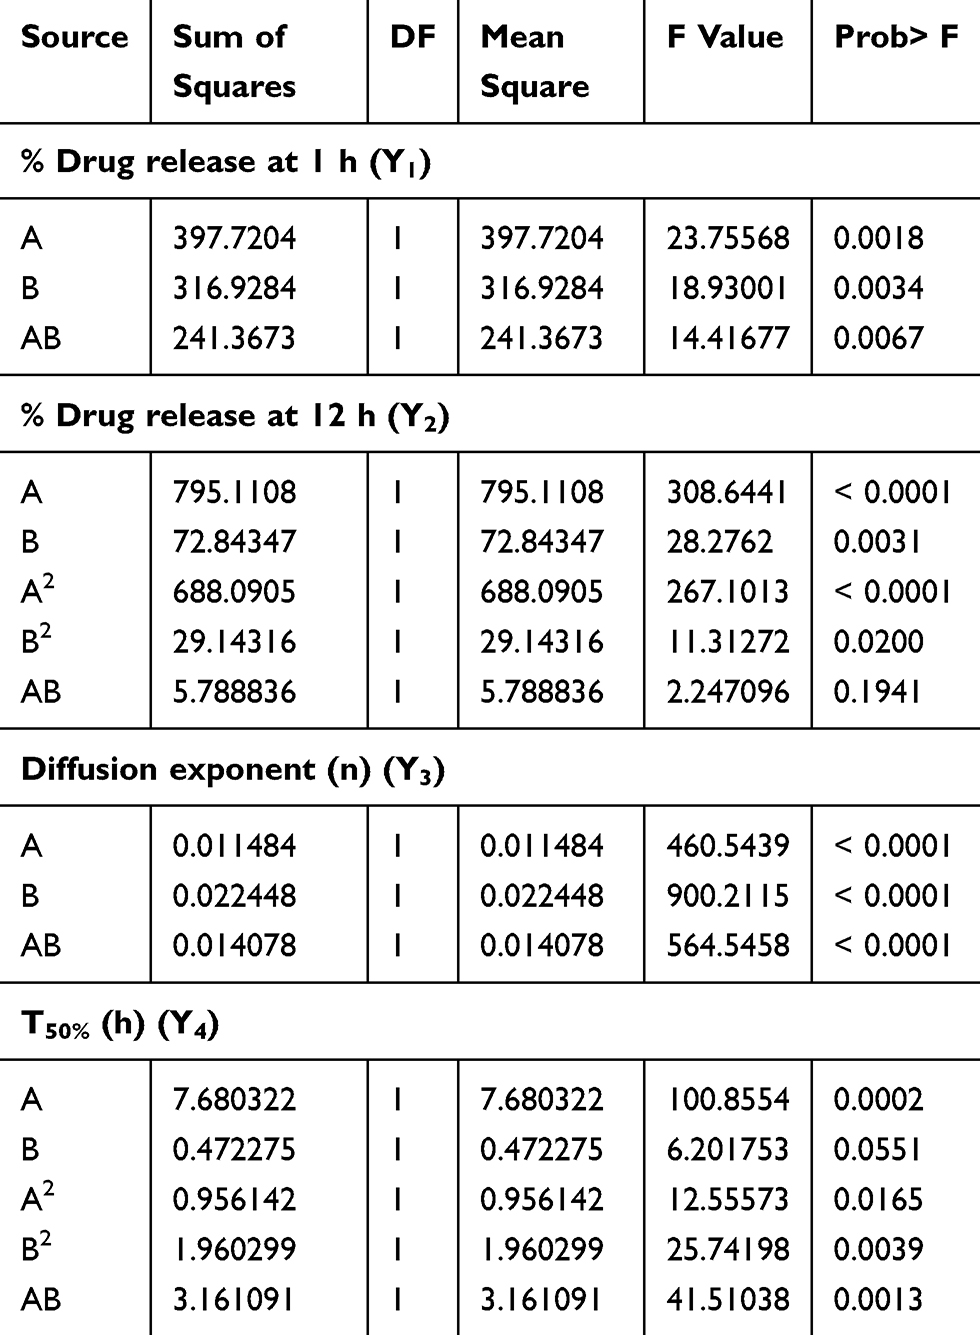 |
Table 3 Model Parameters for the Studied Response Variables |
 |
Figure 6 Response surface graph for the effect of interaction factors AB on (A) release after 1 h, (B) diffusion exponential and (C) T50%. |
The quadratic model showed a good fit for response Y2 with a probability value of less than 0.0001. All the studied variables and their quadratic factors were found to be significant. Factor A exhibited a negative effect, while the other factors exhibited a positive effect. However, the quadratic factor A dominated the response Y2. At a low level of B, as factor A was increased from low to high level, the drug release decreased from 98.52% to 72.87%. At a high level of factor B, with an increase in karaya gum (factor A) from low to high, drug release decreased from 102.7% to 81.88%. At low and high levels of karaya gum, when factor B was increased there was insignificant increase in drug release.
The 2FI model was observed to be significant with less than 0.0001 probability value for the response Y3. For all the studied variables, the linear and interaction factors were found to be significant. Factors A and B exhibited a positive effect, and interaction factors exhibited a negative effect. The diffusion exponent was predominantly dominated by factor B. At a low level of B, as factor A was increased from low to high level, the diffusion exponent augmented from 0.17 to 0.47. However, when the diffusion exponent was studied at a low level of A, as factor B was increased from low to high, the diffusion exponent significantly increased (0.17 to 0.58). The diffusion exponent was not significantly affected at a higher level of A. The interaction effect of factors A and B is significant with a probability value of less than 0.0001 as shown in the response surface graph in Figure 6B.
The quadratic model was found to show a good fit for response Y4 with a probability value of 0.0005. Factor A showed a positive effect while others exhibited a negative effect. Response Y4 was predominantly dominated by the factor A. At a low level of B, as factor A was augmented from low to high level, Y4 significantly increased from 0.59 h to 4.65 h. When the Y4 was studied at a low level of A, as factor B was increased from low to high, T50% increased (0.59 h to 2.9 h). The interaction effect of factors A and B was noteworthy (Figure 6C) with 0.0013 probability value.
Optimization of the Prepared Formulation
Numerical optimization approach with desirability function was applied with certain constraints on the responses (Supplementary Table 1) to generate the optimized formula. The whole experimental domain was scanned for the composition of the optimized formula. Based on the optimization result, one solution was predicted with desired responses as shown in Table 4. The values of response variables of the optimized formula, selected at a desirability of 0.96, were within the desired range.
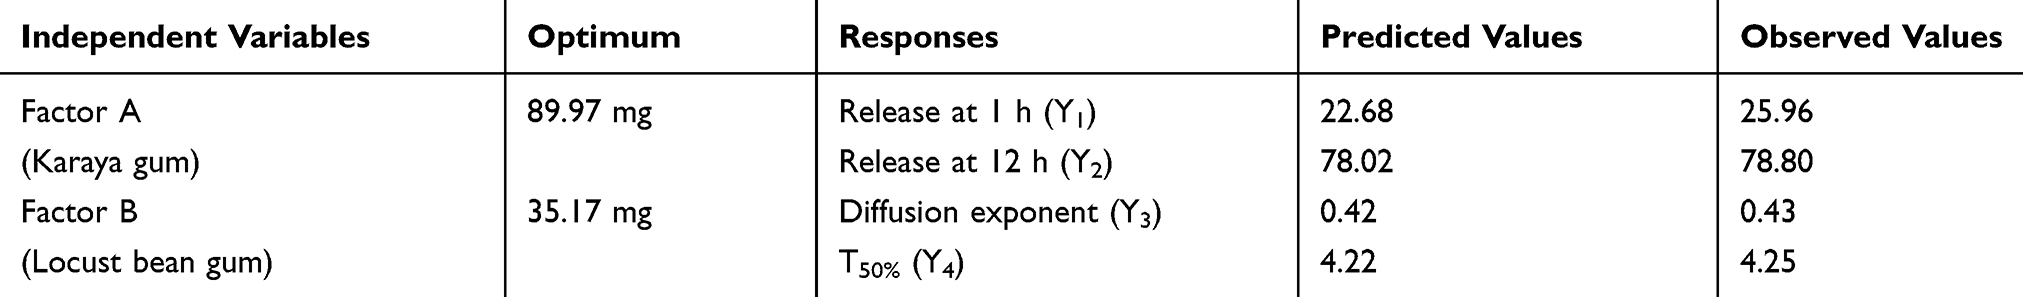 |
Table 4 Comparisons Between Experiment and Predicted Values for the Optimized Formulation |
Characterization of Optimized Formulation
Scanning Electron Microscopy (SEM)
Mechanical interlocking of excipient particles of the tablet with fragile fractures were observed in the SEM images of the dry tablet surfaces when compressed (Figure 7A). In addition, some cracks or dents were also observed in the surface images of the tablet compacts. The surfaces of the tablets upon hydration (Figure 7B) indicated the development of a profoundly membranous permeable structure as a result of the gel layer formed by the polymer relaxation upon water absorption. The surface nature also confirmed that the tablet was showing signs of erosion.
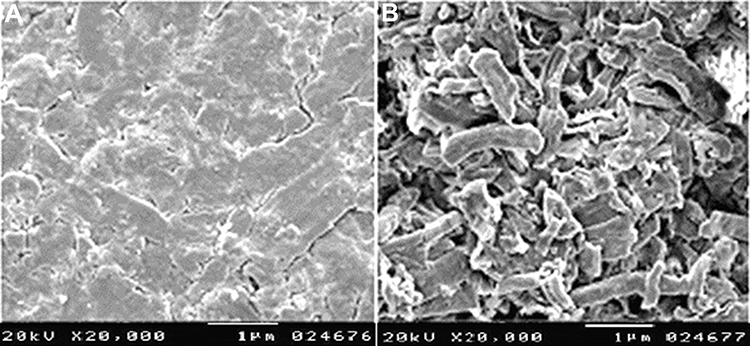 |
Figure 7 Scanning electron microscopy of optimized tablet (A) before and (B) after in vitro dissolution. |
In vitro Release Pattern of the Optimized Formulation
The validation of the chosen optimized formulation using design of experiments (DoE) was performed by in vitro drug release assay. The release profile, represented in Figure 8, showed sustained drug release, with about 78% of the drug released over a period of 12 h.
 |
Figure 8 In vitro drug release of the optimized formulation. Each point represents the mean ± SD (n = 3). |
In vivo Pharmacokinetic Study
The mean drug plasma concentration–time profile of both the optimized formulation (Product A) and the commercial formulation (Product B) following oral administration is depicted in Figure 9. The mean pharmacokinetic parameters of products A and B are summarized in Table 5. Following oral administration, the peak plasma concentration (Cmax) of product A (optimized formulation) and product B (reference marketed formulation) was 583.67±18.45 ng/mL and 607.67±12.86 ng/mL, respectively. The Tmax for reference and test formulations was the same (1.67 h). The observed value AUC0-24h was 5203.75 ± 251.67 and 5975.08 ± 345.35 ng.h/mL for products A and B, respectively. The t1/2 for reference and optimized formulation was found to be 11.00 ± 2.50 h and 12.06 ± 3.59 h, respectively. No substantial variation was found among the reference and the test formulation from t-test (p<0.05) statistical analysis. These results suggest that the optimized formulations showed sustained/extended drug release.
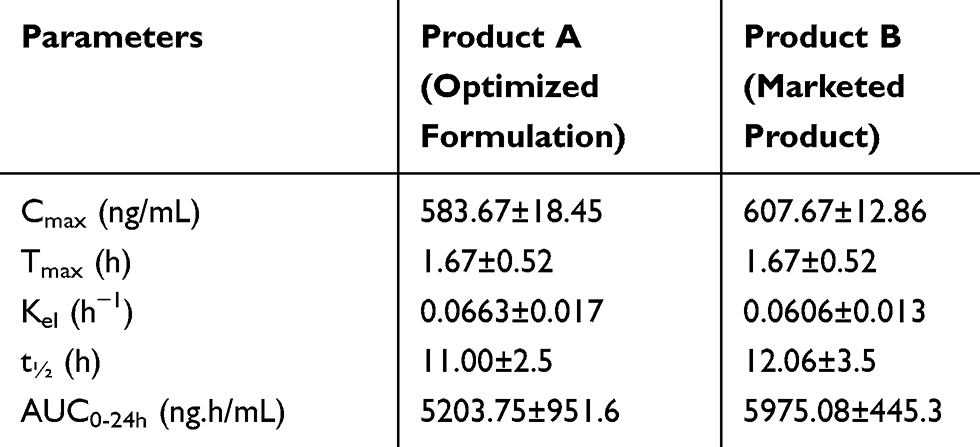 |
Table 5 Statistical Comparison of the Mean Values of Pharmacokinetic Parameters of Products A and B |
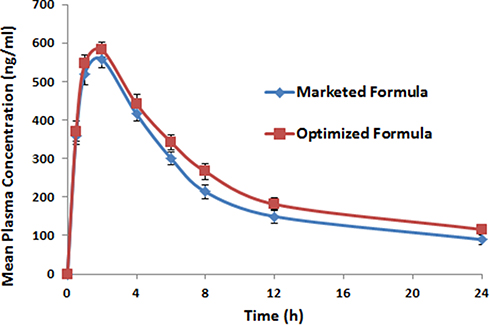 |
Figure 9 Mean plasma concentration of diltiazem of optimized and marketed formula. Each point represents the mean ± SD (n = 3). |
Stability Studies
Stability studies were accomplished for the evaluation of optimized formulation for their physical appearance, hardness, and dissolution profile. The samples were evaluated at 2-month intervals for 6 months. The optimized formulation did not show any significant variation for the evaluated properties except for minute color changes. The paired t-test for drug content and hardness had P-value greater than 0.05, representing no significant change. The dissolution profile of the optimized tablets before the start and the termination of the study period were similar, as shown in Figure 10.
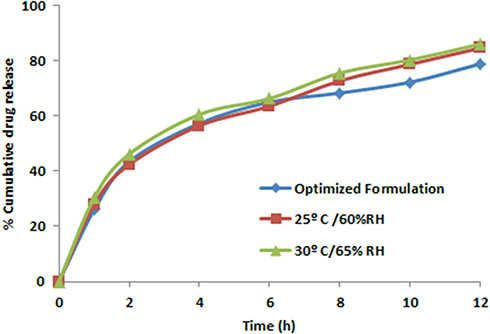 |
Figure 10 In vitro release profile of the optimized formulation at day 0 and 6 months (n=3). |
Conclusion
Matrix tablets of diltiazem HCl were prepared using karaya and locust bean gums as matrix polymers. Response surface design was adopted to evaluate the influence of different formulation parameters on tested variable responses and to optimize the drug release profile. The estimated variable responses of the optimized formulation were in close agreement with the predicted values, confirming that the prepared tablet showed a sustained-release profile. The in vivo pharmacokinetic parameters of both optimized formulation and marketed sustained product did not show any significant difference, indicating sustained plasma concentrations. It can be concluded that a mixture of natural gums can be effectively used for the preparation of sustained-release tablets. Short T50% and higher percentage release of the formulation is likely to improve the drug therapy and eventually prolong the duration of action. However, appropriate balancing between various levels of the two polymers is imperative to acquire desirable controlled-release pattern.This study has successfully shown that natural gums may be potential polymers for the preparation of matrix tablets for achieving the desired drug release pattern.
Acknowledgments
The authors thank JSS College of Pharmacy, JSS Academy of Higher Education and Research, Mysuru for their valuable support to carry out this research.
Disclosure
The authors report no conflicts of interest for this work.
References
1. Bajracharya R, Song JG, Back SY, Han H-K. Recent advancements in non-invasive formulations for protein drug delivery. Comput Struct Biotechnol J. 2019;17:1290–1308. doi:10.1016/j.csbj.2019.09.004
2. Homayun B, Lin X, Choi H-J. Challenges and recent progress in oral drug delivery systems for biopharmaceuticals. Pharmaceutics. 2019;11(3):129. doi:10.3390/pharmaceutics11030129
3. Wen H, Jung H, Li X. Drug delivery approaches in addressing clinical pharmacology-related issues: opportunities and challenges. AAPS J. 2015;17(6):1327–1340. doi:10.1208/s12248-015-9814-9
4. Senapati S, Mahanta AK, Kumar S, Maiti P. Controlled drug delivery vehicles for cancer treatment and their performance. Signal Transduct Target Ther. 2018;3(1):7. doi:10.1038/s41392-017-0004-3
5. Ingersoll KS, Cohen J. The impact of medication regimen factors on adherence to chronic treatment: a review of literature. J Behav Med. 2008;31(3):213–224. doi:10.1007/s10865-007-9147-y
6. Menditto E, Orlando V, De Rosa G, et al. Patient centric pharmaceutical drug product design-the impact on medication adherence. Pharmaceutics. 2020;12(1):44. doi:10.3390/pharmaceutics12010044
7. Sudhir K, Shashank C, Vipin A, Mohammad A. Formulation approaches for sustained release dosage forms: a review. Asian J Pharm Clin Res. 2015;8(5):34–41.
8. Patel P, Dave A, Vasava A, Patel P. Formulation and characterization of sustained release dosage form of moisture sensitive drug. Int J Pharm Investig. 2015;5(2):92–100. doi:10.4103/2230-973X.153385
9. Teaima M, Abdel Hamid MM, Shoman NA, Jasti BR, El-Nabarawi MA. Promising swellable floating bupropion tablets: formulation, in vitro/in vivo evaluation and comparative pharmacokinetic study in human volunteers. Drug Des Devel Ther. 2020;14:2741–2757. doi:10.2147/DDDT.S258571
10. Bhoyar PK, Biyani DM. Formulation and in vitro evaluation of sustained release dosage form with taste masking of metformin hydrochloride. Indian J Pharm Sci. 2010;72(2):184–190. doi:10.4103/0250-474X.65031
11. Nardi-Ricart A, Nofrerias-Roig I, Suñé-Pou M, et al. Formulation of sustained release hydrophilic matrix tablets of tolcapone with the application of sedem diagram: influence of tolcapone’s particle size on sustained release. Pharmaceutics. 2020;12(7):674. doi:10.3390/pharmaceutics12070674
12. Abou Obaid NI, Al-Jenoobi FI, Ibrahim MA, Alam MA. Losartan potassium sustained release pellets with improved in vitro and in vivo performance. Pharm Dev Technol. 2020;28:1–12.
13. Peerapattana J, Laovachirasuwan P, Sodata P, Srijesdaruk V, Otsuka M. Evaluation of using spray-dried glutinous rice starch as a direct compression hydrophilic matrix tablet. Biomed Mater Eng. 2020;31(1):59–72.
14. Awadeen RH, Boughdady MF, Meshali MM. New in-situ gelling biopolymer-based matrix for bioavailability enhancement of glimepiride; in-vitro/in-vivo x-ray imaging and pharmacodynamic evaluations. Pharm Dev Technol. 2019;24(5):539–549. doi:10.1080/10837450.2018.1517366
15. Obeidat WM, Gharaibeh SF, Jaradat AA, Abualsuod O. Preparation and evaluation of ternary polymeric blends for controlled release matrices containing weakly basic model drug. Curr Drug Deliv. 2020. doi:10.2174/1567201817666200731170040
16. Carbinatto FM, de Castro AD, Evangelista RC, Cury BSF. Insights into the swelling process and drug release mechanisms from cross-linked pectin/high amylose starch matrices. Asian J Pharm Sci. 2014;9(1):27–34. doi:10.1016/j.ajps.2013.12.002
17. Simancas-Herbada R, Fernández-Carballido A, Aparicio-Blanco J, et al. Controlled release of highly hydrophilic drugs from novel poly(Magnesium Acrylate) matrix tablets. Pharmaceutics. 2020;12(2):174. doi:10.3390/pharmaceutics12020174
18. Nokhodchi A, Raja S, Patel P, Asare-Addo K. The role of oral controlled release matrix tablets in drug delivery systems. Bioimpacts. 2012;2(4):175–187.
19. Jayasree J, Sivaneswari S, Hemalatha G, Preethi N, Mounika B, Murthy SV. Role of various natural, synthetic and semi-synthetic polymers on drug release kinetics of losartan potassium oral controlled release tablets. Int J Pharm Investig. 2014;4(4):183–188. doi:10.4103/2230-973X.143118
20. Patro CS, Sahu PK. Combined effect of synthetic and natural polymers in preparation of cetirizine hydrochloride oral disintegrating tablets: optimization by central composite design. J Pharm. 2017;17:8305976. doi:10.1155/2017/8305976
21. Omar SS, Roaa AN. Effect of natural and synthetic polymers on the properties of candesartan cilexetil matrix tablet prepared by dry granulation. Asian J Pharm Clin Res. 2016. doi:10.22159/ajpcr.2016.v9s3.14719
22. Abu Fara D, Dadou SM, Rashid I, et al. A direct compression matrix made from xanthan gum and low molecular weight chitosan designed to improve compressibility in controlled release tablets. Pharmaceutics. 2019;11(11):603. doi:10.3390/pharmaceutics11110603
23. Gao P, Meury RH. Swelling of hydroxypropyl methylcellulose matrix tablets. 1. Characterization of swelling using a novel optical imaging method. J Pharm Sci. 1996;85(7):725–731. doi:10.1021/js950458c
24. Verbeken D, Dierckx S, Dewettinck K. Exudate gums: occurrence, production, and applications. Appl Microbiol Biotechnol. 2003;63(1):10–21. doi:10.1007/s00253-003-1354-z
25. Dionísio M, Grenha A. Locust bean gum: exploring its potential for biopharmaceutical applications. J Pharm Bioallied Sci. 2012;4(3):175–185. doi:10.4103/0975-7406.99013
26. Padil VVT, Wacławek S, Černík M, Varma RS. Tree gum-based renewable materials: sustainable applications in nanotechnology, biomedical and environmental fields. Biotechnol Adv. 2018;36(7):1984–2016. doi:10.1016/j.biotechadv.2018.08.008
27. Chaudhary RS, Gangwal SS, Avachat MK, Shah YN, Jindal KC. Determination of diltiazem hydrochloride in human serum by high-performance liquid chromatography. J Chromatogr B Biomed Sci Appl. 1993;614(2):261–266. doi:10.1016/0378-4347(93)80317-W
28. Chavda HV, Patel MS, Patel CN. Preparation and in vitro evaluation of guar gum based triple-layer matrix tablet of diclofenac sodium. Res Pharm Sci. 2012;7(1):57–64.
29. Al-Saidan SM, Krishnaiah YS, Patro SS, Satyanaryana V. In vitro and in vivo evaluation of guar gum matrix tablets for oral controlled release of water-soluble diltiazem hydrochloride. AAPS Pharm Sci Tech. 2005;6(1):E14–21. doi:10.1208/pt060105
30. Laha B, Goswami R, Maiti S, Sen KK. Smart karaya-locust bean gum hydrogel particles for the treatment of hypertension: optimization by factorial design and pre-clinical evaluation. Carbohydrate Polymers. 2019;210:274–288. doi:10.1016/j.carbpol.2019.01.069
 © 2020 The Author(s). This work is published and licensed by Dove Medical Press Limited. The
full terms of this license are available at https://www.dovepress.com/terms
and incorporate the Creative Commons Attribution
- Non Commercial (unported, 3.0) License.
By accessing the work you hereby accept the Terms. Non-commercial uses of the work are permitted
without any further permission from Dove Medical Press Limited, provided the work is properly
attributed. For permission for commercial use of this work, please see paragraphs 4.2 and 5 of our Terms.
© 2020 The Author(s). This work is published and licensed by Dove Medical Press Limited. The
full terms of this license are available at https://www.dovepress.com/terms
and incorporate the Creative Commons Attribution
- Non Commercial (unported, 3.0) License.
By accessing the work you hereby accept the Terms. Non-commercial uses of the work are permitted
without any further permission from Dove Medical Press Limited, provided the work is properly
attributed. For permission for commercial use of this work, please see paragraphs 4.2 and 5 of our Terms.