Back to Journals » International Journal of Chronic Obstructive Pulmonary Disease » Volume 15
Modelling the Cost-Effectiveness of Indacaterol/Glycopyrronium versus Salmeterol/Fluticasone Using a Novel Markov Exacerbation-Based Approach
Authors Lakhotia B, Mahon R, Gutzwiller FS ![]() , Danyliv A, Nikolaev I
, Danyliv A, Nikolaev I ![]() , Thokala P
, Thokala P
Received 24 January 2020
Accepted for publication 30 March 2020
Published 16 April 2020 Volume 2020:15 Pages 787—797
DOI https://doi.org/10.2147/COPD.S247156
Checked for plagiarism Yes
Review by Single anonymous peer review
Peer reviewer comments 2
Editor who approved publication: Prof. Dr. Richard Russell
Bhavesh Lakhotia,1 Ronan Mahon,1 Florian S Gutzwiller,2 Andriy Danyliv,1 Ivan Nikolaev,2 Praveen Thokala3
1Novartis Ireland Limited, Dublin, Ireland; 2Novartis Pharma, Basel, AG, Switzerland; 3PT Health Economics Ltd, Sheffield, UK
Correspondence: Ronan Mahon
Team Head, Patient Access Services Product Lifecycle Services – Novartis Global Service Center Dublin, Vista Building, Elm Park Business Campus, Dublin 4, Ireland
Tel +353873647443
Email [email protected]
Purpose: Exacerbations drive outcomes and costs in chronic obstructive pulmonary disease (COPD). While patient-level (micro) simulation cost-effectiveness models have been developed that include exacerbations, such models are complex. We developed a novel, exacerbation-based model to assess the cost-effectiveness of indacaterol/glycopyrronium (IND/GLY) versus salmeterol/fluticasone (SFC) in COPD, using a Markov structure as a simplification of a previously validated microsimulation model.
Methods: The Markov model included three health states: infrequent or frequent exacerbator (IE or FE; ≤ 1 or ≥ 2 moderate/severe exacerbations in prior 12 months, respectively), or death. The model used data from the FLAME study and was run over a 10-year horizon. Cycle length was 1 year, after which patients remained in the same health state or transitioned to another. Analysis was conducted from a Swedish payer’s perspective (Swedish healthcare costs, converted into Euros), with incremental costs and quality-adjusted life-years (QALYs) calculated (discounted 3% annually).
Results: At all post-baseline timepoints, IND/GLY was associated with more patients in the IE health state and fewer patients in the FE and dead states relative to SFC. Over a 10-year period, IND/GLY was associated with a cost saving of € 1,887/patient, an incremental benefit of 0.142 QALYs, and an addition of 0.057 life-years, compared with SFC.
Conclusion: This Markov model represents a novel cost-effectiveness analysis for COPD, with simpler methodology than prior microsimulation models, while retaining exacerbations as drivers of disease progression. In patients with COPD with a history of exacerbations in the previous year, IND/GLY is a cost-effective treatment option compared with SFC.
Keywords: chronic obstructive pulmonary disease, indacaterol/glycopyrronium, cost-effective, exacerbation, Markov model
Introduction
Chronic obstructive pulmonary disease (COPD) is “a common, preventable and treatable disease characterized by persistent respiratory symptoms and airflow limitation that is due to airway and/or alveolar abnormalities usually caused by significant exposure to noxious particles or gases”.1 The condition is associated with considerable morbidity and mortality, carries a substantial economic burden and represents a major public health concern.2–5 In future years, the burden of COPD is expected to increase as a result of an ageing population and continued exposure to risk factors.1
The natural course of COPD is punctuated by key events known as exacerbations – episodes of acute symptom worsening that may require a change to a patient’s medication.6 Exacerbations result in considerable morbidity and mortality6 and are also key drivers of disease progression.7,8 The Global Initiative for Obstructive Lung Disease (GOLD) notes the importance of considering exacerbations when classifying patients with COPD. In the 2016 GOLD report, a combined assessment of airflow limitation (forced expiratory volume in 1 second [FEV1]), symptoms and exacerbation history was required when determining to which GOLD Group a patient belonged.9 However, in recent updates, airflow limitation has been removed from this assessment (although FEV1 should still be examined at initial diagnosis).1 Instead, symptoms and exacerbation history alone now determine which GOLD Group a patient belong to, and therefore what pharmacotherapy they should receive.1
Inhaled therapies form the cornerstone of pharmacological management of COPD. The combination of a long-acting β2 agonist and a long-acting muscarinic antagonist (LABA/LAMA) is recommended by GOLD as initial therapy in highly symptomatic Group D patients, and as step-up therapy in patients, regardless of ABCD assessment at diagnosis, if symptoms or exacerbations persist despite bronchodilator monotherapy.1 Given the global prevalence of COPD and the scarcity of healthcare resources, it is important to ensure that any recommended treatments demonstrate value for money. Accordingly, over the past 15 years, numerous cost-effectiveness studies of inhaled pharmacotherapies for COPD have been performed.
Many of these studies have utilized a Markov model, whereby individual patients or cohorts of patients progress through different disease states over a series of successive cycles.10–15 Typically, decline in lung function (FEV1) has been used to model changes in disease severity or natural disease progression. However, by modelling only changes in airflow limitation, these studies have limited ability to fully estimate costs and health benefits, as many other factors (eg exacerbations) will influence patient outcomes. To address this limitation, patient-level (or micro) simulation models have been developed, which consider a much broader range of clinical events and complications, such as exacerbations, symptom worsening, pneumonia and changes in health-related quality of life (HRQoL).16–20 Such models include a recent patient-level simulation model that included 14 patient characterstics, seven intermediate outcomes (eg lung function, exacerbations, and pnemonias) and three final outcomes (mortality, quality-adjusted life years [QALYs] and costs), which allowed for evaluation of the effect of treatment for various subgroups of COPD patients.21
Indacaterol/glycopyrronium (IND/GLY) was the first LABA/LAMA combination to be approved for the treatment of COPD and consequently, its cost-effectiveness has been studied extensively,16–19,22,23 including via microsimulation modelling.18,20 In the microsimulation model,20 IND/GLY was shown to be cost-effective compared with the LABA/inhaled corticosteroid (ICS) combination salmeterol/fluticasone (SFC) in patients at risk of exacerbations.20 The incremental costs and incremental QALYs from the model were informed predominantly by exacerbation rates.18,20 However, the microsimulation model is complex relative to other model types, takes a long time to run, and is not easily understood by policy-makers.
We aimed to develop a novel cost-effectiveness model to assess the cost-effectiveness of IND/GLY versus SFC. The model employed a Markov structure and was thus simpler than the microsimulation model described above, but exacerbations were retained as the driver of disease progression. The model was based on clinical data from the FLAME study, which reported the annual rate of moderate and severe exacerbations to be 17% lower with IND/GLY than SFC in patients with a history of moderate exacerbation in the previous year.24 We sought to validate the model by comparing our results to the previously published microsimulation cost-effectiveness analysis,18 which also used data from the FLAME study and used the same inputs20 as our analysis.
Methods
Model Structure
Using insights gained from a review of the literature on COPD modelling, and an in-depth understanding of the microsimulation model previously published,20 a novel Markov model was developed, which can be considered as a simplification of the already-validated microsimulation model.18,20 The model consisted of three defined health states (Figure 1):
- Infrequent Exacerbator (IE): patients who had 0 or 1 moderate/severe exacerbations in the past 12 months;
- Frequent Exacerbator (FE): patients who had 2 or more moderate/severe exacerbations in the past 12 months;
- Death (patients who had died).
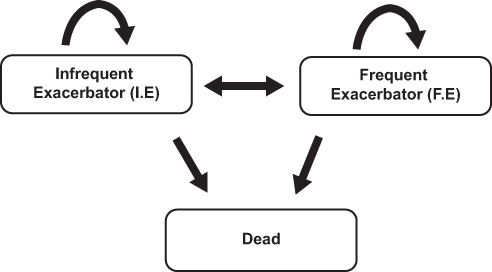 |
Figure 1 Schematic of the model structure used. |
Exacerbations formed the basis of the health states given their importance as drivers of future events25–30 and COPD-related economic costs.31–35 The model was developed using R programming language (RStudio version 1.1.383, R version 3.4.2).
Cycle Length
Each cycle length was 1 year; after which a patient could either remain in the same health state for the next cycle, or transition to one of the other two states. This period was considered appropriate given that COPD is a chronic condition (and thus the health of patients is expected only to decline gradually).
Perspective
The analysis was conducted from a Swedish payer’s perspective, based on costs from the Swedish healthcare system converted into Euros. Only direct costs were included in the analysis.
Treatments
To enable results of our model to be compared with results of a previously validated model,20 we assessed the cost-effectiveness of the treatments IND/GLY and SFC using data from the FLAME study,24 thereby allowing comparability with the analysis reported by Bjermer et al.18
Time Horizon
In line with the analysis by Bjermer et al, the model was run over a 10-year time horizon. Based on the age at baseline from the FLAME clinical data (Table 1), 10 years is approximately equivalent to the remaining expected lifetime of these patients.18
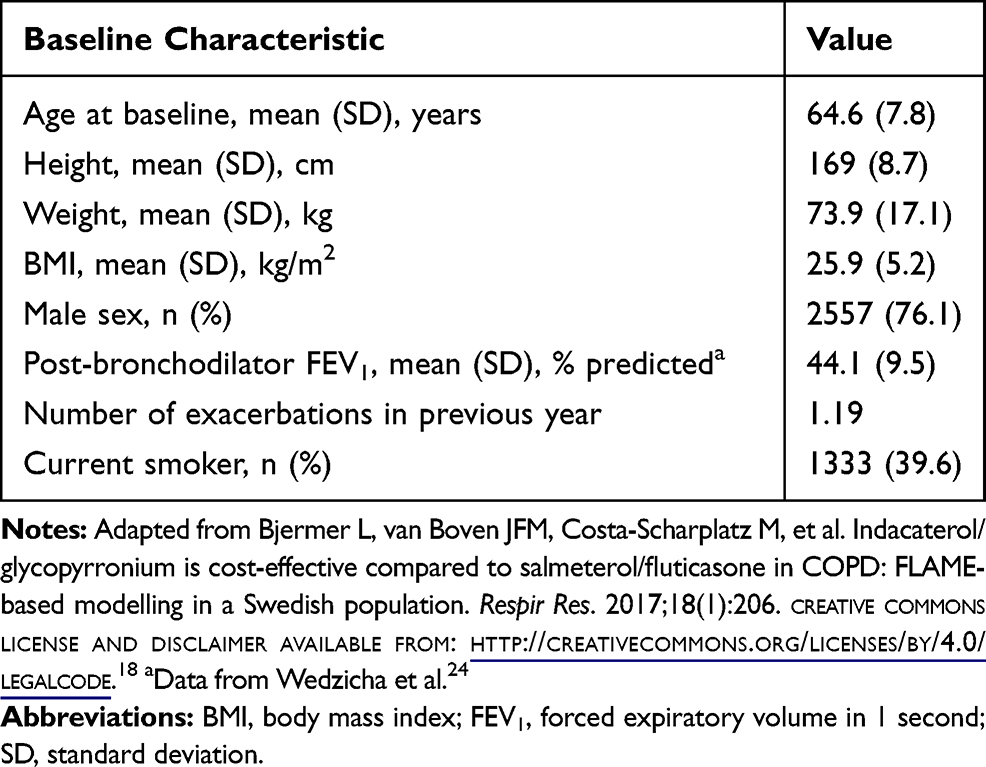 |
Table 1 Baseline Characteristics of the FLAME Study Population |
Model Assumptions
Exacerbation rates varied depending on the disease state and intervention. The number of exacerbations in each cycle was modelled as a Poisson random variable with rate parameter λ and each exacerbation could be either moderate or severe in severity. Consistent with the definitions used in the FLAME study, moderate exacerbations were defined as those leading to treatment with systemic glucocorticoids and/or antibiotics, and severe exacerbations were defined as those leading to hospital admission or an emergency department visit lasting >24 hours in addition to treatment with glucocorticoids and/or antibiotics.24 The model did not consider the effects of mild exacerbations. All transitions from one disease state to another (including death) took place at the end of a cycle.
Patient Population
Data for the simulated cohort were modelled on the mean characteristics of patients participating in the FLAME trial24 (see Table 1 for baseline characteristics of the FLAME population). Accordingly, 80% of the population began in the IE state and the remaining proportion (20%) began in the FE state, as per clinical data from the FLAME trial.24
Model Inputs
Clinical parameter model inputs were as follows (Table 2).
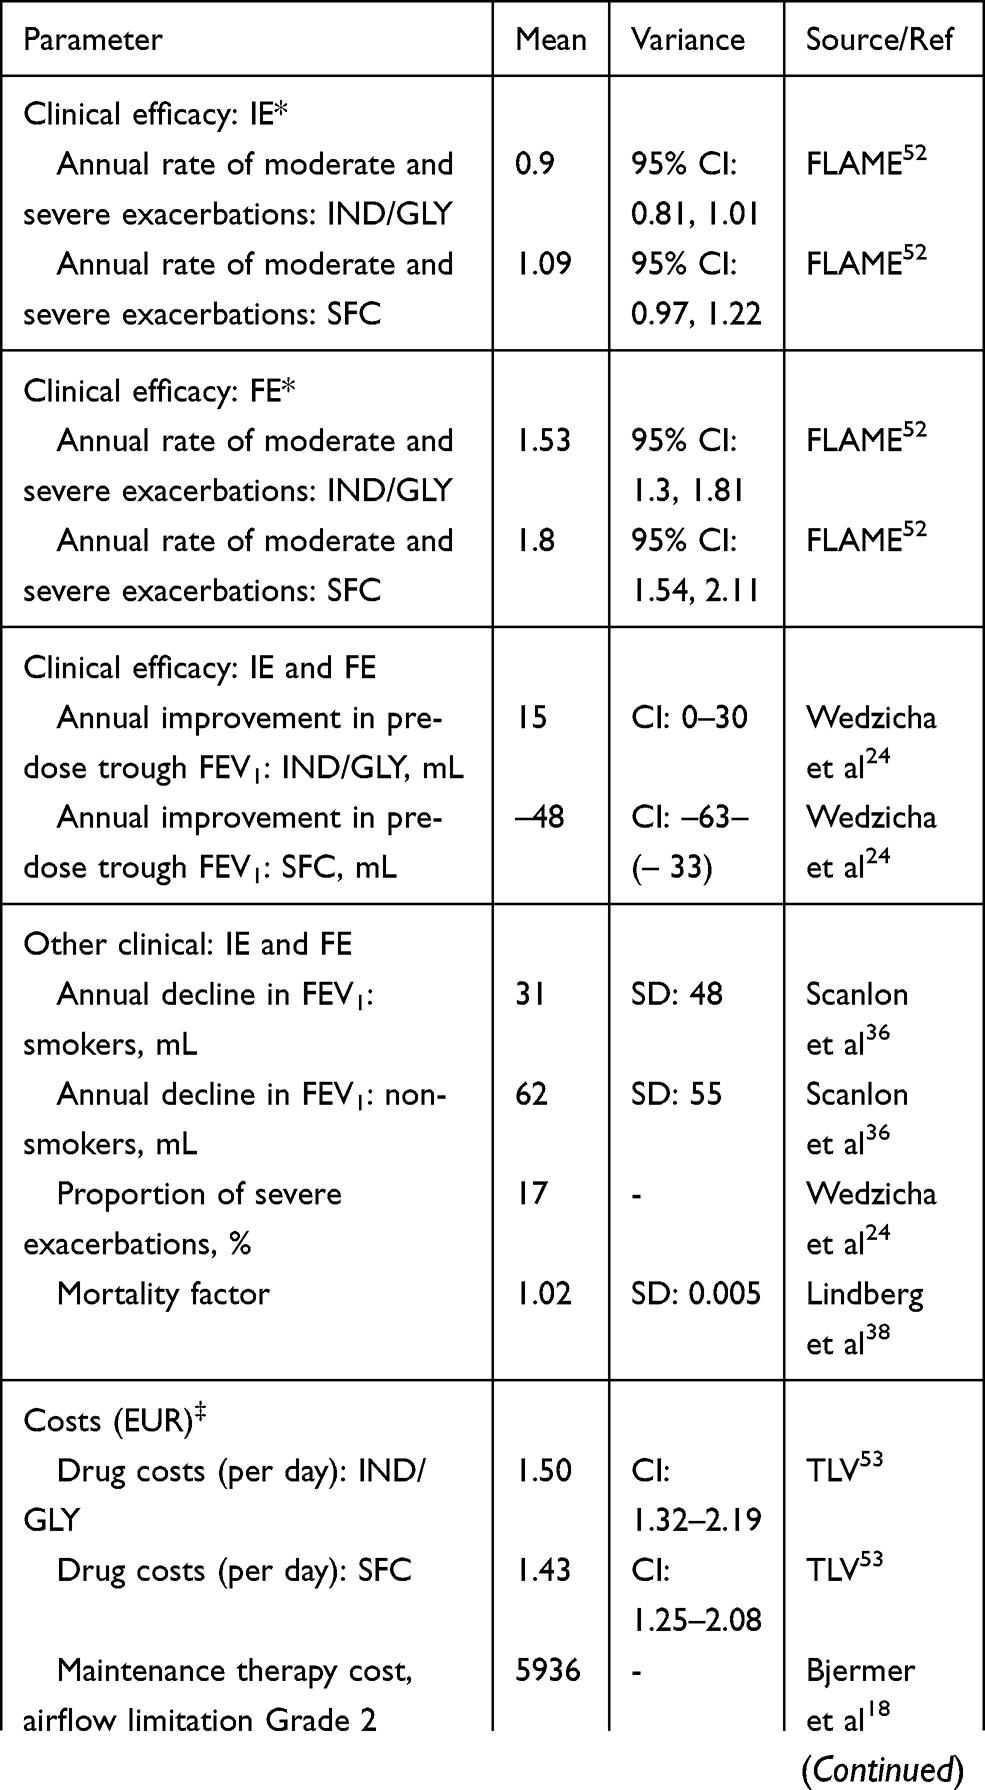 |
Table 2 Model Inputs |
Effectiveness
Effectiveness inputs for both treatment groups were based on clinical data from the FLAME trial.24 Effectiveness was represented by both moderate/severe exacerbations and lung function (FEV1) decline. Exacerbations were modelled via the treatment-specific exacerbation rates associated with each state and the consequent transitions between the IE and FE states. These treatment-specific rates were derived from the FLAME trial reports. The model used was a generalized linear model assuming a negative binomial distribution with fixed effects of treatment, baseline total symptom score, baseline COPD exacerbation history (1 moderate/severe exacerbation, ≥2 moderate/severe exacerbations in the prior year), smoking status at screening, ICS use at screening, and airflow limitation. The specific values of the annual exacerbation rate and the respective confidence interval are given in Table 2.
Exacerbations rates for patients in the IE health state were based on rates for patients who had experienced only one exacerbation in the year prior to enrollment in FLAME, whereas exacerbation rates for patients in the FE health state were based on rates for patients who had experienced more than one exacerbation in the year prior to enrollment. For patients in the IE health state, this was equivalent to 0.90 (IND/GLY cohort) and 1.09 (SFC cohort) exacerbations per year. For patients in the FE health state, this was equivalent to 1.53 (IND/GLY cohort) and 1.80 (SFC cohort) exacerbations per year.
The model assumed a Poisson distribution for exacerbation rates to estimate the transition probabilities between the health states (Supplementary Appendix Table S1 and S2), eg the proportion of patients estimated to experience 2 or more exacerbations in the IE health state who would be assumed to transition to the FE health state. The probability of any exacerbation being severe was assumed to be 0.17 irrespective of the health state (IE or FE), treatment type (IND/GLY or SFC) and patient characteristics (eg age, gender, FEV1 status), based on the FLAME study data.24
In each treatment cohort, FEV1 status was calculated based on observed values from the FLAME trial.24 In each cycle, it was assumed that FEV1 would decline by a fixed amount, irrespective of health state or treatment group. Annual lung function deterioration rates were taken from a previously published study.36
New Global Initiative for Chronic Obstructive Lung Disease (GOLD) grades for airflow limitation were determined at the end of each cycle. A one-off FEV1 treatment effect of +15 mL (95% confidence interval [CI], 0 to 30 mL) for IND/GLY and −48 mL (95% CI, −63 to −33 mL) for SFC was included at the beginning of the model and added to each patient’s FEV1 status (described below and later) before the cycle began (ie no further FEV1 benefit was assumed beyond this point).
Mortality
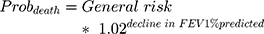
All-cause mortality data were based on Swedish national life expectancy tables life tables generated during the 2015 period.37 Excess mortality due to COPD was modelled on data from the Obstructive Lung Disease in Northern Sweden study.38 One of the models from this study linked the hazard ratio (HR) for death with the extent of FEV1 improvement/deterioration and predicted an HR of 0.98 for a unit increase in % FEV1 predicted.38 The inverse of this HR was thus used to predict the excess mortality in the COPD population of our model, as illustrated by the following equation:
Health-Related Quality of Life (HRQoL) and Life-Years
HRQoL values were based on regression equations published previously (Supplementary Appendix Section 1).39 These took into account gender; body mass index; % FEV1 predicted; and the number of emergency room visits in the last year, hospital admissions in the last year, and concomitant diseases.39
Costs
For each GOLD grade of airflow limitation, the following costs were included: mean costs for each moderate or severe exacerbation, annual costs of maintenance therapy, and daily drug costs for IND/GLY and SFC. Daily drug costs were derived from the Swedish Pharmaceutical Benefits Agency (TLV), while an analysis of economic burden in the ARCTIC study was used to source maintenance and exacerbation costs.40 A key benefit of using these data is that costs were reported per moderate exacerbation, per severe exacerbation, and per maintenance therapy. Average costs for moderate and severe exacerbations included: COPD-related or -unrelated costs, drug costs, outpatient/inpatient costs, and primary care costs, as well as costs relating to hospitalization in a secondary care center and/or emergency visits for severe exacerbations only, within 14 days after occurrence of an exacerbation event.40
Discounting
As per guidelines for health technology appraisals,41 the same annual rate of discounting was applied to costs and benefits. In our model, costs and benefits were both discounted annually at a rate of 3%.
Model Outputs
The model estimated the incremental costs and the incremental benefit between the target treatment (IND/GLY) and SFC. Benefit was expressed in terms of quality-adjusted life-years (QALYs).
Sensitivity Analyses
Two sensitivity analyses were performed to account for uncertainties in the costs and benefits model parameters.
Deterministic (One-way) Sensitivity Analysis
While maintaining all other model parameters at their baseline values, an individual model parameter was adjusted by ± 25% (ie to 75% and 125% of its base value) and the resulting incremental costs and incremental QALYs noted. This process was repeated for all model parameters, except for discounting rate, which was varied between 0% and 5% per annum (base value 3%).
Probabilistic Sensitivity Analysis (PSA)
For the PSA, input parameters were characterized as statistical distributions to reflect uncertainty around the point estimates. Distribution assumptions for the parameters that are varied in the PSA are described in Table 2. A total of 10,000 simulations were run, sampling random values of the parameters from those distributions. For each of the probabilistic draws, the results of the model were recorded and used to plot the cost-effectiveness planes, with incremental QALYs on the x-axis and incremental costs on the y-axis.
Results
Health State Transitions
At all post-baseline timepoints across the 10-year horizon, IND/GLY was associated with a greater proportion of patients in the IE health state and a lower proportion of patients in the FE and dead health states relative to SFC (Figure 2). With both interventions, the proportion of patients in the IE health state decreased over time, with the decline more pronounced for SFC than IND/GLY. Correspondingly, the proportion of frequent exacerbators initially increased with both IND/GLY and SFC, with a greater magnitude of increase with SFC relative to IND/GLY, which is as expected given the progressive nature of COPD. Following this initial increase, the proportion of patients in FE health state gradually declined with both interventions, reflecting patient deaths.
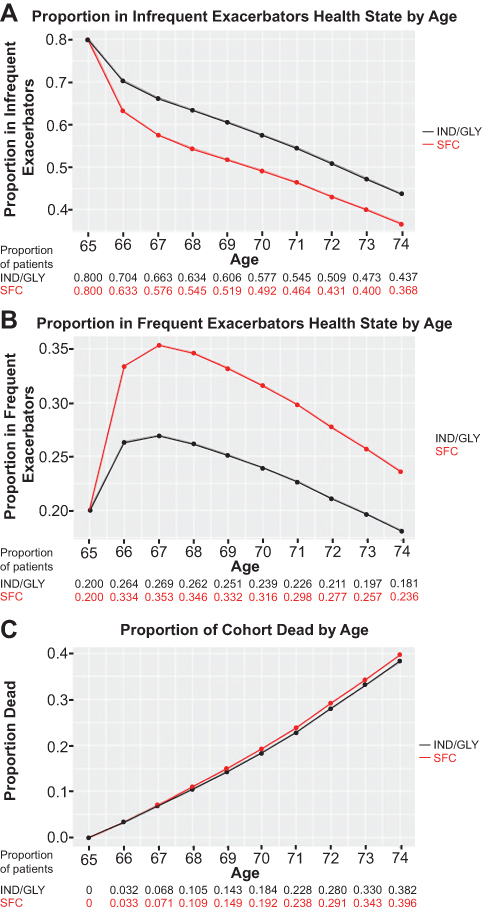 |
Figure 2 Proportion of patients in each health state over 10-year time horizon* with indacaterol/glycopyrronium or salmeterol/fluticasone treatment. Notes: (A) Infrequent Exacerbators; (B) Frequent Exacerbators; (C) Dead. *Data modelled on the mean characteristics of patients participating in the FLAME trial,24 in which mean patient age at baseline was 65 years. Abbreviations: IND/GLY, indacaterol/glycopyrronium; SFC, salmeterol/fluticasone. |
Costs and Benefits
In every cycle, discounted costs were lower with IND/GLY than with SFC (Figure 3A). Differences in cost between IND/GLY and SFC increased in the first year and then gradually decreased, reflecting the greater prevalence of death with time in the SFC group (no costs were associated with the “dead” health state). Relative to SFC, IND/GLY provided additional discounted QALYs, with the difference between IND/GLY and SFC remaining relatively constant across the 10-year period (Figure 3B). A small difference between IND/GLY and SFC in discounted life-years emerged over time, in favor of IND/GLY, reflecting greater mortality in the SFC group (Figure 3C). Across the 10-year time horizon, IND/GLY was associated with a cost saving of €1,887 per patient, an incremental benefit of 0.142 QALYs, and an addition of 0.057 life-years, compared with SFC. IND/GLY “dominated” SFC meaning that it was both less costly and more effective.
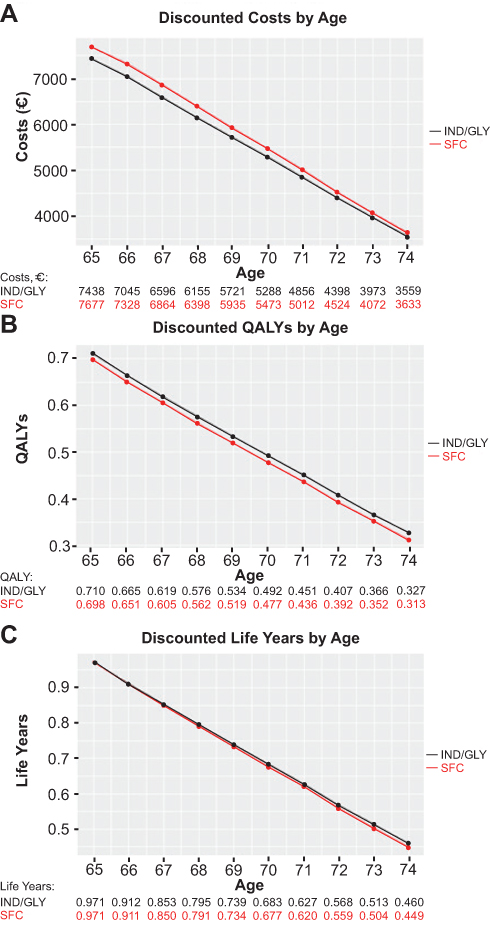 |
Figure 3 Discounted costs. Notes: (A), quality-adjusted life years (B) and life years (C) per patient over 10-year time horizon* with indacaterol/glycopyrronium or salmeterol/fluticasone treatment. *Data modelled on the mean characteristics of patients participating in the FLAME trial,23,24 in which mean patient age at baseline was 65 years. Abbreviations: IND/GLY, indacaterol/glycopyrronium; QALYs, quality-adjusted life years; SFC, salmeterol/fluticasone. |
Sensitivity Analyses
The deterministic sensitivity analysis indicated that across the 10-year time horizon, the model is least sensitive to changes in discount rate and maintenance cost, and most sensitive to changes in exacerbation rates with IND/GLY and SFC. For the PSA results for both cost-effectiveness and cost-utility, 5,821 (60%) out of the 10,000 sample points fell in the quadrant representing reduced cost and increased effectiveness/utility, indicating consistent dominance of IND/GLY over SFC for the majority of sample points even when parameter uncertainty was included in the model (Supplementary Appendix Figure S1). The remaining 4,179 samples were within the quadrant representing increased cost and increased effectiveness/utility. The cost-effectiveness acceptability curve indicated that there was little uncertainty that IND/GLY was more cost-effective than SFC (Supplementary Appendix Figure S2).
Discussion
Herein, we have described the development of a novel cost-effectiveness simulation in patients with COPD using Markov modelling based on clinical data from the FLAME study.24 When the cost-effectiveness of IND/GLY and SFC was compared using the new model with a 10-year time horizon, IND/GLY was found to dominate SFC by providing greater benefits at a lower cost. IND/GLY was associated with reduced cost and increased QALYs compared with SFC at all timepoints across the 10-year period, demonstrating both short-term and long-term advantages with IND/GLY over SFC. Sensitivity analyses demonstrate that the Markov model used is particularly sensitive to changes in exacerbation rates, as would be anticipated given that it was designed to include exacerbations as the primary driver of disease progression. In the PSA, almost 60% of the 10,000 sample results generated were concordant with IND/GLY dominating SFC, indicating that the results were consistent even when parameter uncertainty was included in the model.
The magnitude of the cost-effectiveness benefit of IND/GLY over SFC observed using the Markov model described in this paper was broadly consistent with the benefit reported from the previously reported microsimulation cost-effectiveness model.18,20 In the microsimulation model, over a 10-year time horizon, the cost saving per patient for IND/GLY versus SFC was €1,654;18 a comparable amount to the €1,887 saving calculated in the present analysis. Incremental life-years per patient with IND/GLY versus SFC over this time period were also similar in the two models (0.057 for Markov model and 0.055 for microsimulation model18). Incremental QALYs with IND/GLY versus SFC were greater in the present analysis (0.142 per patient) than in the prior microsimulation model (0.047 per patient18). Our present analysis accounts for exacerbation history, meaning that our model included worse long-term consequences of unmanaged exacerbations than previous models, which led to a bigger QALY differential.
During the development of this new Markov model, there were some assumptions and limitations that may have influenced outputs. These issues, which need to be considered when interpreting the results of our work, are discussed below.
Structural uncertainty in cost-effectiveness modelling. Choices need to be made about the structure and functional form of the model during the conceptualisation of the model, which in turn may affect the model outputs. However, there is currently a lack of clarity about how to deal with structural uncertainty in guidelines developed by national funding bodies. The present model was primarily based on the number of moderate/severe exacerbations in the prior 12 months, which is not the sole predictor of future exacerbation risk. The FEV1 was also incorporated into the model but not as a marker of disease status, as was the case with previous cost-effectiveness models.18,20 The justification for this new approach comes mainly from the GOLD report, which elevates the importance of considering exacerbations when classifying patients with COPD.1 Further, evidence suggests only a weak correlation between FEV1 decline and exacerbation risk,1 with the greatest single predictor of exacerbation risk being exacerbation history.25–30 In a previous report, it was found that 50% mortality at 5 years after one hospitalization due to COPD exacerbation.42 Therefore, combining severe and moderate exacerbations may influence the overall outcomes of this model. Nevertheless, the exacerbation rates used within the model differed only by health status and treatment group and remained constant over the model time horizon, whereas rates are likely to be influenced by other factors and may change over time. However, this approach has been used previously,20 and the new model provides additional granularity by basing exacerbation rate on exacerbation history. Exacerbation rate data for the IE health state (defined as patients with 0 or 1 moderate/severe exacerbations in the past 12 months) were based on data from the subgroup of patients in the FLAME study who had experienced one documented moderate/severe exacerbation in the previous year, as the study excluded patients who had experienced no exacerbations in the prior year. As such, patients with no exacerbations were not used for the rate estimate for the IE group, and the exacerbation rate within the IE state is, therefore, likely to have been overestimated. With regard to lung function, the model used an FEV1 treatment effect at the beginning of the model only, which could be considered a conservative assumption, and the negative treatment effect for SFC could be considered an overestimate. The model also assumed a constant annual FEV1 decline, which was same for both treatment groups, whereas FEV1 decline may depend on various patient characteristics such as age, exacerbation status, and treatment. However, as discussed, these approaches have been used previously20 and were replicated in the current model for ease of comparison. The probability of death was modelled on FEV1% predicted and relative risk versus general population mortality, whereas other factors such as age, sex, exacerbation status and treatment may also have an impact.
Most of the inputs for our model are based on the parameters used in the previous microsimulation model.18 This brings advantages in terms of allowing assessment of the consistency of the Markov and microsimulation analyses, but also has the inherent limitations associated with model replication,43 including the assumption that the prior model represents an adequate approach to evaluating cost-effectiveness. Unlike the previous microsimulation model,18 our Markov model did not integrate pneumonia costs and therefore less completely reflects the potential benefits of IND/GLY. As such, results of the present analysis exclude the cost saving that would be anticipated from the reduction in pneumonia incidence observed with IND/GLY versus SFC in the FLAME study.24 While microsimulation models may be considered to represent the full spectrum of the disease more accurately than Markov models, they are still subject to limitations with regard to not fully capturing the symptoms that affect HRQoL and the potential drivers of costs. For example, microsimulation-based analyses in COPD have previously been reported that did not fully integrate the impact of comorbidities arising from COPD18,20 or treatment-related adverse effects.18
Similar to previous studies of the cost-effectiveness of IND/GLY,18,23 our analysis used Swedish mortality rates and healthcare costs as the basis for the cost-effectiveness analyses, applied an annual discount rate of 3%, and assumed that SFC is a relevant comparator for decision-makers. Given that cost-effectiveness of therapeutics can vary between countries (eg due to differences in drug costs, treatment patterns, healthcare system costs, or discount rates), without adaptation the transferability of our results is limited to settings similar to the Swedish scenario used herein.44,45 However, the model has been designed to be flexible and parameters can be adapted to provide results relevant for other jurisdictions; for example, through replacement of exacerbation costs and mortality rates with local data.
With regard to the comparative cost-effectiveness of IND/GLY versus SFC, the use of clinical trial data as the basis for the analysis limits the generalizability of our results to patient populations approximating those of the clinical study – in this instance, the FLAME study.24 In addition, given the highly controlled nature of clinical trials, the present analysis may not take into account real-world factors that influence outcomes in COPD, such as inhaler technique or treatment adherence.46,47 These are common limitations of cost-effectiveness analyses in COPD that use clinical trial data,17,18,20,47 and more generally of the clinical trials themselves.46 Finally, after the availability of data from clinical trials involving fixed-dose combinations of LABA/LAMA/ICS,48,49 future cost-effective studies of LABA/LAMA may consider these as comparative pharmacologic intervention.
One of the key objectives when designing the present Markov model was to maintain simplicity, which is one of its primary advantages. The model was developed using the R programming language and an R Shiny interface was used for model inputs, aiding the ease and speed of updates, with results presented in a user-friendly manner.50,51 While increasing complexity, future improvements to the model could include use of varying exacerbation rates for different age groups, use of a negative binomial distribution instead of a Poisson distribution (which would allow for greater variance in the number of exacerbations observed per year), inclusion of pneumonia costs and annualized rates of pneumonia-related events as model inputs, and revision of the model to address the assumption that health state transitions occur at the end of the cycle. In addition, further research should explore how to incorporate symptom-based parameters into such a cohort-level model.
Conclusion
In conclusion, the Markov model described herein represents a novel approach for conducting cost-effectiveness analyses for COPD interventions, using a methodology simpler than prior microsimulation models while retaining exacerbations as the driver of disease progression.18,20 Consistent with previously reported results,18 our model indicates that in patients with COPD and a history of moderate/severe exacerbations in the previous year, IND/GLY is a cost-effective treatment option compared with SFC.
Acknowledgments
The authors thank Alexander MacKay, formerly of Novartis, for his support with this analysis. Editorial and technical support in preparation of the manuscript was provided by Peter Birch, Mary Sawyers and Antonia Bowman, professional medical writers at CircleScience, an Ashfield company, part of UDG Healthcare plc (Tytherington, UK). Medical writing support was funded by Novartis Pharma AG (Basel, Switzerland).
Funding
This study was funded by Novartis Pharma AG (Basel, Switzerland).
Disclosure
Ronan Mahon, Florian Gutzwiller, Andrii Danyliv and Ivan Nikolaev are Novartis employees and hold shares in Novartis. Bhavesh Lakhotia was an intern at Novartis Ireland Limited and is employed by LexisNexis Risk Solutions, Ireland. Praveen Thokala is a Director and employee of PT Health Economics Ltd and received personal fees from Novartis. The authors report no other conflicts of interest in this work.
References
1. Global Initiative for Chronic Obstructive Lung Disease (GOLD). Global strategy for the diagnosis, management, and prevention of chronic obstructive pulmonary disease. 2018 Report; 2018. Available from:https://goldcopd.org/wp-content/uploads/2017/11/GOLD-2018-v6.0-FINAL-revised-20-Nov_WMS.pdf.
2. Adeloye D, Chua S, Lee C, et al. Global and regional estimates of COPD prevalence: systematic review and meta-analysis. J Glob Health. 2015;5(2):020415. doi:10.7189/jogh.05.020415
3. World Health Organization (WHO). The top 10 causes of death. Fact sheet 310; 2017. Updated January 2017. Available from: https://www.who.int/en/news-room/fact-sheets/detail/the-top-10-causes-of-death.
4. US Centers for Disease Control and Prevention. National Vital Statistics Reports. Deaths: final data for 2015; 2015. Available from: https://www.cdc.gov/nchs/data/nvsr/nvsr66/nvsr66_06.pdf.
5. European Respiratory Society (ERS). European lung white book - chapter 2: the economic burden of lung disease; 2016. Updated 2016. Available from: http://www.erswhitebook.org/.
6. Wedzicha JA, Seemungal TA. COPD exacerbations: defining their cause and prevention. Lancet. 2007;370(9589):786–796. doi:10.1016/S0140-6736(07)61382-8
7. Donaldson GC, Seemungal TA, Bhowmik A, Wedzicha JA. Relationship between exacerbation frequency and lung function decline in chronic obstructive pulmonary disease. Thorax. 2002;57(10):847–852. doi:10.1136/thorax.57.10.847
8. Donaldson GC, Mullerova H, Locantore N, et al. Factors associated with change in exacerbation frequency in COPD. Respir Res. 2013;14:79. doi:10.1186/1465-9921-14-79
9. Global Initiative for Chronic Obstructive Lung Disease (GOLD). Global strategy for the diagnosis, management, and prevention of chronic obstructive pulmonary disease. Updated 2016; 2016. Available at: http://goldcopd.org/global-strategy-diagnosis-management-prevention-copd-2016/.
10. Capel M, Mareque M, Alvarez CJ, Lindner L, Oyaguez I. Cost-effectiveness of fixed-dose combinations therapies for chronic obstructive pulmonary disease treatment. Clin Drug Investig. 2018;38(7):611–620. doi:10.1007/s40261-018-0646-0
11. Wilson MR, Patel JG, Coleman A, McDade CL, Stanford RH, Earnshaw SR. Cost-effectiveness analysis of umeclidinium/vilanterol for the management of patients with moderate to very severe COPD using an economic model. Int J Chron Obstruct Pulmon Dis. 2017;12:997–1008. doi:10.2147/COPD.S124420
12. Tebboth A, Ternouth A, Gonzalez-Rojas N. UK-specific cost-effectiveness of tiotropium + olodaterol fixed-dose combination versus other LAMA + LABA combinations in patients with COPD. Clinicoecon Outcomes Res. 2016;8:667–674. doi:10.2147/CEOR.S116546
13. van Boven JF, Kocks JW, Postma MJ. Cost-effectiveness and budget impact of the fixed-dose dual bronchodilator combination tiotropium-olodaterol for patients with COPD in the Netherlands. Int J Chron Obstruct Pulmon Dis. 2016;11:2191–2201. doi:10.2147/COPD.S114738
14. Selya-Hammer C, Gonzalez-Rojas Guix N, Baldwin M, et al. Development of an enhanced health-economic model and cost-effectiveness analysis of tiotropium + olodaterol Respimat(R) fixed-dose combination for chronic obstructive pulmonary disease patients in Italy. Ther Adv Respir Dis. 2016;10(5):391–401. doi:10.1177/1753465816657272
15. Eklund O, Afzal F, Borgstrom F, et al. Cost-effectiveness of tiotropium versus glycopyrronium in moderate to very severe chronic obstructive pulmonary disease in Canada, Spain, Sweden, and the UK. Clinicoecon Outcomes Res. 2016;8:243–252. doi:10.2147/CEOR.S105579
16. Chan MC, Tan EC, Yang MC. Cost-effectiveness analysis of a fixed-dose combination of indacaterol and glycopyrronium as maintenance treatment for COPD. Int J Chron Obstruct Pulmon Dis. 2018;13:1079–1088. doi:10.2147/COPD.S159103
17. Tee A, Chow WL, Burke C, Basavarajaiah G. Cost-effectiveness of indacaterol/glycopyrronium in comparison with salmeterol/fluticasone combination for patients with moderate-to-severe chronic obstructive pulmonary disease: a LANTERN population analysis from Singapore. Singapore Med J. 2018;59(7):383–389. doi:10.11622/smedj.2018022
18. Bjermer L, van Boven JFM, Costa-Scharplatz M, et al. Indacaterol/glycopyrronium is cost-effective compared to salmeterol/fluticasone in COPD: FLAME-based modelling in a Swedish population. Respir Res. 2017;18(1):206. doi:10.1186/s12931-017-0688-5
19. Reza Maleki-Yazdi M, Molimard M, Keininger DL, et al. Cost effectiveness of the long-acting beta2-adrenergic agonist (LABA)/long-acting muscarinic antagonist dual bronchodilator indacaterol/glycopyrronium versus the LABA/inhaled corticosteroid combination salmeterol/fluticasone in patients with chronic obstructive pulmonary disease: analyses conducted for Canada, France, Italy, and Portugal. Appl Health Econ Health Policy. 2016;14(5):579–594. doi:10.1007/s40258-016-0256-z
20. Asukai Y, Baldwin M, Fonseca T, Gray A, Mungapen L, Price D. Improving clinical reality in chronic obstructive pulmonary disease economic modelling: development and validation of a micro-simulation approach. Pharmacoeconomics. 2013;31(2):151–161. doi:10.1007/s40273-012-0016-3
21. Hoogendoorn M, Corro Ramos I, Baldwin M, Gonzalez-Rojas Guix N, Rutten-van Molken M. Broadening the Perspective of Cost-Effectiveness Modeling in Chronic Obstructive Pulmonary Disease: A New Patient-Level Simulation Model Suitable to Evaluate Stratified Medicine. Value in Health: The Journal of the International Society for Pharmacoeconomics and Outcomes Research. 2019;22(3):313–321. doi:10.1016/j.jval.2018.10.008
22. Geitona M, Kousoulakou H, Kalogeropoulou M, Mitsiki E, Panitti E, Steiropoulos P. Cost-effectiveness analysis of the fixed combination indacaterol/glycopyrronium vs. tiotropium and salmeterol/fluticasone in the management of COPD in Greece. Value in Health: The Journal of the International Society for Pharmacoeconomics and Outcomes Research. 2015;18(7):A500. doi:10.1016/j.jval.2015.09.1414
23. Price D, Keininger D, Costa-Scharplatz M, et al. Cost-effectiveness of the LABA/LAMA dual bronchodilator indacaterol/glycopyrronium in a Swedish healthcare setting. Respir Med. 2014;108(12):1786–1793. doi:10.1016/j.rmed.2014.09.015
24. Wedzicha JA, Banerji D, Chapman KR, et al. Indacaterol-glycopyrronium versus salmeterol-fluticasone for COPD. N Engl J Med. 2016;374(23):2222–2234. doi:10.1056/NEJMoa1516385
25. Hurst JR, Vestbo J, Anzueto A, et al. Susceptibility to exacerbation in chronic obstructive pulmonary disease. N Engl J Med. 2010;363(12):1128–1138. doi:10.1056/NEJMoa0909883
26. Beeh KM, Glaab T, Stowasser S, et al. Characterisation of exacerbation risk and exacerbator phenotypes in the POET-COPD trial. Respir Res. 2013;14(1):116. doi:10.1186/1465-9921-14-116
27. Kerkhof M, Freeman D, Jones R, Chisholm A, Price DB. Predicting frequent COPD exacerbations using primary care data. Int J Chron Obstruct Pulmon Dis. 2015;10:2439–2450. doi:10.2147/COPD.S94259
28. Margüello MS, Garrastazu R, Ruiz-Nuñez M, et al. Independent effect of prior exacerbation frequency and disease severity on the risk of future exacerbations of COPD: a retrospective cohort study. NPJ Primary Care Respiratory Medicine. 2016;26:16046. doi:10.1038/npjpcrm.2016.46
29. Molinari N, Briand C, Vachier I, et al. Hospitalizations for COPD exacerbations: trends and determinants of death. Copd. 2015;12(6):621–627. doi:10.3109/15412555.2015.1007931
30. Mullerova H, Shukla A, Hawkins A, Quint J. Risk factors for acute exacerbations of COPD in a primary care population: a retrospective observational cohort study. BMJ Open. 2014;4(12):e006171. doi:10.1136/bmjopen-2014-006171
31. Blanchette CM, Gross NJ, Altman P. Rising costs of COPD and the potential for maintenance therapy to slow the trend. Am Health Drug Benefits. 2014;7(2):98–106.
32. Chen X, Wang N, Chen Y, Xiao T, Fu C, Xu B. Costs of chronic obstructive pulmonary disease in urban areas of China: a cross-sectional study in four cities. Int J Chron Obstruct Pulmon Dis. 2016;11:2625–2632. doi:10.2147/COPD.S118523
33. Punekar YS, Shukla A, Müllerova H. COPD management costs according to the frequency of COPD exacerbations in UK primary care. Int J Chron Obstruct Pulmon Dis. 2014;9:65–73. doi:10.2147/COPD.S54417
34. Dhamane AD, Moretz C, Zhou Y, et al. COPD exacerbation frequency and its association with health care resource utilization and costs. Int J Chron Obstruct Pulmon Dis. 2015;10:2609–2618. doi:10.2147/COPD.S90148
35. Souliotis K, Kousoulakou H, Hillas G, Tzanakis N, Toumbis M, Vassilakopoulos T. The direct and indirect costs of managing chronic obstructive pulmonary disease in Greece. Int J Chron Obstruct Pulmon Dis. 2017;12:1395–1400. doi:10.2147/COPD.S132825
36. Scanlon PD, Connett JE, Waller LA, et al. Smoking cessation and lung function in mild-to-moderate chronic obstructive pulmonary disease. The Lung Health Study. Am J Respir Crit Care Med. 2000; 161 (2): 381–390. doi:10.1164/ajrccm.161.2.9901044
37. Statistics Sweden. Life expectancy in Sweden 2011–2015. Available from: https://www.scb.se/Statistik/_Publikationer/BE0701_2016A01R_BR_BE51BR1604.pdf.
38. Lindberg A, Larsson LG, Muellerova H, Ronmark E, Lundback B. Up-to-date on mortality in COPD - report from the OLIN COPD study. BMC Pulm Med. 2012;12:1. doi:10.1186/1471-2466-12-1
39. Rutten-van Molken MP, Oostenbrink JB, Tashkin DP, Burkhart D, Monz BU. Does quality of life of COPD patients as measured by the generic EuroQol five-dimension questionnaire differentiate between COPD severity stages? Chest. 2006;130(4):1117–1128. doi:10.1378/chest.130.4.1117
40. Lisspers K, Larsson K, Johansson G, et al. Economic burden of COPD in a Swedish cohort: the ARCTIC study. Int J Chron Obstruct Pulmon Dis. 2018;13:275–285. doi:10.2147/COPD.S149633
41. Swedish Agency for Health Technology Assessment and Assessment of Social Services; 2016. Available from: http://www.sbu.se/en/.
42. Garcia-Aymerich J, Serra Pons I, Mannino DM, Maas AK, Miller DP, Davis KJ. Lung function impairment, COPD hospitalisations and subsequent mortality. Thorax. 2011;66(7):585–590. doi:10.1136/thx.2010.152876
43. Bermejo I, Tappenden P, Youn JH. Replicating health economic models: firm foundations or a house of cards? Pharmacoeconomics. 2017;35(11):1113–1121. doi:10.1007/s40273-017-0553-x
44. Drummond M, Barbieri M, Cook J, et al. Transferability of economic evaluations across jurisdictions: ISPOR Good Research Practices Task Force report. Value in Health. 2009;12(4):409–418. doi:10.1111/j.1524-4733.2008.00489.x
45. Goeree R, He J, O’Reilly D, et al. Transferability of health technology assessments and economic evaluations: a systematic review of approaches for assessment and application. Clinicoecon Outcomes Res. 2011;3:89–104. doi:10.2147/CEOR.S14404
46. Price DB. Time to get real: critical and imperative change required in evidence evaluation. J Thoracic Dis. 2016;8(Suppl 5):S431–434. doi:10.21037/jtd.2016.07.10
47. van der Schans S, Goossens LMA, Boland MRS, et al. Systematic review and quality appraisal of cost-effectiveness analyses of pharmacologic maintenance treatment for chronic obstructive pulmonary disease: methodological considerations and recommendations. Pharmacoeconomics. 2017;35(1):43–63. doi:10.1007/s40273-016-0448-2
48. Lipson DA, Barnhart F, Brealey N, et al. Once-daily single-inhaler triple versus dual therapy in patients with COPD. N Engl J Med. 2018;378(18):1671–1680. doi:10.1056/NEJMoa1713901
49. Papi A, Vestbo J, Fabbri L, et al. Extrafine inhaled triple therapy versus dual bronchodilator therapy in chronic obstructive pulmonary disease (TRIBUTE): a double-blind, parallel group, randomised controlled trial. Lancet. 2018;391(10125):1076–1084. doi:10.1016/S0140-6736(18)30206-X
50. The R Foundation. The R project for statistical computing. Available from: https://www.r-project.org/.
51. RStudio I. Shiny. From R Studio; 2019. Available from: https://shiny.rstudio.com/.
52. Novartis. Data on file. 2015.
53. TLV (Dental and Pharmaceutical Benefits Agency S. 2016. Available from: http://www.tlv.se/beslut/sok/lakemedel/.
 © 2020 The Author(s). This work is published and licensed by Dove Medical Press Limited. The
full terms of this license are available at https://www.dovepress.com/terms
and incorporate the Creative Commons Attribution
- Non Commercial (unported, 3.0) License.
By accessing the work you hereby accept the Terms. Non-commercial uses of the work are permitted
without any further permission from Dove Medical Press Limited, provided the work is properly
attributed. For permission for commercial use of this work, please see paragraphs 4.2 and 5 of our Terms.
© 2020 The Author(s). This work is published and licensed by Dove Medical Press Limited. The
full terms of this license are available at https://www.dovepress.com/terms
and incorporate the Creative Commons Attribution
- Non Commercial (unported, 3.0) License.
By accessing the work you hereby accept the Terms. Non-commercial uses of the work are permitted
without any further permission from Dove Medical Press Limited, provided the work is properly
attributed. For permission for commercial use of this work, please see paragraphs 4.2 and 5 of our Terms.