")
Back to Journals » Open Access Rheumatology: Research and Reviews » Volume 12
Mitochondrial Imbalance as a New Approach to the Study of Fibromyalgia
Authors Martínez-Lara A , Moreno-Fernández AM, Jiménez-Guerrero M , Díaz-López C , De-Miguel M , Cotán D, Sánchez-Alcázar JA
Received 8 April 2020
Accepted for publication 4 August 2020
Published 24 August 2020 Volume 2020:12 Pages 175—185
DOI https://doi.org/10.2147/OARRR.S257470
Checked for plagiarism Yes
Review by Single anonymous peer review
Peer reviewer comments 2
Editor who approved publication: Professor Chuan-Ju Liu
Antonio Martínez-Lara,1 Ana María Moreno-Fernández,2 Maripaz Jiménez-Guerrero,1 Claudia Díaz-López,1 Manuel De-Miguel,2 David Cotán,1,3 José Antonio Sánchez-Alcázar3
1Pronacera Therapeutics S.L., Seville, Spain; 2Departamento de Citología e Histología Normal y Patológica, Facultad de Medicina, Universidad de Sevilla, Seville, Spain; 3Centro Andaluz de Biología del Desarrollo (CABD-CSIC-Universidad Pablo de Olavide), Seville 41013, Spain
Correspondence: David Cotán Tel +34 615 41 26 42
Email [email protected]
Background: Fibromyalgia (FM) is a common chronic pain disease, whose pathogenic mechanism still remains elusive. Oxidative stress markers and impaired bioenergetics homeostasis have been proposed as relevant events in the pathogenesis of the disease. Hence, the aim of the study is to analyse the potential biomarkers of mitochondrial imbalance in FM patients along with coenzyme Q10 (CoQ10) as a possible treatment.
Methods: The symptomatology of patients was recorded with an adaption of the Fibromyalgia Impact Questionnaire (FIQ). Mitochondrial imbalance was tested from blood extraction and serum isolation in 33 patients diagnosed with FM and 30 healthy controls. Western blot and HPLC techniques were performed to study the different parameters. Finally, bioinformatic analysis of machine learning was performed to predict possible associations of results.
Results: CoQ10 parameter did not show evidence to be a good marker of the disease, as the values are not significantly different between control and patient groups (Student’s t-test, CI 95%). For this reason, the focus of the study changed into the ratio between mitochondrial mass and autophagy levels. The bioinformatics analysis showed a possible association between this ratio and patients’ symptomatology. Finally, the effects of coenzyme Q10 as a potential treatment for the disease were different within patients, and its efficacy may be related to the initial mitochondrial status. However, there is no statistical significance due to limitations within the sample size.
Conclusion: Our study supports the hypothesis that an imbalance in mitochondrial homeostasis is involved in the FM pathogenesis. However, whether the increase in oxidative stress is the result of mitochondrial imbalance or the cause of this disease remains an open question. The measurement of this imbalance might be used as a preliminary biomarker for the diagnosis and follow-up of patients with FM, and even for the evaluation of the effects of the different antioxidants therapies.
Keywords: fibromyalgia, diagnosis, mitochondria, chronic pain
Background
Fibromyalgia (FM) is a usual chronic pain pathology in association with other symptoms, such as headache, tiredness, sleep perturbations, depression and other somatic symptoms. Gender comparisons in FM show a higher prevalence among middle-aged women. The diagnoses of the disorder is established according to the classification criteria of the American College of Rheumatology (ACR).1–3
Regardless of being a disease that has an impact on between 2% and 8% of the general population, its pathogenic mechanism continues elusive. Recently, oxidative stress has been proposed as a significant episode in the pathogenesis of FM.4,5 Moreover, decreased coenzyme Q10 (CoQ10) and vitamin D levels along with an increase in reactive oxygen species (ROS) production in blood mononuclear cells from FM patients have been detected, conferring clear sign of elevated oxidative stress at the cellular level.4,6 As CoQ10 values have been submitted to be a practical mitochondrial-dysfunction marker,7 these findings suggest the participation of an impaired bioenergetics homeostasis in FM patients. Furthermore, CoQ10-deficient fibroblasts presenting higher values of lysosomal markers (Beta-galactosidase, cathepsin, lc3-IIb, and Lyso Tracker) showed the existence of autophagy with an improved expression of autophagic genes (at transcriptional and translational levels).8 In 2010, we detected an increase of mitochondrial superoxide levels in blood mononuclear cells, reduced mitochondrial membrane potential, and higher values of lipid peroxidation in blood mononuclear cells and plasma from FM patients. Mitochondrial dysfunction was also identified with increased expression of autophagic genes as well as the removal of defective mitochondria by mitophagy.9
Mitochondria, the main energy hub of the cell, are cytoplasmic organelles containing their own multi-copy genome. These organelles are organised in an extremely dynamic network, derived from mitochondrial fission and fusion events. Importantly, the balance of mitochondrial mass is controlled through an equilibrium within mitochondrial biogenesis and elimination. The removal of mitochondrial, including those which are damaged, occurs by mitophagy.10,11
In other neurological and neuromuscular diseases, a clear relation has also been shown between the increase of oxidative stress, dysfunctional mitochondria and selective autophagy in their pathogenesis;12–15 likewise, a relation has been shown between mitochondrial dysfunction associated with autophagy and a proinflammatory state that induces complications in Type II Diabetes Mellitus (T2DM).16 This is a model that could be useful to explain the central neuroinflammatory state commonly associated with FM.
The complexity and diversity of symptoms associated with FM disease complicates its objective evaluation. Thus, the use of a criterion based on biomarkers can be an advantage to understand the causes of FM and a way to objectively evaluate the effectiveness of possible therapeutic treatments. Some researchers have recently used machine-learning techniques in FM research. Lopez-Sola et al used this empiric approximation to study the neuronal processes associated with FM and identified a brain signature that characterises FM central pathophysiology.17 Using machine learning techniques as a classification method has allowed highly accurate (70–90%) identification of brain biomarkers obtained from magnetic resonance imaging of chronic pain patients.18 Machine learning analysis has also been used to study differences and similarities of FM with chronic fatigue syndrome (CFS) or irritable bowel syndrome (IBS). Three disorders with many symptoms in common and whose results come from the deregulation of related molecular mechanisms.19
In this study, we analyse mitochondrial homeostasis in FM patients as an objective measurement to evaluate their health status relative to control patients. The use of this criterion could also allow the evaluation of the effectiveness of potential drugs against FM, such as CoQ10.
Patients and Methods
Patients and Controls
The project was performed with the informed consent of all participants and the authorization of the Regional International Ethics and Health Research Committee (SAS) with internal code 1230-N-16. We included 33 patients (2 males and 31 females) recruited from the “Asociación de Fibromialgia de Tomares (Fibro-Reto)” and 30 healthy controls. The diagnosis of the disease was determined by an experienced rheumatologist, in accordance with ACR criteria.3
The exclusion criteria selected for the performance of the study were: concomitant rheumatic diseases, systemic diseases with relevant impact on life quality (cardiopulmonary, neurological, renal or febrile), patients with severe psychopathology, or with dependence on psychoactive substances, or patients with chronic pain whose origin is different from FM.
The impact of FM on these patients was evaluated using the Spanish version of the Fibromyalgia Impact Questionnaire (FIQ), with a range between 0 and 100.
To evaluate the mitochondrial function, blood samples were taken by venous puncture for routine analysis (Biochemistry and Lipidogram). Serum was isolated by centrifugation at 3500 g and stored at −80 °C until the time of the serotonin determination. Serotonin, as well as additional blood components, were measured by routine laboratory tests (Urea, glucose, uric acid, total protein, etc.).
All patients and healthy volunteers had not consumed any drug or vitamin/nutritional supplement during a 15-day period prior to blood sample collection. In addition, 13 individuals from the patient group were selected to be treated with Ubiquinone (Q10 300 mg, Botanic Nutrients). Ubiquinone was orally administrated to these patients, daily for a period of a month along with a standard balanced diet rich in fruits, vegetables and legumes, especially in potassium, zinc, silicon and selenium.
Blood Mononuclear Cells Enrichment
Peripheral blood mononuclear cells (PBMCs) were isolated from EDTA anticoagulated blood with selective osmotic shock with isotonic NH4Cl (PanreacQuimica SLU, Barcelona, Spain).
Reagents
The following antibodies and reagents were used: monoclonal anti-actin antibody and rabbit anti-VDAC1/Porin from Sigma-Aldrich (St. Louis, MO, USA); anti-MAP lc3-2b (N-20) from Santa Cruz Biotechnology (Santa Cruz, CA, USA); a mixture of protease inhibitors from Boehringer Mannheim (Indianapolis, IN, USA); and Immun Star HRP substrate kit from Bio-Rad Laboratories (Hercules, CA, USA). Extra reagents were also obtained from Sigma-Aldrich.
CoQ Levels Measurement
Cell samples were lysed with 1% SDS and vortexed for 1 min. Ethanol:isopropanol (95:5) was added to the solutions and vortexed was performed again. To isolate CoQ, 5 mL of hexane was mixed and the tubes were centrifuged for 5 min at 1000g and 4°C. The superior phases from three extractions were recuperated and dried with a rotary evaporator. One milliliter of ethanol was used to suspend the lipid extracts; then, it was dried in a speed-vac and maintained at −20°C. Samples were suspended in the appropriate volume of ethanol preceding to HPLC injection. Lipid factors were isolated by a Beckmann 166–126 HPLC system equipped with a 15-cm Kromasil C-18 column in a column oven set to 40°C, with a flow rate of 1 mL/min and a mobile phase containing 65:35 methanol/n-propanol and 1.42 mM lithium perchlorate. CoQ levels were measured with ultraviolet (System Gold 168), electrochemical (Coulochem III ESA) or radioactivity (Radioflow Detector LB 509, Berthod Technologies) based detectors as required. The internal standard was Coenzyme Q9 (CoQ9). CoQ levels were calculated as nmol/g protein.
Immunoblotting
Western blotting was conducted through standard methodology. After protein transfer, the incubation of the membrane was performed with various primary antibodies 1:1000 diluted. Then, the membrane was incubated with the corresponding secondary antibody coupled to horseradish peroxidase at 1:10,000 dilution. Finally, the Immun Star HRP substrate kit was used to recognize specific protein complexes.
Bioinformatic Analysis
Due to the complexity of the pathophysiology of the disease and the low number of samples in the study, we decided to apply predictive models of machine learning to observe possible associations between the factors studied.
For the data processing and analysis WEKA 3.8 software was used. WEKA package was developed at the University of Waikato (New Zealand) and provides a 5-tool collection for visualisation and algorithms for data analysis and predictive modelling. These tools perform data pre-processing, regression, assignment, clustering, association rules and visualisation.20 To use WEKA with the data, they were transformed into Attribute-Relation File Format (ARFF), which is a compatible format.
In the analysis performed on this work, two different machine learning technique types were used:
Clustering technique is aimed at forming groups of data. The objective is that entities within a group have to be more similar to entities of that group than those of other groups. The clustering algorithm used in this analysis was Expectation-maximisation (EM).
The association rules analysis is a method to display relations between variables in datasets to uncover how items are associated with each other. This analysis identifies rules in databases using measures of interest. An association rule can be defined as an implication of the form A → X where A is the antecedent and X is the consequent. For this analysis, the algorithm apriori was used. Hence, the dataset attributes were discretised in 5 different bins.
Results
In this study, we compare a group of FM patients relative to a healthy control group. The mean age was 49.5±11 for the FM group and 44.2±13 years for the control group. The overall mean duration of symptoms in the FM group was 10.8 ± 9.19 years. The mean tender points in the patient group were 13.0 ± 3.1 points. The most pronounced features of these FM patients were pain and stiffness (Age 49.5 years; Tender points 13.0; Duration of disease 10.8 years; FIQ 58.6; CoQ10 in PBMCs 101.7 pMolQ10/Protein mg; Total Cholesterol 211.3 mg/dL). Normal results for routine laboratory tests are shown in Table 1.
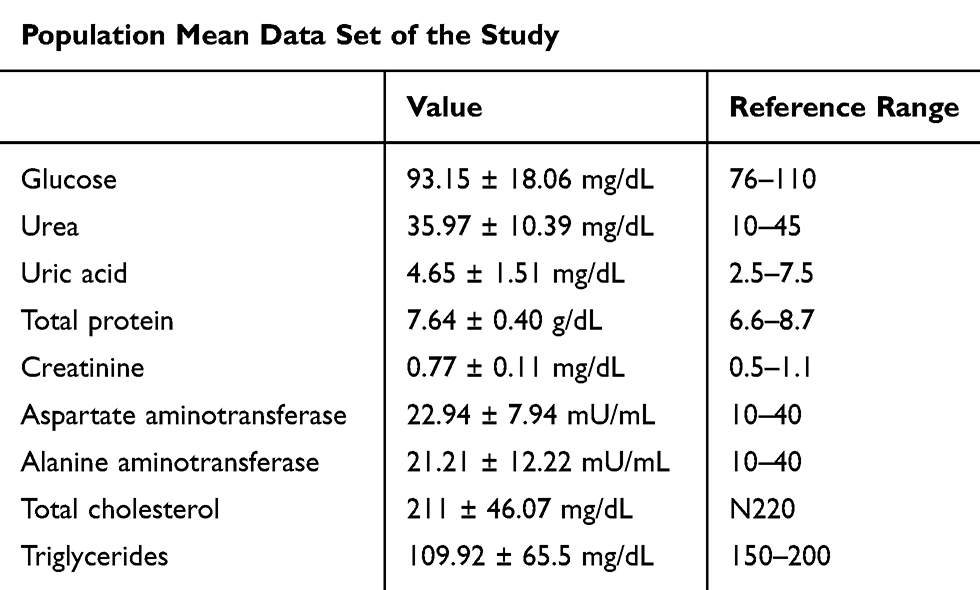 |
Table 1 Mean of Routine Laboratory Test Results of Patient Group |
Measurement of CoQ Levels as a Potential Biomarker of FM
CoQ levels have been associated with oxidative stress in cells; thus, this value in patients could also show a relation with FM severity. CoQ10 marker evaluation was performed by choosing 8 patients with similar clinical features and lifestyles from the total number of patients, determining the CoQ10 concentration in PBMCs as previously described.7 As shown in Figure 1, CoQ10 levels were highly variable, both in the control and the patient group. However, the control group showed lower levels of CoQ10 than patients with FM. In addition, the mean of the control group is increased because two of the individuals present more than 300 μmoles of CoQ10, which increases value variability.
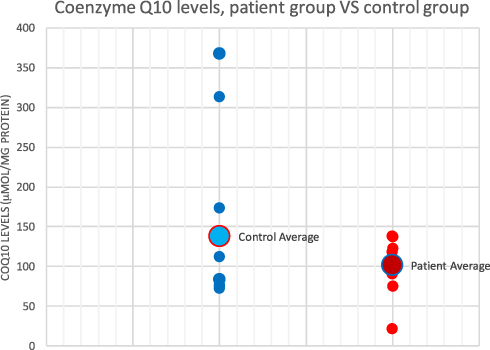 |
Figure 1 Coenzyme Q10 in control (left) and patient (right) groups expressed in μmol of Q10 per mg of protein. |
Measurement of Alternative Biomarkers of Mitochondrial Imbalance
Mitochondrial biogenesis through the mitochondrial mass (VDAC protein levels) and the destruction of mitochondria through selective autophagy (lc3-IIb protein levels) were analysed in the 33 patients. These results are illustrated in Figure 2.
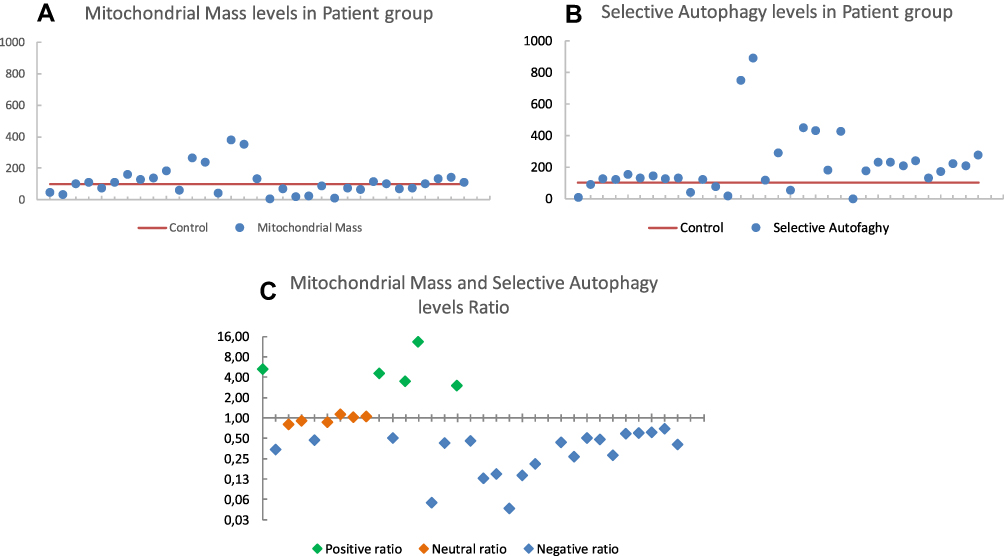 |
Figure 2 (A) Mitochondrial mass levels of protein marker (VDAC) isolated from PBMC’s and referenced to total protein amount. (B) Selective autophagy levels of protein marker [LC3-lib] isolated from PBMC’s and referenced to total protein amount. (C) Mitochondrial generation and wear balance ratio referenced to total protein amount. |
As shown in Figure 2A, the values of mitochondrial mass in the patient group were dispersed with respect to the control values, which are around 100. Similarly, in Figure 2B, it can be observed that autophagy levels in patient group are not strictly grouped together, although it can be seen that most of the values are above the control value, meaning that these patients have higher levels of autophagy, and more likely mitophagy.
Although levels of mitochondrial mass and autophagy do not seem to follow a specific pattern in patients, they present alterations in mitochondrial homeostasis as shown in Figure 2C. This graphic represents the ratio between mitochondrial mass and autophagy levels. According to Figure 2C, there are three differentiated populations within the patient group: a subpopulation with a ratio of less than 1 (69%); another with a ratio of 1 (18%) and the other with a ratio greater than 1 (12%).
Evaluation of CoQ10 as a Potential Treatment, Based on Mitochondrial Homeostasis
Thirteen women patients with similar clinical characteristics and habits were treated with CoQ10 (300 mg/day, Botanic Nutrients) for 30 days, and subsequently, the markers of mitochondrial mass, autophagy and the ratio of both were re-analysed. These results are represented in Figure 3. It is important to consider that there were no statistical differences between these 13 patients and the rest of the group, when comparing ratio and FIQ values (Student’s t-test, CI 95%) and the selection of these patients was defined following medical criterion.
 |
Figure 3 Mitochondrial balance ratio represented of patients with fibromyalgia before (white bars) and after (drawn bars) CoQ10 treatment. Green striped post-treatment bars represent positive ratios after CoQ10 treatment; red striped bars represent negative ratios after treatment; blue striped bar represent no ratio change after CoQ10 treatment. |
From Figure 3 it should be noted that there are patients whose ratio improves after treatment with CoQ10 (as in the case of patients 1, 4, 6, 7, 8, 9 and 13); patients whose ratio is maintained after treatment (as in patient 3) and also patients in whom the treatment decreases the ratio (as in the case of patients 2, 5, 10, 11 and 12) although the symptomatology of the disease clearly improves (Figure 4).
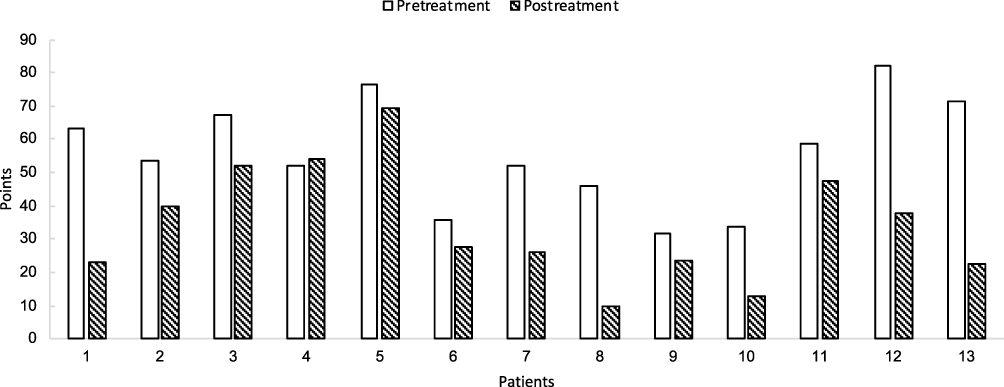 |
Figure 4 FIQ values of patients before and after CoQ10 treatment. |
To determine if the changes in the ratio values of the mitochondrial balance were a reliable marker for the improvement or worsening of the patient after the treatment, the results obtained in Figure 3 were evaluated with the FIQ values obtained in the same patients, Figure 4. Prior to this analysis, sample homogeneity was measured by calculating the variance of FIQ values, which resulted in 236.46. It was found that 33% of the patient group did not show a significant improvement with the treatment, while the remaining 67% did improve both symptomatically and physically.
Table 2 gathers the ratio and FIQ values of patients, prior and subsequent to treatment.
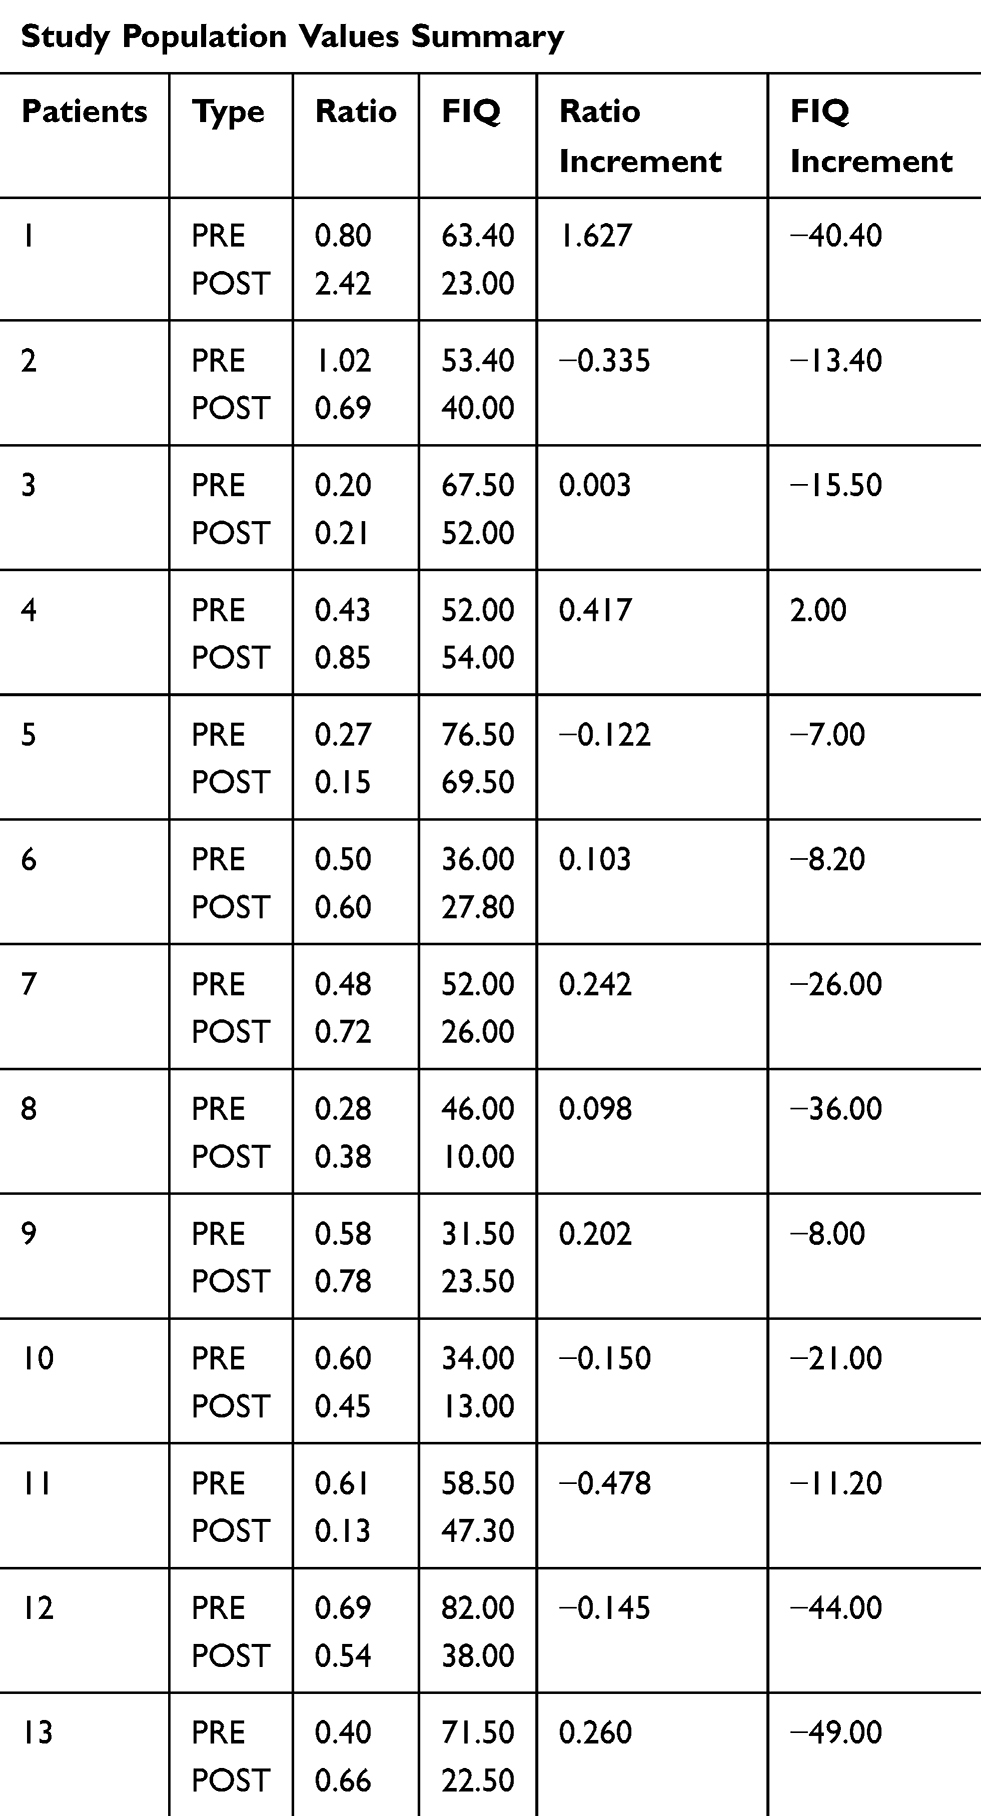 |
Table 2 Mitochondrial Balance Ratio and FIQ Values Summary Before and After CoQ10 Treatment and Its Increment |
Bioinformatic Analysis
EM algorithm: two clusters emerged when the whole dataset was selected to build the model. The bigger cluster had a lower ratio value and a higher FIQ value and the smaller cluster had a higher ratio level and a lower FIQ value. This could mean that the group of patients is not completely homogeneous representing the smaller group of patients that could have a less severe disease and a higher life quality (Table 3).
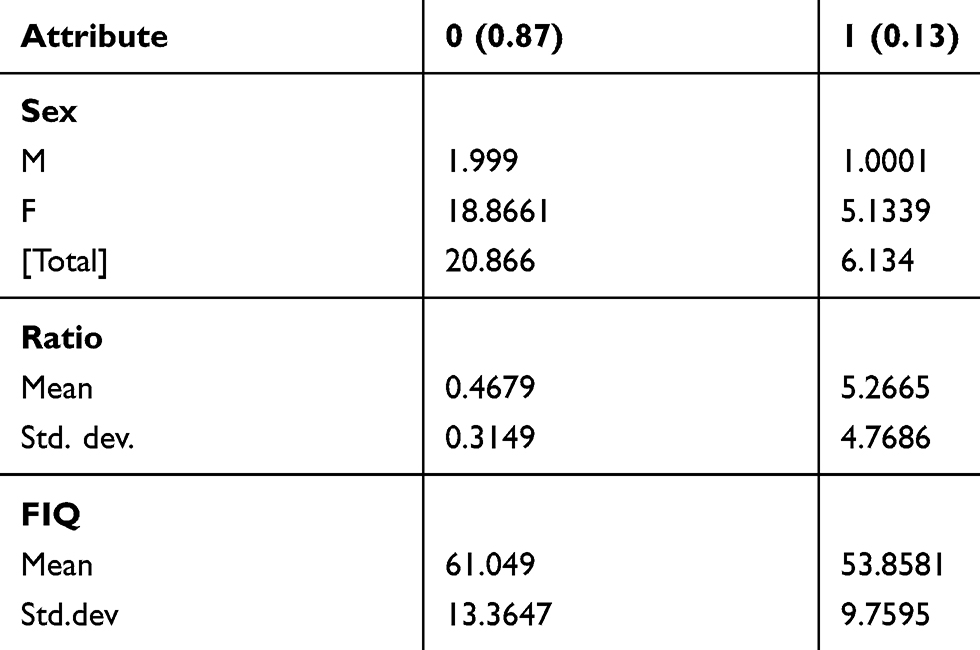 |
Table 3 Clusters Generated by the Application of the EM Algorithm to the Pre-Treatment Dataset Selecting the Whole Dataset |
Subsequently, the data collected from the 13 patients after the treatments were also examined along with the ratio variation estimation. All the patients subjected to the treatment were women and all but one FIQ variation was negative. In this case, there was not a clear trend as some of the variations are positive and others are negative. As most of the patients seemed to improve after the treatment, what could be happening is that all the ratio levels tend to approach 1, a balanced state between mitochondria biogenesis and degradation. To analyse these data in detail and assess the changes in markers altogether after the treatment, EM clustering analysis was performed on them.
EM algorithm: The analysis by EM algorithm generates only one cluster. According to the mean values of the emerged cluster, the FIQ value after treatment was lower than before treatment. Confirming the previous data visualisation, this could mean that the patients experienced an improvement in their life quality. Moreover, the ratio of the patients after the treatment was higher and closer to 1, which could mean that mitochondria synthesis and degradation were more balanced, improving the cellular functions and making the disorder less intense. This fact agrees with the FIQ levels registered in Table 4.
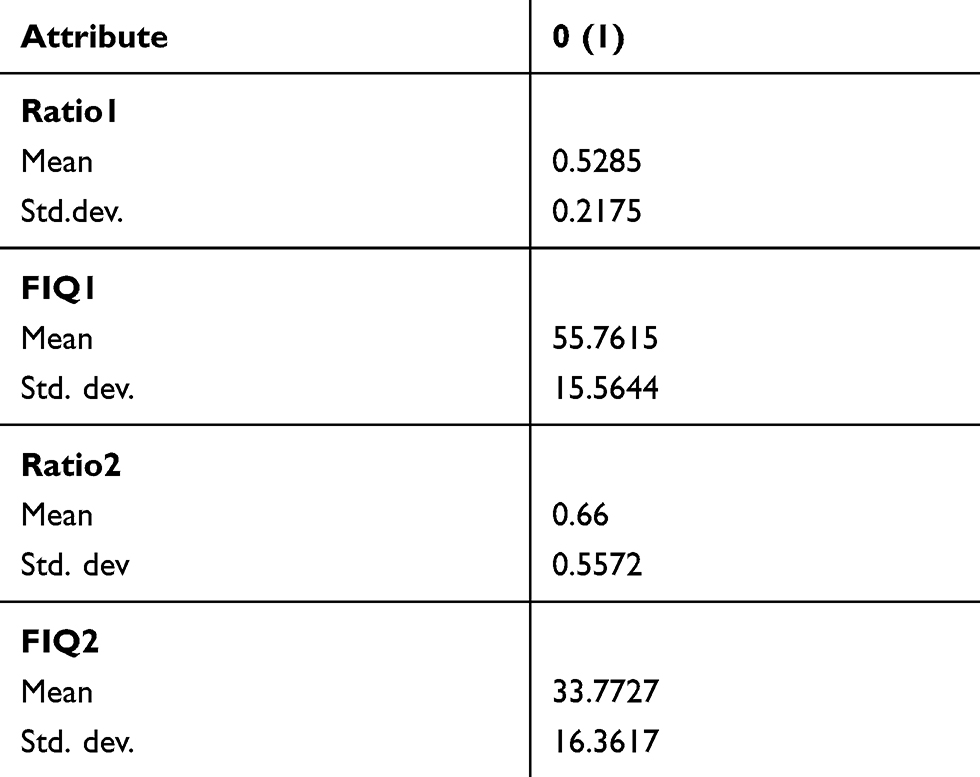 |
Table 4 Cluster Generated by the Application of the EM Algorithm to the Post-Treatment Dataset Selecting the Whole Dataset |
Among the association rules found, the most interesting one was as follows:
FIQ=“(73.6-inf)” 6 =≤ Ratio=“(-inf-2.696]” 6 <conf:(1)> lift:(1.22) lev:(0.03) [1] conv:(1.09).
This means that the maximum FIQ levels were associated with the minimum ratio levels. This association was expected because a low number of mitochondria and a high level of mitophagy can trigger a cell energy imbalance associated with the FM symptoms (Cordero et al, 2010).
The same analysis was applied to the post-treatment dataset. The most interesting association obtained in this case was the following:
Ratio1=“(-inf-0.372]” 3 =≤ Ratio2=“(-inf-0.588]” 3 <conf:(1)> lift:(2.17) lev:(0.12) [1] conv:(1.62).
Meaning that patients that showed a low pre-treatment ratio also showed a low post-treatment ratio. It could mean that the treatment was effective and induced an improvement in the mitochondrial balance.
Discussion
The increase in oxidative stress in FM has already been described by several authors;4,5 and it has been seen that this increase may be a secondary cause or consequence of mitochondrial dysfunctions.5,6 This mitochondrial dysfunction, according to previous studies carried out by our research group, could be the result of the deficiency of coenzyme Q10 involved in the mitochondrial respiratory chain.6 However, our results show that CoQ10 does not seem to be a good predictor, at least on its own, for the diagnosis and follow-up of patients with FM. This fact suggests that bioenergetic homeostasis in patients with FM must have other altered factors. Therefore, it was necessary to search for new markers directly related to mitochondrial balance, as is the case of mitochondrial biogenesis, which is defined as the generation of new mitochondria or the removal of dysfunctional mitochondria through the selective autophagy or the mitophagy process (Figure 5).
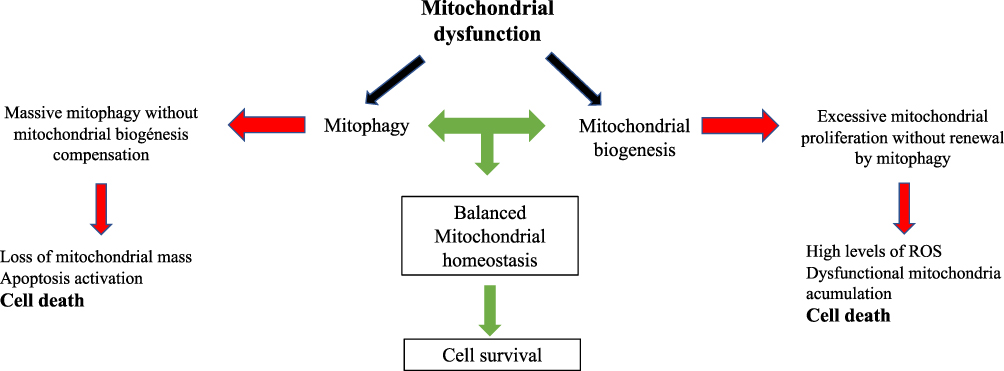 |
Figure 5 Scheme showing the relationship among mitophagy, mitochondrial biogenesis and cell death. |
Based on the literature, the new markers chosen were the component mitochondrial mass in study (VDAC) and the autophagy component (lc3-IIb). Despite their relation with mitochondrial balance, the results have shown that both are not good biomarkers “per se” for the diagnosis of FM. This is due to the presence of very low values for both markers in individuals from the patient group added to individuals that present very high levels of a certain marker and very low in the other one. However, when the ratio between these biomarkers related to the elimination and formation of mitochondria is analysed, it has been observed that in most of them there is an imbalance when the ratio is different from 1. This means that greater or lower ratio than 1 implies an imbalance in the mitochondrial homeostasis of the individual, which derives in a molecular and phenotypically specific symptomatology.
As well as mitochondrial dysfunction having been related to increased mitophagy in different pathologies such as MELAS syndrome (Mitochondrial encephalopathy, lactic acidosis, and stroke-like episodes),13 Parkinson’s disease,12,21 congenital muscular dystrophy,15 antiphospholipid syndrome,14 and T2DM,16 a disproportion of the mitochondrial mass or autophagy flux can be related to dysfunction in FM. An imbalance in the energetic organelle with fluctuations according to the characteristics of the patients, habits, diet and physical activity. In fact, patient ratio shown in Figure 2C, whose values are greater than 1, corresponds to individuals with greater sports activity than the rest of the study population.
In MELAS syndrome,13 a neurological alteration associated with mutations in genes related to the transfer RNA that affects mitochondrial function with increased oxidative stress, activation of the transition of mitochondrial permeability and degradation of damaged mitochondria occurs. In the same way, in FM that also presents clear neuromuscular symptoms, our group has described how the increase in oxidative stress is related to a large-scale degradation of mitochondria and accumulation of autophagosomes that were restored with exogenous treatment with Q10.22,23
As demonstrated in this study, a high percentage of patients reported an improvement of the symptoms after the treatment with exogenous CoQ10 (Figure 4). However, the ratio did not improve in the same proportion as the FIQ values, with a great variability being observed in the treatment response. It can be affirmed that CoQ10 treatment favours the improvement of the ratio of some patients. Specifically, CoQ10 seems to have a greater effect on a group of patients with a previous imbalance in mitochondrial homeostasis, due to its antioxidant and stabilising capacity of the mitochondrial respiratory chain. In addition, FM is not a single entity and the treatment effectiveness may also depend on the habits, diet and sports activity of each patient.
There are other diseases that relate their physiopathogenesis to the presence of mitochondrial dysfunction associated with mitophagy and decreased mitochondrial mass. Among them, the work published by Narendra et al21 can be highlighted which describes how neurological disorders of Parkinson’s disease associated with the mutation of the PINK1-Parkin axis produce autophagosomes in mitophagy. The action of PINK-1 dominates mitophagy by controlling the opening of the mitochondrial pores and the general regulators of autophagy. Secondly, in these patients suffering from Parkinson’s, the use of CoQ10 improves, as does FM, this mitochondrial damage.
In the same way, Mitsushashi et al15 have described the association between Congenital Muscular Dystrophy with mitochondrial dysfunction and the increase in mitophagy, due to a biosynthetic deficit of phosphatidyl choline originated by the loss of function of the CHKB gene that codes for Beta Choline Kinase. Another disease that presents mitophagy is the Antiphospholipid syndrome, this being an autoimmune disease in which there is an increase in oxidative stress that has a proinflammatory and prothrombotic effect. Pérez Sánchez et al described in a study with electron microscopy a decrease in size, fission and fragmentation of the mitochondria as well as an alteration of their morphology, adopting a spherical shape in patients with Antiphospholipid syndrome.14 In the same way, they confirmed how the treatment with coenzyme Q10 had beneficial effects, not only in the symptomatology, but at the level of the mitochondrial morphology, with an increase in the size of the mitochondria of the treated patients. In FM there is an increase in proinflammatory levels, such as TNF, IL1, IL6 and IL8, associated with mitochondrial dysfunction and increased ROS generation.5,6,12
In the results obtained from this study, 69% of patients present a clear mitochondrial imbalance, which confirms that it is a useful method for the diagnosis and monitoring of FM. However, 12% of the patients showed a ratio greater than 1, that can be explained by the physical activity developed, since 3 of the 4 patients regularly perform intense sports activities. In addition, in our results most patients improved their symptoms after treatment with Q10 with an improvement in the ratio that was not absolute due to other variables related to the disease, such as variability in the physiopathogenic factors of FM, association with food intolerances, eating or lifestyle habits.
Given the absence of objective methods for the study and diagnosis of FM nowadays, a new parameter as a possible biomarker to the diagnosis of FM is presented in this study. This parameter measures mitochondrial balance through the ratio between mitochondrial mass and autophagy.
Our study supports the hypothesis that, as in other pathologies previously mentioned, an imbalance in mitochondrial homeostasis is involved in the pathogenesis of FM, causing an increase in oxidative stress as cause or effect, compromising cellular functionality. However, independently of these findings, the measurement of this imbalance might be used as a biomarker for the diagnosis and follow-up of patients with FM. And even for the evaluation of the effects of the different antioxidant therapeutic measures, such as CoQ10, vitamin E, exercise or other measures that reduce oxidative stress in FM patients.
The clustering analysis of the data showed that the studied FM patients could be separated into two different groups depending mainly on the ratio value. It was also remarkable that the cluster differentiation was possible due to the ratio attribute instead ofthe mitochondrial markers by themselves. The analysis of the post-treatment dataset showed that the treatment with CoQ10 supplementation was effective in a group of patients, as the ratio levels rose and the FIQ levels decreased implying a better life quality. An association was found through the apriori algorithm between low ratio levels and high FIQ levels. In this way, this work helped to scientifically confirm the relation between mitochondrial imbalance and disorder intensity.
Conclusions
In conclusion, an imbalance in mitochondrial homeostasis has been proven to be involved in the FM pathogenesis and CoQ10 has been shown as a potential treatment for the disease. Furthermore, in this preliminary study, we found that the ratio between mitochondrial mass and autophagy values seems to have a relation with the severity of the disease.
Study Limitations
As future perspectives, it would be necessary to increase the number of patients studied to ratify these findings and carry out other studies that control other variables such as diet or physical activity. In addition, another limitation of the study was the absence of healthy controls in the post-treatment group.
Abbreviations
α-toc, α-tocopherol; CoQ10, coenzyme Q10; T2DM, diabetes mellitus type 2; FM, fibromyalgia; MPT, mitochondrial permeability transition; PBMCs, peripheral blood mononuclear cells; ROS, reactive oxygen species; TBARS, thiobarbituric acid reactive substances.
Data Sharing Statement
The datasets used and analysed during the current study are available from the corresponding author on reasonable request.
Ethics Approval and Informed Consent
The study was conducted in accordance with the Declaration of Helsinki (1965 and later revisions). All participants signed an informed consent before the beginning of the study and the Regional International Ethics and Health Research Committee (SAS) approved the study (internal code 1230-N-16).
Acknowledgments
The authors dedicate this manuscript to FM patients and Fibro-Reto (Asociación de Fibromialgia de Tomares) for their unconditional support.
Author Contributions
All authors made substantial contributions to conception and design, acquisition of data, or analysis and interpretation of data; took part in drafting the article or revising it critically for important intellectual content; agreed to submit to the current journal; gave final approval of the version to be published; and agree to be accountable for all aspects of the work.
Disclosure
Antonio Martínez-Lara, Maripaz Jiménez-Guerrero, Claudia Díaz-López, and David Cotán are employees of Pronacera Therapeutics S.L. The authors report no other potential conflicts of interest for this work and report no financial or commercial conflicts of interest.
References
1. Wolfe F, Smythe HA, Yunus MB, et al. The American College of Rheumatology 1990 criteria for the classification of fibromyalgia. Report of the multicenter criteria committee. Arthritis Rheum. 1990;33(2):160–172. doi:10.1002/art.1780330203
2. Wolfe F, Clauw DJ, Fitzcharles MA, et al. The American College of Rheumatology preliminary diagnostic criteria for fibromyalgia and measurement of symptom severity. Arthritis Care Res. 2010;62(5):600–610. doi:10.1002/acr.20140
3. Wolfe F, Clauw DJ, Fitzcharles MA, et al. 2016 revisions to the 2010/2011 fibromyalgia diagnostic criteria. Semin Arthritis Rheum. 2016;46(3):319–329. doi:10.1016/j.semarthrit.2016.08.012
4. Ozgocmen S, Ozyurt H, Sogut S, Akyol O. Current concepts in the pathophysiology of fibromyalgia: the potential role of oxidative stress and nitric oxide. Rheumatol Int. 2006;26(7):585–597. doi:10.1007/s00296-005-0078-z
5. Pieczenik SR, Neustadt J. Mitochondrial dysfunction and molecular pathways of disease. Exp Mol Pathol. 2007;83(1):84–92. doi:10.1016/j.yexmp.2006.09.008
6. Cordero MD, Moreno-Fernández AM, deMiguel M, et al. Coenzyme Q10 distribution in blood is altered in patients with fibromyalgia. Clin Biochem. 2009;42(7–8):732–735. doi:10.1016/j.clinbiochem.2008.12.010
7. Turunen M, Olsson J, Dallner G. Metabolism and function of coenzyme Q. Biochim Biophys Acta - Biomembr. 2004;1660(1–2):171–199. doi:10.1016/j.bbamem.2003.11.012
8. Rodríguez-Hernández Á, Cordero MD, Salviati L, et al. Coenzyme Q deficiency triggers mitochondria degradation by mitophagy. Autophagy. 2009;5(1):19–32. doi:10.4161/auto.5.1.7174
9. Cordero MD, De Miguel M, Moreno Fernández AM, et al. Mitochondrial dysfunction and mitophagy activation in blood mononuclear cells of fibromyalgia patients: implications in the pathogenesis of the disease. Arthritis Res Ther. 2010;12(1):R17. doi:10.1186/ar2918
10. Carelli V, Maresca A, Caporali L, Trifunov S, Zanna C, Rugolo M. Mitochondria: biogenesis and mitophagy balance in segregation and clonal expansion of mitochondrial DNA mutations. Int J Biochem Cell Biol. 2015;63:21–24. doi:10.1016/j.biocel.2015.01.023
11. Youle RJ, Narendra DP. Mechanisms of mitophagy. Nat Rev Mol Cell Biol. 2011;12(1):9–14. doi:10.1038/nrm3028
12. Cui T, Fan C, Gu L, et al. Silencing of PINK1 induces mitophagy via mitochondrial permeability transition in dopaminergic MN9D cells. Brain Res. 2011;1394:1–13. doi:10.1016/j.brainres.2011.01.035
13. Cotan D, Cordero MD, Garrido-Maraver J, et al. Secondary coenzyme Q 10 deficiency triggers mitochondria degradation by mitophagy in MELAS fibroblasts. FASEB J. 2011;25(8):2669–2687. doi:10.1096/fj.10-165340
14. Perez-Sanchez C, Ruiz-Limon P, Aguirre MA. Mitochondrial dysfunction in antiphospholipid syndrome: implications in the pathogenesis of the disease and effects of coenzyme Q10 treatment. Blood. 2012;119(24):5859–5870. doi:10.1182/blood-2011-12-400986
15. Mitsuhashi S, Nishino I. Phospholipid synthetic defect and mitophagy in muscle disease. Autophagy. 2011;7(12):1559–1561. doi:10.4161/auto.7.12.17925
16. Widlansky ME, Wang J, Shenouda SM, et al. Altered mitochondrial membrane potential, mass, and morphology in the mononuclear cells of humans with type 2 diabetes. Transl Res. 2010;156(1):15–25. doi:10.1016/j.trsl.2010.04.001
17. López-Solà M, Woo CW, Pujol J, et al. Towards a neurophysiological signature for fibromyalgia. Pain. 2017;158(1):34–47. doi:10.1097/j.pain.0000000000000707
18. Boissoneault J, Sevel L, Letzen J, Robinson M, Staud R. Biomarkers for musculoskeletal pain conditions: use of brain imaging and machine learning. Curr Rheumatol. 2017;19(1). doi:10.1007/s11926-017-0629-9
19. Melidis C, Denham SL, Hyland ME. A test of the adaptive network explanation of functional disorders using a machine learning analysis of symptoms. BioSystems. 2018;165:22–30. doi:10.1016/j.biosystems.2017.12.010
20. Witten IH, Frank E, Hall MA. Data Mining. Practical Learning Tools and Techniques.
21. Narendra DP, Jin SM, Tanaka A, et al. PINK1 is selectively stabilized on impaired mitochondria to activate Parkin. PLoS Biol. 2010;8(1):e1000298. doi:10.1371/journal.pbio.1000298
22. Cordero MD, Alcocer-Gómez E, Cano-García FJ, et al. The effect of coenzyme Q 10 on symptoms of mother and son with fibromyalgia syndrome. J Musculoskelet Pain. 2011;19(2):118–119. doi:10.3109/10582452.2011.558990
23. Cordero MD, Alcocer-Gómez E, De Miguel M, et al. Coenzyme Q10: a novel therapeutic approach for Fibromyalgia? Case series with 5 patients. Mitochondrion. 2011;11(4):623–625. doi:10.1016/j.mito.2011.03.122
 © 2020 The Author(s). This work is published and licensed by Dove Medical Press Limited. The full terms of this license are available at https://www.dovepress.com/terms.php and incorporate the Creative Commons Attribution - Non Commercial (unported, v3.0) License.
By accessing the work you hereby accept the Terms. Non-commercial uses of the work are permitted without any further permission from Dove Medical Press Limited, provided the work is properly attributed. For permission for commercial use of this work, please see paragraphs 4.2 and 5 of our Terms.
© 2020 The Author(s). This work is published and licensed by Dove Medical Press Limited. The full terms of this license are available at https://www.dovepress.com/terms.php and incorporate the Creative Commons Attribution - Non Commercial (unported, v3.0) License.
By accessing the work you hereby accept the Terms. Non-commercial uses of the work are permitted without any further permission from Dove Medical Press Limited, provided the work is properly attributed. For permission for commercial use of this work, please see paragraphs 4.2 and 5 of our Terms.