")
Back to Journals » OncoTargets and Therapy » Volume 13
miR-3609 Decelerates the Clearance of Sorafenib in Hepatocellular Carcinoma Cells by Targeting EPAS-1 and Reducing the Activation of the Pregnane X Receptor Pathway
Authors Shao QP, Wei C, Yang J, Zhang WZ
Received 17 January 2020
Accepted for publication 2 July 2020
Published 27 July 2020 Volume 2020:13 Pages 7213—7227
DOI https://doi.org/10.2147/OTT.S246471
Checked for plagiarism Yes
Review by Single anonymous peer review
Peer reviewer comments 2
Editor who approved publication: Dr Jianmin Xu
Qing-Ping Shao,1,* Chen Wei,2,* Jie Yang,3 Wen-Zhou Zhang1
1Department of Pharmacy, The Affiliated Cancer Hospital of Zhengzhou University, Zhengzhou, Henan Province 450008, People’s Republic of China; 2Department of Pediatrics, The Third Affiliated Hospital of Zhengzhou University, Zhengzhou, Henan Province 450052, People’s Republic of China; 3Department of Pharmacy, The First Affiliated Hospital of Zhengzhou University, Zhengzhou, Henan Province 450052, People’s Republic of China
*These authors contributed equally to this work
Correspondence: Wen-Zhou Zhang
Department of Pharmacy The Affiliated Cancer Hospital of Zhengzhou University, No. 127 Dongming Road,Jinshui District, Zhengzhou City, Henan Province, People’s Republic of China
Tel/ Fax +86 371 65587240
Email [email protected]
Background: The pregnane X receptor (PXR) not only plays an important role in cellular metabolism processes but also induces the resistance of hepatocellular carcinoma (HCC) cells to molecularly targeted drugs by mediating their metabolism and clearance by these cells. Endothelial PAS domain-containing protein 1 (EPAS-1) acts as a coactivator to regulate the transcription factor activity of PXR. In the present study, a microRNA that potentially targets EPAS-1, namely miR-3609, was identified using the miRDB tool.
Methods: The expression of miR-3609 and EPAS-1 was examined by qPCR. Lentiviral particles containing the full-length sequences of miR-3609 (pri-miR-3609) were prepared. The antitumor effect of antitumor agents was examined by the in vitro and in vivo assays.
Results: The expression of miR-3609 was negatively correlated with that of EPAS-1 in both HCC clinical specimens and paired non-tumor specimens, and the effect of miR-3609 on the expression of EPAS-1 was confirmed by Western blot experiments. Overexpression of miR-3609 decreased the expression of EPAS-1 and, in turn, repressed the activation of the PXR pathway. miR-3609 decreased the transcription factor activation of PXR, repressed its recruitment to its target gene promoter regions, and decreased the expression of its target genes CYP3A4 and P-GP. In addition, miR-3609 decelerated the metabolism and clearance of sorafenib in HCC cells and enhanced the antitumor effect of sorafenib in HCC cells.
Conclusion: Therefore, the results indicate that miR-3609 decreases the expression of EPAS-1 and enhances the sensitivity of HCC cells to sorafenib.
Keywords: microRNA-3609, molecular targeting agents, endothelial PAS domain-containing protein 1, pregnane X receptor, hepatocellular carcinoma
Introduction
The endothelial PAS domain-containing protein 1 (EPAS-1; also known as hypoxia-inducible transcription factors 2α, or HIF-2α) is a transcription factor that is expressed in several kinds of human cancers. In addition, EPAS-1 functions as a transcription regulator, modulating the activation of other transcription factors.1–3 Previously, EPAS-1 was considered to be a key regulator of hypoxia-related processes, mediating the transcription of hypoxia-related genes by binding to the hypoxia response elements (HRS) located in their promoters.4–6 Recently, increasing data have confirmed that EPAS-1 functions as a positive regulator of hepatocellular carcinoma (HCC) and promotes proliferation and metastasis by up-regulating the activation of several signaling pathways, such as MAPK (mitogen-activated protein kinase) or TGFα (transformation growth factor α) pathways. Furthermore, EPAS-1 additionally acts as an important regulator of multidrug resistance (MDR) in HCC cells by enhancing the activation of PXR pathways, which, in turn, increases the expression of the MDR-related downstream genes of PXR, such as MDR-1 and CYP3A4.7–10 Therefore, EPAS-1 is a promising target for more effective antitumor therapies for HCC.
MicroRNAs are a class of non-coding RNAs, synthesized by RNA polymerase II, that have important physiological functions in cells.11–13 In mammalian cells, miRNAs recognize and bind to miRNA-binding sites at the 3ʹUTR (3ʹ untranslated region) of the mRNA (messenger RNA) of their target genes, in a sequence-specific manner. This results in the degradation of mRNA by Dicer, and plays a role in post-transcriptional gene-silencing.14–17 Therefore, screening for mRNAs that target oncogenes and silence their expression via miRNA activity is an effective antitumor strategy.18–21
Currently, most patients with HCC are diagnosed at the advanced stage of disease (advanced HCC) and therefore miss the opportunity to undergo radical treatment such as surgery.22,23 Moreover, patients with advanced HCC do not exhibit sufficient sensitivity to cytotoxic-chemotherapeutic drugs owing to multidrug resistance.24,25 Therefore, molecular-targeted drugs are still the main strategy for advanced HCC antitumor therapy.26,27 In the present study, a microRNA that potentially targets EPAS-1, namely miR-3609, was identified using an online tool (miRDB), and the expression levels of miR-3609 and EPAS-1 in clinical samples were examined. Lentiviral particles were prepared to overexpress miR-3609 in HCC cells. Overexpression of miR-3609 decreased the activation of transcription factors of the PXR pathway and reduced the rate of clearance of sorafenib in HCC cells by targeting EPAS-1. Moreover, miR-3609 enhanced the sensitivity of HCC cells to molecular targeting agents, including sorafenib.
Materials and Methods
Clinical Specimens and Patient-Derived Cells
The cDNA samples from clinical specimens and patient-derived cells from patients with advanced HCC were gifts from Dr. Fan Feng at the Research Center for Clinical and Translational Medicine, the fifth medical center of the Chinese People’s Liberation Army General Hospital (formerly the 302nd Hospital of Chinese PLA, Beijing, 100039, PR China).28–30 The collection of clinical specimens for the experiments in this study was performed in compliance with the Helsinki Declaration, and written informed consent was obtained from the participating patients. Furthermore, the study received approval by the ethics committee of the fifth medical center of the Chinese People’s Liberation Army General Hospital. For the clinical specimens, cDNA samples from a total of 52 HCC cases were used, as described in our previous study.28–30 In order to obtain patient-derived cells (PDCs), percutaneously punctured tissue samples from the liver were collected from patients who were newly admitted to the hospital, and single-cell suspensions were generated by tissue grinding. Patient-derived HCC cell lines (HCC PDC lines) were thus obtained.30 These HCC PDCs were preserved in liquid nitrogen.30
Cell Lines and Molecular Targeting Agents
MHCC97-H, a highly aggressive HCC cell line, was purchased from the Type Culture Collection of the Chinese Academy of Sciences (Shanghai City, People’s Republic of China), a culture collection center of the Chinese government. Cells were cultured in DMEM (Dulbecco’s Modified Eagle Medium) with 10% FBS (fetal bovine serum) at 37°C under 5% CO2. The molecular targeting agents, namely sorafenib (Cat. No. S7397), lenvatinib (Cat. No. S1164), regorafenib (Cat. No. S1178), apatinib (Cat. No. S5248), and anlotinib (Cat. No. S8726), were purchased from Selleck Corporation, Houston, Texas, USA. For the cell-based experiments, the powdered form of the molecular targeting agents was simply dissolved in dimethyl sulfoxide (DMSO) and diluted with DMEM with 0.5% FBS. For animal experiments, 20 mg of molecular targeting agent powders was carefully dissolved in a solution of 100 µL DMSO, 200 µL Tween 80, and 200 µL polyethylene glycol 400 (PEG 400). Then, the solutions (powders of agents dissolved in organic solvents) were slowly and carefully diluted with physiological saline to a total volume of 10 mL, resulting in a formulation of agents for oral administration/oral liquids, accompanied by ultrasonic processing or churning.31,32 Therefore, the concentration of agents in the formulation/oral liquids of agents for oral administration was ~2 mg/mL.
Quantitative Polymerase Chain Reaction (qPCR)
For reverse transcription and qPCR experiments, RNA samples were extracted from HCC cells using a PARISTM Kit (Thermo Fisher Scientific, Waltham, MA, USA). The RNA samples were reverse-transcribed with a Multiscribe™ Reverse Transcriptase (Thermo Fisher Scientific) agent. Next, qPCR was performed following the methods described by Ji et al and Liang et al.33,34 in order to examine the expression of genes in the cDNA samples from HCC clinical specimens. β-actin mRNA was used as a loading control, and the expression level of target genes relative to that of β-actin was measured. Primers used in the qPCR experiments were as follows: (1) MDR-1 forward sequence 5′-GCTGTCAAGGAAGCCAATGCCT-3′ reverse sequence 5′-TGCAATGGCGATCCTCTGCTTC-3′; (2) CYP3A4 forward sequence 5′-CCGAG TGGATTTCCTTCAGCTG-3′ reverse sequence 5′-TGCTCGTGGTTTCATAGCCAGC-3′; (3) β-actin forward sequence 5′-CACCATTGGCAATGAGCGGTTC-3 ′; reverse sequence 5′-AGGT CTTTGCGGATGTCCACGT-3′. The correlation between the expression of miR-3609 and that of EPAS-1 was determined according to the qPCR results for tumor tissues and the corresponding non-tumor tissues (the paired paracancerous tissues), using the two as the horizontal and vertical coordinates to obtain a scatter plot for further correlation analysis. For paired specimens (the tumor and the paired non-tumor/paired para-tumor tissues), the expression levels of EPAS-1 or miR-3609 in cancer-to-cancer specimens were used as the horizontal and vertical coordinates, respectively, to obtain scatter plots for further correlation analysis. The methods has been added in the methods part (qPCR section).
Plasmids and Luciferase Assays
The luciferase reporters (XREM-Luc, PXRE-Luc, DR3-Luc, and ER6-Luc) used to examine the activation of PXR transcription factors were gifts from Dr. Fan Feng at the Research Center for Clinical and Translational Medicine, the fifth medical center of the Chinese People’s Liberation Army General Hospital; these reporters have been described in his previous publications.28,29 The HCC cells, which were transfected with plasmids, were seeded in 24-well cell culture plates (Corning Incorporated, Corning, NY, USA) using phenol red-free DMEM (Thermo Fisher Scientific) supplemented with 0.5% charcoal-stripped FBS (Hyclone, Logan, Utah, USA). Transfection experiments were performed with Lipofectamine 2000 transfection agent (Thermo Fisher Scientific Corporation, Waltham, MA, USA). Cells were treated with the indicated concentration of rifampicin (10 μmol/L, 3 μmol/L, 1 μmol/L, 0.3 μmol/L, 0.1 μmol/L, 0.03 μmol/L, and 0.01 μmol/L) for 24–48 h. Cells were transfected with plasmids (luciferase reporters) for 24h, and were then harvested to analyze the activation of luciferase and β-galactosidase following the instructions provided by the manufacturer (Promega Corporation, Madison, WI, USA). Results were shown as means ± SD from three independent experiments with similar results.
Antibodies and Western Blot
Antibodies against P-gp (P-glycoprotein), CYP3A4 (Cytochrome P450 3A4), EPAS-1, PXR, and β-actin, and polyclonal anti-rabbit/anti-mouse IgG antibodies conjugated with horseradish peroxidase (HGF), were purchased from Santa Cruz Biotechnology Inc. (Dallas, TX, USA). HCC cells transfected with plasmids or treated with agents were harvested using radio-immunoprecipitation assay (RIPA) buffer, with the addition of protease inhibitor cocktails (Sigma-Aldrich Co., USA). Total protein samples were extracted from HCC cells and analyzed by sodium dodecyl sulfate-polyacrylamide gel electrophoresis (SDS-PAGE). Then, proteins on the SDS-PAGE gels were transferred onto polyvinylidene fluoride (PVDF) membranes (EMD Millipore, Billerica, MA, USA). Next, the membranes (blots) were blocked using 10% bovine serum albumin (BSA) diluted in a Tris saline buffer with Tween 20 (TBST). After blocking, the membranes were incubated for 2h at 37°C with rabbit primary antibody against P-gp (1:2000 dilution), CYP3A4 (1:1000 dilution), EPAS-1 (1:1000 dilution), PXR (1:2000 dilution), and β-actin (1:5000 dilution) diluted in TBST buffer containing 5% BSA. After incubating with the primary antibodies, the membranes were subsequently washed with TBST three times (5 min each time). After being washed, the membranes were incubated with the secondary antibodies (the horseradish peroxidase [HRP]-conjugated antibodies [1:5000 dilution]) diluted in TBST. After incubation with the secondary antibody, the membranes were again washed with TBST three times (5 min each time). Finally, the membranes were developed with enhanced chemiluminescence reagents (Thermo Fisher Scientific Corporation, Waltham, MA, USA) using X-ray films. The Western blot experiments were performed three times independently, with similar results.
Chromatin Immunoprecipitation
Rifampicin (Cat. No. S1764) was used as a PXR agonist. Rifampicin powder was dissolved in DMSO and diluted with phenol red-free DMEM. The solution, comprising 1% DMSO diluted with phenol red-free DMEM, was used as the solvent control. To examine the recruitment of PXR and EPAS-1 to the DNA-binding elements of PXR located in the promoter and enhancer regions of CYP3a4, a typical downstream gene of PXR, chromatin immunoprecipitation (ChIP) assays were performed according to protocols described in previous publications.28,29 HCC cells, which were transfected with plasmids or treated with agent compounds (solvent control or PXR’s agonist) for 30 min to 1h, were fixed by adding formaldehyde (4%) to the medium. After cross-linking, glycine was added to a final concentration of 125 mmol/L, and the HCC cells were harvested with a lysis buffer. The nuclear sub-fractions of HCC cells were pelleted by centrifugation and resuspended using a nuclear lysis buffer. Then, the nuclear lysates were sonicated to generate DNA fragments, about 0.5–1 kb in length, and ChIP experiments were performed using the antibodies against PXR and EPAS-1. The binding of PXR and EPAS-1 to the DNA fraction was examined by qPCR. The primers used in ChIP experiments included forward sequences of the cyp3a4 promoter: 5′-GGTTTCTCTGGAAGCCCTGTAG-3′; reverse sequence 5′-GTTTGCACCCGGACCGGTCAC-3′; cyp3a4 enhancer forward sequence 5′-GGTTTCTCTGGAAGCCCTGTAG-3′; reverse sequence 5′-GTTTGCACCCGGACCGGTCAC-3′; input genomic DNA forward 5′-GTGTCTGTCTGCTCGGGCTTCTGTG-3′; reverse 5′-GCAGGTCCAAGTCACACAGGAAATG-3′.
Cell Survival Assay
The inhibitory action of the molecular targeting agents on HCC cell survival was examined by MTT (3-[4,5-dimethyl-2-thiazolyl]-2,5-diphenyl-2-H-tetrazolium bromide, Thiazolyl Blue Tetrazolium Bromide) assay. The HCC cells were seeded into 96-well plates (8000 cells per well) and treated with the indicated concentrations of molecular targeting agents (10 μmol/L, 3 μmol/L, 1 μmol/L, 0.3 μmol/L, 0.1 μmol/L, 0.03 μmol/L and 0.01 μmol/L). Then, the drugs were diluted with DMEM (Thermo Fisher Scientific). Next, the MTT assay was performed, and the inhibition rates and IC50 values were calculated following methods described in previous studies.36–38
Pharmacokinetic Experiments
The metabolism and clearance of sorafenib in HCC cells were examined. For the cell-based experiments, cells were treated with 1 μmol/L sorafenib for 12 h. Then, the cells were harvested at the indicated time points, and the sorafenib was extracted from the cells with acetonitrile (ACN). The amount of sorafenib in the HCC cells was measured using liquid chromatography–mass spectrometry/mass spectrometry (LC-MS/MS) methods.39,40 For the animal experiments, a subcutaneous tumor model of HCC cells was established in nude mice. The animal experiments and methods were approved by the Institutional Animal Care and Use Committee, and all experiments were performed in accordance with the UK Animals (Scientific Procedures) Act, 1986, and associated guidelines. Nude mice (T-cell deficient mice), aged 4–6 weeks, were purchased from the Si-Bei-Fu Biotechnology Corporation (Beijing, People’s Republic of China). HCC cells were cultured and injected subcutaneously into the nude mice (1×10⁶ cells for each animal). After 3 to 4 weeks of growth, the sorafenib solution (2 mg/kg concentration) was injected into the subcutaneous tumors (50 μmol/L). Then, tumor tissues were harvested at indicated time points (0-time, 4h, 8h, 12h, 18h, 24h, 26h, 48h and 72h time-points for cell-based experiments; 0-time. 12h, 24h, 36h, 48h, 60h, 72h and 84h time-points for animal experiments). The amount of sorafenib in the tumors was measured using LC-MS/MS.40,41
The Luciferase Experiments
The two sequences (1–300nt or the 661–960nt) of the 3ʹUTR of EPAS-1, containing the miR-3609 targeting sites or the mutated targeting sites, were cloned into the pGL-4.26 vectors. The two vectors were dubbed Luc-1 (Luc-1Mut) and Luc-2 (Luc-2Mut). HCC cells were transfected with control, miR-3609, and luciferase reporters, and used for luciferase reporter assays.35,40
The Antitumor Effect of Sorafenib in vivo
The antitumor effects of sorafenib on HCC cells were examined in vivo using a subcutaneous tumor model. HCC cells were cultured and injected into nude mice (1×10⁶ cells for each animal). Three to 4 days after injection, the mice received the indicated concentration of molecular targeting agent (including sorafenib) treatment via oral administration, every 2 days. After 10 treatments (over 21 days), the nude mice and their subcutaneous tumor tissues were harvested. The volumes and weights of tumor tissues were examined following previously described methods.42,43 The rates of suppression of tumor volumes and tumor weights by the agents were calculated as (control group’s tumor volume or tumor weight - experimental group’s tumor volume or tumor weight)/(control group’s tumor volume or tumor weight) × 100%.
Statistical Analysis
Analyses of statistical significance were performed using SPSS 9.0 (Statistical Product and Service Solutions Software, IBM Corporation, Armonk, NY, USA) statistical software by two-way ANOVA with Bonferroni correction; paired samples were tested using the paired-sample t-test. The IC50 values of agents for HCC cells and the half-life time (t1/2) values of sorafenib retention in HCC cells were calculated using Origin software (Origin 6.1; OriginLab Corporation, Northampton, MA, USA).
Results
miR-3609 Potentially Targets EPAS-1 by Binding Its 3′UTR
First, the relationship between EPAS-1 and the prognosis of patients who received sorafenib was examined. As shown in Figure 1A and B, the expression of EPAS-1 was examined in the HCC clinical specimens, and patients were divided into two groups: EPAS-1-low and EPAS-1-high. The results showed that the EPAS-1-high group patients had poorer prognoses than those in the EPAS-1-low group (Figure 1A, B and Table 1). Next, using an online tool, miRDB, miR-3609 was shown to potentially target EPAS-1 by binding its 3′UTR, and the potential binding of miR-3609 to EPAS-1 is shown in Figure 1C. To examine whether miR-3609 is associated with the prognosis of patients who received sorafenib treatment, the expression levels of miR-3609 and EPAS-1 were examined in the HCC clinical specimens. As shown in Figure 1C and D and Table 1, patients were divided into the following groups according to the median value of the expression level of miR-3609: an miR-3609-low group and miR-3609-high group. The miR-3609-low group patients had a poorer prognosis than the miR-3609-high group (Figure 1 and Table 2).
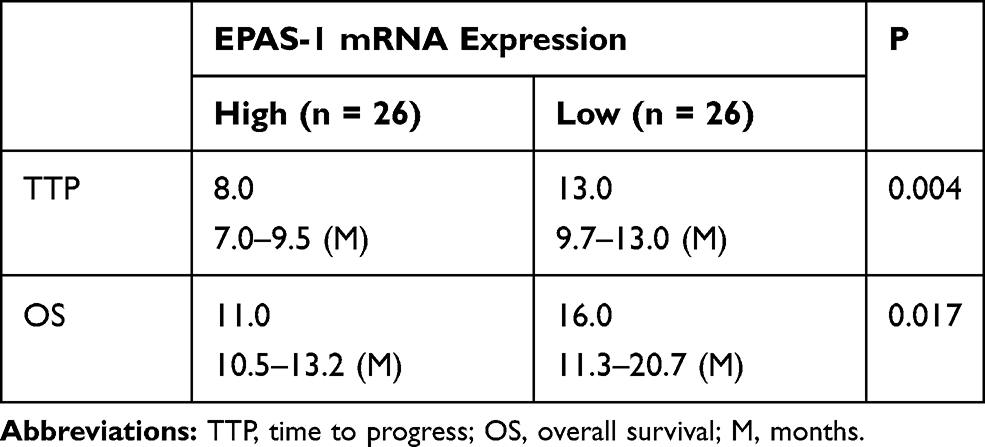 |
Table 1 EPAS-1 Expression and Clinical Outcome of Patients Received Sorafenib Treatment |
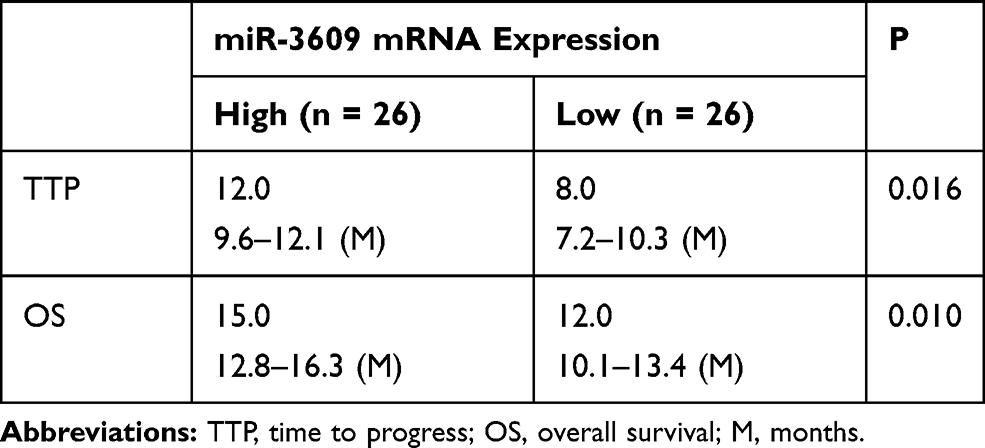 |
Table 2 miR-3609 Expression and Clinical Outcome of Patients Received Sorafenib Treatment |
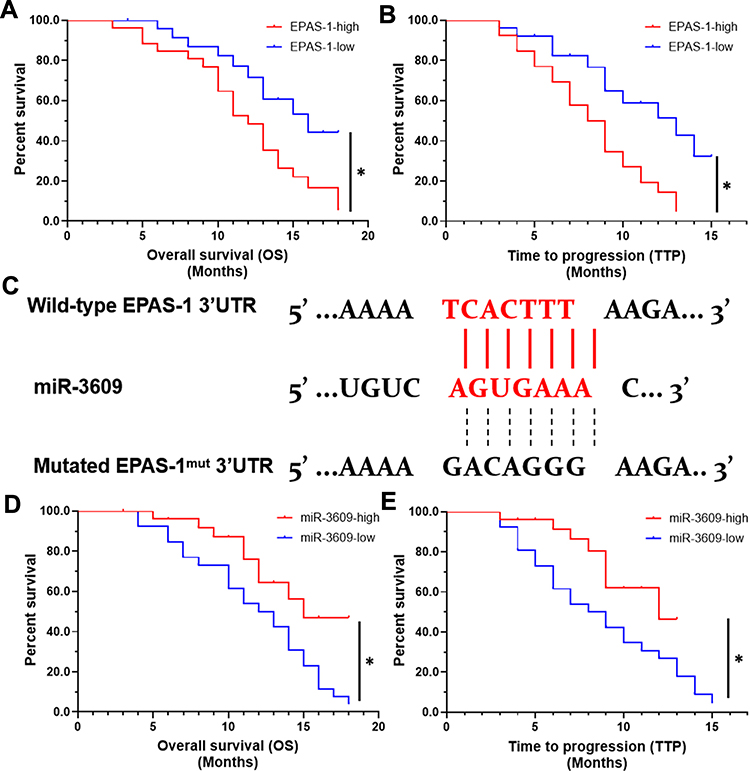 |
Figure 1 The association between the expression of the miR-3609/EPAS-1 axis with the prognosis of advanced HCC patients after receiving sorafenib treatment. The expression of EPAS-1 and miR-3609 in clinical specimens was examined, and the patients were divided into two groups according to the median expression level (high or low). The OS (overall survival) and TTP (time to progress) of patients were analyzed. (A and B) The prognosis of patients with high endogenous EPAS-1 expression (EPAS-1-high) or low endogenous EPAS-1 expression (EPAS-1-low). (C) The potential binding sites of miR-3609 in the 3′UTR of the epas-1 mRNA. (D and E) Prognosis of patients with high endogenous miR-3609 expression (miR-3609-high) or low endogenous miR-3609 expression (miR-3609-low); *P < 0.05. |
In addition, the relationship between EPAS-1 and miR-3609 in clinical specimens was examined. As shown in Figure 2 A and B, the expression of EPAS-1 (Figure 2A) and miR-3609 (Figure 2B) in HCC clinical specimens was negatively correlated with their expression in paired non-tumor tissues. The expression of miR-3609 was also was negatively associated with that of EPAS-1 in both HCC clinical specimens (Figure 2C) and the paired non-tumor tissues (Figure 2D). Lentiviral particles containing the full length of miR-3609 were then prepared in order to overexpress miR-3609 in MHCC97-H, a highly aggressive HCC cell line that expresses the highest level of EPAS-1 compared with other hepatic cell lines (Figure 2E). As shown in Figure 2F, overexpression of miR-3609 repressed the expression of EPAS-1. Transfection with an inhibitor of miR-6077 and EPAS-1 with mutated miR-3609-targeting sites (dubbed EPAS-1Mut) almost fully abrogated the repressing effect of miR-3609 on EPAS-1 expression (Figure 2F and F). Similar results were obtained from the luciferase assay, in that miR-3609 was found to repress the activation of the luciferase reporter containing the 3′UTR region of EPAS-1 with the miR-3609 targeting site but not the mutated miR-3609 targeting site (Supplemental Figure 1). Therefore, these findings show that miR-3609 targets the 3′UTR of EPAS-1.
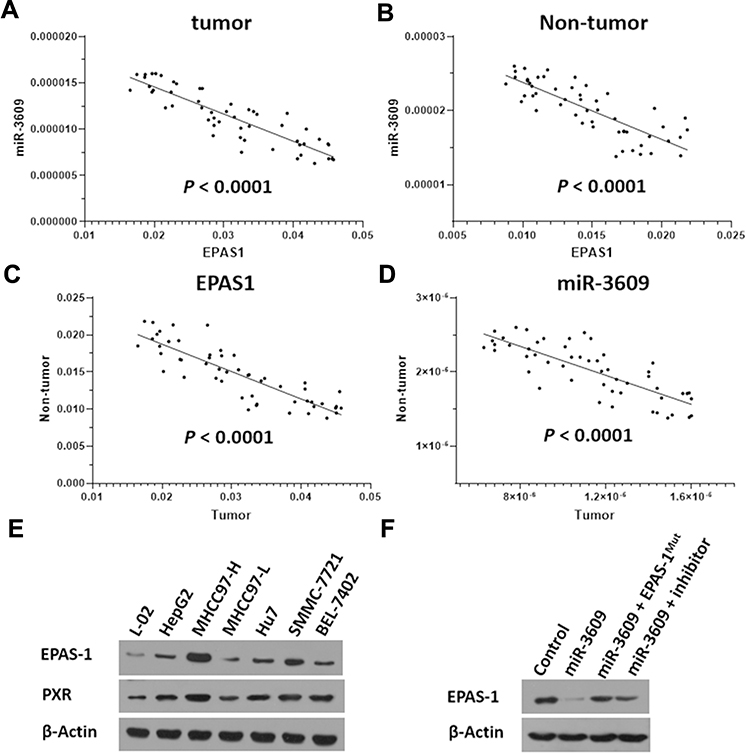 |
Figure 2 Relationship between the expression of miR-3609 and EPAS-1 in HCC clinical specimens. The expression of miR-3609 and EPAS-1 was examined in the paired tumor/non-tumor clinical specimens. The relationship between the expression of EPAS-1 and miR-3609 in HCC clinical specimens (A) and the paired non-tumor tissues (B) is shown as scatter images. The abscissa represents the expression level of EPAS-1 in the same tissue; the ordinate is the expression level of miR-3609 in the same tissue. The relationship between EPAS-1 (C) and miR-3609 (D) in paired HCC clinical specimens and the paired non-tumor tissues is shown as scatter images. The abscissa represents the expression level of EPAS-1 or miR-3609 in paired specimens (HCC clinical specimens); the ordinate is the expression of EPAS-1 or miR-3609 in paired specimens (the non-tumor specimens). (E) The endogenous expression of EPAS-1 in hepatic cell lines was examined through a Western blot experiment. (F) MHCC97-H cells, which were transfected with the control, miR-3609, miR-3609 + EPAS-1Mut, or miR-3609 + inhibitor, were harvested for Western blot. β-Actin was used as the loading control. |
miR-3609 Inhibits the Activation of PXR Pathway by Targeting EPAS-1
Based on previous evidence that EPAS-1 functions as a coactivator of PXR, the effect of miR-3609-mediated downregulation of EPAS-1 expression on the transcription factor activation of PXR was examined. As shown in Table 3, rifampicin, a typical agonist of PXR, induced transcription factor activation in a dose-dependent manner. The overexpression of miR-3609 repressed the agonistic effect of rifampicin on the activation of PXR, and the EC50 (half-effective concentration/concentration of the 50% effective activation) values were increased (Table 3). Transfection with an inhibitor of miR-3609 or EPAS-1 with mutated miR-3609-targeting sites (dubbed EPAS-1Mut) almost fully blocked the repression of PXR activation by miR-3609 (Table 3).
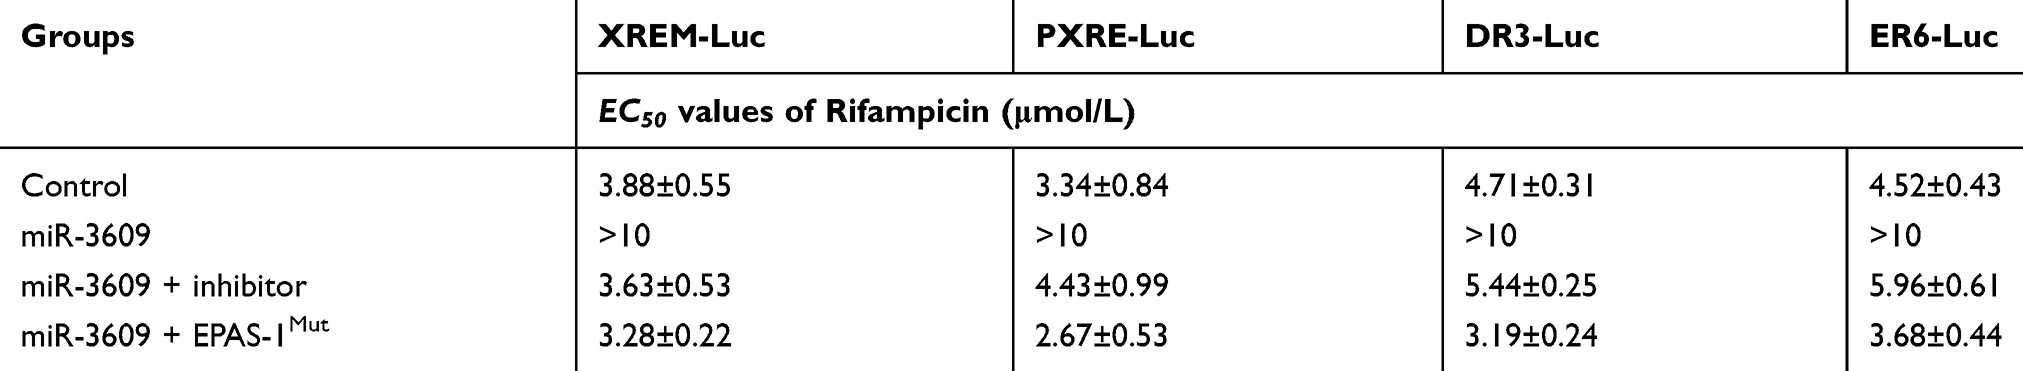 |
Table 3 The Effect of miR-3609 on PXR’s Transcription Factor Activation |
Next, the effect of miR-3609 on the expression of the MDR-related target genes of PXR was examined. As shown in Figure 3, rifampicin induced the expression of P-GP and CYP3A4. Overexpression of miR-3069 decreased the expression of f P-GP and CYP3A4 induced by rifampicin (Figure 3). Transfection with an inhibitor of miR-3609 or EPAS-1 with mutated miR-3609-targeting sites (dubbed EPAS-1Mut) almost fully blocked the repressing effect of miR-3609 (Figure 3). The EC50 values for the effect of rifampicin on the mRNA level in MHCC97-H cells and the five HCC PDC lines are shown in Supplemental Table 1.
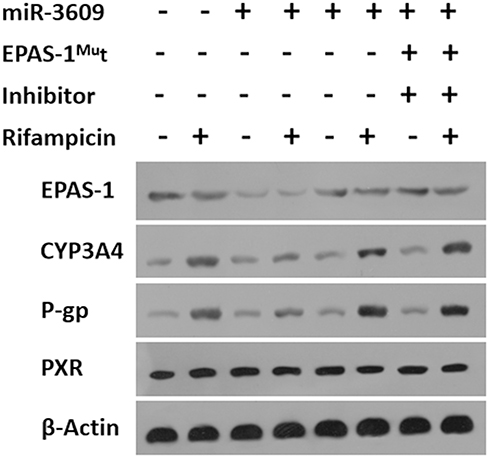 |
Figure 3 miR-3609 repressed the expression of drug resistance–related genes downstream of PXR. MHCC97-H cells, which were transfected with control, miR-3609, miR-3609 + EPAS-1Mut, or miR-3609 + inhibitor, were treated with solvent control or rifampicin. Then, cells were harvested for Western blot analysis. The expression levels of EPAS-1, CYP3A4, P-gp, PXR, and β-Actin were examined using antibodies against these proteins. β-Actin was used as the loading control. |
Because PXR is a transcription factor/nuclear receptor whose activity relies on its nuclear accumulation and recruitment to the promoters of its target genes, cellular sub-fraction and ChIP experiments were performed. As shown in Figure 4, rifampicin (5 µmol/L concentration) induced the nuclear accumulation of PXR and its recruitment to the promoter/enhancer regions of cyp3a4. Overexpression of miR-3069 decreased the nuclear accumulation of PXR in the nuclear fraction and attenuated the rifampicin-induced recruitment of PXR to cyp3a4’s promoter/enhancer regions (Figures 4 and 5). Transfection with an inhibitor of miR-3609 and EPAS-1 with mutated miR-3609-targeting sites (dubbed EPAS-1Mut) almost fully blocked the repressing effect of miR-3609 (Figures 4 and 5).
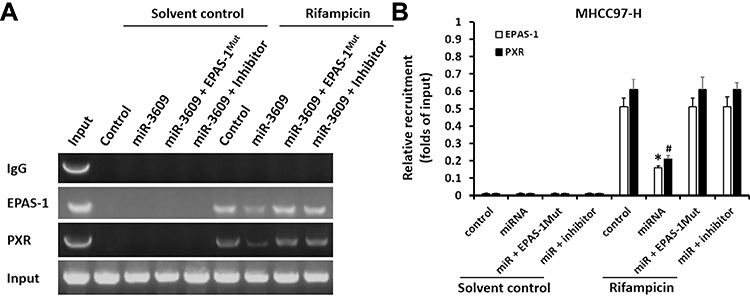 |
Figure 4 miR-3609 inhibited the recruitment of PXR to the promoter region (+4 ~ −354, PXRE region) of its target gene cyp3a4ʹ. MHCC97-H cells, which were transfected with control, miR-3609, miR-3609 + EPAS-1Mut, or miR-3609 + inhibitor, were treated with solvent control or rifampicin. Then, cells were harvested for chromatin immunoprecipitation (ChIP) analysis. The recruitment of PXR to its downstream gene cyp3a4ʹ promoter region (+4 ~ −354, PXRE region) is shown in DNA electrophoresis images (A) or assessed by quantitative analysis of the DNA electrophoresis images (B). *P < 0.05 versus the recruitment of EPAS-1 in the miR-3609 group with control, miR-3609 + EPAS-1Mut, or miR-3609 + inhibitor groups; #P < 0.05 versus the recruitment of PXR in miR-3609 group, with control, miR-3609 + EPAS-1Mut, or miR-3609 + inhibitor groups. |
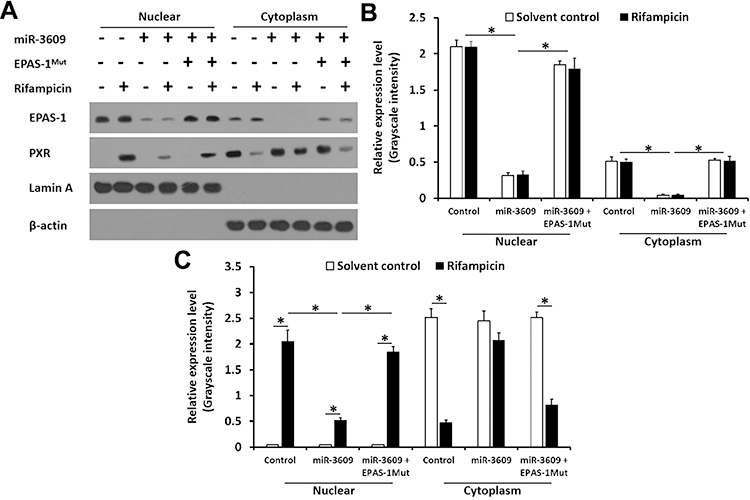 |
Figure 5 miR-3609 repressed the nuclear accumulation of PXR. MHCC97-H cells transfected with control, miR-3609, miR-3609 + EPAS-1Mut or miR-3609 + inhibitor, were treated with solvent control or rifampicin. Then, cells were harvested for cellular sub-fraction analysis. The accumulation of EPAS-1 or PXR in the nuclear fraction was shown in Western blot images (A) and by quantitative analysis (B and C). The protein levels of PXR, EPAS-1, Lamin A, and β-Actin were examined using their antibodies. Lamin A was used as the nuclear indicator, and β-actin was used as the cytoplasm indicator; *P < 0.05. |
miR-3609 Reduces the Rate of Metabolism and Clearance of Sorafenib in HCC Cells
The MDR-related target genes of PXR generally encode drug-metabolizing enzymes; therefore, the metabolism and clearance of sorafenib in HCC cells warrant attention. The clearance of sorafenib in HCC cells was examined using LC-MS/MS methods. As shown in Figure 6, sorafenib was gradually metabolized and cleared in HCC cells. Overexpression of miR-3069 reduced the rate of metabolism and clearance of sorafenib in cultured HCC cells (Figure 6), and the half-life time (t1/2) of sorafenib in HCC cells was correspondingly prolonged (Table 4). The results are shown as a drug-retention curve for sorafenib in MHCC97-H cells (Figure 6) and the half-life time (t1/2) of sorafenib in MHCC97-H and five HCC PDC lines (Table 4). Transfection of EPAS-1 with mutated miR-3609-targeting sites (dubbed EPAS-1Mut) almost fully blocked the effect of miR-3609. Furthermore, similar subcutaneous tumor formation data were obtained (Figure 6 and Table 4). Therefore, miR-3609 was found to reduce the rate of metabolism and clearance of sorafenib in HCC cells.
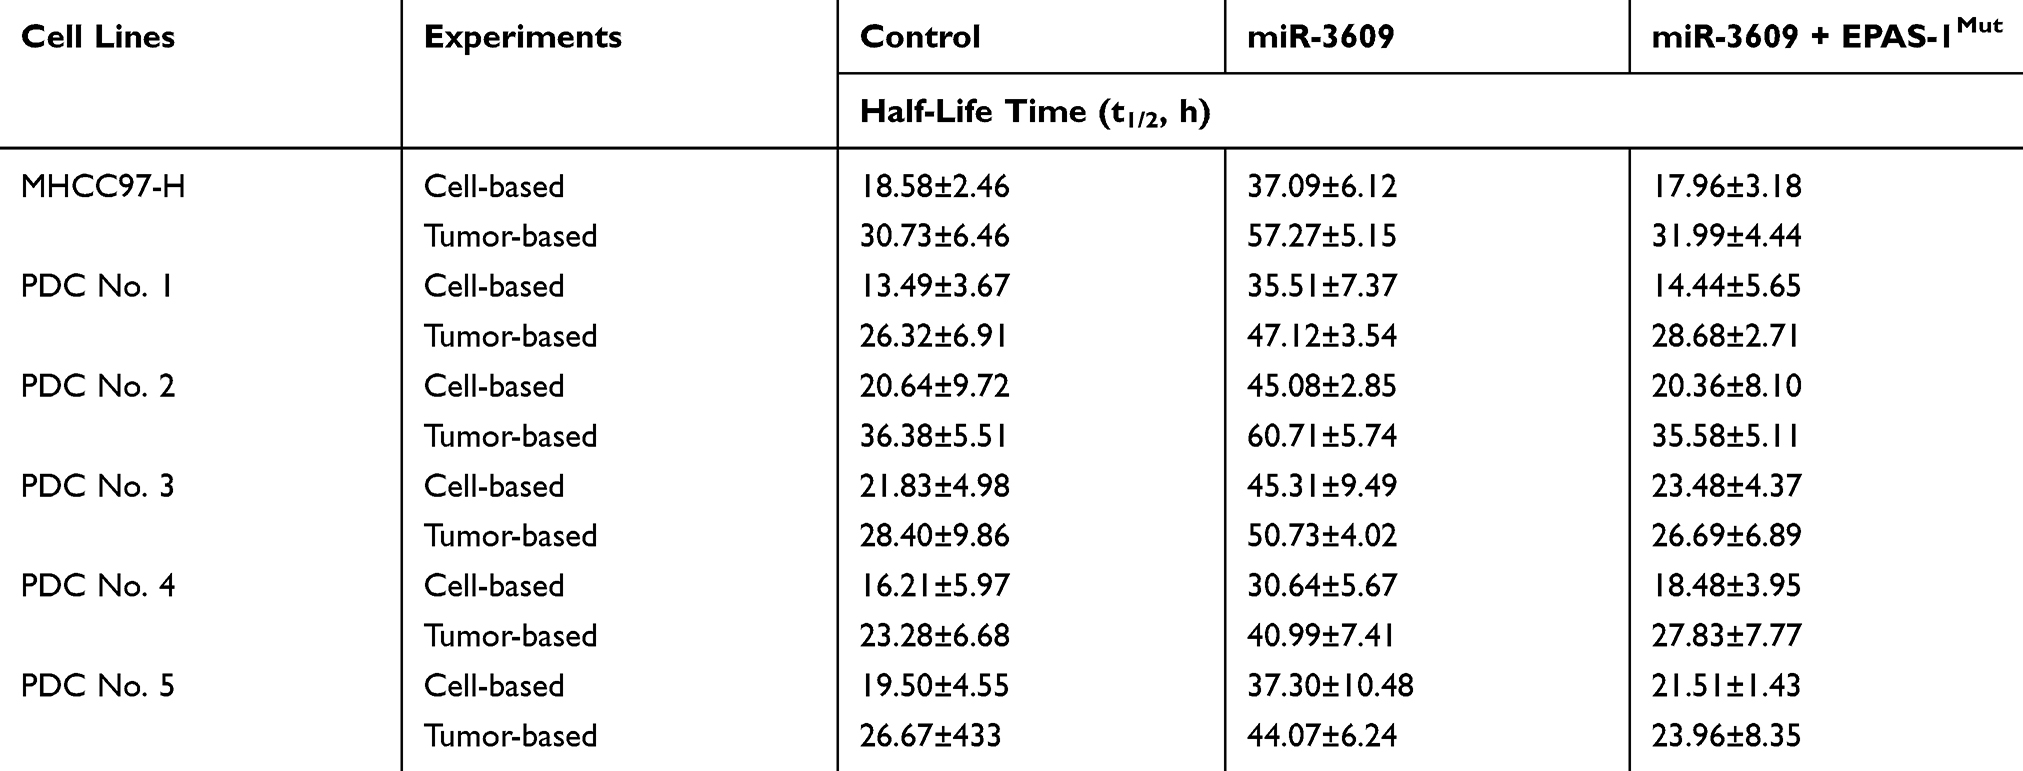 |
Table 4 The Effect of miR-3609 on Sorafenib’s Metabolism or Clearance in HCC Cells’ Survival |
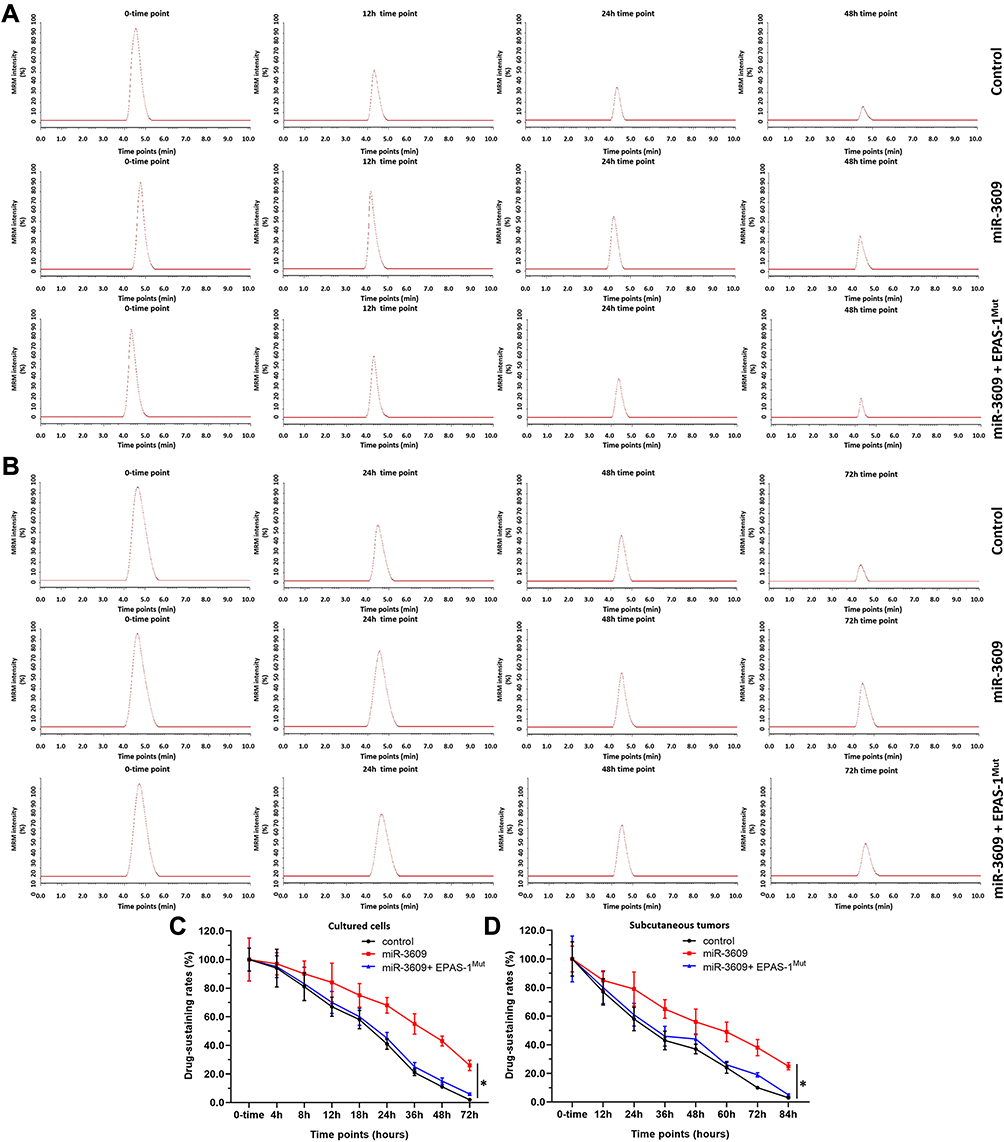 |
Figure 6 miR-3609 reduced the rate of metabolism and clearance of sorafenib in MHCC97-H cells. MHCC97-H cells were transfected with control, miR-3609, miR-3609 + EPAS-1Mut, or miR-3609 + inhibitor. For the cultured cell model, cells were cultured with 1 μmol/L sorafenib (A and C). For the subcutaneous model, cells were injected into nude mice to form subcutaneous tumors, and the tumor tissues formed by HCC cells were injected with sorafenib solution (B and D). Next, the cell samples and tumor tissues were collected at indicated time points, and the retention of sorafenib in the samples was analyzed by LC-MS/MS. Results are shown as representative images of LC-MS/MS (A and B) and the retention-curves for sorafenib in HCC cultured cells (C) or the subcutaneous tumors (D). *P < 0.05. |
miR-3609 Enhances the Antitumor Effect of Sorafenib on HCC Cells
To examine the antitumor effect of sorafenib in HCC cells, MTT assays were conducted. As shown in Supplemental Table 2, sorafenib inhibited the survival of MHCC97-H cells in a dose-dependent manner. Overexpression of miR-3609 enhanced the antitumor effect of sorafenib on MHCC97-H cells, and the IC50 values of sorafenib on MHCC97-H cells were decreased. Transfection with the miR-3609 inhibitor and EPAS-1 with mutated miR-3609-targeting sites (dubbed EPAS-1Mut) almost fully blocked the effect of miR-3609 (Supplemental Table 2). Overexpression of miR-3609 also enhanced the antitumor effect of other molecular targeting agents on MHCC97-H cells. Similar results were obtained in the five HCC PDC lines (Supplemental Table 2).
To further examine the in vivo effect of miR-3609, the nude mice HCC subcutaneous models were used. As shown in Figure 7, sorafenib inhibited the subcutaneous growth of MHCC97-H cells in a dose-dependent manner, and overexpression of miR-3609 enhanced the antitumor effect of sorafenib In MHCC97-H cells. The IC50 values for this effect of sorafenib on MHCC97-H cells decreased (Table 5). Transfection with the inhibitor of miR-3609 and EPAS-1 with mutated miR-3609-targeting sites (dubbed EPAS-1Mut) almost fully abrogated this effect of miR-3609 (Table 5). Overexpression of miR-3609 also enhanced the antitumor effect of other molecular targeting agents on the subcutaneous growth of MHCC97-H cells. Similar results were obtained in the five HCC PDC lines (Table 5).
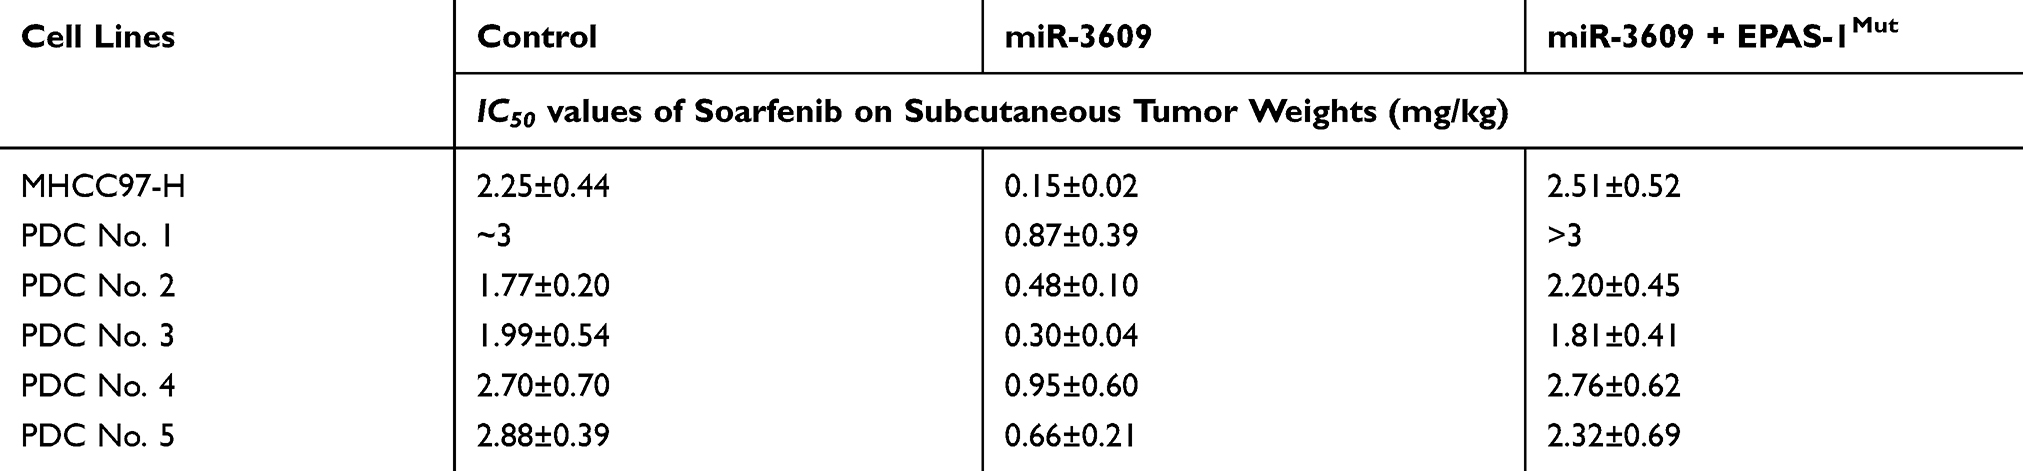 |
Table 5 The Effect of miR-3609 on Sorafenib’s Antitumor Effect on HCC Cells’ Subcutaneous Growth |
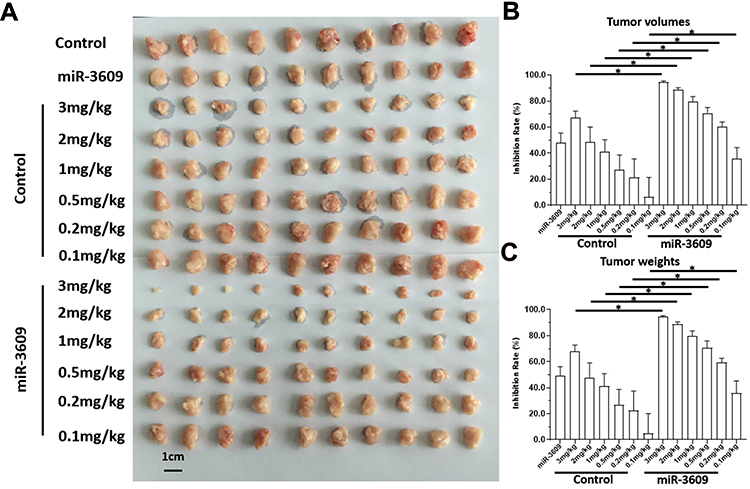 |
Figure 7 miR-3609 enhanced the in vivo antitumor effects of sorafenib in nude mice. MHCC97-H cells transfected with miR-3609 were injected subcutaneously into nude mice to form tumor tissues. Mice received sorafenib treatment via oral administration. After treatment, the mice were harvested, and the tumor tissues collected. Images of tumor tissues are shown (A) and the inhibitory rates calculated by tumor volumes (B) or tumor weights (C) are indicated; *P < 0.05. |
To further examine the effect of miR-3609, other molecular targeting agents were used. As shown in Supplemental Table 3, miR-3609 enhanced the sensitivity of MHCC97-H cells to the molecular targeting agents regorafenib, lenvatinib, apatinib, and anlotinib, and the IC50 of these agents were decreased. Transfection of an inhibitor of miR-3609 or EPAS-1Mut decreased the effect of miR-3609. Therefore, overexpression of miR-3609 decreased the activation of PXR and enhanced the sensitivity of HCC cells to molecular targeting agents.
Discussion
HCC remains one of the most frequent malignancies in China, which has a high hepatitis rate, including infections due to hepatitis B virus [HBV] and hepatitis C virus [HCV].44–46 A large proportion of HCC patients are already in the advanced stage of the disease (advanced HCC) when initially diagnosed, and have a poor prognosis because of multidrug resistance, which makes these patients insensitive to the traditional cytotoxic-chemotherapeutic agents.47,48 Currently, molecular targeting therapies, such as sorafenib and lenvatinib (first-line agents) and regorafenib (a second-line agent) are the only antitumor drugs available for advanced HCC.49–53 Although molecular targeting agents are promising therapeutic options, they have several limitations: patients show individual differences in sensitivity to molecular targeting agents, and are prone to developing drug resistance during treatment.54 It has been reported that several mechanisms may contribute to drug resistance in advanced HCC treatment; these include signaling pathways, including Notch pathways, EMT, and cancer stem cells related signaling pathway.54 The present results show that EPAS-1 may be a promising target for enhancing the antitumor effect of molecular targeting agents on HCC cells (Figure 8). Overexpression of miR-3609, a microRNA that potentially targets EPAS-1, enhanced the antitumor effect of molecular targeting agents on HCC cells by decreasing PXR activation. These results not only expand our understanding of EPAS-1, but also contribute to the development of safer and more effective HCC molecular-targeted therapeutic strategies.
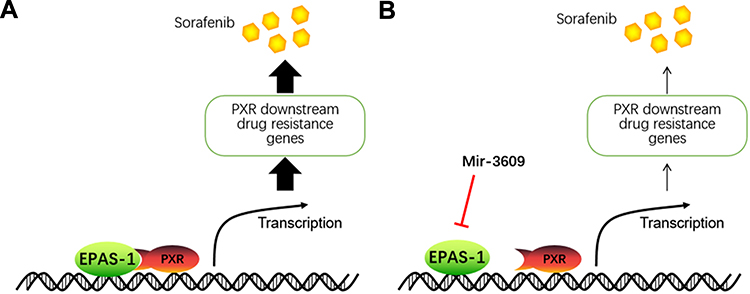 |
Figure 8 The proposed model of the present study. (A) EPAS-1 functions as a co-activator of PXR and enhances the activation of PXR to mediate the expression of the downstream drug-related genes of PXR, resulting in accelerated metabolism or clearance of sorafenib in HCC cells. (B) miR-3609 inhibits the expression of EPAS-1, resulting in the down-regulation of the PXR pathway to reduce the rate of metabolism or clearance of sorafenib in HCC cells. The overexpression of miR-3609 enhances the sensitivity of HCC cells to sorafenib. |
It has been reported that the metabolism-dependent elimination of sorafenib (ie, the metabolism and clearance of sorafenib) mediated by the PXR signaling pathway plays an important role in sorafenib-resistance in HCC cells.28,29 As a member of the nuclear receptor protein family, PXR can function as a transcription factor to mediate the transcription of its target genes, which encode metabolizing and detoxifying enzymes such as P-GP and CYP3A4.55,56 These enzymes not only participate in the metabolism and detoxification of exogenous toxicants, but also induce drug resistance via metabolism-dependent elimination of the drug during treatment.55,56 The activation of PXR is regulated by both ligands and co-regulators.55,56 Zhao et al (2016) reported that EPAS-1 interacts with PXR and functions as a PXR coactivator.10
In the present study, overexpression of miR-3609 decreased the activation of the PXR pathway by repressing the expression of EPAS-1, and enhanced the antitumor effect of molecular targeting agents. Furthermore, overexpression of miR-3609 not only decreased the expression of MDR-related genes but also reduced the rate of metabolism-dependent elimination of sorafenib in HCC cells. This study not only examines MDR-related protein expression but also directly investigates the metabolism and clearance of sorafenib in HCC cells. The results enable a more comprehensive study of sorafenib tolerance. Sorafenib has been widely used in clinical practice, and more information on its drug characteristics is available; in comparison, regorafenib and lenvatinib have been in use for a shorter period, and therefore less corresponding information exists for these drugs. This study examined the metabolism and scavenging effects of sorafenib in HCC cells. LC-MS/MS detection methods for the analysis of other molecularly targeted drugs will be established in future for similar studies.
Recently, the alteration of micro-environments of tumor tissues mediated by increased metabolism, termed “the Warburg effect”, which is characterized by elevated glucose uptake, has been considered a potential mechanism underlying drug resistance.57–59 The aberrant metabolism of human cancer cells not only involves markedly high levels of glycolysis and glucose absorption, even at normal oxygen concentrations, but also induces the alteration of the micro-environment, metastasis, or drug resistance of cells because of the accumulation of lactate.60–62 Inhibition of the Warburg effect has been considered as a potential antitumor treatment strategy.63,64 For example, Yin et al (2019) reported that repressing the activation of SREBP-1 enhanced the sensitivity of HCC cells to sorafenib by suppressing the Warburg effect in HCC cells.65 Ma et al (2019) showed that miR-6077 enhanced the sensitivity of NSCLC cells to lenvatinib by repressing the expression of GLUT1.66 Furthermore, other strategies to inhibit the Warburg effect in tumor cells are available; these include: (1) construction of lentivirus vectors of miRNAs to inhibit the expression and activation of metabolism-related pathways, including hypoxia-inducible factor and c-MYC;67–73 and (2) developing antibodies and small molecular inhibitors of metabolism-related pathways.74,75
EPAS-1 is also referred to as hypoxia-inducible transcription factor 2α and plays an important role in several intracellular processes such as vascular remodeling, fibro-genesis and hypoxia-inducible process. The function of EPAS-1 is related, but different from, that of HIF1α (hypoxia-inducible transcription factors 1α).76,77 The results of the present study and those of Zhao et al (2016) show that EPAS-1 can up-regulate PXR activity as a coactivator.10 These results not only link the hypoxia-responsive signaling pathways to cellular metabolism-related mechanisms but also provide new experimental data for HCC treatment. Further, this study provides novel insights into the roles of miRs in HCC and other cancers.78–80
Conclusion
Overexpression of miR-3609 reduces the rate of clearance of sorafenib in HCC cells by targeting EPAS-1 and reducing the activation of PXR pathways. Therefore, EPAS-1 represents a promising molecular candidate for gene targeting therapy to overcome drug resistance during HCC treatment.
Acknowledgments
The authors thank Dr. Yu Cao in Department of Immunology, H. Lee Moffitt Cancer Center & Research Institute, Tampa, FL, 33612, USA for his helpful advice.
Author Contributions
All authors made substantial contributions to the design and conception, acquisition, analysis, or interpretation of data. All authors took part in either drafting or revising the manuscript. All authors also gave final approval of the version to be published and agree to be accountable for all aspects of the study in ensuring that questions related to the accuracy or integrity of any part of the study are appropriately investigated and resolved.
Disclosure
The authors report no conflicts of interest in this study.
References
1. Chen W, Hill H, Christie A, et al. Targeting renal cell carcinoma with a HIF-2 antagonist. Nature. 2016;539(7627):112–117. doi:10.1038/nature19796
2. Xu J, Zheng L, Chen J, et al. Increasing AR by HIF-2α inhibitor (PT-2385) overcomes the side-effects of sorafenib by suppressing hepatocellular carcinoma invasion via alteration of pSTAT3, pAKT and pERK signals. Cell Death Dis. 2017;8(10):e3095. doi:10.1038/cddis.2017.411
3. Kochan-Jamrozy K, Króliczewski J, Moszyńska A, Collawn JF, Bartoszewski R. miRNA netstudys modulate human endothelial cell adaptation to cyclic hypoxia. Cell Signal. 2019;54:150–160. doi:10.1016/j.cellsig.2018.11.020
4. Zhang S, Zhao L, Wang J, Chen N, Yan J, Pan X. HIF-2α and Oct4 have synergistic effects on survival and myocardial repair of very small embryonic-like mesenchymal stem cells in infarcted hearts. Cell Death Dis. 2017;8(1):e2548. doi:10.1038/cddis.2016.480
5. Miikkulainen P, Högel H, Seyednasrollah F, Rantanen K, Elo LL, Jaakkola PM. Hypoxia-inducible factor (HIF)-prolyl hydroxylase 3 (PHD3) maintains high HIF2A mRNA levels in clear cell renal cell carcinoma. J Biol Chem. 2019;294(10):3760–3771. doi:10.1074/jbc.RA118.004902
6. Childebayeva A, Jones TR, Goodrich JM, et al. LINE-1 and EPAS-1 DNA methylation associations with high-altitude exposure. Epigenetics. 2019;14(1):1–15. doi:10.1080/15592294.2018.1561117
7. Westerlund I, Shi Y, Holmberg J. EPAS-1/HIF2α correlates with features of low-risk neuroblastoma and with adrenal chromaffin cell differentiation during sympathoadrenal development. Biochem Biophys Res Commun. 2019;508(4):1233–1239. doi:10.1016/j.bbrc.2018.12.076
8. Feng Z, Zou X, Chen Y, Wang H, Duan Y, Bruick RK. Modulation of HIF-2α PAS-B domain contributes to physiological responses. Proc Natl Acad Sci USA. 2018;115(52):13240–13245. doi:10.1073/pnas.1810897115
9. Zheng X, Zhang Y, Liu Y, et al. HIF-2α activated lncRNA NEAT1 promotes hepatocellular carcinoma cell invasion and metastasis by affecting the epithelial-mesenchymal transition. J Cell Biochem. 2018;119:3247–3256. doi:10.1002/jcb.26481
10. Zhao J, Bai Z, Feng F, et al. Cross-talk between EPAS-1/HIF-2α and PXR signaling pathway regulates multi-drug resistance of stomach cancer cell. Int J Biochem Cell Biol. 2016;72:73–88. doi:10.1016/j.biocel.2016.01.006
11. Seeley JJ, Baker RG, Mohamed G, et al. Induction of innate immune memory via microRNA targeting of chromatin remodelling factors. Nature. 2018;559(7712):114–119. doi:10.1038/s41586-018-0253-5
12. Ho KH, Cheng CH, Chou CM, et al. miR-140 targeting CTSB signaling suppresses the mesenchymal transition and enhances temozolomide cytotoxicity in glioblastoma multiforme. Pharmacol Res. 2019;147:104390. doi:10.1016/j.phrs.2019.104390
13. Sun Q, Yang Z, Li P, et al. A novel miRNA identified in GRSF1 complex drives the metastasis via the PIK3R3/AKT/NF-κB and TIMP3/MMP9 pathways in cervical cancer cells. Cell Death Dis. 2019;10(9):636. doi:10.1038/s41419-019-1841-5
14. Gorbea C, Mosbruger T, Cazalla D. A viral Sm-class RNA base-pairs with mRNAs and recruits microRNAs to inhibit apoptosis. Nature. 2017;550(7675):275–279. doi:10.1038/nature24034
15. Kim DH, Khan H, Ullah H, et al. MicroRNA targeting by quercetin in cancer treatment and chemoprotection. Pharmacol Res. 2019;147:104346. doi:10.1016/j.phrs.2019.104346
16. Zhao X, Jin Y, Li L, et al. MicroRNA-128-3p aggravates doxorubicin-induced liver injury by promoting oxidative stress via targeting Sirtuin-1. Pharmacol Res. 2019;146:104276. doi:10.1016/j.phrs.2019.104276
17. Toyama K, Spin JM, Mogi M, Tsao PS. Therapeutic perspective on vascular cognitive impairment. Pharmacol Res. 2019;146:104266. doi:10.1016/j.phrs.2019.104266
18. Shi D, Wang H, Ding M, et al. MicroRNA-26a-5p inhibits proliferation, invasion and metastasis by repressing the expression of Wnt5a in papillary thyroid carcinoma. Onco Targets Ther. 2019;12:6605–6616. doi:10.2147/OTT.S205994
19. Li R, Qiao M, Zhao X, Yan J, Wang X, Sun Q. MiR-20a-3p regulates TGF-β1/Survivin pathway to affect keratinocytes proliferation and apoptosis by targeting SFMBT1 in vitro. Cell Signal. 2018;49:95–104. doi:10.1016/j.cellsig.2018.06.003
20. Kochan-Jamrozy K, Króliczewski J, Moszyńska A, Collawn JF, Bartoszewski R. miRNA netstudys modulate human endothelial cell adaptation to cyclic hypoxia. Cell Signal. 2019;54:150–160. doi:10.1016/j.cellsig.2018.11.020
21. Zhao XG, Hu JY, Tang J, et al. miR-665 expression predicts poor survival and promotes tumor metastasis by targeting NR4A3 in breast cancer. Cell Death Dis. 2019;10(7):479. doi:10.1038/s41419-019-1705-z
22. Ardelt MA, Fröhlich T, Martini E, et al. Inhibition of cyclin-dependent kinase 5: a strategy to improve sorafenib response in hepatocellular carcinoma therapy. Hepatology. 2019;69(1):376–393. doi:10.1002/hep.30190
23. Hyun MH, Lee YS, Kim JH, et al. Hepatic resection compared to chemoembolization in intermediate- to advanced-stage hepatocellular carcinoma: A meta-analysis of high-quality studies. Hepatology. 2018;68(3):977–993. doi:10.1002/hep.29883
24. Wang C, Wang H, Yang W, et al. Multicenter randomized controlled trial of percutaneous cryoablation versus radiofrequency ablation in hepatocellular carcinoma. Hepatology. 2015;61(5):1579–1590. doi:10.1002/hep.27548
25. Kim DW, Talati C, Kim R. Hepatocellular carcinoma (HCC): beyond sorafenib-chemotherapy. J Gastrointest Oncol. 2017;8(2):256–265. doi:10.21037/jgo.2016.09.07
26. Fornaro L, Vivaldi C, Lorenzoni G, Masi G, Bargellini I. Moving beyond sorafenib alone in advanced hepatocellular carcinoma: is hepatic arterial infusion chemotherapy the best option? Ann Oncol. 2017;28(3):667. doi:10.1093/annonc/mdw664
27. Boland P, Wu J. Systemic therapy for hepatocellular carcinoma: beyond sorafenib. Chin Clin Oncol. 2018;7(5):50. doi:10.21037/cco.2018.10.10
28. Shao Z, Li Y, Dai W, et al. ETS-1 induces Sorafenib-resistance in hepatocellular carcinoma cells via regulating transcription factor activity of PXR. Pharmacol Res. 2018;135:188–200. doi:10.1016/j.phrs.2018.08.003
29. Feng F, Jiang Q, Cao S, et al. Pregnane X receptor mediates sorafenib resistance in advanced hepatocellular carcinoma. Biochim Biophys Acta Gen Subj. 2018;1862(4):1017–1030. doi:10.1016/j.bbagen.2018.01.011
30. Wu M, Zhao G, Zhuang X, et al. Triclosan treatment decreased the antitumor effect of sorafenib on hepatocellular carcinoma cells. Onco Targets Ther. 2018;11:2945–2954. doi:10.2147/OTT.S165436
31. Xie H, Tian S, Yu H, et al. A new apatinib microcrystal formulation enhances the effect of radiofrequency ablation treatment on hepatocellular carcinoma. Onco Targets Ther. 2018;11:3257–3265. doi:10.2147/OTT.S165000
32. Wang Y, Tang Z. A novel long-sustaining system of apatinib for long-term inhibition of the proliferation of hepatocellular carcinoma cells. Onco Targets Ther. 2018;11:8529–8541. doi:10.2147/OTT.S188209
33. Ji Q, Xu X, Li L, et al. miR-216a inhibits osteosarcoma cell proliferation, invasion and metastasis by targeting CDK14. Cell Death Dis. 2017;8(10):e3103. doi:10.1038/cddis.2017.499
34. Liang Y, Xu X, Wang T, et al. The EGFR/miR-338-3p/EYA2 axis controls breast tumor growth and lung metastasis. Cell Death Dis. 2017;8(7):e2928. doi:10.1038/cddis.2017.325
35. Wang L, Zhao L, Jia X, et al. Aminophenols increase proliferation of thyroid tumor cells by inducing the transcription factor activity of estrogen receptor α. Biomed Pharmacother. 2019;109:621–628. doi:10.1016/j.biopha.2018.10.168
36. Li F, Wei A, Bu L, et al. Procaspase-3-activating compound 1 stabilizes hypoxia-inducible factor 1α and induces DNA damage by sequestering ferrous iron. Cell Death Dis. 2018;9(10):1025. doi:10.1038/s41419-018-1038-3
37. Guan F, Ding R, Zhang Q, et al. WX-132-18B, a novel microtubule inhibitor, exhibits promising anti-tumor effects. Oncotarget. 2017;8(42):71782–71796. doi:10.18632/oncotarget.17710
38. Zhang Y, Li D, Jiang Q, et al. Novel ADAM-17 inhibitor ZLDI-8 enhances the in vitro and in vivo chemotherapeutic effects of Sorafenib on hepatocellular carcinoma cells. Cell Death Dis. 2018;9(7):743. doi:10.1038/s41419-018-0804-6
39. Chen Y, Zeng Q, Liu X, et al. LINE-1 ORF-1p enhances the transcription factor activity of pregnenolone X receptor and promotes sorafenib resistance in hepatocellular carcinoma cells. Cancer Manag Res. 2018;10:4421–4438. doi:10.2147/CMAR.S176088
40. Gao X, Chen H, Huang X, Li H, Liu Z, Bo X. ARQ-197 enhances the antitumor effect of sorafenib in hepatocellular carcinoma cells via decelerating its intracellular clearance. Onco Targets Ther. 2019;12:1629–1640. doi:10.2147/OTT.S196713
41. Li J, Zhao J, Wang H, et al. MicroRNA-140-3p enhances the sensitivity of hepatocellular carcinoma cells to sorafenib by targeting pregnenolone X receptor. Onco Targets Ther. 2018;11:5885–5894. doi:10.2147/OTT.S179509
42. Jia H, Yang Q, Wang T, et al. Rhamnetin induces sensitization of hepatocellular carcinoma cells to a small molecular kinase inhibitor or chemotherapeutic agents. Biochim Biophys Acta. 2016;1860(7):1417–1430. doi:10.1016/j.bbagen.2016.04.007
43. An L, Li DD, Chu HX, et al. Terfenadine combined with epirubicin impedes the chemo-resistant human non-small cell lung cancer both in vitro and in vivo through EMT and Notch reversal. Pharmacol Res. 2017;124:105–115. doi:10.1016/j.phrs.2017.07.021
44. Siegel RL1, Miller KD2, Jemal A. Cancer statistics, 2019. CA Cancer J Clin. 2019;69(1):7–34. doi:10.3322/caac.21551
45. Zhang S, Wang F, Zhang Z. Current advances in the elimination of hepatitis B in China by 2030. Front Med. 2017;11(4):490–501. doi:10.1007/s11684-017-0598-4
46. Wang FS, Fan JG, Zhang Z, Gao B, Wang HY. The global burden of liver disease: the major impact of China. Hepatology. 2014;60(6):2099–2108. doi:10.1002/hep.27406
47. Feng F, Jiang Q, Jia H, et al. Which is the best combination of TACE and Sorafenib for advanced hepatocellular carcinoma treatment? A systematic review and netstudy meta-analysis. Pharmacol Res. 2018;135:89–101. doi:10.1016/j.phrs.2018.06.021
48. Xie H, Yu H, Tian S, et al. What is the best combination treatment with transarterial chemoembolization of unresectable hepatocellular carcinoma? A systematic review and netstudy meta-analysis. Oncotarget. 2017;8(59):100508–100523. doi:10.18632/oncotarget.20119
49. Roskoski R
50. Jr RR. Targeting oncogenic Raf protein-serine/threonine kinases in human cancers. Pharmacol Res. 2018;135:239–258. doi:10.1016/j.phrs.2018.08.013
51. Roskoski R
52. Roskoski R
53. Roskoski R
54. Zhu YJ, Zheng B, Wang HY, Chen L. New knowledge of the mechanisms of sorafenib resistance in liver cancer. Acta Pharmacol Sin. 2017;38(5):614–622. doi:10.1038/aps.2017.5
55. Mackowiak B, Hodge J, Stern S, Wang H. The roles of xenobiotic receptors: beyond chemical disposition. Drug Metab Dispos. 2018;46(9):1361–1371. doi:10.1124/dmd.118.081042
56. Zhuo W, Hu L, Lv J, Wang H, Zhou H, Fan L. Role of pregnane X receptor in chemotherapeutic treatment. Cancer Chemother Pharmacol. 2014;74(2):217–227. doi:10.1007/s00280-014-2494-9
57. Li L, Liang Y, Kang L, et al. Transcriptional Regulation of the Warburg Effect in Cancer by SIX1. Cancer Cell. 2018;33(3):368–385.e7. doi:10.1016/j.ccell.2018.01.010
58. Lacal PM, Graziani G. Therapeutic implication of vascular endothelial growth factor receptor-1 (VEGFR-1) targeting in cancer cells and tumor microenvironment by competitive and non-competitive inhibitors. Pharmacol Res. 2018;136:97–107. doi:10.1016/j.phrs.2018.08.023
59. Li L, Kang L, Zhao W, et al. miR-30a-5p suppresses breast tumor growth and metastasis through inhibition of LDHA-mediated Warburg effect. Cancer Lett. 2017;400:89–98. doi:10.1016/j.canlet.2017.04.034
60. Dong Z, Zhong X, Lei Q, Chen F, Cui H. Transcriptional activation of SIRT6 via FKHRL1/FOXO3a inhibits the Warburg effect in glioblastoma cells. Cell Signal. 2019;60:100–113. doi:10.1016/j.cellsig.2019.04.009
61. Liu Y, Zhang Z, Wang J, et al. Metabolic reprogramming results in abnormal glycolysis in gastric cancer: a review. Onco Targets Ther. 2019;12:1195–1204. doi:10.2147/OTT.S189687
62. Bhattacharya B, Mohd Omar MF, Soong R. The Warburg effect and drug resistance. Br J Pharmacol. 2016;173(6):970–979. doi:10.1111/bph.13422
63. Fang D, Xiong Z, Xu J, Yin J, Luo R. Chemopreventive mechanisms of galangin against hepatocellular carcinoma: A review. Biomed Pharmacother. 2019;109:2054–2061. doi:10.1016/j.biopha.2018.09.154
64. Icard P, Shulman S, Farhat D, Steyaert JM, Alifano M, Lincet H. How the Warburg effect supports aggressiveness and drug resistance of cancer cells? Drug Resist Updat. 2018;38:1–11. doi:10.1016/j.drup.2018.03.001
65. Yin F, Feng F, Wang L, Wang X, Li Z, Cao Y. SREBP-1 inhibitor Betulin enhances the antitumor effect of Sorafenib on hepatocellular carcinoma via restricting cellular glycolytic activity. Cell Death Dis. 2019;10(9):672. doi:10.1038/s41419-019-1884-7
66. Ma DB, Qin MM, Shi L, Ding XM. MicroRNA-6077 enhances the sensitivity of patients-derived lung adenocarcinoma cells to anlotinib by repressing the activation of glucose transporter 1 pathway. Cell Signal. 2019;64:109391. doi:10.1016/j.cellsig.2019.109391
67. Penolazzi L, Bonaccorsi G, Gafà R, et al. SLUG/HIF1-α/miR-221 regulatory circuit in endometrial cancer. Gene. 2019;711:143938. doi:10.1016/j.gene.2019.06.028
68. Zhang D, Shi Z, Li M, Mi J. Hypoxia-induced miR-424 decreases tumor sensitivity to chemotherapy by inhibiting apoptosis. Cell Death Dis. 2014;5(6):e1301. doi:10.1038/cddis.2014.240
69. Majem B, Parrilla A, Jiménez C, et al. MicroRNA-654-5p suppresses ovarian cancer development impacting on MYC, WNT and AKT pathways. Oncogene. 2019;38(32):6035–6050. doi:10.1038/s41388-019-0860-0
70. Liang Z, Liu Z, Cheng C, et al. VPS33B interacts with NESG1 to modulate EGFR/PI3K/AKT/c-Myc/P53/miR-133a-3p signaling and induce 5-fluorouracil sensitivity in nasopharyngeal carcinoma. Cell Death Dis. 2019;10(4):305. doi:10.1038/s41419-019-1457-9
71. Yu F, Pang G, Zhao G. ANRIL acts as onco-lncRNA by regulation of microRNA-24/c-Myc, MEK/ERK and Wnt/β-catenin pathway in retinoblastoma. Int J Biol Macromol. 2019;128:583–592. doi:10.1016/j.ijbiomac.2019.01.157
72. Li F, Wei A, Bu L, Long L. Procaspase-3-activating compound 1 stabilizes hypoxia-inducible factor 1α and induces DNA damage by sequestering ferrous iron. Cell Death Dis. 2018;9(10):1025. doi:10.1038/s41419-018-1038-3
73. Bashash D, Sayyadi M, Safaroghli-Azar A, Sheikh-Zeineddini N, Riyahi N, Momeny M. Small molecule inhibitor of c-Myc 10058-F4 inhibits proliferation and induces apoptosis in acute leukemia cells, irrespective of PTEN status. Int J Biochem Cell Biol. 2019;108:7–16. doi:10.1016/j.biocel.2019.01.005
74. Sawayama H, Ogata Y, Ishimoto T, et al. Glucose transporter 1 regulates the proliferation and cisplatin sensitivity of esophageal cancer. Cancer Sci. 2019;110(5):1705–1714. doi:10.1111/cas.13995
75. Wu C, Gupta N, Huang YH, et al. Oxidative stress enhances tumorigenicity and stem-like features via the activation of the Wnt/β-catenin/MYC/Sox2 axis in ALK-positive anaplastic large-cell lymphoma. BMC Cancer. 2018;18(1):361. doi:10.1186/s12885-018-4300-2
76. Zarrabi AJ, Kao D, Nguyen DT, Loscalzo J, Handy DE. Hypoxia-induced suppression of c-Myc by HIF-2α in human pulmonary endothelial cells attenuates TFAM expression. Cell Signal. 2017;38:230–237. doi:10.1016/j.cellsig.2017.07.008
77. Dai J, Zhou Q, Tang H, et al. Smooth muscle cell-specific FoxM1 controls hypoxia-induced pulmonary hypertension. Cell Signal. 2018;51:119–129. doi:10.1016/j.cellsig.2018.08.003
78. Brunetti O, Russo A, Scarpa A, et al. MicroRNA in pancreatic adenocarcinoma: predictive/prognostic biomarkers or therapeutic targets? Oncotarget. 2015;6(27):23323–23341. doi:10.18632/oncotarget.4492
79. Wan TM, Iyer DN, Ng L. Roles of microRNAs as non-invasive biomarker and therapeutic target in colorectal cancer. Histol Histopathol. 2020;35:225–237. doi:10.14670/HH-18-171
80. Gnoni, A., Santini, D., Scartozzi, M, et al. Hepatocellular Carcinoma Treatment Over Sorafenib: epigenetics, microRNAs and Microenvironment. Is There a Light at the End of the Tunnel? Expert Opin Ther Targets. 2015;19:1623–1635. doi:10.1517/14728222.2015.1071354
 © 2020 The Author(s). This work is published and licensed by Dove Medical Press Limited. The full terms of this license are available at https://www.dovepress.com/terms.php and incorporate the Creative Commons Attribution - Non Commercial (unported, v3.0) License.
By accessing the work you hereby accept the Terms. Non-commercial uses of the work are permitted without any further permission from Dove Medical Press Limited, provided the work is properly attributed. For permission for commercial use of this work, please see paragraphs 4.2 and 5 of our Terms.
© 2020 The Author(s). This work is published and licensed by Dove Medical Press Limited. The full terms of this license are available at https://www.dovepress.com/terms.php and incorporate the Creative Commons Attribution - Non Commercial (unported, v3.0) License.
By accessing the work you hereby accept the Terms. Non-commercial uses of the work are permitted without any further permission from Dove Medical Press Limited, provided the work is properly attributed. For permission for commercial use of this work, please see paragraphs 4.2 and 5 of our Terms.