")
Back to Journals » Cancer Management and Research » Volume 12
MiR-301a Promotes Cell Proliferation by Repressing PTEN in Renal Cell Carcinoma
Authors Li J, Jiang D, Zhang Q, Peng S, Liao G, Yang X, Tang J, Xiong H, Pang J
Received 11 March 2020
Accepted for publication 30 May 2020
Published 10 June 2020 Volume 2020:12 Pages 4309—4320
DOI https://doi.org/10.2147/CMAR.S253533
Checked for plagiarism Yes
Review by Single anonymous peer review
Peer reviewer comments 2
Editor who approved publication: Dr Chien-Feng Li
Jun Li,1,* Donggen Jiang,1,* Qian Zhang,2,* Shubin Peng,3 Guolong Liao,1 Xiangwei Yang,1 Jiani Tang,1 Haiyun Xiong,1 Jun Pang1
1Department of Urology, Seventh Affiliated Hospital, Sun Yat-sen University, Shenzhen 518107, People’s Republic of China; 2Department of Rehabilitation Medicine, Seventh Affiliated Hospital, Sun Yat-sen University, Shenzhen 518107, People’s Republic of China; 3Department of Urology, Union Hospital, Tongji Medical College, Huazhong University of Science and Technology, Wuhan 430022, People’s Republic of China
*These authors contributed equally to this work
Correspondence: Jun Pang; Haiyun Xiong
Department of Urology, Seventh Affiliated Hospital, Sun Yat-Sen University, 628 Zhenyuan Road, Shenzhen 518107, People’s Republic of China
Tel +86-18802044177
; +86-18922869986
Email [email protected]; [email protected]
Objective: Renal cell carcinoma (RCC) displays an increasing incidence and mortality rate worldwide in recent years. More and more evidence demonstrated microRNAs function as positive or negative regulatory factors in many cancers, while the role of miR-301a in RCC is still unclear.
Material and Methods: The expression and clinical significance of miR-301a were assessed via bioinformatic software on open microarray datasets of the Cancer Genome Atlas (TCGA) and then confirmed by quantitative real-time PCR (qRT-PCR) in RCC cell lines. Loss of function assays were performed in RCC cell lines both in vitro and in vivo. Cell Counting Kit-8 (CCK-8), flow cytometry, luciferase reporter assays, Western blotting, and immunohistochemistry were employed to explore the mechanisms of the effect of miR-301a on RCC.
Results: By analyzing RCC clinical specimens and cell lines, we found a uniform increased miR-301a in expression in comparison with normal renal tissue or normal human proximal tubule epithelial cell line (HK-2). In addition, miR-301a upregulation correlated advanced stage and poor prognosis of clear cell RCC (ccRCC). Anti-miR-301a could inhibit growth and cell cycle G1/S transition in RCC cell lines. Moreover, we found that PTEN was identified as a direct target of miR-301a that might partially interrupt miR-301a-induced G1/S transition. Importantly, nude-mouse models revealed that knockdown of miR-301a delayed tumor growth.
Conclusion: These results indicate that miR-301a functions as a tumor-promoting miRNA through regulating PTEN expression, representing a novel therapeutic target for RCC.
Keywords: miR-301a, PTEN, renal cell carcinoma, proliferation, G1/S transition
Introduction
As the most common type of malignant kidney tumor, renal cell carcinoma (RCC) occurs primarily in the renal tubular epithelial system.1 There are many types of RCC regarding histopathology and cell features. Among them, clear cell RCC (ccRCC) is the most common type, accounting for nearly 80% of RCC cases.2 The morbidity and mortality of RCC appears to be rising in the past decade, and nearly ~64,000 new cases were diagnosed in 2018 in the America, resulting in more than 14,400 deaths, mainly from distant metastasis.2 Currently, radical nephrectomy remains the most effective treatment strategy for RCC patients diagnosed at an early stage. Although the malignancy generally resists traditional chemotherapy and radiotherapy, the introduction of targeted therapy against vascular endothelial growth factor (VEGF) and novel immunotherapy agents has revolutionized the management of patients with metastatic RCC.3 However, as the lack of early diagnostic markers and typical clinical symptoms for RCC, metastasis has already developed in approximate ~40% of patients when RCC is diagnosed.3 Furthermore, the 5-year survival rate of patients who diagnosed at the metastatic stage is less than 10%.4 So there is an urgent need to better understand the molecular mechanism of the oncogenesis and progression of RCC to lay the foundation for finding early diagnosis and prognosis markers of RCC. Identification of key molecular events correlated with carcinogenesis and tumor progression would also facilitate the development of novel therapeutic targets and anti-RCC strategies.
MicroRNAs (miRNAs) belong to the family of short noncoding RNAs, with a length of 19–25 nucleotides.5 By attaching to the complementary sequences in mRNA transcripts, microRNA regulates specific gene expression at the posttranscriptional level, leading to mRNA degradation or the inhibition of translation.6 In recent years, microRNAs have been defined as regulators and potential biomarkers, playing a crucial role in the oncogenesis, metastasis and development of RCC.7,8 Previous studies have revealed that miR-301a is an onco-miRNA in various types of tumor, such as pancreatic cancer,9 breast cancer,10 prostate cancer,11 and malignant melanoma.12 However, research on miR-301a in RCC has not yet been reported.
Phosphatase and tension homologue (PTEN) maps to chromosome 10q23.3 and has been considered a vital tumor suppressor gene.13 PTEN has been proved to be a key component of signal transduction pathways related to the control of cell growth, proliferation, and apoptosis, as well as a vital participant in the regulation of the cell cycle.13 Thus, the loss of PTEN expression may cause the initiation of tumorigenesis.
In the present study, we investigated the expression level of miR-301a in RCC specimens and analyzed the correlation of miR-301a expression with clinicopathological characteristics and prognosis in RCC patients from TCGA data. Then, we investigated the effects of miR-301a on proliferation and observed that it regulated the G1/S transition in RCC cells. Furthermore, PTEN was identified as a direct target of miR-301a, which might regulate its biological effects. Our data show that miR-301a functions as a tumor-promoting miRNA through regulating PTEN expression, providing a potential therapeutic target for RCC.
Materials and Methods
Study Patients and Samples
In this research, miRNA expression and clinical information were acquired from the TCGA data portal (http://tcga.cancer.gov). We collected data according to the following criteria: 1) the clinical histopathological diagnosis was ccRCC; 2) complete data were required for all samples including miR-301a expression, age, sex, clinical stages and tumor grades, tumor staging and grading was designated according to the 2012 International Society of Urological Pathology Consensus Conference;14 3) none of these patients received targeted therapy, immunotherapy, chemotherapy or radiotherapy before their tumors were surgically removed; and 4) the included cases had no other malignancies. Overall, up to 516 ccRCC patients were enrolled in the study. Among these samples, we evaluated miRNA sequences from 516 tumor samples and 71 adjacent non-tumor tissue samples. This research was conducted in the light of the publication guidelines provided by TCGA.
Cell Culture and Transfection
The human RCC cell lines used in this study included 786–0, ACHN, A498, Caki-2, OS-RC-1, OS-RC-2, and HK-2. They were purchased from the American Type Culture Collection (ATCC). Cells were cultured in RPMI 1640 (Gibco, Carlsbad, California) supplemented with 10% fetal bovine serum (FBS) in a humidified atmosphere of 5% CO2 maintained at 37°C.
The cells were transfected using Lipofectamine 2000 (Invitrogen), according to the manufacture’s instructions. miR-301a inhibitor (5ʹ-GCUUUGACAAUACUAUUGCACUG-3ʹ), inhibitor NC (5ʹ-CAGUACUUU UGUGUAGUACAAA-3ʹ), miR-301a mimic (5ʹ-CAGUGCAAUAGUAUUGUCAA AGC-3ʹ) and miR-control (5ʹ-UUCUCCGAACGUGUCACGUTT-3ʹ) were all transfected at a concentration of 40 nmol/L. The RNA transfection efficiency was at least 60–75%, and the RNA duplex persisted in cells for at least 4 days. All RNA oligoribonucleotides were purchased from GenePharma (Shanghai, P.R. China).
RNA Isolation and Real-Time PCR Analysis
Total RNA was extracted from cells and tissues by using TRIzol (Invitrogen). The expression of PTEN was quantified by using SYBR® premix Ex Taq Ⅱ (Takara, Japan), using β-actin as a reference gene. The expression of miR-301a was examined using the Hairpin-itTM Real-Time PCR Kit (GenePharma, China), and U6 was assigned as the internal standard. All qRT-PCR was performed on the ABI Prism 7500 Fast Sequence Detection System (Applied Biosystems, America). All samples were normalized to internal controls and the fold changes were calculated through relative quantification (2−ΔΔCT). The primer sequences using in the research were as follows: miR-301a forward: 5ʹ-ACACTCCAGCTGGGCAGTG CAATAGTATTGTC-3ʹ; miR-301a reverse: 5ʹ-CTCAACTGGTGTCGTGGA-3ʹ; and PTEN forward, 5ʹ-AAGACAAAGCCAACCGATAC-3ʹ; PTEN reverse, 5ʹ-GAAGT TGAACTGCTAGCCTC-3ʹ. U6 or β-actin was used as a reference for miRNAs or mRNAs, respectively. The primer sequences were as follows: U6 forward: 5ʹ-CTC GCTTCGGCAGCACA-3ʹ; U6 reverse: 5ʹ-AACGCTTCACGAATTTGCGT-3ʹ; β-actin forward: 5ʹ-CTGGAACGGTGAAGGTGACA; and β-actin reverse: 5ʹ-AAGGGAC TTCCTGTAACAATGCA-3ʹ.
Luciferase Reporter Assay
The wild-type PTEN-3ʹ-UTR was chemically synthesized and cloned downstream of the firefly luciferase gene in a pGL3-promoter vector (Ambion). 293-T cells were placed in a 48-well plate and grown until 80% confluence. Cells were then cotransfected with luciferase plasmids, pRL-TK Renilla plasmid and miR-301a or miR-301a-mut. After 48 h of transfection, firefly and Renilla luciferase activities were evaluated with a Dual-Luciferase Reporter Assay System (Promega).
Analysis of Cell Proliferation and Cell Cycle
Cell proliferation was examined by Cell Counting Kit-8 (CCK-8) assay, colony formation assay, cell cycle analysis, and 5-ethynyl-2-deoxyuridine incorporation assay, as described previously.15 Cell cycle analyses were conducted using fluorescence-activated cell sorting (FACS) cytometry (Becton Dickinson, San Jose, CA)
Western Blotting
Western blotting was performed according to a standard method previously described.15 Briefly, cells were lysed by RIPA buffer and the concentration of proteins was quantified by a BCA kit (Beyotime Institute of Biotechnology). Equal amounts of proteins were separated by SDS-PAGE, and then transferred to PVDF membranes using transfer buffer. The PVDF membranes were blocked in 5% nonfat milk for 1 h at room temperature, and then subjected to the corresponding primary antibody at a temperature of 4°C overnight. After that, membranes were washed in PBST 3 times and incubated with secondary antibody for 2 h at room temperature. Anti-PTEN and anti-β-Actin were obtained from Cell Signaling Technology (Beverly, MA).
Immunohistochemistry
Immunohistochemistry analyses were conducted as previously described.15 The isolated mouse xenograft tumors were fixed in 10% buffered formalin first and dehydrated in a graded series of ethanol. The tissues were embedded in paraffin and then cut into 4-mm-thick sections. The deparaffinized sections were incubated with PTEN (1:50) or Ki-67 (1:50) primary antibody at room temperature for 1 h. After washing in PBS, the sections were incubated with secondary antibody and ABC solution followed by 3,3ʹ-diaminobenzidine (DAB) staining (DAKO, Carpinteria, CA) and counterstaining with Mayer’s hematoxylin.
Tumorigenicity Assay in Nude Mice
Four-week-old male BALB/c nude mice obtained from Sun Yat-sen University Experimental Animal Center were used. A total of 5×10⁶ indicated cells expressing the miR-301a inhibitor or control vector were injected subcutaneously into the dorsal thighs of mice. Tumor growth was monitored regularly every week, and the tumor volume was calculated according to the formula length×width2×0.5. After 5 weeks, mice were anaesthetized and sacrificed, and tumors were removed, weighed, and sectioned, followed by immunohistochemical (IHC) analysis. This study was approved by our Institutional Ethics Committee. All procedures performed in the study were in accordance with the ethical standards of the institutional ethics committee and with the NC3Rs ARRIVE guidelines.
Statistical Analysis
Data are demonstrated as the mean±SD from at least three separate experiments. All continuous variables were performed normality tests before further statistical analysis. Unless otherwise noted, the differences between groups were calculated using Student’s t test when only two groups were compared, or analyzed by one-way analysis of variance (ANOVA) when more groups were compared. The Kaplan–Meier method and Log rank test were performed to reveal survival differences according to miR-301a expression. The correlation between miR-301a levels and PTEN expression was assessed by Spearman correlation. All tests performed were two-sided. Differences were defined statistically significant at P≤0.05.
Results
MiR-301a Is Significantly Increased in Renal Cancer Cell Lines and RCC Tissues
The expression of miR-301a was examined in an immortalized normal human proximal tubule epithelial cell line (HK-2) and six renal cancer cell lines (786–0, ACHN, A498, Caki-2, OS-RC-1, OS-RC-2) by qRT-PCR. Our results indicated that miR-301a expression levels were significantly increased in all RCC cell lines compared with HK-2 cells (P≤0.01, Figure 1A). To further verify the expression level of miR-301a in RCC, we collected 71 pairs of ccRCC tissues and adjacent non-cancerous renal tissues from the TCGA database. Similarly, the results showed that the expression of miR-301a in tumor tissues was significantly upregulated compared with that in the corresponding normal tissues (P≤0.01, Figure 1B). These results suggested that upregulation of miR-301a expression may be related to renal cancer pathogenesis and that miR-301a possibly functions as an oncogene in RCC.
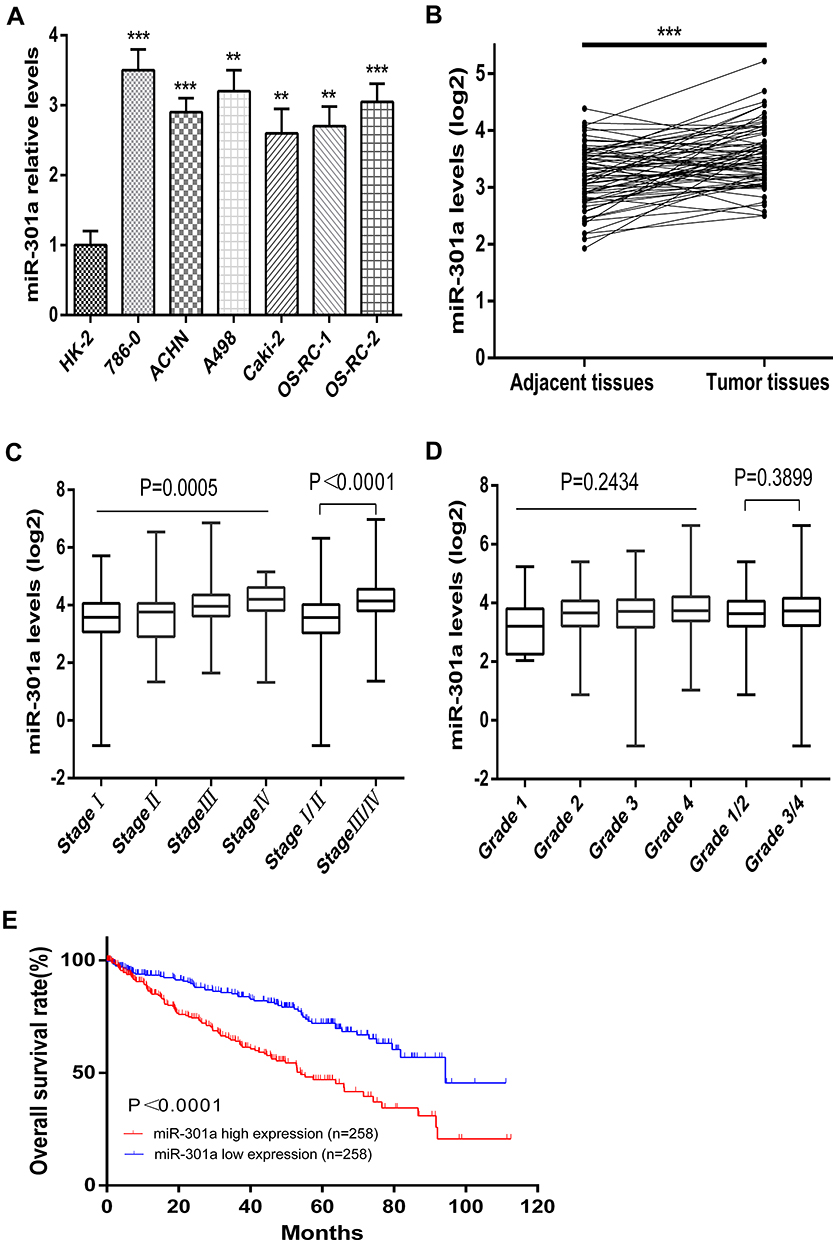 |
Figure 1 Relative miR-301a expression in RCC cell lines and ccRCC tissues and its relationship with the overall survival of ccRCC patients. (A) The expression of miR-301a in the indicated RCC cell lines. (B) Relative expression of miR-301a between ccRCC tissues and their corresponding normal renal tissue samples (n=71) (TCGA). (C–D) miR-301a expression levels in patients with different stages and grades of ccRCC (TCGA). (E) Kaplan–Meier analysis of the correlation between the miR-301a level and overall survival of ccRCC patients (TCGA) with high (>the median, n=258) and low (<the median, n=258) miR-301a expression. The results are presented as the mean±SD.**P≤0.01; ***P≤0.001. |
Upregulated MiR-301a Is Correlated with the Advanced Stage and Poor Prognosis of ccRCC
To investigate the role of miR-301a in ccRCC progression, the expression of miR-301a in different stages/grades of ccRCC patients from TCGA was accessed. The results revealed that the miR-301a expression level was higher in more advanced stages (ANOVA P=0.005, Stage I/II vs III/IV, P≤0.001, Figure 1C), while increased expression in higher grades was observed, but not statistically significant (ANOVA P=0.2434, Grade 1/2 vs 3/4, P=0.3899, Figure 1D). Furthermore, we investigated the prognostic value of the miR-301a expression level. Patients were divided into two groups according to the median expression level of miR-301a: miR-301a low expression group (miR-301a level<the median, n=258) and miR-301a high expression group (miR-301a level>the median, n=258). Kaplan–Meier curves revealed that the miR-301a high expression group had a shorter overall survival time than the miR-301a low expression group (P≤0.01, Figure 1E). In addition, univariate and multivariate Cox regression analyses indicated that miR-301a could be an independent prognostic marker for RCC patients (Table 1).
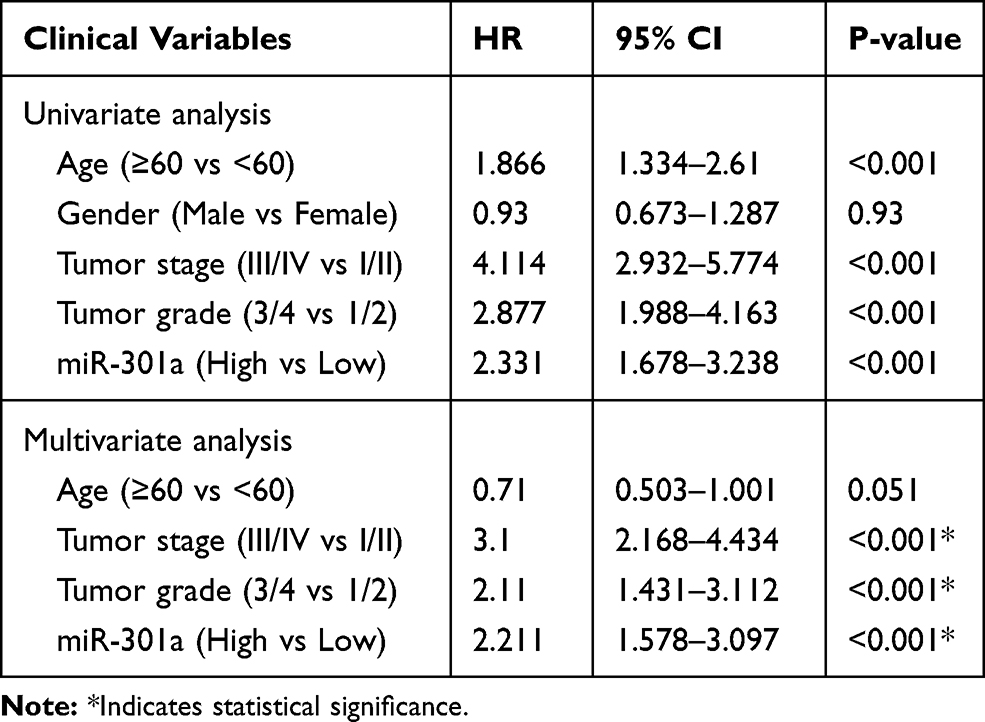 |
Table 1 Correlation Between the MiR-301a and the Overall Survival of ccRCC Patients |
Anti-MiR-301a Inhibits Growth and G1/S Cell Cycle Transition in RCC Cell Lines
Compared with the other four renal cancer cell lines (ACHN, Caki-2, OS-RC-1 and OS-RC-2), the qRT-PCR results indicated that the expression levels of miR-301a in 786–0 and A498 cell lines were higher (Figure 1A), so the two cell lines were selected to elucidate the function of miR-301a in RCC by loss-of-function experiment. Firstly, we compared the transfection efficiency of the miR-301a inhibitor with respective NC in the 786–0 and A498 cell lines by performing qRT-PCR, the results showed that miR-301a expression levels in RCC cells were decreased by 86.12% (786–0, P≤0.01) and 82.26% (A498, P≤0.01) after transfection with the miR-301a inhibitor (Figure 2A). The CCK-8 assay revealed that the proliferation of miR-301a inhibitor group slowed down by 21.83% (P≤0.05) and 25.51% (P≤0.01) in 786–0 cells, 16.51% (P≤0.05) and 21.59% (P≤0.01) in A498 cells compared with NC group at the 3rd and 4th day after transfection (Figure 2B). Furthermore, the colony formation ability of RCC cells declined by 65.02% (786–0, P≤0.01) and 58.94% (A498, P≤0.01) after transfection with the miR-301a inhibitor compared with NC group (Figure 2C). To dissect the biological events accompanying the alterations of cell proliferation caused by miR-301a, FACS was applied to evaluate changes in DNA content throughout various phases of the cell cycle. As shown in Figure 2D, both 786–0 and A498 cells transfected with the miR-301a inhibitor displayed a significantly increased proportion of G1 phase (67.64% vs 56.07% in 786–0 cells, 68.21% vs 54.74% in A498 cells) and a reduced percentage of S phase (26.54% vs 38.25% in 786–0 cells, 25.84% vs 39.50% in A498 cells), and the differences were all statistically significant (P≤0.01). In addition, immunofluorescent staining for EdU incorporation indicated decreased DNA synthesis after transfection of the miR-301a inhibitor, demonstrating 12.33% (P≤0.01) and 21.74% (P≤0.01) EdU-positive cells in 786–0 and A498 cells, respectively, versus 29.53% and 43.67% for the corresponding NC cells (Figure 2E). Therefore, we can infer that the growth-promoting function of miR-301a might be due to its enhancement of cell cycle progression at the G1/S transition in RCC cells.
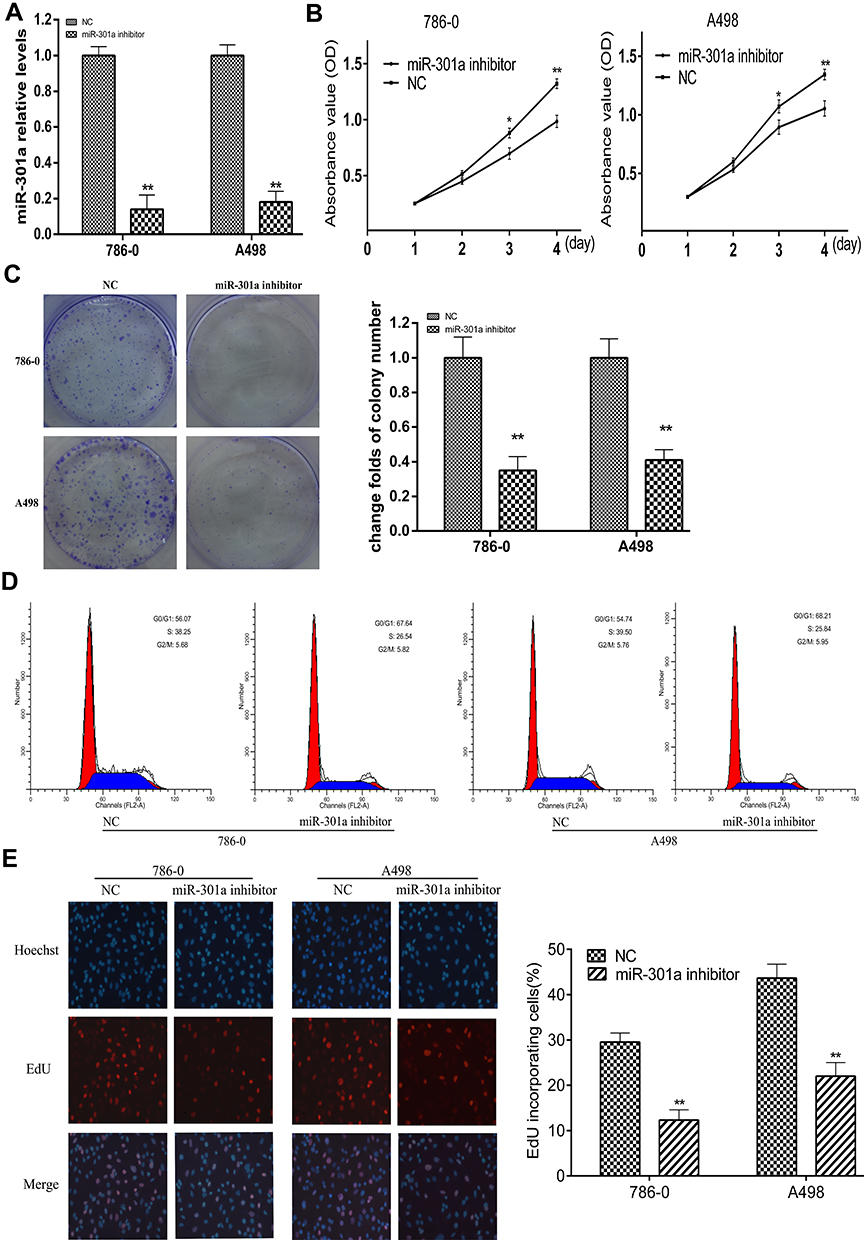 |
Figure 2 Knockdown of miR-301a suppresses RCC cell proliferation by abrogating the G1/S transition. (A) Knockdown of miR-301a expression in 786–0 and A498 cells by transfecting miR-301a inhibitor was confirmed by qRT-PCR. (B) CCK-8 assays revealed the cell growth curves of the indicated cells. (C) Representative micrographs (left) and relative quantification (right) of crystal violet-stained cell colonies analyzed by colony formation assay. (D) FACS analysis of the cell cycle of the indicated cells. Cells were synchronized by serum deprivation for 24 h, and then stimulated to enter S phrase by serum re-addition. Cells were harvested for FACS analysis at 12 h post release. (E) Representative micrographs (left) and quantification of EdU-incorporated cells in the indicated cells. The results are presented as the mean±SD. *P≤0.05; **P≤0.01. |
PTEN Is a Direct Target Gene of MiR-301a
To explore how miR-301a promotes G1/S transition and cell growth, we used TargetScan, a bioinformatic tool for microRNA target prediction, which revealed that PTEN was a potential target of miR-301a (Figure 3A). To validate whether PTEN was the direct target of miR-301a, luciferase reporter assays were performed. Reporter assays demonstrated that the activity of luciferase linked with the 3ʹ-UTR of PTEN was inhibited in a dose-dependent manner in miR-301a mimic-transfected 293-T cells compared with those in control cells. Notably, mutations in the seed sequence of miR-301a (Figure 3B) abolished its suppressive effects (Figure 3C). To further confirm that miR-301a downregulated PTEN expression in ccRCC, we computed miR-301a expression and PTEN expression in the TCGA database and found that PTEN transcriptional expression was inversely associated with miR-301a expression in ccRCC (r=−0.2416, Figure 3F). Furthermore, we investigated whether the mRNA and protein expression level of PTEN in RCC cells was modulated by miR-301a in vitro. The inhibition of miR-301a promoted both the mRNA and protein expression of PTEN in RCC cells compared with those in the negative control group (Figure 3D and E). These findings indicate that PTEN is a direct target gene of miR-301a and is downregulated by miR-301a in RCC.
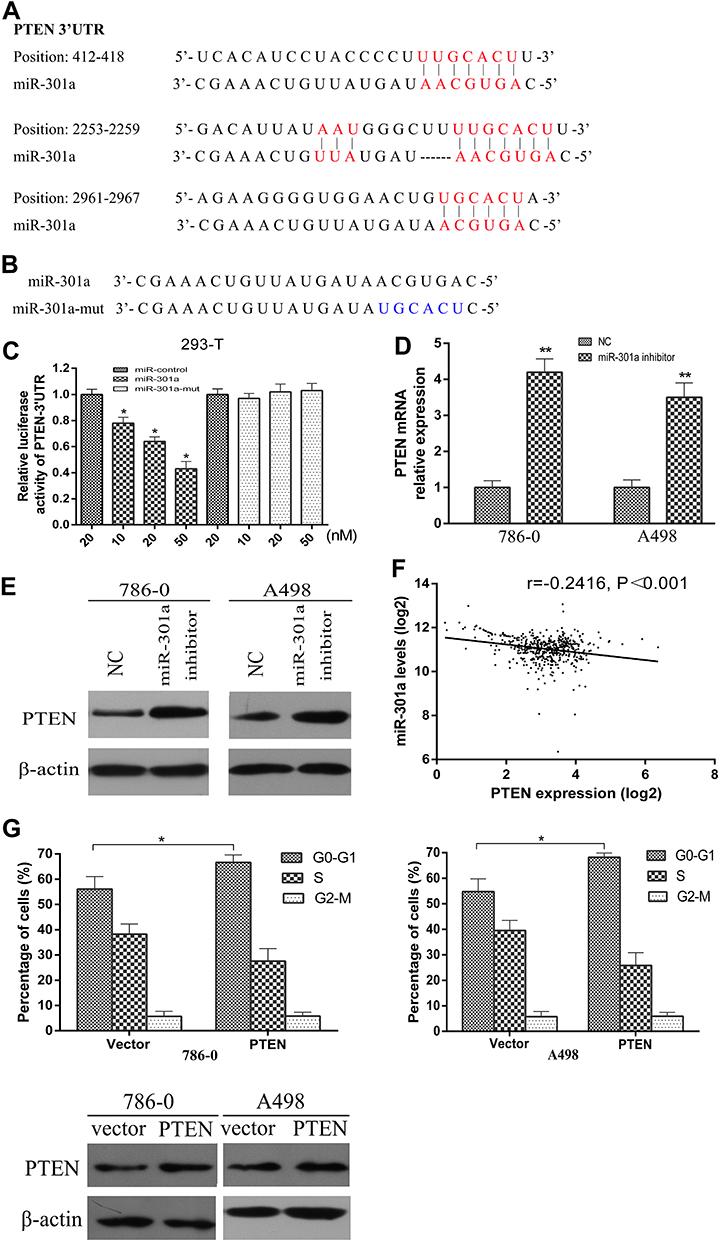 |
Figure 3 miR-301a directly targets PTEN and downregulates PTEN expression in RCC. (A) Schematic of miR-301a putative target sites in the 3ʹ-UTR of PTEN. (B) Sequence of miR-301a-mut. (C) Luciferase assay of pGL3-PTEN-3ʹ-UTR reporter cotransfected with increasing amounts (10, 20, and 50 nM) of miR-301a mimic and mutant oligonucleotides in 293-T cells. (D) qRT-PCR analysis of the mRNA levels of PTEN in response to deregulated miR-301a expression in the indicated cells. (E) Western blotting of PTEN expression in the indicated cells. β-actin was used as the internal control. (F) Correlation between miR-301a and PTEN mRNA expression in ccRCC (TCGA, n=501). (G) The effect of restoring the ORF (without the 3ʹ-UTR) of PTEN on the proportions of the indicated cells in distinct cell cycle phases as determined by FACS, and the corresponding change of PTEN protein by Western blotting. The results are presented as the mean±SD. *P≤0.05; **P≤0.01. |
PTEN Is Involved in MiR-301a-Regulated G1/S Transition
To elucidate the functional significance of miRNA-mediated suppression of PTEN in the induction of G1/S transition, we re-expressed open reading frame (ORF, without the 3ʹ-UTR) of PTEN in RCC cell lines with high endogenous miR-301a levels (786–0 and A498) and examined the cell cycle distribution by flow cytometry. Unexceptionally, restoration of PTEN led to an increased proportion of G1 phase (66.64% vs 56.07% in 786–0 cells, 68.21% vs 54.74% in A498 cells) and a reduced percentage of S phase (27.54% vs 38.25% in 786–0 cells, 25.84% vs 39.51% cells), partially but significantly rescued the G1/S transition promoted by endogenous miR-301a (Figure 3G). At the same time, the exogenous modified PTEN cannot be combined by endogenous miR-301a and the ability to express PTEN protein will not be inhibited after restoration of PTEN, so the protein levels of PTEN were undoubtedly increased (Figure 3G). Therefore, overexpression of PTEN could partially interrupt miR-301a-induced G1/S transition (Figure 3G). The results indicate that the promotive effect of miR-301a on RCC is mediated by a decrease in PTEN expression.
Anti-miR-301a Inhibits RCC Tumor Growth in vivo
To determine the function of miR-301a in vivo, we selected 786–0 cell line for RCC mouse model as the expression level of miR-301a in 786–0 was higher than in A498 (Figure 1A). Before inoculation, 786–0 cells were transfected with the miR-301a inhibitor to repress endogenous miR-301a levels or the empty vector as the negative control. As expected, inhibition of miR-301a significantly delayed tumor growth compared with that in the negative control group (Figure 4A–C). To acquire further insights into the mediators of miR-301a suppression leading to decreased tumor growth, tumors from mice were collected 6 weeks after implantation. Immunohistochemical staining confirmed that the proportions of proliferative Ki-67-positive cells in miR-301a inhibitor tumors were substantially lower than those in control tumors (Figure 4D). However, PTEN expression displayed the opposite trend (Figure 4D). Taken together, these data indicate that downregulation of miR-301a effectively suppresses the growth of RCC tumors in vivo.
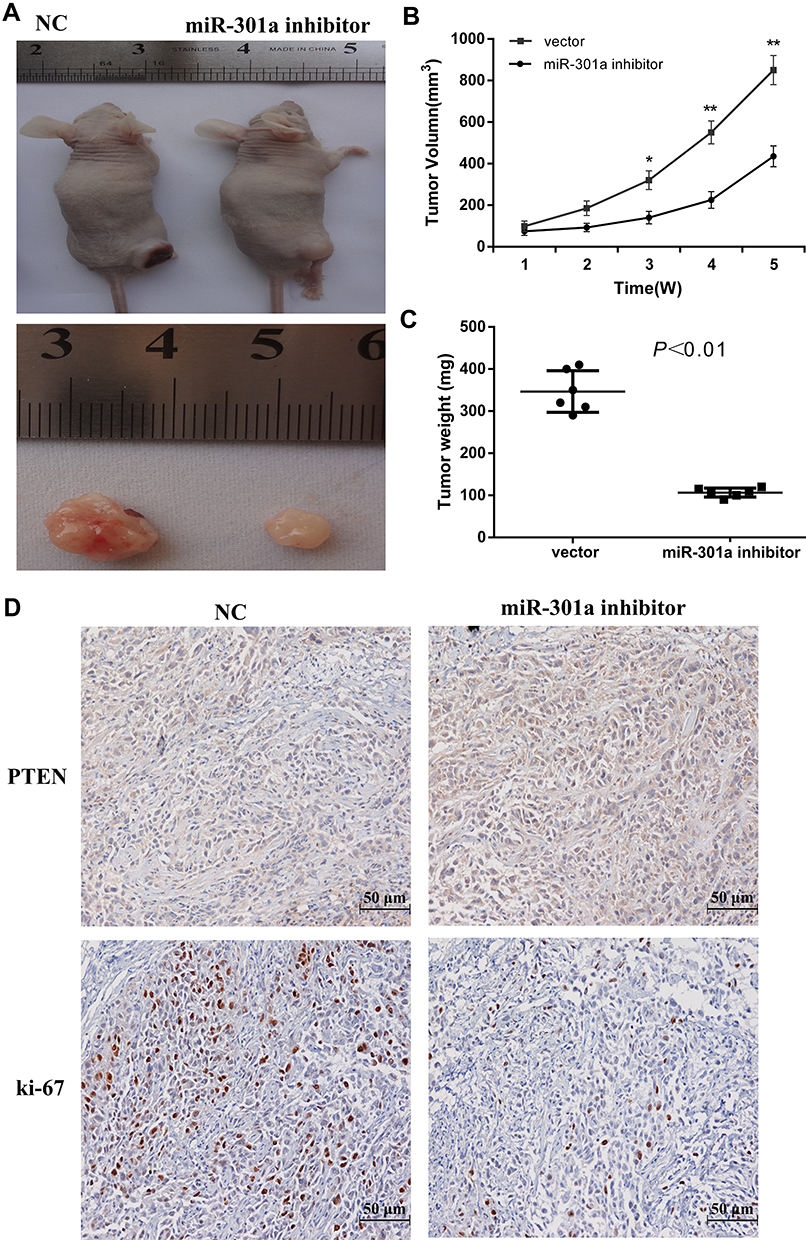 |
Figure 4 Knockdown of miR-301a inhibits tumor growth of RCC cell xenografts in vivo. (A) Representative photograph of 786–0 tumor formation in nude mice. (B) Tumor growth curves of 786–0 cells in nude mice. (C) Each tumor formed by 786–0 cells was weighed. (D) Immunohistochemical analysis of PTEN and Ki-67 in the xenografts of 786–0 cells. The tumors were monitored regularly for 5 weeks (B) and excised at the end of the experiment for weighing (C) and Immunohistochemical staining (D). Each data point represents the mean±SD of six independent xenografts. *P≤0.05; **P≤0.01. |
Discussion
MiRNAs are a class of noncoding small RNAs and have been extensively reported to be involved in tumorigenesis and tumor development.16 Accumulating evidence confirm that miR-301a acts as an oncomiR in multiple human cancers. For instance, miR-301a was described as a potential marker for metastasis in prostate cancer, and its high expression was correlated with an increased risk of recurrence.17 However, there is no report on the effect of miR-301a on RCC. To our knowledge, this is the first study that indicates that endogenously expressed miR-301a can promote the proliferation of RCC cells and lead to a poor clinical prognosis.
In this study, endogenous miR-301a expression in all RCC cell lines tested was obviously higher than that in the normal human proximal tubule epithelial cell line HK-2. Due to the very high basal level of miR-301a in all kinds of RCC cells, loss-of-function analyses were performed both in vitro and in vivo by silencing miR-301a expression. Among these RCC cell lines, the two with the highest miR-301a expression (786–0 and A498) were selected for further investigation of the biological effect of miR-301a. Moreover, loss-of-function studies indirectly revealed that miR-301a could accelerate the G1/S transition and cell growth by repressing the expression of PTEN. We propose that high expression of miR-301a may disrupt cell cycle control, in turn promoting cell proliferation, and consequently facilitating the development of cancers such as RCC.
To further investigate the involvement of miR-301a in the development of human malignancies, we explored the molecular mechanism of miR-301a in regulating proliferation in RCC cells, using TargetScan software. We found that the 3ʹ-UTR of PTEN contained highly conserved putative miR-301a binding sites. As a well-known tumor suppressor, PTEN is silenced in various types of cancers.18 Accumulating evidence suggests that PTEN controls cell proliferation and survival through regulating each phase of the cell cycle, including the G1/S19–21 and G2/M transitions.22,23 Furthermore, PTEN is involved in the key processes of genetic transmission during the cell cycle to promote the fidelity of DNA replication24,25 and chromosome segregation.26,27 PTEN has also been demonstrated as a hot target of a number of miRNAs, including miR-217, miR-214, and miR-21, which are involved in the regulation of several cancer types.28–30 Similarly, Ma et al found that PTEN, as a cell cycle and proliferation regulator, was the direct target of miR-301a in breast cancer.31 In the present study, luciferase reporter assays revealed that PTEN was the direct target of miR-301a. Furthermore, we observed that downregulation of miR-301a significantly increased PTEN expression at both the mRNA and protein levels in RCC cells. Meanwhile, Pearson correlation analysis indicated a significant inverse correlation between the expression level of miR-301a and PTEN in RCC patients from TCGA. Consistent with our abovementioned results, knockdown of PTEN abolished the inhibitory effect of the miR-301a inhibitor on the G1/S transition and proliferation of RCC cells. Our in vitro and in vivo results provide evidence that miR-301a functions as an oncogene in RCC, at least in part, by repressing PTEN expression.
There were some limitations to our study. We examined the expression levels of miR-301a in all kinds of RCC cell lines, but did not find one with a relatively low basal level of endogenous miR-301a. Therefore, gain-of-function experiments were not performed because the results would not reflect the biological effect of miR-301a in RCC cells. In addition, we only used the data in the TCGA to analyze the expression of miR-301a in RCC tissues and the correlation between miR-301a levels and clinical characteristics, which was mainly due to the limitation of clinical tissues, and further study is ongoing in our new research project.
Conclusions
In summary, our study revealed that miR-301a is upregulated in RCC specimens and cell lines. Downregulation of miR-301a inhibits RCC cell proliferation by blocking the G1/S transition. The oncogene function of miR-301a is mediated by the repression of its direct target gene PTEN. These findings suggest that miR-301a plays an important role in the development of RCC, and represents a novel therapeutic target for RCC.
Abbreviations
RCC, renal cell carcinoma; ccRCC, clear cell renal cell carcinoma; PTEN, phosphatase and tension homologue.
Ethics Approval and Informed Consent
In this study, miRNA expression and clinical information were obtained from the TCGA data portal (http://tcga.cancer.gov) in accordance with the publication guidelines. Animal experiments have been approved by the ethics committee of Sun Yat-sen University. All procedures performed in the study were in accordance with the ethical standards of the institutional ethics committee and with the NC3Rs ARRIVE guidelines.
Author Contributions
All authors contribute to data analysis, drafting or revising the article, gave final approval of the version to be published, and agree to be accountable for all aspects of the work.
Disclosure
The authors declare that they have no conflicts of interest.
References
1. Scelo G, Larose TL. Epidemiology and risk factors for kidney cancer. J Clin Oncol. 2018;JCO2018791905. doi:10.1200/JCO.2018.79.1905
2. Siegel RL, Miller KD, Jemal A. Cancer statistics, 2018. CA Cancer J Clin. 2018;68(1):7–30. doi:10.3322/caac.21442
3. Lalani AA, McGregor BA, Albiges L, et al. Systemic treatment of metastatic clear cell renal cell carcinoma in 2018: current paradigms, use of immunotherapy, and future directions. Eur Urol. 2019;75(1):100–110. doi:10.1016/j.eururo.2018.10.010
4. Luo Y, Liu F, Yan C, et al. Long non-coding RNA CASC19 sponges microRNA-532 and promotes oncogenicity of clear cell renal cell carcinoma by increasing ets1 expression. Cancer Manag Res. 2020;12:2195–2207. doi:10.2147/CMAR.S242472
5. Garzon R, Calin GA, Croce CM. MicroRNAs in cancer. Annu Rev Med. 2009;60(1):167–179. doi:10.1146/annurev.med.59.053006.104707
6. Hayes J, Peruzzi PP, Lawler S. MicroRNAs in cancer: biomarkers, functions and therapy. Trends Mol Med. 2014;20(8):460–469. doi:10.1016/j.molmed.2014.06.005
7. Wang C, Tang K, Li Z, Chen Z, Xu H, Ye Z. Targeted p21(WAF1/CIP1) activation by miR-1236 inhibits cell proliferation and correlates with favorable survival in renal cell carcinoma. Urol Oncol. 2016;34(2):
8. Jiao D, Wu M, Ji L, Liu F, Liu Y. MicroRNA-186 suppresses cell proliferation and metastasis through targeting sentrin-specific protease 1 in renal cell carcinoma. Oncol Res. 2018;26(2):249–259. doi:10.3727/096504017X14953948675430
9. Wang X, Luo G, Zhang K, et al. Hypoxic tumor-derived exosomal miR-301a mediates M2 macrophage polarization via PTEN/PI3Kγ to promote pancreatic cancer metastasis. Cancer Res. 2018;78(16):4586–4598. doi:10.1158/0008-5472.CAN-17-3841
10. Shi W, Gerster K, Alajez NM, et al. MicroRNA-301 mediates proliferation and invasion in human breast cancer. Cancer Res. 2011;71(8):2926–2937. doi:10.1158/0008-5472.CAN-10-3369
11. Li X, Li J, Cai Y, et al. Hyperglycaemia-induced miR-301a promotes cell proliferation by repressing p21 and Smad4 in prostate cancer. Cancer Lett. 2018;418:211–220. doi:10.1016/j.canlet.2018.01.031
12. Cui L, Li Y, Lv X, et al. Expression of MicroRNA-301a and its functional roles in malignant melanoma. Cell Physiol Biochem. 2016;40(1–2):230–244. doi:10.1159/000452540
13. Song MS, Salmena L, Pandolfi PP. The functions and regulation of the PTEN tumour suppressor. Nat Rev Mol Cell Biol. 2012;13(5):283–296. doi:10.1038/nrm3330
14. Delahunt B, Cheville JC, Martignoni G, et al. Members of the ISUP renal tumor panel. the international society of urological pathology (ISUP) grading system for renal cell carcinoma and other prognostic parameters. Am J Surg Pathol. 2013;37(10):1490–1504. doi:10.1097/PAS.0b013e318299f0fb
15. Xu T, Zhu Y, Wei QK, et al. A functional polymorphism in the miR-146a gene is associated with the risk for hepatocellular carcinoma. Carcinogenesis. 2008;29(11):2126–2131. doi:10.1093/carcin/bgn195
16. Svoronos AA, Engelman DM, Slack FJ. OncomiR or tumor suppressor? The duplicity of MicroRNAs in cancer. Cancer Res. 2016;76(13):3666–3670. doi:10.1158/0008-5472.CAN-16-0359
17. Damodaran C, Das TP, Papu John AM, et al. miR-301a expression: a prognostic marker for prostate cancer. Urol Oncol. 2016;34(8):
18. Li J, Yen C, Liaw D, et al. PTEN, a putative protein tyrosine phosphatase gene mutated in human brain, breast, and prostate cancer. Science. 1997;275(5308):1943–1947. doi:10.1126/science.275.5308.1943
19. Ramaswamy S, Nakamura N, Vazquez F, et al. Regulation of G1 progression by the PTEN tumor suppressor protein is linked to inhibition of the phosphatidylinositol 3-kinase/Akt pathway. Proc Natl Acad Sci U S A. 1999;96(5):2110–2115. doi:10.1073/pnas.96.5.2110
20. Sánchez I, Dynlacht BD. New insights into cyclins, CDKs, and cell cycle control. Semin Cell Dev Biol. 2005;16(3):311–321. doi:10.1016/j.semcdb.2005.02.007
21. Nakayama KI, Nakayama K. Ubiquitin ligases: cell-cycle control and cancer. Nat Rev Cancer. 2006;6(5):369–381. doi:10.1038/nrc1881
22. Puc J, Keniry M, Li HS, et al. Lack of PTEN sequesters CHK1 and initiates genetic instability. Cancer Cell. 2005;7(2):193–204. doi:10.1016/j.ccr.2005.01.009
23. Kim SJ, Lee HW, Baek JH, et al. Activation of nuclear PTEN by inhibition of Notch signaling induces G2/M cell cycle arrest in gastric cancer. Oncogene. 2016;35(2):251–260. doi:10.1038/onc.2015.80
24. He J, Kang X, Yin Y, Chao KS, Shen WH. PTEN regulates DNA replication progression and stalled fork recovery. Nat Commun. 2015;6(1):7620.
25. Wang G, Li Y, Wang P, et al. PTEN regulates RPA1 and protects DNA replication forks. Cell Res. 2015;25(11):1189–1204. doi:10.1038/cr.2015.115
26. van Ree JH, Nam HJ, Jeganathan KB, Kanakkanthara A, van Deursen JM. Pten regulates spindle pole movement through Dlg1-mediated recruitment of Eg5 to centrosomes. Nat Cell Biol. 2016;18(7):814–821. doi:10.1038/ncb3369
27. Zhang Z, Hou SQ, He J, Gu T, Yin Y, Shen WH. PTEN regulates PLK1 and controls chromosomal stability during cell division. Cell Cycle. 2016;15(18):2476–2485. doi:10.1080/15384101.2016.1203493
28. Mouw JK, Yui Y, Damiano L, et al. Tissue mechanics modulate microRNA-dependent PTEN expression to regulate malignant progression. Nat Med. 2014;20(4):360–367. doi:10.1038/nm.3497
29. Kato M, Putta S, Wang M, et al. TGF-beta activates Akt kinase through a microRNA-dependent amplifying circuit targeting PTEN. Nat Cell Biol. 2009;11(7):881–889. doi:10.1038/ncb1897
30. Yang H, Kong W, He L, et al. MicroRNA expression profiling in human ovarian cancer: miR-214 induces cell survival and cisplatin resistance by targeting PTEN. Cancer Res. 2008;68(2):425–433. doi:10.1158/0008-5472.CAN-07-2488
31. Ma F, Zhang J, Zhong L, et al. Upregulated microRNA-301a in breast cancer promotes tumor metastasis by targeting PTEN and activating Wnt/β-catenin signaling. Gene. 2014;535(2):191–197. doi:10.1016/j.gene.2013.11.035
 © 2020 The Author(s). This work is published and licensed by Dove Medical Press Limited. The full terms of this license are available at https://www.dovepress.com/terms.php and incorporate the Creative Commons Attribution - Non Commercial (unported, v3.0) License.
By accessing the work you hereby accept the Terms. Non-commercial uses of the work are permitted without any further permission from Dove Medical Press Limited, provided the work is properly attributed. For permission for commercial use of this work, please see paragraphs 4.2 and 5 of our Terms.
© 2020 The Author(s). This work is published and licensed by Dove Medical Press Limited. The full terms of this license are available at https://www.dovepress.com/terms.php and incorporate the Creative Commons Attribution - Non Commercial (unported, v3.0) License.
By accessing the work you hereby accept the Terms. Non-commercial uses of the work are permitted without any further permission from Dove Medical Press Limited, provided the work is properly attributed. For permission for commercial use of this work, please see paragraphs 4.2 and 5 of our Terms.