Back to Journals » OncoTargets and Therapy » Volume 12
miR-19a Is Involved In Progression And Malignancy Of Anaplastic Thyroid Cancer Cells
Authors Calabrese G ![]() , Dolcimascolo A, Caruso G
, Dolcimascolo A, Caruso G ![]() , Forte S
, Forte S ![]()
Received 3 July 2019
Accepted for publication 13 August 2019
Published 13 November 2019 Volume 2019:12 Pages 9571—9583
DOI https://doi.org/10.2147/OTT.S221733
Checked for plagiarism Yes
Review by Single anonymous peer review
Peer reviewer comments 2
Editor who approved publication: Dr Sanjeev K. Srivastava
Giovanna Calabrese,1,* Anna Dolcimascolo,1,* Giuseppe Caruso,2 Stefano Forte3
1Department of Biomedical and Biotechnological Sciences, Physiology Section, University of Catania, Catania 95123, Italy; 2Department of Laboratories, Oasi Research Institute, IRCCs, Troina, EN 94018, Italy; 3Molecular Biology Unit, IOM Ricerca, Viagrande, CT 95029, Italy
*These authors contributed equally to this work
Correspondence: Giovanna Calabrese
Department of Biomedical and Biotechnological Sciences, Physiology Section, University of Catania, Catania 95123, Italy
Email [email protected]
Stefano Forte
IOM Ricerca, Viagrande, CT 95029, Italy
Email [email protected]
Background: MicroRNAs (miRNAs) are endogenous, single-stranded, non-coding RNAs acting as negative regulators of gene expression involved in a number of physiological processes. MiRNAs’ expression is commonly dysregulated in many types of human tumor diseases and cancers, including thyroid cancers, and is often involved in tumor initiation and progression. miR-19a, a member of miR-17-92 cluster, has been demonstrated to promote cell growth in anaplastic thyroid cancer (ATC), the most advanced and aggressive thyroid cancer.
Purpose: In this work, we investigate the potential contribution of miR-19a in thyroid cancer cells poor prognosis and de-differentiation.
Methods: We directly modulated the expression of miR-19a in papillary (PTC) and anaplastic thyroid carcinoma cell lines through transfection of specific miR-19a mimic or inhibitor. Further, we performed gene expression analysis of specific genes to evaluate miR-19a association with cell cycle, differentiation, and poor prognosis.
Results: Our data indicate that miR-19a overexpression in PTC cells significantly promotes cell growth, decreases the expression of differentiation genes and activates poor prognosis genes. Its inhibition in ATC cells reduces cell proliferation and the expression of genes related to poor prognosis but does not affect differentiation.
Conclusion: Our findings reveal the existence of functional associations between miR-19a expression and thyroid cancer progression and malignancy suggesting miR-19a as a novel candidate therapeutic target for ATC.
Keywords: cluster miR-17-92, miR-19a, thyroid carcinoma, poor prognosis, differentiation
Introduction
MiRNAs are an evolutionarily well-preserved class of endogenous small non-coding RNAs (19–25 nt) that negatively control gene expression and play crucial roles in regulating several cellular and biological processes including cell proliferation, differentiation, apoptosis, and metabolism.1–5 Recent studies have also demonstrated that miRNAs deregulation considerably relates with the initiation and progression of numerous human tumors, such as colorectal cancer,6 B cell chronic lymphocytic leukemia,7 lung cancer,8 breast cancer,9 glioblastoma,10 prostate cancer,11 gastric cancer12 and thyroid carcinoma.13 Over 2500 miRNAs have been identified in humans so far14 and approximately 50% of the human miRNA genes are frequently located at fragile sites and genomic regions involved in cancers.15 Numerous tumor-associated miRNAs show oncogenic activity,16 while others that are negatively regulated in neoplastic cells act as tumor suppressors.17
MiR-17-92, a well-known polycistronic miRNA cluster, comprises six different miRNAs (miR-17, miR-18a, miR-19a, miR-20a, miR-19b-1, and miR-92a). Ota et al, in 2004, have identified the oncogenic role of this cluster in dispersed large B cell lymphomas of repeated focal amplifications.18 It has been demonstrated that miR-17-92 cluster may be involved in stimulating proliferation and malignancies also in solid human tumors such as small-cell lung tumor, colon tumor, neuroblastoma, medulloblastoma and gastric cancer.19–21
Although miR-17-92 members all belong to the same family, they may act both as part of the same pattern or independently. Specifically, miR-17-5p is a key regulator of the G1/S phase cell cycle transition and target more than 20 genes involved in this transition;22 miR-17-3p induces cell death and exacerbation of oxidative stress in human retinal pigment epithelial (ARPE-19) cells;23 miR-17-5p and miR-17-3p are strongly overexpressed in clinical ATC samples compared to healthy tissue;24 miRNA-17, miRNA-18a, and miRNA-19a act as oncogenes and may play a role in the process of esophageal squamous cell carcinoma (ESCC);25 miR-20a acts as tumor promoter in colorectal cancer26 and as tumor suppressor in anaplastic thyroid cancer.27 In addition, Olive et al demonstrated that miR-19 is a key oncogenic element of mir-17-92 family promoting cell survival by activating the Akt-mTOR pathway and antagonizing Pten.28
Thyroid tumors represent the most prevalent and incident type of endocrine neoplasia, accounting for approximately 1% of all new cases diagnosed each year.29,30 Data show how hereditary conditions,31 along with gender and age,32 low-iodine diet,33 and radiation exposure,34 play a significant role in the incidence of thyroid tumors. Thyroid tumors can be classified in differentiated (up to approximately 90% of all thyroid tumors), including PTC and FTC, and undifferentiated, such as ATC.35 Unlike PTC and FTC patients, ATC patients have poorer prognosis and reduced overall survival.36
Our group recently demonstrated that miR-19a overexpression in FTC-133 cell line induces a more de-differentiated and aggressive phenotype.37 In this study, we aim to confirm the role of mir-19a overexpression in thyroid cancer progression and malignancy by using another well-differentiated cell line, PTC, showing a miR-19a expression level lower than FTC. In addition, to further support the mir-19a function in promoting tumor progression, we evaluated the effect of its inhibition in ATC cell line, which expresses higher basal level than PTC and FTC. To this end, we evaluated the impact of miR-19a modulation on cell morphology, proliferation, viability, apoptosis, and gene expression after miR mimic/inhibitor transfection.
Our findings suggest a causative role of miR-19a in the maintenance of the undifferentiated state typical of ATC, thus contributing to its associated aggressiveness and clinical outcome, according to its direct impact on downstream molecular pathways in vitro. Further, the modulation of poor prognosis genes may also support its involvement in the development of more effective therapies for the treatment of thyroid cancer.
Materials And Methods
Cell Culture
Three human thyroid cancer cell lines FTC-133 (Sigma-Aldrich, Italy), K1 (Sigma-Aldrich, Italy), and 8505c (Sigma-Aldrich, Italy) were used in this study. FTC-133 cells were cultured in DMEM: Ham’s F12 (1:1) (Sigma-Aldrich, Italy) supplemented with L-Glutamine 2 mM (Euroclone, Italy), penicillin/streptomycin/amphotericin (PSA) (Euroclone, Italy), and 10% Fetal Bovine Serum (FBS) (Sigma-Aldrich, Italy). K1 cells were cultured in DMEM: Ham’s F12: MCDB 105 (2:1:1) (Sigma-Aldrich, Italy) supplemented with L-Glutamine 2 mM (Euroclone, Italy), penicillin/streptomycin/amphotericin (PSA) (Euroclone, Italy), and 10% Fetal Bovine Serum (FBS) (Sigma-Aldrich, Italy), while for 8505c cells, the medium employed was EMEM (Sigma-Aldrich, Italy) containing 1% of nonessential amino acids, L-Glutamine 2 mM, PSA, and 10% FBS. Cells were maintained in a humidified environment at 37°C and 5% CO2/95% air atmosphere and cultured in 75 cm2 culture flasks. The medium was replaced twice a week and cells were split at about 80–90% of the confluence.
Transfection Of K1 And 8505C Cells By Synthetic miRNA Mimic Or Inhibitor
In order to modulate miR-19a expression, K1 and 8505c cells were transfected with specific mirVana miRNA mimic/miRNA inhibitor (hsa-miR-19a-p3; Life Technologies, Camarillo, CA, USA) in accordance with the manufacturer’s instructions. Briefly, both Lipofectamine RNAiMAX reagent (Thermo Fisher Scientific, Italy) and miRNA (10 µM initial concentration) were diluted in Opti- MEM Medium (Thermo Fisher Scientific, Italy). The diluted miRNA solution was added to an equal volume of diluted Lipofectamine RNAiMAX reagent (1:1 ratio) and the resulting solution was incubated for 5 mins at room temperature. K1 and 8505c cells at the appropriate confluence (∼70%) were detached, counted, and 0.25×10⁶ cells/6-well transfected with the miRNA-lipid complexes (miRNA mimic/inhibitor final concentration 0,1µM). Finally, transfected cells were maintained in a humidified environment at 37°C and 5% CO2/95% air atmosphere for 24, 48, and 72 hrs.
For all experiments, cells transfected only with the transfecting agent were used as control. The morphological changes of K1 and 8505c cells after miR-19a modulation were assessed and acquired using a Leica DMI 4000B microscope (Leica, Wetzlar, Germany).
Measurement Of Cell Proliferation Through DAPI Staining
For DAPI staining, 24 and 48 hrs after miR mimic and miR inhibitor transfection, the cells were fixed in 4% PFA for 15 mins and permeabilized in 0.3% Triton X-100 for 5 mins. The cells were washed 3 times with PBS and the nuclei counterstained with DAPI (1:5000) in PBS for 5 mins. Slides were mounted in fluorescent mounting medium Permafluor (Thermo Scientific) and digital images were acquired using a Leica DMI4000B fluorescence microscope. At least five images from each sample were taken for the count. Cell count analysis has been performed using Fiji image recognition software.
Measurement Of Cell Viability Through MTT Assay
The cell viability of K1 and 8505c cells, treated with both only transfecting agent and miR mimic/miR inhibitor, respectively, was evaluated by MTT [3-(4,5-dimethylthiazol-2-yl)-2,5-diphenyltetrazolium bromide] (Sigma-Aldrich, Italy) assay. Specifically, 24 and 48 hrs after cell transfection, the medium from each well was removed and replaced with 200 µL of MTT solution (1 mg/mL in FBS-free medium). Following 2 hrs incubation at 37°C and 5% CO2, MTT solution was removed, each well was washed 2 times using cold PBS 0.01 M, and the formed crystals were melted using 200 μL of DMSO. Next, the absorbance at 570 nm was read using a synergy HT plate reader (BioTek Instruments, Inc., VT, United States).
Measurement Of Caspase-3/-7 And Caspase-9 Activity
Briefly, the Caspase-Glo® 3/7 or 9 Buffer and lyophilized Caspase-Glo® 3/7 or 9 Substrate (Promega, Milan, Italy) as well as the 96-well plates containing cells were equilibrated at room temperature (10 mins). The content of the Caspase-Glo® 3/7 or 9 Buffer was transferred into the bottle containing Caspase-Glo® 3/7 or 9 Substrate and mixed by inverting the contents. Fifty microliters of the resulting solutions were added to an equal volume of each sample, the contents of wells were gently mixed using a plate shaker at 500 rpm for 1 min, and the plates were left to incubate at room temperature for 1 hr. Blank reaction consisting of Caspase-Glo® 3/7 or 9 Reagent and vehicle was used as a control. The luminescence of each sample was read using a synergy HT plate reader (BioTek Instruments).
qRT-PCR
For qRT-PCR analyses, total RNA from K1 and 8505c cells was isolated 24, 48, and 72 hrs post-transfection using RNeasy Mini Kit (Qiagen, Germantown, MD, USA) and quantified as previously described.38,39 Three independently isolated and cultured samples were used for each of the 3 time points. cDNA was synthesized from 1 µg of total RNA using ImProm-II Reverse Transcription System (Promega, Milan, Italy). qRT-PCR was performed using SYBR Green method on a 7900HT Real-Time PCR using manufacturer's protocol (Applied Biosystems). Specific primers for each of the investigated molecular endpoint were designed using primer blast and selecting exon-exon junctions on mRNA as target region for annealing. Each sample was tested in triplicate and gene expression was assessed using the 2−ΔΔCt method. RNA from untreated cells was used as reference for relative expression quantitation. The following primers for qRT-PCR were used: CDH1 (Cadherin-1), S100A4 (S100 calcium-binding protein A4), STK-5 (Serine/threonine-protein kinase hal4), Tg (Thyroglobulin 1), Pax8 (Paired box 8), TSHr (thyroid-stimulating hormone receptor), and TTF1 (transcription terminator factor). Oligonucleotide sequences are reported in Supporting table 1. Glyceraldehyde 3-phosphate dehydrogenase (GAPDH) has been used as reference gene. Expression Suite Software v1.1 has been used for data analysis.
The expression levels of miR-19a in K1 and 8505c after its overexpression/inhibition have been calculated as described by Yang et al.40,41
Primer sequences were presented as following: miR-19a, RT: 5ʹ-GTCGTATCCAGTGCAGGGTCCGAGGTATTCGCACTGGATACGACTCAGTTT-3ʹ; Forward: 5ʹ-CTGGAGTGTGCAAATCTATGC-3ʹ; Reverse: 5ʹ- GTGCAGGGTCCGAGGT-3ʹ; U6, RT: 5ʹ-AAAATATGGAACGCTTCACGAATTTG-3ʹ; Forward: 5ʹ-CTCGCTTCGGCAGCACATATACT-3ʹ; Reverse: 5ʹ-ACGCTTCACGAATTTGCGTGTC-3ʹ.
The relative expression level of miR-19a was calculated using 2−ΔΔCt method, with the CT values normalized using U6 as an internal control.
Statistical Analysis
Statistical analyses were performed by one-way ANOVA. Tukey HSD (Honestly Significant Difference) method has been used as post hoc test when the ANOVA reported statistically significant differences to evaluate the differences between the individual time-points or treatment groups.
Results
MiR-19a Is Expressed At Very Low Levels In PTC Compared To FTC And ATC
To quantitatively assess the miR-19a basal levels in PTC and ATC compared to FTC we performed qRT-PCR on total RNA isolated from K1, FTC-133, and 8505c cells. MiR-19a expression levels of PTC and ATC have been compared to FTC and normalized on the control U6 snRNA.
The assessment of miR-19a basal expression, performed by qRT-PCR, indicates that K1 cells produce significantly lower level of mature miR-19a while 8505c cells higher than FTC-133 cells (K1/FTC-133 RQ=0,077893938, **p<0.01; 8505c/FTC-133 RQ= 3,270,828,071, **p<0.01). Post-transfection logarithmic RQ values are reported in Figure 1A.
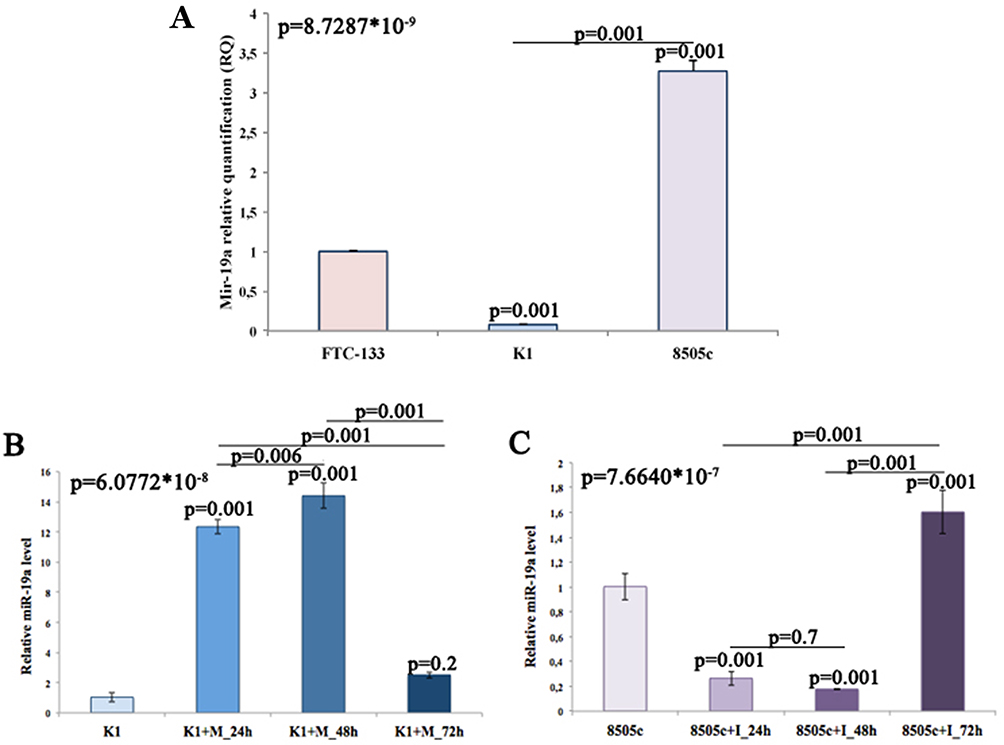 |
Figure 1 Quantification of miR-19a expression levels. (A) Quantitation of miR-19a basal level in three different thyroid cancer cell lines. FTC-133 cells have been used as control group. (B and C) Quantitation of relative miR-19a expression levels time course, using K1 and 8505c untreated cells as control groups. |
MiR mimic/Inhibitor Modulates miR-19a Expression Levels Up To 48 hrs
To evaluate miR-19a expression levels after miR mimic and inhibitor transfection on K1 and 8505c, respectively, we utilized qRT-PCR. MiR-19a expression at 24, 48, and 72 hrs from activation and inhibition was compared to miRNA levels of control groups and normalized to the control U6 snRNA. Our data showed that miRNA levels of miR-19a overexpressing K1 cells, at each time point, were higher than control cells (K1+M_24 hrs: 12.3 ± 0.278, **p<0.01; K1+M_48 hrs: 15.7 ± 0.478, **p<0.01; K1+M_72 hrs: 2.51 ± 0.117, p=0.2) even if K1+M_72 hrs showed no statistically significant trend (Figure 1B). On the other hand, 8505c cells transfected with the miR-19a inhibitor showed a statistically significant decrease of expression levels compared to control cells only at 24 and 48 hrs (8505c+I_24 hrs: 0.265 ± 0.032, **p<0.01; 8505c+I_48 hrs: 0.178 ± 0.003, **p<0.01), while at 72 hrs, expression level was slightly upregulated, exceeding the baseline expression level, in a statistically significant manner (1.60 ± 0.102, **p<0.01) (Figure 1C). These losses of effect of both mimic and inhibitor at 72 hrs from transfection suggest that the effect of miR-19a modulation cannot be assessed after 48 hrs. For this reason, we decided to evaluate the cellular and molecular aspects of miR-19a modulation only until 48 hrs after transfection.
Mir-19a Overexpression On K1 Increases Cell Viability And Proliferation
To investigate the effect of mir-19a mimic overexpression on K1 cells, we analyzed cell morphology, proliferation, and viability at 24 and 48 hrs post-transfection (Figure 2).
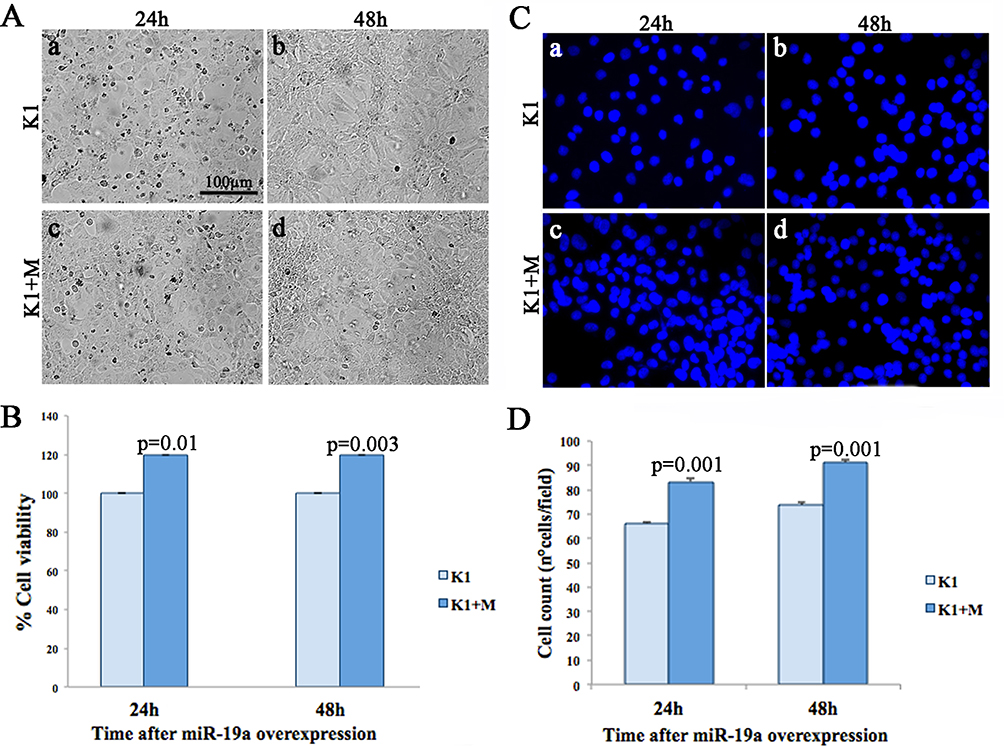 |
Figure 2 Effects of miR-19a overexpression on K1 cell morphology, proliferation, and viability. (A) Morphological analysis of control (a-b) and miR-19a mimic transfected cells (c-d). (B) Cell viability, assessed by MTT, of K1 and K1+M, 24 and 48 hrs post-miR-19a overexpression. (C) Representative DAPI images showing the increase in cell growth upon miR-19a mimic overexpression (c, d) compared to control (a, b). (D) Average nuclei count in control (light blue) and miR-19a mimic transfected cells (blue) after 24 and 48 hrs. |
Upon morphological analysis, we did not observe any significant phenotypic differences (Figure 2A), but an increased proliferation on miR-19a mimic overexpressing K1 cells, at both evaluated time points, 24 and 48 hrs, compared to the control (Figure 2D).
Cell viability on miR-19a overexpressing and control K1 cells, at 24 and 48 hrs, was evaluated by MTT assay. Our data showed a statistically significant increase in cell viability at both 24 (20%±0.033, p=0.01) and 48 hrs (20%±0.008, p=0.03) versus the control cultures (Figure 2B).
According to morphological analysis, nuclei count, performed on K1 cells transfected by miR-19a mimic, showed a significant increase of cell proliferation at both time points (24 and 48 hrs) compared to the control cells (p=0.01 at both 24 and 48 hrs) (Figure 2C and D).
Mir-19a Inhibition On 8505c Reduces Cell Viability And Proliferation
To clarify whether mir-19a exerts specific functions on ATC cells, we analyzed cell morphology, viability, and proliferation at 24 and 48 hrs from its inhibition.
Analogously to the K1 cell line, the morphological analysis of 8505c cells after miR-19a inhibition showed no significant phenotypic change when compared to control cells (Figure 3A) at both analyzed time points (24 and 48 hrs). On the other side, a significant reduction of cell proliferation was visible in miR-19a downregulating 8505c cells (Figure 3C and D).
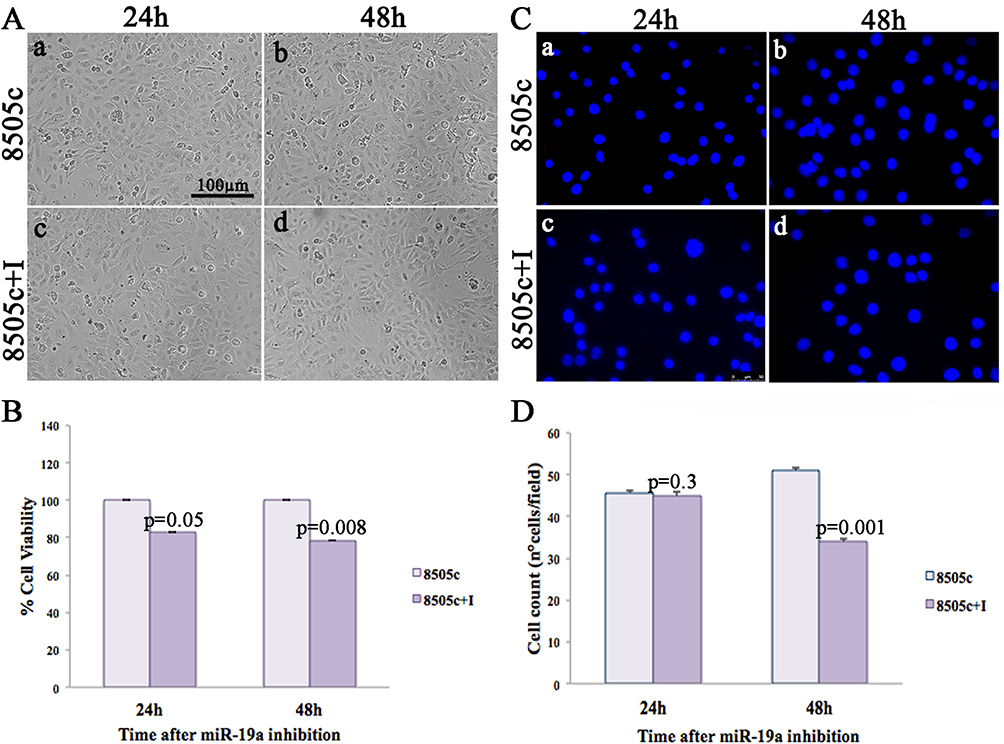 |
Figure 3 Effects of miR-19a inhibition on 8505c cell morphology, proliferation, and viability. (A) Morphological analysis of control (A-B) and miR-19a downregulating (C-D) 8505c cells, after 24 and 48 hrs. (B) Cell viability, assessed by MTT, of 8505c and 8505c+I, 24 and 48 hrs post-miR-19a inhibition. (C) Representative DAPI images showing the decrease of cell proliferation upon miR-19a inhibition (c, d) compared to control (a, b). (D) Average nuclei count in control (light violet) and mir-19a downregulating cells (violet) 24 and 48 hrs after transfection. |
MTT assay performed on 8505c cells after miR-19a inhibition displayed a statistically significant decrease of cell viability compared to control cultures at both examined time points, specifically at 24 (18%±0.0087, p=0.05) and 48 hrs (24%±0.0085, p=0.008) (Figure 3B).
The cell proliferation assay (Figure 3C) showed a significant decrease in cell growth in 8505c downregulating miR-19a cells only at 48 hrs, compared to the control cells (p=0.001) (Figure 3D).
K1 And 8505c Cells Have An Opposing Effect On Apoptosis After miR-19 Up-/DownRegulation
To evaluate the effect of miR-19a mimic overexpression on apoptotic processes, we performed Caspase 3/7 and Caspase 9 analyses at 24 and 48 hrs after transfection in both K1 and 8505c cells. Our data showed that there is no activation of Caspase 3/7 in K1 cells after miR-19a overexpression (Figure 4A) at both time points. Caspase 9 levels significantly decrease at both 24 and 48-hr time points on K1 cells overexpressing miR-19a (Figure 4B; 24 hrs p=0.01; 48 hrs p=0.001). The analyses of Caspase 3/7 and 9 levels in 8505c cells after miR-19a inhibition at 24 and 48 hrs showed significantly increased levels after 48 hrs from inhibition (Figure 4C; Caspase 3/7, p=0.001 and Figure 4D; Caspase 9, p=0.002).
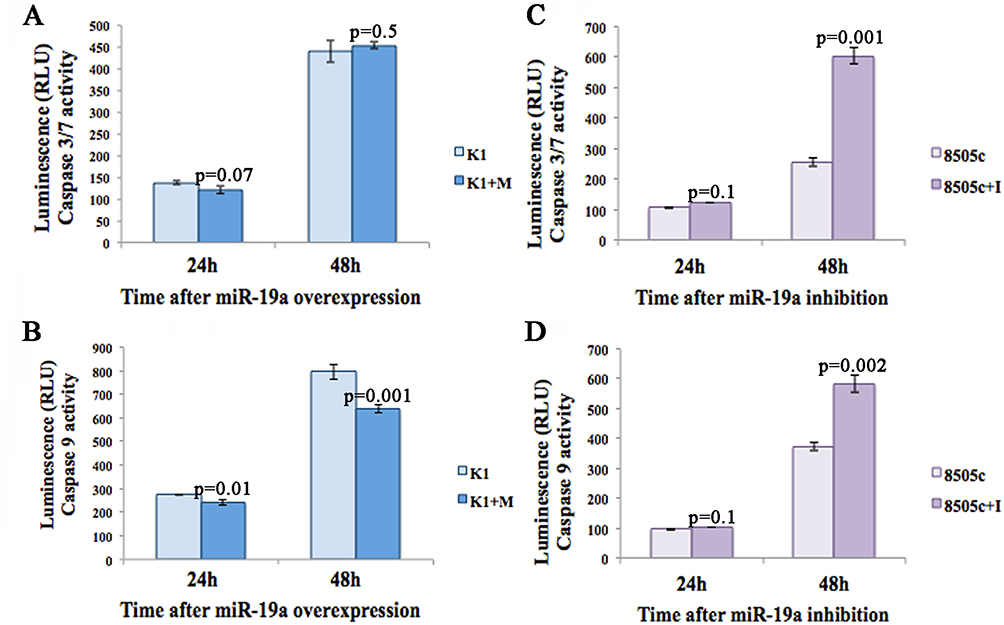 |
Figure 4 Apoptosis assays of K1 and 8505c cells 24 and 48 hrs after miR-19a modulation. (A) Caspase-3/7 and (B) Caspase-9 activity of K1 cells overexpressing miR-19a. (C) Caspase-3/7 and (D) Caspase-9 activity of 8505c cells downregulating miR-19a, after 24 and 48 hrs. Activity is expressed in relative luminescence units (RLU). Each time point indicates the mean and SD of three independent experiments. |
MiR-19a Modulation In K1 And 8505c Cells Alters Their Gene Expression Profile Related To Cell Cycle, Differentiation, And Poor Prognosis
To better evaluate the effect of miR-19a modulation on K1 and 8505c cells, the expression levels of cell cycle genes, such as Cell Division Cycle 25A (CDC25a), Aurora Kinase B (STK5), thyrocyte-specific markers, including Thyroid-Stimulating Hormone receptor (TSHr), Thyroglobulin (Tg), Transcription Termination Factor 1 (TTF1), Paired Box Gene 8 (Pax8), and poor prognosis-related genes, such as Cadherin-1 (CDH1) and S100 calcium-binding protein A4 (S100A4), and have been analyzed (Figures 5 and 6).
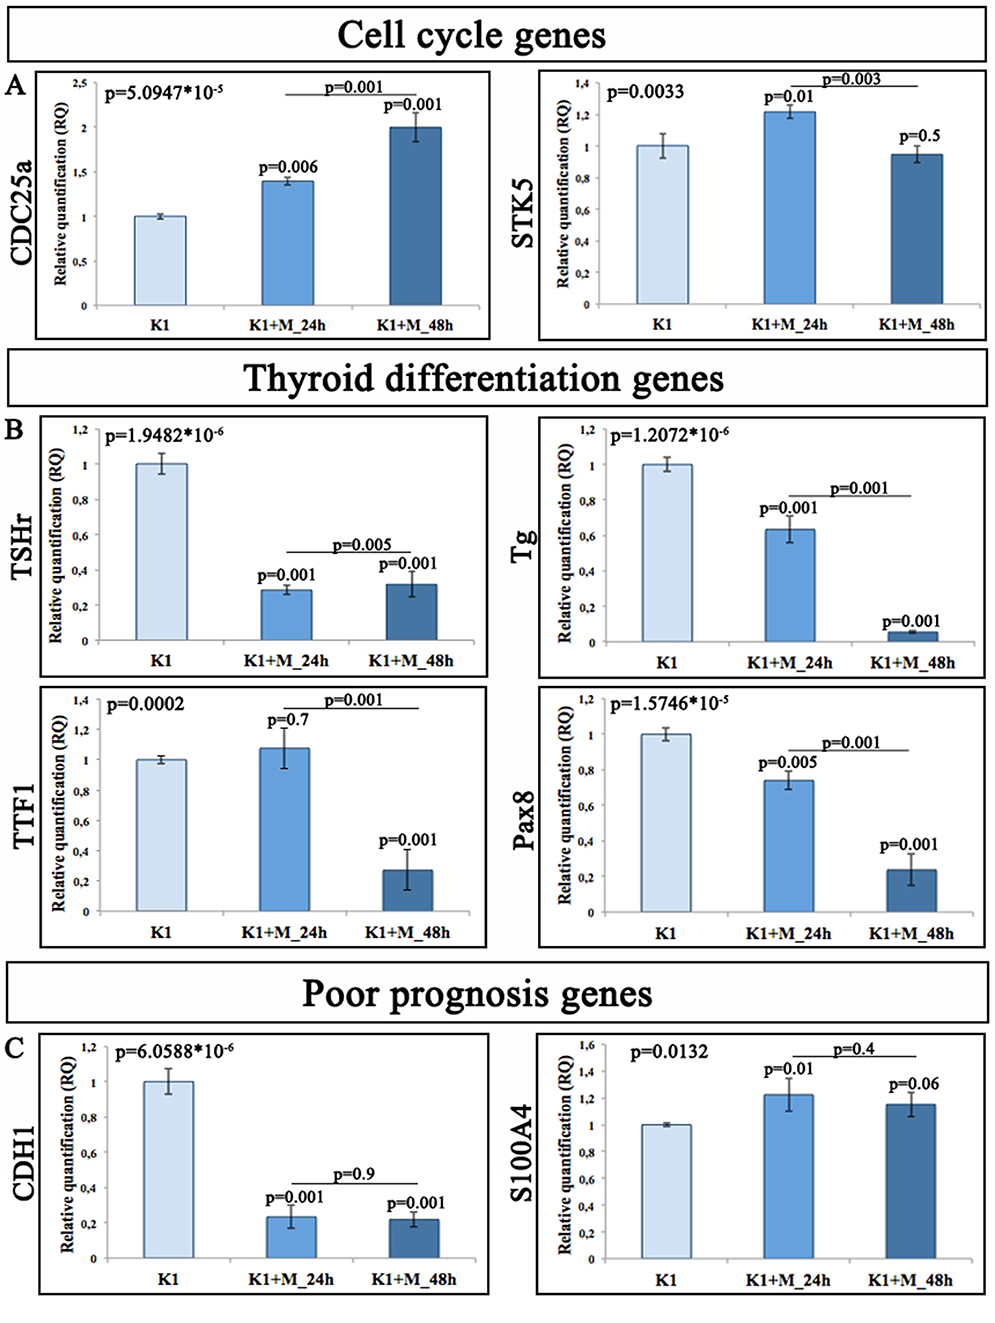 |
Figure 5 Gene expression profile on K1 cells overexpressing miR-19a mimic. Relative quantitation of gene expression (RQ) showing the time-course of genes involved in (A) cell cycle; (B) thyroid differentiation, and (C) poor prognosis. GAPDH has been used as endogenous controls. |
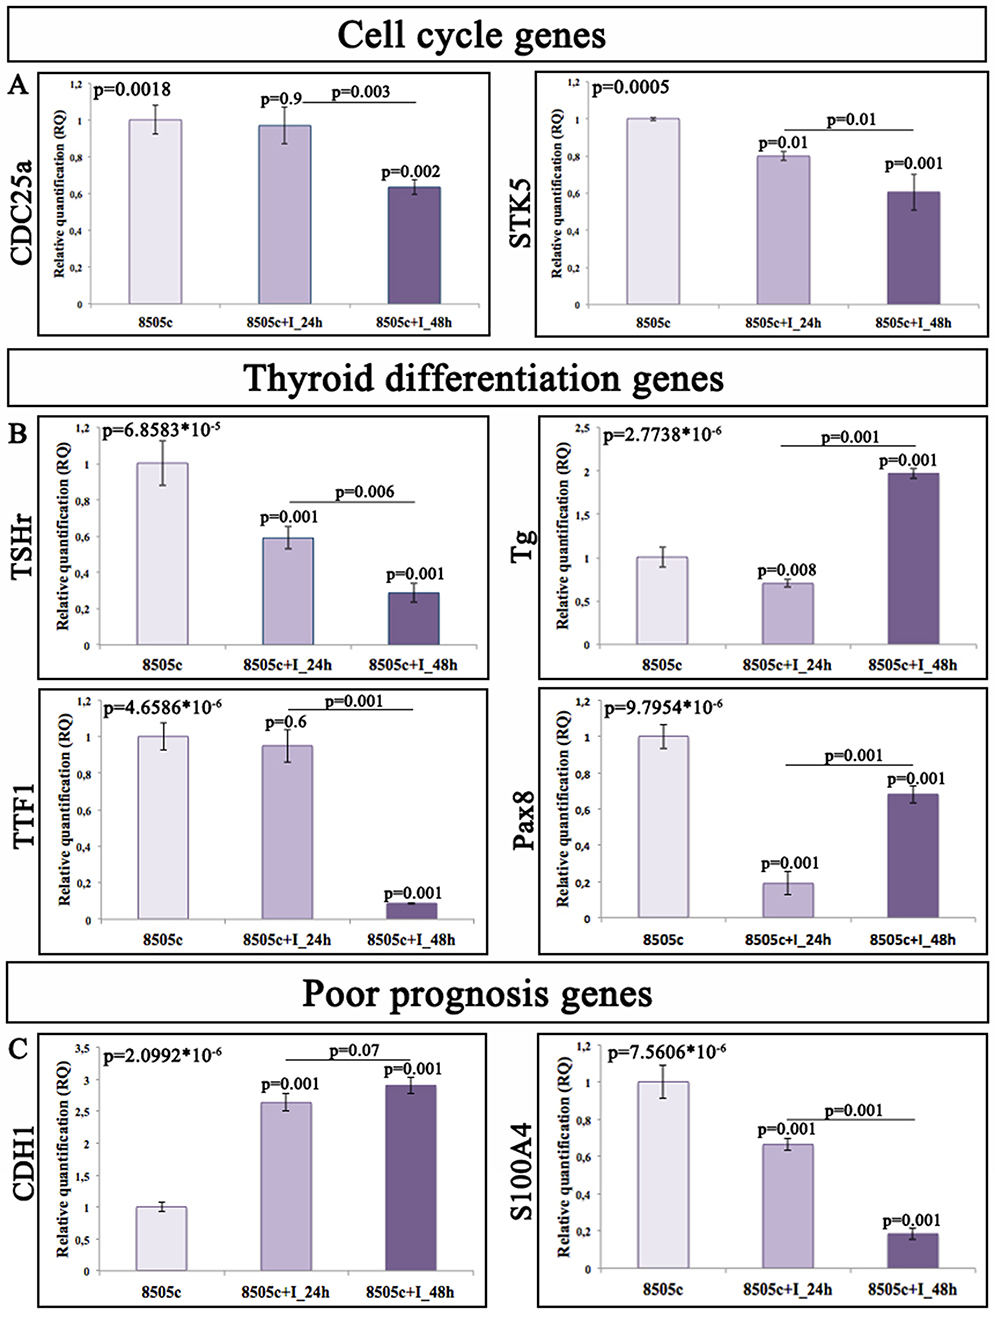 |
Figure 6 Gene expression profile on 8505c cells after miR-19a inhibition. Relative quantitation of gene expression (RQ) showing the time-course of genes involved in (A) cell cycle; (B) thyroid differentiation, and (C) poor prognosis. GAPDH has been used as endogenous controls. |
Our data obtained on K1 cells after miR-19a mimic overexpression displayed a significant marked upregulation of CDC25a at both time points compared to the control and between the two time points (Figure 5A; 24 hr/ctr and 48 hr/ctr_**p<0.01; 48 hrs/24 hrs_**p<0.01). On the other hand, STK5 showed a significant increase only at 24 hrs and a decrease to 48 hrs compared to both control and time 24 hrs (Figure 5A, 24 hr/ctr_*p=<0.05; 48 hr/ctr_p=0.5, 48 hrs/24 hrs_**p<0.01)
K1 cells overexpressing miR-19a showed a statistically significant downregulation of all genes promoting the differentiation of thyroid cells over time (Figure 5B). Particularly, Tg and Pax8 expression levels were significantly downregulated, from 24 hrs to 48 hrs ((Figure 5B; 24 hr/ctr and 48 hr/ctr_**p<0.01) compared to the control. Moreover, K1 cells overexpressing miR-19a, 48 hrs after transfection, exhibited also a statistically significant downregulation compared to the 24 hrs ((Figure 5B; 48 hr/24 hr_**p<0.01). TSHr expression levels showed a statistically significant downregulation at each time point compared to the control group ((Figure 5B; 24 hr/ctr and 48 hr/ctr_**p<0.01), more marked at 24 hrs ((Figure 5B; 48 hr/24 hr_**p<0.01).
The analysis of the TTF1 expression profile showed no variation at 24 hrs and a significant downregulation only at 48 hrs ((Figure 5B; 48 hr/ctr_**p<0.01).
The expression profile of poor prognosis-related genes evaluated on K1 cells overexpressing miR-19a mimic displayed a marked downregulation for CDH1 at each analyzed time point only compared to the control (Figure 5C; 24 hr/ctr and 48 hr/ctr_**p<0.01). S100A4 showed an upregulation at 24 and 48 hrs, statistically significant only at 24 hrs compared to the control (Figure 5C; 24 hr/ctr_**p<0.01).
The analyses of CDC25a and STK5 performed on 8505c cells after miR-19a inhibition showed a statistically significant downregulation at both time points compared to both control and 24-hr groups, even if the decrease of CDC25a expression at 24 hrs compared to the control was not significant (Figure 6A; CDC25a 24 hr/ctr_ p>0.05, 48hr/ctr and 48 hr/24 hr_**p<0.01; STK5 24 hr/ctr and 48 hr/24 hr_*p<0.05, 48 hr/ctr_**p<0.01). The gene expression profile of genes related to the thyroid differentiation showed a great expression variability in all examined genes at each time point with a predominant downregulation, except for Tg, showing an upregulation at 48 hrs (**p<0.01), compared to the control as well as at 24-hr group (Figure 6B).
The gene expression profile of poor prognosis-related genes displayed a statistically significant upregulation of CDH1 and a marked downexpression of S100A4 at each analyzed time point compared to the control and 24-hr groups (Figure 6C; **p<0.01).
Discussion
Recently a great number of findings have elucidated the pivotal role of miRNAs in the regulation of several cellular and biological processes including cell growth, differentiation, apoptosis, and metabolism.42 Despite the relevant number of evidences, a deeper understating of their direct functional involvement in pathological processes is needed in order to develop novel therapeutic strategies. Our results reveal the functional relationship between miR-19a and differentiation and proliferation pathways in thyroid cancer cells. Many investigations resulted in the identification of some miRNAs as fundamental controllers of the mechanisms underlying the development and progression of several types of cancer43 contributing to oncogenesis as tumor suppressor genes (let-7 family, miR-15a-16-1, and miR-143-145 clusters) or as oncogenes (miR-155, miR-21, and miR-17-92 cluster).44 miR-17-92 cluster, also known as oncomir-1, yields a specific polycistronic primary transcript that generates six mature miRNAs, including miR-19a which plays a crucial role in mediating cluster oncogenic activity.28 In some recent studies, it was shown that miR-19a was atypically expressed in malignant laryngeal carcinoma45 and other forms of cancers, involving lung46 and gastric tumors.47 In addition, miR-19a expression was deeply correlated with malignancy invasion and metastasis and poor prognosis of lung tumor,48 osteosarcoma,49 and clear cell renal carcinoma patients50 by constitutively stimulating the NF-κB51 and PI3K/Akt or JAK/STAT signaling pathways.52–54 Since the involvement of miR-19a in the cellular phenotype of thyroid cancer cells was not previously investigated, the goal of this work was to assess the functional impact of its modulation in both PTC and ATC.
The results obtained in the present study suggest that the induction of miR-19a on PTC cells promotes a strong cell proliferation and viability. In contrast, miR-19a inhibition in ATC cells causes a robust reduction in cell growth and viability probably as results of the induction of the apoptotic process by activation of caspases. Since several evidences have already shown that PTEN is one of the known targets of miR-19a, it is also probable that miR-19a overexpression could be related to PTEN silencing stimulating cell proliferation in PTC, while its downexpression stimulates PTEN activation provoking cell growth decrease. Recently it has been suggested that PTEN inactivation is correlated with thyroid tumor progression and aggressiveness, particularly in ATC.55 These data together suggest that miR-19a induces an increased malignancy in well-differentiated thyroid cancer cells probably through stimulating cell proliferation and reducing apoptosis.
Furthermore, gene expression analysis on K1 cells at 24 and 48 hrs after miR-19a overexpression showed that genes and transcription factors involved in thyroid cell differentiation, such as TSHr, Tg, Pax8, and TTF156,57 were strongly downregulated thus highlighting that miR-19a could be involved in the de-differentiated phenotype of thyroid cancer. In addition, also poor prognosis genes58–61 showed a considerable deregulation, confirming our hypothesis on its possible role in the most aggressive thyroid cancer types. In contrast, our qRT-PCR data performed on 8505c cells after miR-19a inhibition, at different time points, showed that this miRNA alone is not able to revert the de-differentiated phenotype of anaplastic tumor cells and acts only on S100A4 and CDH1, two poor prognosis genes involved in cell migration, proliferation, and invasion.60,61
The reported evidences support the hypothesis of a causative role for miR-19a in PTC de-differentiation and in the promoting of “poor prognosis” genes expression also if further studies in particular, on human tissues, are necessary to assess its suitability as new prognostic/therapeutic markers for ATC.
Acknowledgments
This manuscript was supported by the Italian “Ministero dell’Istruzione, dell’Università e della Ricerca” grant PON03PE_00216_1 “Drug delivery: veicoli per un’innovazione sostenibile”. A.D. was supported by a research fellowship no. 4676/2017 from the Biometec, University of Catania, Italy.
Author Contributions
All authors had substantial contribution to the present work. Specifically, G.C. conceived the project, designed the experiments and wrote the paper; A.D. performed the experiments and wrote the paper; Gu.C. contributed to the cell viability test execution; S.F. conceived the project and revised the paper. G.C. and S.F. are also the corresponding authors. All authors contributed towards data analysis, drafting and critically revising the paper, gave final approval of the version to be published, and agreed to be accountable for all aspects of the work.
Disclosure
SF reports grants from the Italian Ministry of University and Research during the conduct of the study. The authors confirm that they have no other conflicts of interest in this work.
References
1. Bartel DP. MicroRNAs: genomics, biogenesis, mechanism, and function. Cell. 2004;116(2):281–297. doi:10.1016/S0092-8674(04)00045-5
2. Lewis BP, Burge CB, Bartel DP. Conserved seed pairing, often flanked by adenosines, indicates that thousands of human genes are microRNA targets. Cell. 2005;120:15–20. doi:10.1016/j.cell.2004.12.035
3. Esquela-Kerscher A, Slack FJ. Oncomirs – microRNAs with a role in cancer. Nat Rev Cancer. 2006;6:259–269. doi:10.1038/nrc1840
4. Garofalo M, Condorelli GL, Croce CM, Condorelli G. MicroRNAs as regulators of death receptors signaling. Cell Death Differ. 2010;17(2):200–208. doi:10.1038/cdd.2009.105
5. Garofalo M, Quintavalle C, Romano G, et al. miR221/222 in cancer: their role in tumor progression and response to therapy. Curr Mol Med. 2012;12(1):27–33. doi:10.2174/156652412798376170
6. Michael SM, O’ Connor SM, van Holst Pellekaan NG. Reduced accumulation of specific MicroRNAs in colorectal neoplasia. Mol Cancer Res. 2003;1(12):882–891.
7. Calin GA, Ferracin M, Cimmino A, et al. A microRNA signature associated with prognosis and progression in chronic lymphocytic leukemia. N Engl J Med. 2005;353:1793–1801. doi:10.1056/NEJMoa050995
8. Yanaihara N, Caplen N, Bowman E, et al. Unique microRNA molecular profiles in lung cancer diagnosis and prognosis. Cancer Cell. 2006;9(3):189–198. doi:10.1016/j.ccr.2006.01.025
9. Iorio MV, Ferracin M, Liu C-G, et al. MicroRNA gene expression deregulation in human breast cancer. Cancer Res. 2005;65(16):7065–7070. doi:10.1158/0008-5472.CAN-05-1783
10. Ciafrè SA, Galardi S, Mangiola A, et al. Extensive modulation of a set of microRNAs in primary glioblastoma. Biochem Biophys Res Commun. 2005;334(4):1351–1358. doi:10.1016/j.bbrc.2005.07.030
11. Wang L, Liu C, Li C, et al. Effects of microRNA- 221/222 on cell proliferation and apoptosis in prostate cancer cells. Gene. 2015;572(2):252–258. doi:10.1016/j.gene.2015.07.017
12. Xia JT, Chen LZ, Jian WH, et al. MicroRNA362 induces cell proliferation and apoptosis resistance in gastric cancer by activation of NF-κB signaling. J Transl Med. 2014;12:33. doi:10.1186/1479-5876-12-33
13. Marini F, Luzi E, Brandi ML. MicroRNA role in thyroid cancer development. J Thyroid Res. 2011;2011:407123. doi:10.4061/2011/407123
14. Kozomara A, Griffiths-Jones S. miRBase: annotating high confidence microRNAs using deep sequencing data. Nucleic Acids Res. 2014;42(Database issue):D68–D73. doi:10.1093/nar/gkt1181
15. Calin GA, Sevignani C, Dumitru CD, et al. Human microRNA genes are frequently located at fragile sites and genomic regions involved in cancers. Proc Natl Acad Sci U S A. 2004;101(9):2999–3004. doi:10.1073/pnas.0307323101
16. He L, Thomson JM, Hemann MT, et al. A microRNA polycistron as a potential human oncogene. Nature. 2005;435(7043):828–833. doi:10.1038/nature03552
17. O’Donnell KA, Wentzel EA, Zeller KI, et al. c-Myc-regulated microRNAs modulate E2F1 expression. Nature. 2005;435(7043):839–843. doi:10.1038/nature03677
18. Ota A, Tagawa H, Karnan S, et al. Identification and characterization of a novel gene, C13orf25, as a target for 13q31-q32 amplification in malignant lymphoma. Cancer Res. 2004;64(9):3087–3095. doi:10.1158/0008-5472.CAN-03-3773
19. Hayashita Y, Osada H, Tatematsu Y, et al. A polycistronic microRNA cluster, miR-17-92, is overexpressed in human lung cancers and enhances cell proliferation. Cancer Res. 2005;65(21):9628–9632. doi:10.1158/0008-5472.CAN-05-2352
20. Volinia S, Calin GA, Liu CG, et al. A microRNA expression signature of human solid tumors defines cancer gene targets. Proc Natl Acad Sci U S A. 2006;103(7):2257–2261. doi:10.1073/pnas.0510565103
21. Schulte JH, Horn S, Otto T, et al. MYCN regulates oncogenic MicroRNAs in neuroblastoma. Int J Cancer. 2008;122(3):699–704. doi:10.1002/ijc.23153
22. Cloonan N, Brown MK, Steptoe AL, et al. The miR-17-5p microRNA is a key regulator of the G1/S phase cell cycle transition. Genome Biol. 2008;9(8):R127. doi:10.1186/gb-2008-9-8-r127
23. Tian B, Maidana DE, Dib B, et al. miR-17-3p exacerbates oxidative damage in human retinal pigment epithelial cells. PLoS One. 2016;11(8):e0160887. doi:10.1371/journal.pone.0160887
24. Takakura S, Mitsutake N, Nakashima M, et al. Oncogenic role of miR-17-92 cluster in anaplastic thyroid cancer cells. Cancer Sci. 2008;99(6):1147–1154. doi:10.1111/j.1349-7006.2008.00800.x
25. Xu X, Jiang YH, Feng JG, et al. MicroRNA-17, microRNA-18a, and microRNA-19a are prognostic indicators in esophageal squamous cell carcinoma. Ann Thorac Surg. 2014;97(3):1037–1045. doi:10.1016/j.athoracsur.2013.10.042
26. Huang G, Chen X, Cai Y, et al. miR-20a-directed regulation of BID is associated with the TRAIL sensitivity in colorectal cancer. Oncol Rep. 2017;37(1):571–578. doi:10.3892/or.2016.5278
27. Xiong Y, Zhang L, Kebebew E. MiR-20a is upregulated in anaplastic thyroid cancer and targets LIMK1. PLoS One. 2014;9(5):e96103. doi:10.1371/journal.pone.0096103
28. Olive V, Bennett MJ, Walker JC, et al. miR-19 is a key oncogenic component of mir-17-92. Genes Dev. 2009;23(24):2839–2849. doi:10.1101/gad.1861409
29. Carlomagno F, Santoro M. Thyroid cancer in 2010: a roadmap for targeted therapies. Nat Rev Endocrinol. 2011;7(2):65–67. doi:10.1038/nrendo.2010.232
30. Curado MP, Edwards B, Shin HR, et al, editors. Cancer Incidence in Five Continents. Lyon, France: IARC Scientific Publications N.160; 2007:Vol. IX.
31. Amoli MM, Yazdani N, Amiri P, et al. HLA-DR association in papillary thyroid carcinoma. Dis Markers. 2010;28(1):49–53. doi:10.3233/DMA-2010-0683
32. Jonklaas J, Nogueras-Gonzalez G, Munsell M, et al. The impact of age and gender on papillary thyroid cancer survival. J Clin Endocrinol Metab. 2012;97(6):E878–E887. doi:10.1210/jc.2011-2864
33. Li JH, He ZH, Bansal V, Hennessey JV. Low iodine diet in differentiated thyroid cancer: a review. Clin Endocrinol (Oxf). 2016;84:3–12. doi:10.1111/cen.12846
34. Iglesias ML, Schmidt A, Ghuzlan AA. Radiation exposure and thyroid cancer: a review. Arch Endocrinol Metab. 2017;61(2):180–187. doi:10.1590/2359-3997000000257
35. Patel KN, Shaha AR. Poorly differentiated and anaplastic thyroid cancer. Cancer Control. 2006;13(2):119–128. doi:10.1177/107327480601300206
36. Parenti R, Salvatorelli L, Magro G. Anaplastic thyroid carcinoma: current treatments and potential new therapeutic options with emphasis on TfR1/CD71. Int J Endocrinol. 2014;2014:685396. doi:10.1155/2014/685396
37. Calabrese G, Dolcimascolo A, Torrisi F, et al. MiR-19a overexpression in FTC-133 cell line induces a more de-differentiated and aggressive phenotype. Int J Mol Sci. 2018;19:3944. doi:10.3390/ijms19123944
38. Vicari L, La Rosa C, Forte S, et al. Differential expression of two activating transcription factor 5 isoforms in papillary thyroid carcinoma. Onco Targets Ther. 2016;9:6225–6231. doi:10.2147/OTT.S113194
39. Vicari L, Calabrese G, Forte S, et al. Potential role of activating transcription factor 5 during osteogenesis. Stem Cells Int. 2016;2016:5282185. doi:10.1155/2016/5282185
40. Yang J, Gao T, Tang J, et al. Loss of microRNA-132 predicts poor prognosis in patients with primary osteosarcoma. Mol Cell Biochem. 2013;381(1–2):9–15. doi:10.1007/s11010-013-1677-8
41. Chen C, Ridzon DA, Broomer AJ, et al. Real-time quantification of microRNAs by stem–loop RT–PCR. Nucleic Acids Res. 2005;33(20):e179. doi:10.1093/nar/gni178
42. Nikiforova MN, Chiosea SI, Nikiforov YE. MicroRNA expression profiles in thyroid tumors. Endocr Pathol. 2009;20(2):85–91. doi:10.1007/s12022-009-9069-z
43. Calin GA, Dumitru CD, Shimizu M, et al. Frequent deletions and down-regulation of micro-RNA genes miR15 and miR16 at 13q14 in chronic lymphocytic leukemia. Proc Natl Acad Sci USA. 2002;99:15524–15529. doi:10.1073/pnas.242606799
44. Zhang B, Pan X, Cobb GP, Anderson TA. microRNAs as oncogenes and tumor suppressors. Dev Biol. 2007;302(1):1–12. doi:10.1016/j.ydbio.2006.08.028
45. Marioni G, Agostini M, Cappellesso R, et al. miR-19a and SOCS-1 expression in the differential diagnosis of laryngeal (glottic) verrucous squamous cell carcinoma. J Clin Pathol. 2015;69(5):415–421. doi:10.1136/jclinpath-2015-203308
46. Li J, Yang S, Yan W, et al. MicroRNA-19 triggers epithelial-mesenchymal transition of lung cancer cells accompanied by growth inhibition. Lab Invest. 2015;95:1056–1070. doi:10.1038/labinvest.2015.76
47. Qin S, Ai F, Ji WF, et al. miR-19a promotes cell growth and tumorigenesis through targeting SOCS1 in gastric cancer. Asian Pac J Cancer Prev. 2013;14(2):835–840. doi:10.7314/APJCP.2013.14.2.835
48. Ma Q, Peng Z, Wang L, et al. miR-19a correlates with poor prognosis of clear cell renal cell carcinoma patients via promoting cell proliferation and suppressing PTEN/SMAD4 expression. Int J Oncol. 2016;49(6):2589–2599. doi:10.3892/ijo.2016.3746
49. Zou P, Ding J, Fu S. Elevated expression of microRNA19a predicts a poor prognosis in patients with osteosarcoma. Pathol Res Pract. 2017;213(3):194–198. doi:10.1016/j.prp.2016.12.020
50. Yang F, Wang H, Jiang Z, et al. MicroRNA-19a mediates gastric carcinoma cell proliferation through the activation of nuclear factor-κB. Mol Med Rep. 2015;12:5780–5786. doi:10.3892/mmr.2015.4151
51. Li HW, Xie Y, Li F, et al. Effect of miR-19a and miR-21 on the JAK/STAT signaling pathway in the peripheral blood mononuclear cells of patients with systemic juvenile idiopathic arthritis. Exp Ther Med. 2016;11:2531–2536. doi:10.3892/etm.2016.3188
52. Xie CY, Kong JR, Zhao CS, et al. Molecular characterization and function of a PTEN gene from Litopenaeus vannamei after Vibrio alginolyticus challenge. Dev Comp Immunol. 2016;59:77–88. doi:10.1016/j.dci.2016.01.004
53. Forte S, Pagliuca A, Maniscalchi ET, et al. Gene expression analysis of PTEN positive glioblastoma stem cells identifies DUB3 and Wee1 modulation in a cell differentiation model. PLoS One. 2013;8(12):e81432. doi:10.1371/journal.pone.0081432
54. Lewis BP, Shih I, Jones-Rhoades MW, et al. Prediction of mammalian microRNA targets. Cell. 2003;115(7):787–798. doi:10.1016/S0092-8674(03)01018-3
55. Frisk T, Foukakis T, Dwight T, et al. Silencing of the PTEN tumor suppressor gene in anaplastic thyroid cancer. Genes Chromosomes Cancer. 2002;35:74–80. doi:10.1002/gcc.10098
56. Ma R, Latif R, Davies TF. Thyroid Follicle Formation and Thyroglobulin expression in multipotent endodermal stem cells. Thyroid. 2013;23(4):385–391. doi:10.1089/thy.2012.0644
57. Fabbro D, Di Loreto C, Beltrami CA, et al. Expression of thyroid-specific transcription factors TTF-1 and PAX-8 in human thyroid neoplasms. Cancer Res. 1994;54(17):4744–4749.
58. Yutaka Y, Endou Y, Kimura K, et al. Inverse expression of S100A4 and E-cadherin is associated with metastatic potential in gastric cancer. Clin Cancer Res. 2000;6(11):4234–4242.
59. Montero-Conde C, Martín-Campos JM, Lerma E, et al. Molecular profiling related to poor prognosis in thyroid carcinoma. Combining gene expression data and biological information. Oncogene. 2008;27:1554–1561. doi:10.1038/sj.onc.1210792
60. Zou M, Al-Baradie RS, Al-Hindi H, Farid NR, Shi Y. S100A4 (Mts1) gene overexpression is associated with invasion and metastasis of papillary thyroid carcinoma. Br J Cancer. 2005;93(11):1277–1284. doi:10.1038/sj.bjc.6602856
61. Brabant G, Hoang-Vu C, Cetin Y, et al. E-cadherin: a differentiation marker in thyroid malignancies. Cancer Res. 1993;53(20):4987–4993.
 © 2019 The Author(s). This work is published and licensed by Dove Medical Press Limited. The
full terms of this license are available at https://www.dovepress.com/terms
and incorporate the Creative Commons Attribution
- Non Commercial (unported, 3.0) License.
By accessing the work you hereby accept the Terms. Non-commercial uses of the work are permitted
without any further permission from Dove Medical Press Limited, provided the work is properly
attributed. For permission for commercial use of this work, please see paragraphs 4.2 and 5 of our Terms.
© 2019 The Author(s). This work is published and licensed by Dove Medical Press Limited. The
full terms of this license are available at https://www.dovepress.com/terms
and incorporate the Creative Commons Attribution
- Non Commercial (unported, 3.0) License.
By accessing the work you hereby accept the Terms. Non-commercial uses of the work are permitted
without any further permission from Dove Medical Press Limited, provided the work is properly
attributed. For permission for commercial use of this work, please see paragraphs 4.2 and 5 of our Terms.