")
Back to Journals » OncoTargets and Therapy » Volume 11
miR-1269 promotes cell survival and proliferation by targeting tp53 and caspase-9 in lung cancer
Authors Bao M, Song YJ, Xia JJ, Li PL, Liu Q, Wan ZR
Received 21 November 2017
Accepted for publication 18 January 2018
Published 26 March 2018 Volume 2018:11 Pages 1721—1732
DOI https://doi.org/10.2147/OTT.S157715
Checked for plagiarism Yes
Review by Single anonymous peer review
Peer reviewer comments 2
Editor who approved publication: Dr Ingrid Espinoza
Min Bao, Yingjian Song, Jingjing Xia, Pengling Li, Qing Liu, Zongren Wan
Department of Pneumology, Huai’an First People’s Hospital, Huai’an, China
Background and aim: Lung cancer is the leading cause of cancer death worldwide. In this study, we aim to elucidate the role of miR-1269 in the pathogenesis of lung cancer.
Methods and results: From the results of analyses using The Cancer Genome Atlas (TCGA) database, we noted the expression of miR-1269 was increased in lung cancer tissue. miR-1269 expression was detected in both the normal adjacent lung tissue and in the tumorous lung tissue of lung cancer patients, and miR-1269 was more highly expressed in the tumors. High expression of miR-1269 correlated with patients’ tumor stage and lymph node metastasis. A Cell Counting Kit-8 (CCK8) analysis and a cloning formation assay showed that overexpression of miR-1269 significantly promoted the growth of A549 cells, and that a lower expression of miR-1269 significantly increased cell apoptosis. We used the TargetScan 6.2 Database to predict the potential targets of miR-1269, and a luciferase activity assay was used to determine the direct interaction between miR-1269, tumor protein p53 (TP53), and caspase-9. Results from Western blots and real-time PCR showed that overexpression of miR-1269 significantly inhibited TP53 and caspase-9 expression. In addition, caspase-3 activity was found to decrease in a miR-1269 mimic group. The results showed that gene silencing of TP53 and caspase-9 significantly inhibited A549 cell growth and promoted cell apoptosis. The results also showed that the inhibition of miR-1269 and caspase-9 expression inhibited cell apoptosis. Immunohistochemistry (IHC) results demonstrated that TP53 and caspase-9 were expressed in low levels in tumor tissues, and that an inverse correlation exists between miR-1269 expression levels and TP53 or caspase-9 expression levels.
Conclusion: These results demonstrate that miR-1269 promotes cell survival and proliferation by targeting TP53 and caspase-9 in lung cancer.
Keywords: microRNA-1269, tumor protein p53, caspase, cell apoptosis, lung carcinoma
Introduction
Lung cancer, due to its associated malignant tumors, currently has one of the highest incidence and mortality rates among variants of the disease. According to the histological characteristics provided by the World Health Organization (WHO), lung cancer can be divided into two subtypes: small cell lung cancer (SCLC) and non-small cell lung (NSCLC). It is also reported that NSCLC accounts for about 80% of the total lung cancer incidence.1,2 Due to a lack of valid diagnosis methods for early-onset lung cancer, most patients are unfortunately diagnosed at the later stages of the disease, when the prognosis is poor and where the 5-year survival rate is only about 15%.3 There is now an imperative need for more research dedicated to the search for new tumor markers or therapeutic targets for lung cancer.
MicroRNAs (miRNAs) are small, non-coding RNA molecules of 19–25 nucleotides which are known to play important roles in cell apoptosis,4 proliferation and differentiation,5 tumorigenesis,6 growth development,7 virus infection, and inflammation,8,9 which can regulate gene expression via the 3′ untranslated regions (UTRs) of target mRNAs.10 Studies have showed that an miRNA can regulate multiple target gene expression and that different miRNAs can regulate the same gene expression. It has previously been found that miRNA expression is altered in various tumors cells.11–13 miR-1269 was found to be overexpressed in colorectal, liver and esophagus cancers and to further regulate cell proliferation, apoptosis, epithelial–mesenchymal transition (EMT), and metastasis.14–17 It is believed that miR-1269 could be a potentially prognostic biomarker and therapeutic target, however the precise role of miR-1269 in lung cancer is as yet unknown.
In our study, miR-1269 expression and its target genes were predicted using bioinformatics analyses. We found that miR-1269 is overexpressed in lung cancer and is closely related to rates of survival. Cell survival and proliferation were also examined to study the related mechanisms.
Material and methods
Patients and tissue samples
Our research included a total of 52 samples from lung cancer patients, and all tissue specimens were obtained from surgical tumor resections in Huai’an First People’s Hospital. Adjacent normal lung tissue specimens were collected from the patients as a negative control. Ethical approval for the study was provided by the ethics committee of Huai’an First People’s Hospital. Written informed consent was obtained from the study subjects. Preoperative clinical and pathological follow-up data were completed by all patients.
Cell lines and oligonucleotide transfection
A549 cells were obtained from the Shanghai Cell Bank, Chinese Academy of Sciences (Shanghai, China). Cells were cultured in DMEM (Thermo Fisher Scientific, Waltham, MA, USA) with supplements of 10% heat-inactivated fetal bovine serum (Thermo Fisher Scientific), 100× penicillin-streptomycin solution (Thermo Fisher Scientific), and incubated in the incubator (Thermo Fisher Scientific) at 37°C, 100% humidity, and 5% CO2. The miR-1269 mimics/inhibitors, mimics/inhibitors negative control (NC), and miR-1269 mutant mimics were purchased from RiboBio (Guangzhou, China). Cells were transfected using Lipofectamine 2000 (Thermo Fisher Scientific) at 70%–90% confluency, and transfected again 24 h later. Twenty-four hours after transfection, cells were harvested for further studies. The sequences are listed in Table 1.
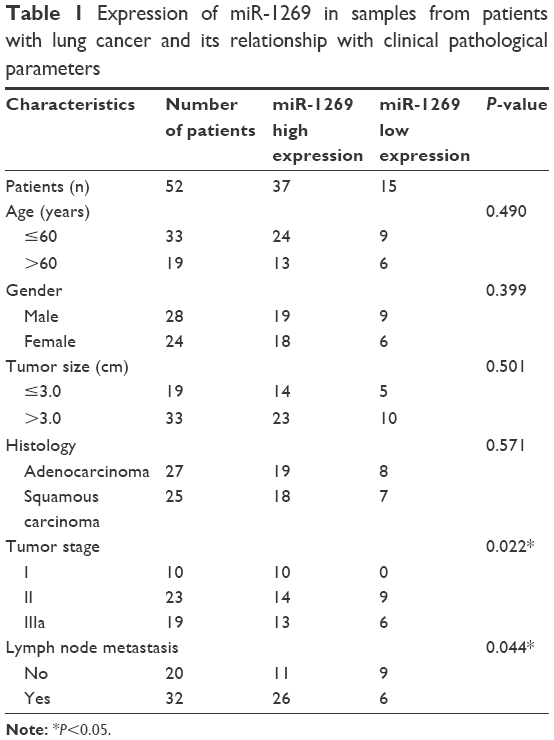 | Table 1 Expression of miR-1269 in samples from patients with lung cancer and its relationship with clinical pathological parameters |
miRNA transfection
Cells were seeded in antibiotic-free medium the day before transfection. The cells were transfected with 50 nmol/L of tumor protein p53 (TP53)/caspase-9-siRNA or the negative control using Lipofectamine™ 2000 (Thermo Fisher Scientific) according to the instructions provided by the manufacturer. After 48 h, the transfected cells were collected and processed for further studies.
Cell grouping and CCK-8 assay
Cells were divided into the following groups: a control group (cell transfection with miR-1269 mimics/inhibitors NC), a miR-1269 mimic group (cell transfection with miR-1269 mimics), a miR-1269 inhibitors group (cell transfection with miR-1269 inhibitors), a siNC group (cell transfection with NC), siTP53 (cell transfection with TP53-siRNA), a siCaspase-9 group (cell transfection with caspase-9-siRNA), a miR-1269 inhibitor+siNC group (cell co-transfection with miR-1269 inhibitors and NC), a miR-1269 inhibitor+siCaspase-9 group (cell co-transfection with miR-1269 inhibitors and caspase-9-siRNA), and a miR-1269 inhibitor+Z-VAD-FMK group (cell transfection with miR-1269 inhibitors while cells were in incubation with 0.1% Z-VAD-FMK). A549 cells (1×10⁵ cells per well) were seeded in 96-well plates and cultured for 24 h. A Cell Counting Kit-8 (CCK8) assay (Dojindo Molecular Technologies, Gaithersburg, MD, USA) was used to detect A459 cell proliferation. Cells in different groups were then cultured for another 12, 24 and 48 h. Subsequently, all cells were treated with a 10 μl CCK8 solution at 37°C for 4 h. The plate was then read at 450 nm to obtain a cell growth curve using an iMark microplate absorbance reader (Bio-Rad Laboratories, Inc., Hercules, CA, USA). All experiments were repeated three times.
Colony formation assay
Cells were seeded into 6-cm tissue culture dishes (0.5×10³ cells per well) and cultured for 14 days. Cells were then fixed with 10% formaldehyde for 15 min and subsequently stained with 1.0% crystal violet for 5 min. The number of colonies formed was counted in 10 different fields.
Luciferase reporter assay
To validate the TP53/or caspase-9-binding sites in the miR-1269a promoter, an miR-1269a promoter reporter construct with wild-type or mutated TP53/or caspase-9-binding sites was transfected with the pRL-SV40 Renilla luciferase vectors into A549 cells using the LT1 transfection reagent (Mirus Bio LLC, Madison, WI, USA). To validate whether TP53 and caspase-9 were direct targets of miR-1269a, TP53 and caspase-9 luciferase reporter constructs with wild-type or mutated miR-1269a binding sites were transfected with the pRL-SV40 Renilla luciferase vector into A549 cells. Forty-eight hours after transfection, luciferase assays were performed using the dual luciferase reporter assay system (Promega Corporation, Fitchburg, WI, USA). Measurements from triplicate transfections were analyzed after normalization to the firefly luciferase activity.
Apoptosis assay
Cells were plated using 12-well plates and transfected with oligonucleotides. The apoptosis ratio was analyzed 24 h after transfection using the annexin V fluorescein isothiocyanate (FITC) apoptosis detection kit (BD Biosciences, San Jose, CA, USA) according to the manufacturer’s instructions. An annexin V FITC and a propidium iodide (PI) double stain was used to evaluate the percentage of apoptosis. Annexin V and PI cells were used as controls. Annexin V and PI double-stained cells were designated as apoptotic and these cells were also necrotic.
Detection of caspase-3 activation
Cells were plated using 96-well plates, transfected as described above and analyzed 24 and 48 h after transfection using a caspase-3 colorimetric assay kit (Enzo Life Sciences, Inc., Farmingdale, NY USA) according to the manufacturer’s instructions. Samples were read after 1 h of incubation with the caspase substrate on a microtiter plate reader at 400 nm. Tests were repeated three times.
RNA isolation and RT-PCR
Total cellular RNA was extracted using a Trizol reagent (Thermo Fisher Scientific), according to the manufacturer’s protocol. SYBR Green I (Molecular Probes, Thermo Fisher Scientific) was used to quantify PCR amplification and RT-PCR was performed and analyzed using a 7500 Fast Real-Time Sequence detection system (Thermo Fisher Scientific). miRNA quantification was determined by using the Bulge-loop™ miRNA qRT-PCR primer set (one RT primer and a pair of qPCR primers for each set) specific for miR-1269, designed by RiboBio. The relative expression levels of the miRNA were calculated as 2−[(Ct of miRNA) – (Ct of U6)] after normalization with reference to the expression of small nuclear RNA U6. The primers used for stem-loop reverse-transcription PCR for miR-1269a and U6 were purchased from RiboBio. The expression levels of genes were normalized to that of the tubulin as a control and calculated as 2−[(Ct of GENES) – (Ct of Tubulin)]. The following primers were used: TP53 forward, 5′-GAGGCATTACCGGACCAT-3′, TP53 reverse, 5′-TTGTGAGCCGTCAGTTAGCC-3′; caspase-9 forward, 5′-CGTTCTATGGTTACCGACATGACG-3′, caspase-9 reverse, 5′-GTTCCATAGTCATTGAGCATTGTG-3′; tubulin forward, 5′-AATTCGCGTGGTTACCGACAATGGCG-3′, tubulin reverse, 5′-TTGCCTAAATAGGCCACCAG-3′.
Protein preparation and Western blot
Total protein was extracted from cells using a ProteoPrep® Total Extraction Sample kit (Sigma-Aldrich Co., St Louis, MO, USA). The resulting cell lysis was centrifuged 12,000× g at 4°C for 10 min and supernatant proteins were separated by 10%–15% SDS gel electrophoresis and transferred to polyvinylidene fluoride membranes (EMD Millipore, Billerica, MA, USA). Protein expression was analyzed by Western blot using various antibodies at the following dilutions: TP53 antibody (ab65021; 1:600), caspase-9 antibody (ab32539; 1:800) and tubulin antibody (AmyJet Scientific Co. Ltd, Hubei, China; 1:2,000).
Immunohistochemistry
An immunohistochemistry assay was performed as previously described. Lung tissue sections were initially treated for deparaffinization and hydration, then heated in EDTA (pH 8.0) and incubated with 3% hydrogen peroxide for 10 min for antigen retrieval. The reaction of TP53 and caspase-9 antibodies (Abcam, Cambridge, UK) took place for 1 h at room temperature, following incubated by goat anti-mouse horseradish peroxidase-conjugated immunoglobulin G (IgG; Abcam). Slides were stained with DAB (Shanghai Long Island Biotec Co. Ltd, Shanghai, China) and hematoxylin (BaSO, Taipei, Taiwan). Immunohistochemical signals were calculated with the positive staining cells.
Bioinformatics analysis
miRNA expression profiles of lung tumors at different stages were compared by analyzing miRNASeq data from The Cancer Genome Atlas (TCGA) dataset. A total of 440 samples were collected.
Statistical analysis
Data were expressed as mean ± SD of no smaller than three biological repeats, unless otherwise noted. Student’s t-tests and one-way ANOVAs were used in either two or multiple groups for statistical significance, with P<0.05 considered significant. Spearman rank order was used to analyze the correlations between variables. Survival curves were estimated using the Kaplan–Meier method and compared using the log-rank test.
Results
miR-1269 is highly expressed in lung cancer patients
According to the TCGA dataset, we found that miR-1269 was highly expressed in lung cancer patients (Figure 1A). In order to further verify this result, miR-1269 expression levels were determined using RT-PCR in 52 samples of lung cancer tissue; miR-1269 was found to be significantly expressed in tumor tissues at high levels (Figure 1B). miR-1269 was upregulated at RNA level in 71.16% (37/52) of tested specimens (Figure 1C). Fisher’s exact test indicated that miR-1269 expression level was significantly correlated with patients’ tumor stage and lymph node metastasis (Table 1).
 | Figure 1 miR-1269 was highly expressed in lung cancer tissues. 52 lung cancer tissues and their adjacent normal tissues were collected. (A) The expression level of miR-1269 in lung cancer tissue and normal tissues based on The Cancer Genome Atlas (TCGA) dataset. (B and C) The mRNA expression level of miR-1269 was detected by RT-PCR.U6 was detected as the control of sample loading. Data are expressed as the mean ± SD for three independent experiments. ***P<0.0001. |
Upregulation of miR-1269 promotes growth and inhibits apoptosis in A549 cells
smiR-1269 mimics/NC were transfected into A549 cells, and the resulting RT-PCR analysis showed that miR-1269 was significantly higher in the miR-1269 mimic group, compared to the control (P<0.05, Figure 2A). In addition, CCK8 and colony formation assay results showed that the viability of A549 cells was enhanced after cells were transfected with miR-1269 mimics (Figure 2B–D). Cell apoptosis was further determined by flow cytometry analysis. We found that the apoptosis rate in the miR-1269 mimic group was significantly lower than that of control group (Figure 2E and F).
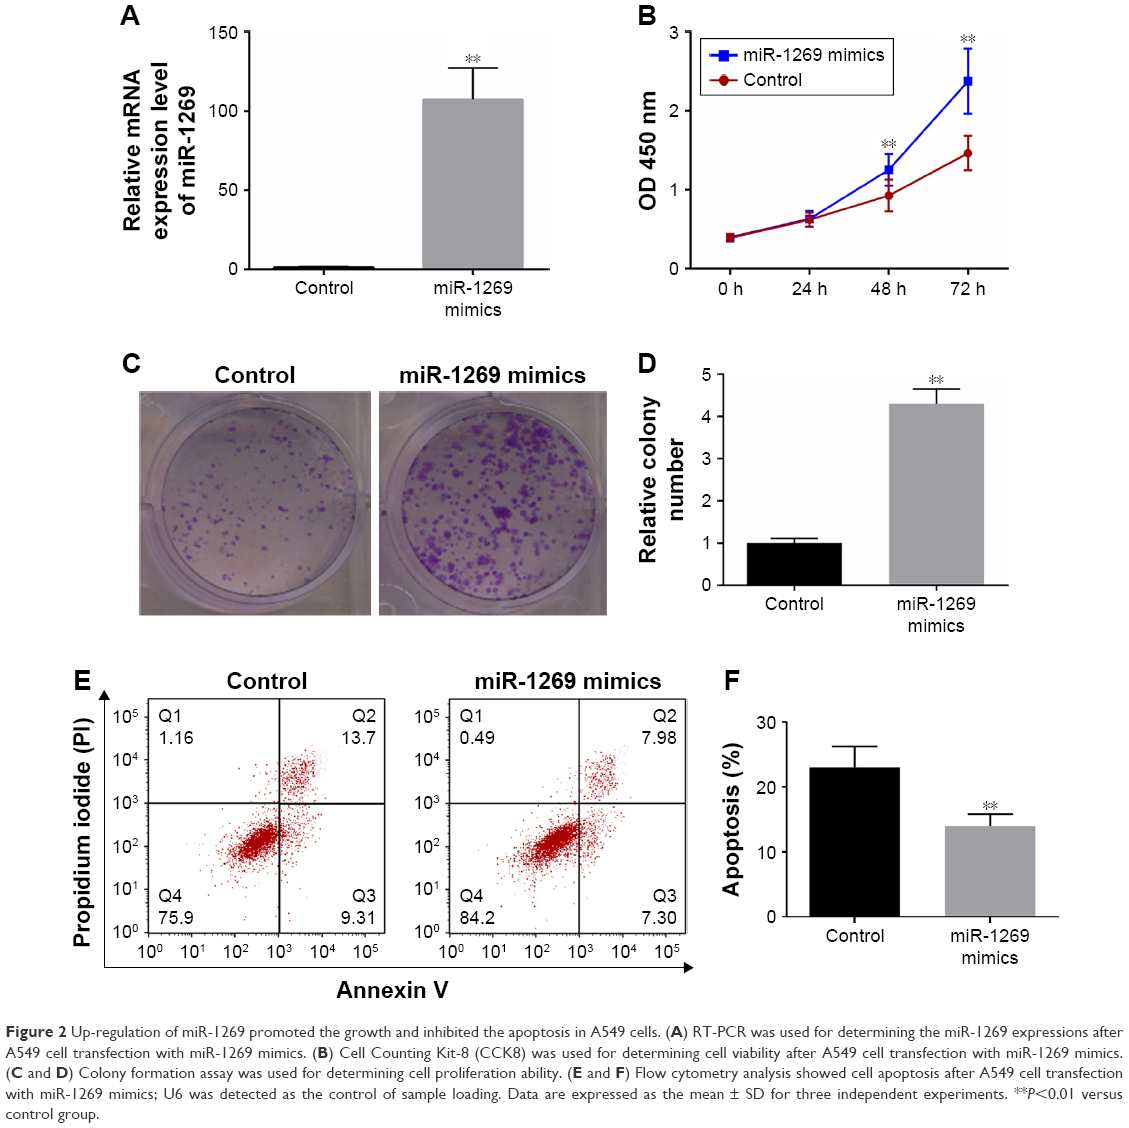 | Figure 2 Up-regulation of miR-1269 promoted the growth and inhibited the apoptosis in A549 cells. (A) RT-PCR was used for determining the miR-1269 expressions after A549 cell transfection with miR-1269 mimics. (B) Cell Counting Kit-8 (CCK8) was used for determining cell viability after A549 cell transfection with miR-1269 mimics. (C and D) Colony formation assay was used for determining cell proliferation ability. (E and F) Flow cytometry analysis showed cell apoptosis after A549 cell transfection with miR-1269 mimics; U6 was detected as the control of sample loading. Data are expressed as the mean ± SD for three independent experiments. **P<0.01 versus control group. |
Downregulation of miR-1269 inhibits growth and promotes apoptosis in A549 cells
miR-1269 inhibitors/NC were transfected into A549 cells, and the resulting RT-PCR analysis showed that miR-1269 was significantly lower in the miR-1269 inhibitors group, compared to the control (P<0.05, Figure 3A). In addition, CCK8 and colony formation assays results showed that the viability of A549 cells was reduced after cells were transfected with miR-1269 inhibitors (Figure 3B–D). Cell apoptosis was further determined by flow cytometry analysis. We found that the apoptosis rate in the miR-1269 inhibitors group was significantly higher than that of the control group (Figure 3E and F).
 | Figure 3 Down-regulation of miR-1269 inhibited the growth and promoted the apoptosis in A549 cells. (A) RT-PCR was used for determining the miR-1269 expressions after A549 cell transfection with miR-1269 inhibitors. (B) Cell Counting Kit-8 (CCK8) was used for determining cell viability after A549 cell transfection with miR-1269 inhibitors. (C and D) Colony formation assay was used for determining cell proliferation ability. (E and F) Flow cytometry analysis showed cell apoptosis after A549 cell transfection with miR-1269 inhibitors; U6 was detected as the control of sample loading. Data are expressed as the mean ± SD for three independent experiments. **P<0.01 versus control group. |
miR-1269 regulates TP53 and caspase-9 expression, and caspase-3 activity
Based on the results of the miRNA target prediction databases (TargetScan), we found that TP53 and caspase-9 were target genes of miR-1269. A luciferase reporter assay was used to verify the above results, and TP53 and caspase-9 were subsequently found to be expressed at significantly lower levels in the miR-1269 group (Figure 4A–D). In addition, RT-PCR and Western blot results showed that TP53 and caspase-9 expression in the miR-1269 mimic group was significantly lower than that in the control groups, and caspase-3 activity in the miR-1269 mimic group was significantly decreased, compared to the control groups (P<0.05; Figure 4E–H). By contrast, TP53 and caspase-9 expression and caspase-3 activity in the miR-1269 inhibitors groups were significantly higher in comparison with the control groups (P<0.05; Figure 4I–L).
 | Figure 4 miR-1269 regulated tumor protein p53 (TP53) and caspase-9 expressions and caspase-3 activity. (A) Putative targets predicted by TargetScan. (B) Relative luciferase activity resulted from binding of TP53 3′-untranslated region (UTR) reporter and miR-1269 in A549 cell 48 h after transfection. (C) Putative targets predicted by TargetScan. (D) Relative luciferase activity resulted from binding of caspase-9 3′-UTR reporter and miR-1269 in A549 cell 48 h after transfection. (E) RT-PCR was used for detecting TP53 and caspase-9 expressions after A549 cell transfection with miR-1269 mimics. (F and G) Western blot was used for detecting TP53 and caspase-9 expressions after A549 cell transfection with miR-1269 mimics. (H) Caspase-3 activity detection assay was used for detecting caspase-3 activity in miR-1269 mimics group. (I) RT-PCR was used for detecting TP53 and caspase-9 expressions after A549 cell transfection with miR-1269 inhibitors. (J and K) Western blot was used for detecting TP53 and caspase-9 expressions after A549 cell transfection with miR-1269 inhibitors. (L) Caspase-3 activity detection assay was used for detecting caspase-3 activity in miR-1269 inhibitors. Tubulin was detected as the control of sample loading. Data are expressed as the mean ± SD for three independent experiments. *P<0.05 and **P<0.01 versus control+TP53/or control group. |
TP53/or caspase-9 silencing regulates viability and apoptosis in A459 cells
RT-PCR and Western blot analyses were used for detecting the effect of RNA interference in A459 cells. TP53 expression was significantly lower after cells had been transfected with TP53-siRNA (Figure 5A and B). Moreover, siTP53 was found to significantly increase cell viability and in turn inhibit cell apoptosis, according to CCK8 and flow cytometry analyses (Figure 5C–E). Caspase-9 interference was then found to significantly inhibit caspase-9 expression, promote cell viability and inhibit cell apoptosis (Figure 5F–J).
 | Figure 5 TP53/or caspase-9 silencing regulated the viability and apoptosis in A459 cells. (A) RT-PCR was used for determining TP53 expressions after A459 cell transfection with TP53-siRNA. (B) Western blot was used for determining TP53 expressions after A459 cell transfection with TP53-siRNA. (C) CCK8 was used for determining cell viability after A459 cell transfection with TP53-siRNA. (D and E) Flow cytometry analysis showed cell apoptosis after A549 cell transfection with TP53-siRNA. (F) RT-PCR was used for determining caspase-9 expressions after A459 cell transfection with caspase-9-siRNA. (G) Western blot was used for determining caspase-9 expressions after A459 cell transfection with caspase-9-siRNA. (H) CCK8 was used for determining cell viability after A459 cell transfection with caspase-9-siRNA. (I and J) Flow cytometry analysis showed cell apoptosis after A549 cell transfection with caspase-9-siRNA. Tubulin was detected as the control of sample loading. Data are expressed as the mean ± SD for three independent experiments. **P<0.01 versus siNC group. |
miR-1269 promotes cell survival and proliferation by targeting TP53 and caspase-9 in A549 cells
As shown in Figure 6, cell viability was decreased after co-transfection of cells with miR-1269 inhibitors and siNC. However, cell viability increased after co-transfection of cells with miR-1269 inhibitors and caspase-9-siRNA by CCK8 analysis (Figure 6A). On the other hand, the rate of cell apoptosis in the miR-1269 inhibitors group was found to increase, and the rate of cell apoptosis in the miR-1269 mimic+siCaspase-9 group decreased, compared to the control+siNC group (Figure 6B and D). After cells were transfected with miR-1269, inhibitors were incubated with caspase inhibitor Z-VAD-FMK and cell apoptosis rate was inhibited, compared to the miR-1269 inhibitor+DMSO group (Figure 6C and E). In addition, by immunohistochemical staining we found that the expression of TP53 and caspase-9 in adjacent tissues was higher than in tumor tissues (Figure 7A). The relative analysis showed a negative correlation between miR-1269 and TP53/or caspase-9 in the tumor tissue of patient samples (Figure 7B and C).
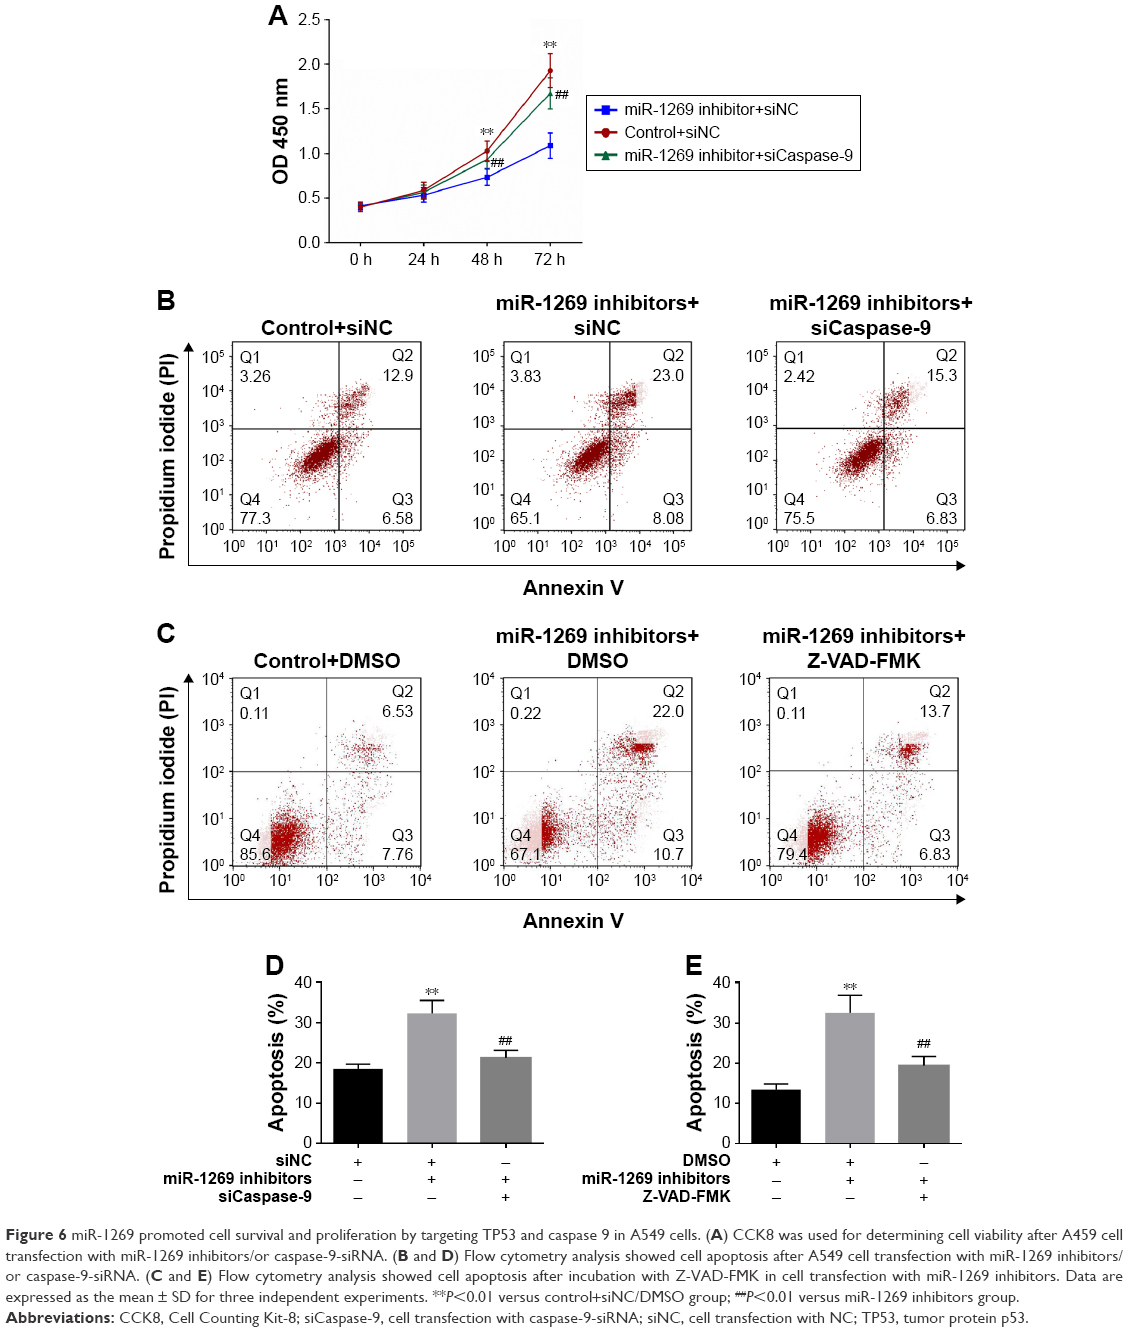 | Figure 6 miR-1269 promoted cell survival and proliferation by targeting TP53 and caspase 9 in A549 cells. (A) CCK8 was used for determining cell viability after A459 cell transfection with miR-1269 inhibitors/or caspase-9-siRNA. (B and D) Flow cytometry analysis showed cell apoptosis after A549 cell transfection with miR-1269 inhibitors/or caspase-9-siRNA. (C and E) Flow cytometry analysis showed cell apoptosis after incubation with Z-VAD-FMK in cell transfection with miR-1269 inhibitors. Data are expressed as the mean ± SD for three independent experiments. **P<0.01 versus control+siNC/DMSO group; ##P<0.01 versus miR-1269 inhibitors group. |
 | Figure 7 Tumor protein p53 (TP53) and caspase-9 expressions were associated with lung cancer/or miR-1269 expressions. (A) Immunohistochemical staining showed that TP53 and caspase-9 were strongly positively expressed in normal adjacent tissues of lung cancer. (B) The relative analysis showed the negative correlation between miR-1269 and TP53 in mRNA expression level. (C) The relative analysis showed the negative correlation between miR-1269 and caspase-9 in mRNA expression level. Data are expressed as the mean ± SD for three independent experiments. |
Discussion
Lung cancer is one of the most common causes of malignant tumors, characterized by excessive cell proliferation, failure in cell differentiation and cell apoptosis disorders.18,19 Studies have shown that abnormally expressed miRNAs can activate oncogene expression and suppress anti-oncogene expression to create cellular imbalances in the affected organism, which ultimately lead to cancer.14,15 miRNA regulatory networks are involved in each phase of carcinogenesis and tumor development through the regulation of target gene expression.1,5,19 According to the literature, miR-1269 is highly expressed in colorectal, liver and esophagus cancers.14–16 More importantly, through bioinformatics analyses we found that there was an increased expression level of miR-1269 in lung cancer tissue (Figure 1A). miR-1269 expression was further examined using RT-PCR, with results showing that miR-1269 was highly expressed in lung cancer tissues (Figure 1B and C). In addition, high expression of miR-1269 correlates with patients’ tumor stage and lymph node metastasis (Table 1). These results suggest that miR-1269 could be a potential marker involved in some of the mechanisms examined above, although this needs further investigation.
Cell proliferation, differentiation, and apoptosis are basic biological processes. This research revealed that an imbalance in cell proliferation and apoptosis is a key mechanism of tumorigenesis and its progression.20,21 The capacity for cell proliferation and apoptosis was determined by CCK8 analyses and colony formation and flow cytometry assays in A549 cells transfected with miR-1269 mimics/inhibitors. The results showed that overexpression of miR-1269 significantly promoted cell proliferation and inhibited cell apoptosis (Figure 2). Conversely, a lower expression of miR-1269 significantly inhibited cell proliferation and promoted cell apoptosis (Figure 3). These results indicate that miR-1269 could regulate cell proliferation and apoptosis. We further conclude that a lower expression of miR-1269 plays an important role in inhibiting lung cancer progression, and that the related mechanism needs to be studied further.
TargetScan databases were used to predict miR target genes.22 We found that TP53 and caspase-9 are the target genes of miR-1269 (Figure 4). Luciferase reporter results further verified the previous prediction. TP53 is an important tumor suppressor gene that can block the cell cycle, inhibit cell proliferation, induce cell differentiation, and promote cell aging and apoptosis. It is involved in DNA damage repair, can regulate energy metabolism and also inhibits tumor angiogenesis to suppress the development and progression of cancer.23–26 Moreover, abnormalities in the TP53 signaling pathway were found in the more malignant tumors. It reported that the upregulation of TP53 activated the caspase-9 death pathway.27,28 Caspase-9 is an initiation factor of apoptosis that can activate caspase-3 to induce cell apoptosis.27 We determined TP53 and caspase-9 expression as well as the activation state of caspase-3, and found that TP53 and caspase-9 were highly expressed in the miR-1269 inhibitors group and that caspase-3 was further activated (Figure 4). These results showed that overexpression of miR-1269 inhibited the TP53 signaling pathway. In addition, we further found that the phenotype of TP53/or caspase-9 interference increased cell viability and decreased cell apoptosis (Figure 5). We showed that the phenotype of TP53/or caspase-9 interference was consistent with the phenotype of highly expressed miR-1269. The results then showed that the rate of cell apoptosis was increased after A459 cells were transfected with miR-1269 inhibitors, compared to the control+siNC group. However, after caspase-9 expression was inhibited by caspase-9-siRNA/or Z-VAD-FMK in cells transfected with miR-1269 inhibitors, the rate of cell apoptosis was found to decrease, compared to the miR-1269 inhibitor+siNC group (Figure 6). Finally, immunohistochemistry assays and correlation analyses were used to determine the relation of miR-1269, TP53, and caspase-9 in lung cancer tissue. The results showed that TP53 and caspase-9 were highly expressed in the normal adjacent lung tissue of the lung cancer patients, and that the levels of miR-1269 expression were inversely correlated with those of TP53/or caspase-9 (Figure 7). Thus, miR-1269 was found to regulate cell proliferation and apoptosis by targeting TP53 and caspase-9.
Conclusion
In conclusion, lower levels of miR-1269 expression were found to inhibit cell proliferation and promote cell apoptosis, while higher levels of miR-1269 expression were found to promote cell proliferation and inhibit cell apoptosis. In addition, the phenotype of TP53/or caspase-9 interference was consistent with the phenotype of highly expressed miR-1269. As such, miR-1269 promotes cell survival and proliferation by targeting TP53 and caspase-9 in lung cancer.
Disclosure
The authors report no conflicts of interest in this work.
References
Grimolizzi F, Monaco F, Leoni F, et al. Exosomal miR-126 as a circulating biomarker in non-small-cell lung cancer regulating cancer progression. Sci Rep. 2017;7(1):15277. | ||
Hayashi T, Desmeules P, Smith RS, Drilon A, Somwar R, Ladanyi M. RASA1 and NF1 are preferentially co-mutated and define a distinct genetic subset of smoking associated non-small cell lung carcinomas sensitive to MEK inhibition. Clin Cancer Res. Epub 2017 Nov 10. | ||
Wang S, Zhang B, Li C, et al. Prognostic value of number of negative lymph node in patients with stage II and IIIa non-small cell lung cancer. Oncotarget. 2017;8(45):79387–79396. | ||
Ma J, Li T, Han X, Yuan H. Knockdown of LncRNA ANRIL suppresses cell proliferation, metastasis, and invasion via regulating miR-122-5p expression in hepatocellular carcinoma. J Cancer Res Clin Oncol. 2018;144(2):205–214. | ||
Wang J, Chen T, Shan G. miR-148b regulates proliferation and differentiation of neural stem cells via Wnt/beta-catenin signaling in rat ischemic stroke model. Front Cell Neurosci. 2017;11:329. | ||
Yu X, Mi L, Dong J, Zou J. Long intergenic non-protein-coding RNA 1567 (LINC01567) acts as a “sponge” against microRNA-93 in regulating the proliferation and tumorigenesis of human colon cancer stem cells. BMC Cancer. 2017;17(1):716. | ||
Xu G, Zhu H, Zhang M, Xu J. Histone deacetylase 3 is associated with gastric cancer cell growth via the miR-454-mediated targeting of CHD5. Int J Mol Med. 2018;41(1):155–163. | ||
Zhou Y, Do DC, Ishmael FT, et al. Mannose receptor modulates macrophage polarization and allergic inflammation through miR-511-3p. J Allergy Clin Immunol. 2018;141(1):350–364. | ||
McCaskill JL, Ressel S, Alber A, et al. Broad-spectrum inhibition of respiratory virus infection by microRNA mimics targeting p38 MAPK signaling. Mol Ther Nucleic Acids. 2017;7:256–266. | ||
Hao X, Xia L, Qu R, Yang X, Jiang M, Zhou B. Association between miR-146a rs2910164 polymorphism and specific cancer susceptibility: an updated meta-analysis. Fam Cancer. Epub 2017 Nov 10. | ||
Liu GF, Zhang SH, Li XF, Cao LY, Fu ZZ, Yu SN. Overexpression of microRNA-132 enhances the radiosensitivity of cervical cancer cells by down-regulating Bmi-1. Oncotarget. 2017;8(46):80757–80769. | ||
Niinuma T, Kai M, Kitajima H, et al. Downregulation of miR-186 is associated with metastatic recurrence of gastrointestinal stromal tumors. Oncology Lett. 2017;14(5):5703–5710. | ||
Olbromski M, Rzechonek A, Grzegrzolka J, et al. Influence of miR-7a and miR-24-3p on the SOX18 transcript in lung adenocarcinoma. Oncology Rep. 2018;39(1):201–208. | ||
Yang XW, Shen GZ, Cao LQ, et al. MicroRNA-1269 promotes proliferation in human hepatocellular carcinoma via downregulation of FOXO1. BMC Cancer. 2014;14:909. | ||
Xiong G, Wang Y, Ding Q, Yang L. Hsa-mir-1269 genetic variant contributes to hepatocellular carcinoma susceptibility through affecting SOX6. Am J Transl Res. 2015;7(10):2091–2098. | ||
Bu P, Wang L, Chen KY, et al. miR-1269 promotes metastasis and forms a positive feedback loop with TGF-beta. Nat Commun. 2015;6:6879. | ||
Dalmasso G, Nguyen HT, Yan Y, et al. MicroRNAs determine human intestinal epithelial cell fate. Differentiation. 2010;80(2–3):147–154. | ||
Diehl K, Dinges LA, Helm O, et al. Nuclear factor E2-related factor-2 has a differential impact on MCT1 and MCT4 lactate carrier expression in colonic epithelial cells: a condition favoring metabolic symbiosis between colorectal cancer and stromal cells. Oncogene. 2018;37(1):39–51. | ||
Wang T, Cai Z, Hong G, et al. MicroRNA21 increases cell viability and suppresses cellular apoptosis in non-small cell lung cancer by regulating the PI3K/Akt signaling pathway. Mol Med Rep. 2017;16(5):6506–6511. | ||
Guzzo MF, Carvalho LR, Bronstein MD. Apoptosis: its role in pituitary development and neoplastic pituitary tissue. Pituitary. 2014;17(2):157–162. | ||
Pennarossa G, Maffei S, Tettamanti G, et al. Intercellular bridges are essential for human parthenogenetic cell survival. Mech Dev. 2015;136:30–39. | ||
Han C, Zheng W, Ge M, Wang K, Xiang Y, Wang P. Downregulation of cyclin-dependent kinase 8 by microRNA-148a suppresses proliferation and invasiveness of papillary thyroid carcinomas. Am J Cancer Res. 2017;7(10):2081–2090. | ||
Funderburk KM, Auerbach SS, Bushel PR. Crosstalk between receptor and non-receptor mediated chemical modes of action in rat livers converges through a dysregulated gene expression network at tumor suppressor Tp53. Front Genet. 2017;8:157. | ||
Liu Y, Wang X, Ding N, et al. TP53 Arg72 as a favorable prognostic factor for Chinese diffuse large B-cell lymphoma patients treated with CHOP. BMC Cancer. 2017;17(1):743. | ||
Pentimalli F. Updates from the TP53 universe. Cell Death Differ. 2018;25(1):10–12. | ||
Saito M, Okayama H, Saito K, et al. CDX2 is involved in microRNA-associated inflammatory carcinogenesis in gastric cancer. Oncol Lett. 2017;14(5):6184–6190. | ||
Lu W, Lu T, Wei X. Downregulation of DNMT3a expression increases miR-182-induced apoptosis of ovarian cancer through caspase-3 and caspase-9-mediated apoptosis and DNA damage response. Oncol Rep. 2016;36(6):3597–3604. | ||
Tian X, Zeng G, Li X. Cantharidin inhibits cell proliferation and promotes apoptosis in tongue squamous cell carcinoma through suppression of miR-214 and regulation of p53 and Bcl-2/Bax. Oncol Rep. 2015;33(6):3061–3068. |
 © 2018 The Author(s). This work is published and licensed by Dove Medical Press Limited. The full terms of this license are available at https://www.dovepress.com/terms.php and incorporate the Creative Commons Attribution - Non Commercial (unported, v3.0) License.
By accessing the work you hereby accept the Terms. Non-commercial uses of the work are permitted without any further permission from Dove Medical Press Limited, provided the work is properly attributed. For permission for commercial use of this work, please see paragraphs 4.2 and 5 of our Terms.
© 2018 The Author(s). This work is published and licensed by Dove Medical Press Limited. The full terms of this license are available at https://www.dovepress.com/terms.php and incorporate the Creative Commons Attribution - Non Commercial (unported, v3.0) License.
By accessing the work you hereby accept the Terms. Non-commercial uses of the work are permitted without any further permission from Dove Medical Press Limited, provided the work is properly attributed. For permission for commercial use of this work, please see paragraphs 4.2 and 5 of our Terms.