")
Back to Journals » OncoTargets and Therapy » Volume 13
MicroRNA-92a Targets SERTAD3 and Regulates the Growth, Invasion, and Migration of Prostate Cancer Cells via the P53 Pathway
Authors Zhang S, Yu J, Sun B, Hou G, Yu ZJ, Luo H
Received 10 February 2020
Accepted for publication 4 May 2020
Published 12 June 2020 Volume 2020:13 Pages 5495—5514
DOI https://doi.org/10.2147/OTT.S249168
Checked for plagiarism Yes
Review by Single anonymous peer review
Peer reviewer comments 2
Editor who approved publication: Prof. Dr. Geoffrey Pietersz
Shuo Zhang,1,2 Jia Yu,2,3 Bao-fei Sun,1,2 Gui-zhong Hou,1 Zi-Jiang Yu,1,2 Heng Luo1– 3
1Department of Anatomy, School of Basic Medical Sciences, Guizhou Medical University, Guizhou, People’s Republic of China; 2State Key Laboratory of Functions and Applications of Medicinal Plants, Guizhou Medical University, Guiyang, People’s Republic of China; 3Key Laboratory of Chemistry for Natural Products of Guizhou Province and Chinese Academy of Sciences, Guiyang, People’s Republic of China
Correspondence: Heng Luo; Zi-Jiang Yu Email [email protected]; [email protected]
Background: The miR-17-92 cluster, consisting of six mature miRNAs including miR-17, miR-18a, miR-19a, miR-19b, miR-20a, and miR-92a, plays a key role in the tumorigenesis and development of various cancers. The dysregulation of the cluster correlates with the biological mechanism of tumor growth and metastasis in vivo. However, the relationship between miR-17-92 cluster and malignancy of prostate cancer remains unclear, and its regulatory mechanism is worth investigating for controlling the proliferation and invasion of prostate cancer.
Materials and Methods: The expressions of miR-17-92 cluster members were measured using real-time quantitative RT-PCR. WB and real-time quantitative RT-PCR were used to detect the expression of SERTAD3, p38, p21, p53 protein levels and transcription levels. Cell proliferation and apoptosis were evaluated using cell proliferation assay, EdU and Hoechst assay, colony formation experiment and flow cytometry analyses. Cell migration and invasion were determined via transwell assays. The TargetScan, miRDB, starBase databases and luciferase reporter assays were used to confirm the target gene of miR-92a.
Results: The relative expression of miR-92a was threefold higher in the metastatic PC-3 cells compared with the non-metastatic LNCaP cells. Down-regulation of miR-92a in PC-3 cells led to the inhibition of cell proliferation, migration, and invasion, while its overexpression in LNCaP cells resulted in the promotion of cell proliferation, migration, and invasion. The role of SERTAD3 in prostate cancer can be alleviated by miR-92a inhibitor.
Conclusion: SERTAD3 was the direct target gene of miR-92a in prostate cancer cells; inhibition of SERTAD3-dependent miR-92a alleviated the growth, invasion, and migration of prostate cancer cells by regulating the expression of the key genes of the p53 pathway, including p38, p53 and p21. These results suggested that targeting SERTAD3 by the induction of overexpression of miR-92a may be a treatment option in prostate cancer.
Keywords: miR-92a, SERTAD3, prostate cancer, cell growth, metastasis
Introduction
Prostate cancer (PCa) is the most common malignancy in men worldwide and is one of the leading causes of cancer-related deaths in United States. In 2019, the incidence of PCa accounted for 20% of all cancers in men with over 174,650 new cases, ranking first in United States, and a mortality of approximately 31,620, ranking second among all newly diagnosed cancers in men.1 At present, early-stage PCa can be treated with prostatectomy, chemotherapy, and radiation therapy.2 Androgen deprivation therapy is the standard treatment for advanced PCa.3,4 However, almost all patients will gradually develop castration-resistant PCa (CRPC) post-surgery, which is an incurable disease that develops after continued hormone therapy for one or two years.3,5 In addition, an increasing number of chemotherapy drugs are being used to treat PCa patients, which leads to resistance of the tumor cells resulting in a lack of effective treatments to control the malignant transformation of the cancer, especially in advanced PCa. Advanced PCa is often associated with increased metastasis, typically to the bones,6 and bone metastases have been observed in 50–70% of CRPC patients.7,8 Therefore, developing effective treatment strategies to control tumorigenesis and development of PCa is an urgent scientific problem.3
MicroRNAs (miRNAs) are endogenous RNAs of ~22 nucleotides in length that play important regulatory roles in animals and plants by targeting mRNAs for cleavage or translational repression.9 The complementarity region of the miRNAs, known as the seed sequence, is ~6–8 nucleotides in length and may target multiple sites within the same mRNA and/or simultaneously modulate the translation of up to hundreds of different mRNAs.10 miRNAs comprise one of the more abundant classes of gene regulatory molecules in multicellular organisms and likely influence the output of many protein-coding genes.9 miRNAs regulate gene expression of oncogenes at the posttranscriptional level to control a wide range of biological processes,11 such as cell cycle regulation, differentiation, metabolism, apoptosis, invasion, tumorigenesis, angiogenesis, and metastasis.9 More than one third of structural human genes are subjected to regulation by miRNAs.12 Considering their physiological roles, it is not surprising that abnormal miRNA expression is related to cancer pathologies, thereby making miRNAs potential clinical biomarkers of cancer. miRNAs can be used as specific biomarkers for the diagnosis, treatment, and prognosis of tumors.13 Consequently, many studies have demonstrated that miRNAs play an important role in the occurrence and development of cancer.
The miR-17-92 cluster is transcribed from a polycistronic miR-17-92 gene located in the third intron of the primary transcript C13orf2514 and is processed into six mature miRNAs including miR-17, miR-18a, miR-19a, miR-19b, miR-20a and miR-92a.15 Dysregulation of the expression of the miR-17-92 cluster has been detected in various cancers and is correlated with the biological mechanism of tumor development.16–18 Similarly, the miR-17-92 cluster plays a role in the onset of PCa. Several studies have indicated that the miR-17-92 cluster exerts different regulatory abilities on various target genes in PCa.
Members of the miR-17-92 cluster play different roles in various tumor cells through different target genes. It has been reported that miR-17 inhibits the proliferation of LNCaP PCa cells through regulating the JAK-STAT3 signaling pathway19 and that its overexpression played a role in promoting the growth of osteosarcoma cells by regulating SASH1.20 Likewise, miR-18a regulates tumor proliferation and invasion by targeting TBPL1 in colorectal cancer cells21 and promotes cell proliferation and metastasis in PCa through suppressing STK4.22 Increased miR-19a/b levels have been reported in the serum of PCa patients.23 Most importantly, miR-92a has been found to be upregulated in lung cancer,17,24 gastric cancer,25 cervical cancer,26 esophageal cancer27 and colorectal cancer.18 The upregulation of miR-92a affected the physiological characteristics of cancer cells by altering their protein expression to regulate the proliferation and metastasis in vivo and in vitro. Additionally, increased levels of miR-92a in the plasma of patients with acute myeloid leukemia are related to the progression of the disease and may represent a diagnostic and prognostic indication of myeloid leukemia.28 There are even studies evaluating the use of miR-92a inhibitors as targeted drugs against leukemia.29 miR-19a regulates the proliferation and migration of colorectal cancer by targeting TIA1,30 miR-19b regulates tumor proliferation and invasion by targeting p53.31 miR-20a directly targets the 3ʹ-untranslated region (UTR) of MAPK1 thereby regulating breast cancer growth and chemoresistance.32 However, no studies have reported the regulatory targets of miR-92a related to the occurrence and development of PCa, and the regulatory mechanism of miR-92a in PCa progression is still unknown. Therefore, in this study we aimed to investigate the targets and molecular mechanism of miR-92a in the regulation of proliferation and metastasis of PCa cells.
Materials and Methods
PCa Cell Lines and Culture
The human PCa cells PC-3 and LNCaP, and the HEK 293T cells were obtained from the biology laboratory of the Key Laboratory of Chemistry for Natural Products of Guizhou Province and the Chinese Academy of Sciences (Guiyang, China). Cells were cultured in Dulbecco’s Modified Eagle’s Medium (DMEM) (Hyclone, South Logan, UT, USA), supplemented with 10% fetal bovine serum (FBS) (Sijiqing, Hangzhou, China) at 37°C and 5% CO2, and 95% humidity.33 Freshly thawed cells were passaged at least 3 times before they were used in experiments.
RNA Extraction and Reverse Transcription
Total RNA was isolated from PCa cells using TRIzol®reagent (Invitrogen, Carlsbad, CA, USA). A total of 5×10⁶ treated cells were lysed in TRIzol reagent, then chloroform was added to the solution, followed by centrifugation for 15 min at 12,000 rpm and 4°C. The mixture was allowed to separate into a clear upper aqueous layer, containing RNA. The RNA was precipitated with isopropanol, and then washed with 100% ethanol. All steps were performed on ice. The A260/A280 ratio and the RNA concentration were measured using a NanoDrop 2000 apparatus (Thermo Scientific, Waltham, MA, USA), and the RNA quality was determined by agarose gel electrophoresis. Total RNA (4500 ng) was then reverse-transcribed into cDNA using a HiFiScript cDNA Synthesis Kit (CWBIO, Beijing, China) with miRNA-specific RT primers (Ribobio, Guangzhou, China) directed to amplify miR-17, miR-18, miR-19a, miR-19b, miR-20, and miR-92a, respectively, according to the manufacturer’s guidelines.
Real-Time Quantitative RT-PCR (qRT-PCR)
Real-time quantitative RT-PCR (qRT-PCR) was performed using stem-loop primers for miR-17-92 cluster members designed by Ribobio (Guangzhou, China), the primers for SERTAD3, p53, p38, p21 (Sangon Biotech, Shanghai, China) based on UItraSYBR Green qPCR Mixture (with ROX) reagents (CWBIO, Beijing, China) in a Step One Plus ™ Real-Time PCR System (Thermo Fisher Scientific, Waltham, MA, USA). The qRT-PCR protocol was as follows: 10 min at 95°C for the initial denaturation, followed by 25 cycles of 95°C for 15 s and 60°C for 1 min at the cycling stage, and 95°C for 15 s, 60°C for 1 min, 95°C for 15 s at the melt curve stage.34 GAPDH served as an endogenous control, and the 2−∆∆CT method was used to calculate relative expression levels. Reverse transcription with gene-specific primers was used for detecting the gene expression of SERTAD3, p53, p38, and p21. Primer sequences are shown in Table 1.
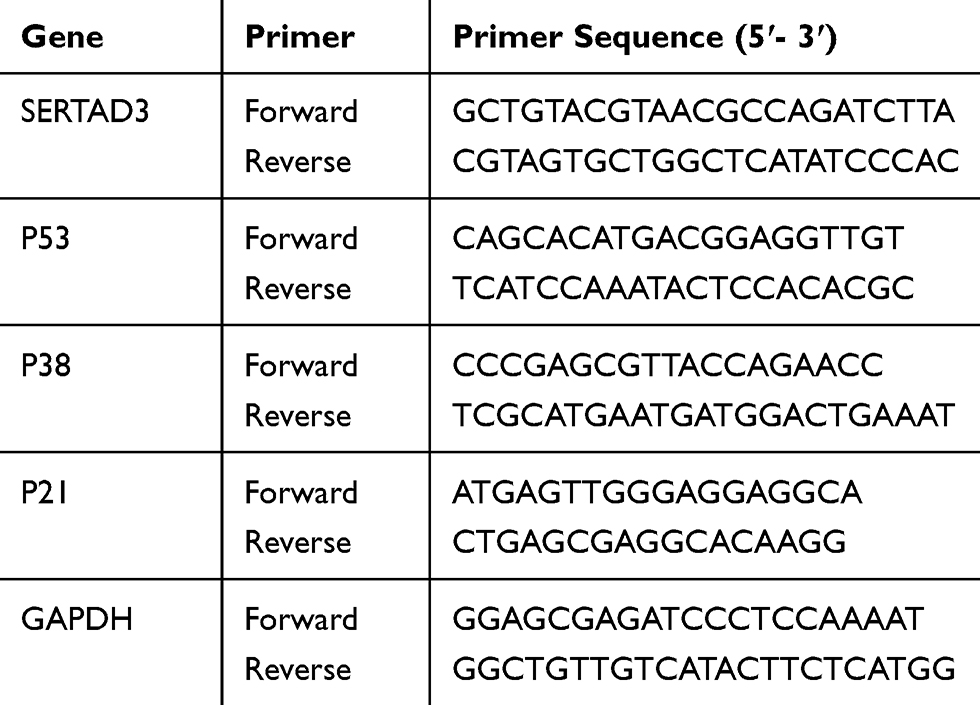 |
Table 1 Gene-Specific Primer Sequences Used in qRT-PCR |
Cellular Transfection
Cells were seeded at a density of 6×10⁵ cells in a 6-well plate and grown to 60–80% confluency for transfection using Lipofectamine®3000 reagent (Invitrogen, Carlsbad, CA, USA). An miR-92a inhibitor (Ribobio, Guangzhou, China) was used to transfect PC-3 cells to downregulate the expression of miR-92a. An miR-92a mimic (Ribobio, Guangzhou, China) was used to transfect LNCaP cells to overexpress the miR-92a. A SERTAD3 expression vector (FengHuiShengWu, Hunan, China) was transfected into PC-3 to confirm the dependency of target genes on miR-92a. MicroRNA mimic, inhibitor or SERTAD3 cDNA were incubated in 125 µL of Opti-MEM ® (Gibco, Grand Island, NY, USA) medium for 15 min at room temperature (RT), respectively. Next, 5 µL of Lipofectamine was added to 125 µL of Opti-MEM® medium mixture for 15 min at RT to prepare the transfection solution. The cells were maintained in 1.5 mL of DMEM including the transfection solution for 12 h at 37°C. Then, the solution was removed and replaced with fresh serum-supplemented medium and cultured for 24 h. The transfected cells were harvested to determine the transfection efficiency by qRT-PCR. In this study, a randomly scrambled sequence of mimic or of inhibitor (Ribobio, China) served as the negative control (NC) for non-sequence-specific effects in miRNA experiments.
Cell Proliferation Assay
The transfected cells were seeded into 96-well plates at a density of 0.6 × 10⁴ cells and incubated at 37°C for 24 h, 48 h, or 72 h. Then, 25 µL of MTT solution (5 mg/mL) were added to each well and incubated for 4 h at 37°C. Following centrifugation at 2500 rpm for 15 min, the medium was removed and 150 µL of DMSO was added to each well. The plates were incubated for 15 min at 37°C and the absorbance was measured at 490 nm using a Synergy2 microplate assay reader (BioTek Instruments, Winooski, VT, USA).
Migration and Invasion Assays
The migration and invasion capacity of the cells was assessed by transwell assays using transwell chambers (8.0 µm pore size, Corning, Corning, NY, USA). The chambers in invasion experiments were coated with Matrigel (BD Biosciences, Franklin Lakes, NJ, USA). Matrigel (2 mg/mL) in ice-cold Opti-MEM ®medium (100 µL; the transfected solution) was placed in the upper transwell chamber and incubated for 30 min at 37°C to cause the “gelling”. A suspension of transfected PC-3 or LNCaP cells (7.5 ×10⁴ cells in 200 µL DMEM), was added to the upper transwell chamber at 37°C for 6, 12, 18, or 24 h. The DMEM was supplemented with 10% and 20% FBS for the cell migration and invasion analysis, respectively. Following incubation at 37°C and 5% CO2, the invaded or migrated cells that transferred through the membrane of the chamber to the lower surface were fixed in 75% ethyl alcohol and stained with 0.1% crystal violet. Five random visual fields of three independent experiments were counted using an inverted microscope (Nikon, Tokyo, Japan) using a 20× objective.
EdU and Hoechst Assay
The transfected cells in exponential growth phase were seeded into 96-well plates (5×10⁴ cells/well). The cells were analyzed using the Cell-Light™ EdU Apollo® 488 in vitro Imaging kit (Ribobio, Guangzhou, China). Based on the manufacturer’s protocol,35 EdU (50 µmol/L) was added to the culture medium and the cells were incubated for 2 h, then fixed in 4% paraformaldehyde for 30 min, permeated with 0.5% Trixon-X 100 in PBS for 10 min, and stained with 10 µmol/L Apollo488 for 30 min. The cells were then counter-stained with Hoechst 33342 for 30 min. Pictures of the cells were taken using a fluorescence microscope.33
Colony Formation Experiment
The transfected PC-3 and LNCaP cells were seeded in 6-well plates (1.5×10³ cells per well). The cells were maintained in DMEM culture medium supplemented with 10% FBS. Medium was replaced every 3 days for a total of 14 days.30 Then the growth media were removed, and the colonies were stained by the addition of 0.1% crystal violet. The excess crystal violet was washed away and the shapes of the colonies were captured by photo microscopy.
Cell Apoptosis Assay
The induction of apoptosis associated with changes in miR-92a expression was evaluated using a flow cytometry assay based on the annexin V-fluorescein isothiocyanate (FITC) and propidium iodide (PI) staining kit (BD Pharmingen, San Diego, CA, USA). Annexin-V-positive cells were considered apoptotic. The transfected cells were trypsinized, washed twice with PBS, and centrifuged at 1000 rpm for 5 min at room temperature. Then, the cells were resuspended in 1 × binding buffer (0.01M Hepes (pH 7.4), 0.14 M NaCl, and 2.5 mM CaCl2), 5 µL of PI and FITC solutions were added per 1×10⁵ cells, cells were vortexed, and incubated for 15 min at room temperature in the dark. The apoptotic rate of the cells was analyzed by flow cytometry (Becton Dickinson, Franklin Lakes, NJ, USA).34
Western Blot Analysis
The cells were lysed in RIPA buffer containing the protease inhibitor AEBSF (1% w/v) (LanMu, Shanghai, China) for 30 min, centrifuged at 12,000 rpm for 15 min at 4°C, and the protein concentrations were determined using the Pierce Bicinchoninic Acid (BCA) Protein Assay Kit (Beyotime, Shanghai, China). Total proteins were separated by SDS-PAGE (the acrylamide concentration was based on the molecular weight of the protein of interest) and transferred to polyvinylidene fluoride (PVDF) membranes (0.2 µm, Merck KGaA, Darmstadt, Germany).36 The membranes were blocked in Tris-buffered saline containing 0.1% Tween-20 (TBST), containing 5% non-fat milk, for 1h and incubated overnight with the following primary rabbit monoclonal antibodies (Abcam): anti-SERTAD (ab107728 at a dilution of 1/100), anti-p21 (ab109520; 1/1000), anti-p38 (ab170099; 1/1000) and anti-p53 (ab75754; 1/1000) at 4°C. Membranes were washed with TBST and incubated with goat anti-rabbit IgG H&L (DyLight™800 4X PEG Conjugate) (Cell Signaling Technology 5151S; dilution: 1/30,000) secondary antibodies. A rabbit polyclonal anti-GAPDH antibody (ab8245; dilution: 1/1000) was used as a loading control. The bands were detected by an Odyssey Infrared Imaging System and relative levels of protein expression were determined according to the gray-scale value of the bands using Image J software.
Luciferase Reporter Assays
The expression vectors with luciferase reporter genes, pgl3-SERTAD3 3ʹUTR (Untranslated Regions) and pgl3-SERTAD3 3ʹ UTR-mutation, were constructed by FengHuiShengWu, Hunan, China. For the luciferase reporter assays, HEK 293T cells were cultured in 6-well plates (3×10⁵ cells per well). The expression vectors of reporter gene and miRNA were co-transfected into HEK 293T cells with Lipofectamine®3000 reagent. After 24 h, the luciferase activity was detected using the Dual Luciferase Reporter Assay System (Promega Corp., Fitchburg, WI, USA).37 Data were expressed as mean values of normalized firefly relative luciferase units (RLUs) per setup. Raw firefly RLUs were first normalized against an internal control. Renilla luciferase RLUs per well before normalizing against values obtained using the empty vector control setup.17
Statistical Analysis
Data from at least 3 independent experiments were analyzed using a Student’s t-test. For multiple comparisons, One Way ANOVA was used. Values of p < 0.05 were considered statistically significant. * p < 0.05, ** p < 0.01.
Results
Expression of miR-17-92 Cluster in PCa Cells with Different Metastatic Potential
Several studies have shown that PC-3 and LNCaP are PCa cell lines with high and low metastatic potential, respectively.38 In this study, we used migration and invasion assays to further demonstrate the metastatic capacity of these two types of cells (Figure 1). Our results showed that the migration and invasion activity of PC-3 cells was 6-fold (p<0.01) and 7-fold (p<0.01) greater, respectively, than that of LNCaP cells (Figure 1A and B). These results confirmed that LNCaP and PC-3 displayed a low and high metastatic potential, respectively, which indicated that these two kinds of cell lines can be used to determine the effects of miRNA on the metastatic ability of PCa cells. We then compared the expression of miR-17-92 cluster members between PCa cells of different metastatic potential (Figure 1C). The results showed that the expression of miR-17 and miR-92a was positively correlated (p<0.01) with the cellular metastasis potential. However, miR18 expression was negatively correlated (p<0.05) with cell metastasis potential. Dai et al (2018) have reported that miR-17 promotes the apoptosis and inhibits the proliferation of PCa cells through the JAK-STAT3 signaling pathway.19 However, the function and regulatory mechanism of miR-92a in PCa have not been previously reported. Therefore, we focused on miR-92a and its effect on the growth, invasion, and metastasis of PCa cells and its molecular mechanism.
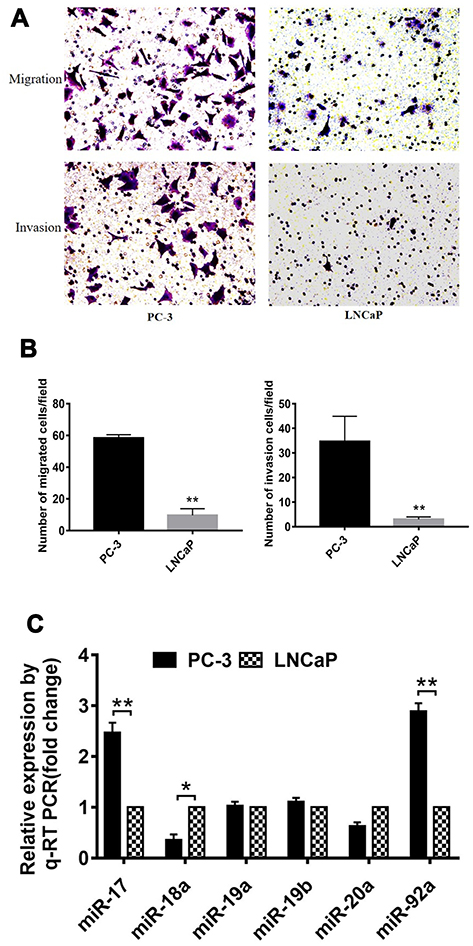 |
Figure 1 Comparison of migration and invasion capacity of different PCa cells. (A) Representative images of the lower side of the transwell following the invasion (upper panels) and migration (lower panels) of PC-3 cells (left panels) and LNCaP cells (right panels). (B) Quantitative analysis of cell migration (left) and invasion (right) of PC-3 and LNCaP cells after 12 h. (C) Expression levels of members of the miR-17-92 cluster were detected by qRT-PCR in PC-3 and LNCaP PCa cell lines. For each miRNA, relative expression is given as fold change in PC-3 cells compared with LNCaP cells. * p < 0.05 ** p < 0.01. Per condition three independent experiments were performed. |
MiR-92a Regulated the Proliferation of PCa Cells, but Did Not Induce Apoptosis
The PC-3 cells were transfected with miR-92a inhibitor to induce the downregulation of miR-92a. Inhibitor NC was transfected as control. LNCaP cells were transfected with an miR-92a mimic to establish miR-92a overexpressing cells. Mimic NC was transfected as a control. The relative expression of miR-92a was determined by qRT-PCR in the transfected cells (Figure 2A). The results showed that after transfection with the miR-92a inhibitor the relative expression of miR-92a in PC-3 was decreased about 10-fold compared with PC-3 cells transfected with the control inhibitor NC. Meanwhile, transfection of the miR-92a mimic in LNCaP increased the expression of miR-92a about 300-fold compared with LNCaP cells transfected with the mimic NC. The effects of modifying the expression of miR-92a on the proliferation of the different PCa cells were determined using MTT assays (Figure 2B). The downregulation of miR-92a in PC-3 was associated with a significant growth inhibition (p < 0.01) compared with the control. Conversely, the overexpression of miR-92a in LNCaP cells resulted in a pronounced growth promoting effect (p < 0.05) compared with the control.
The results of the EdU assay (Figure 2C and D) showed that the presence of the miR-92a inhibitor resulted in the inhibition of the DNA replication activity in PC-3 cells (p < 0.01). Conversely, the miR-92a mimic promoted the DNA replication activity in LNCaP cells (p < 0.05), which indicated that the abnormal expression of miR-92a significantly affected the DNA replication activity of different PCa cells and thus their cell growth. The colony formation experiment (Figure 2E) also confirmed that the abnormal expression of miR-92a could significantly regulate the growth of these two types of PCa cells. No significant differences in chromosome concentration and apoptotic body generation were observed for the two types of PCa cells upon abnormal expression of miR-92a as revealed by Hoechst staining (Figure 2C and D). We therefore speculated that abnormal expression of miR-92a did not induce apoptosis. These results were further verified by flow cytometry, which confirmed that the abnormal expression of miR-92a did not induce apoptosis (Figure 3).
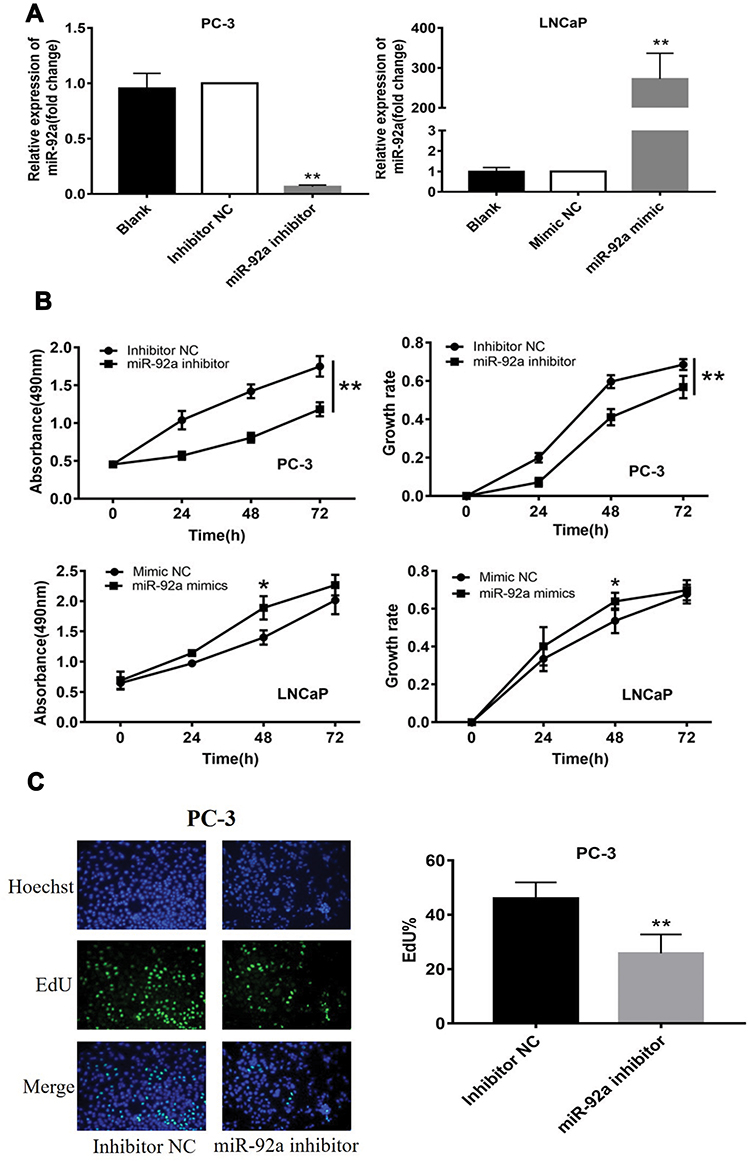 |
Figure 2 Continued. |
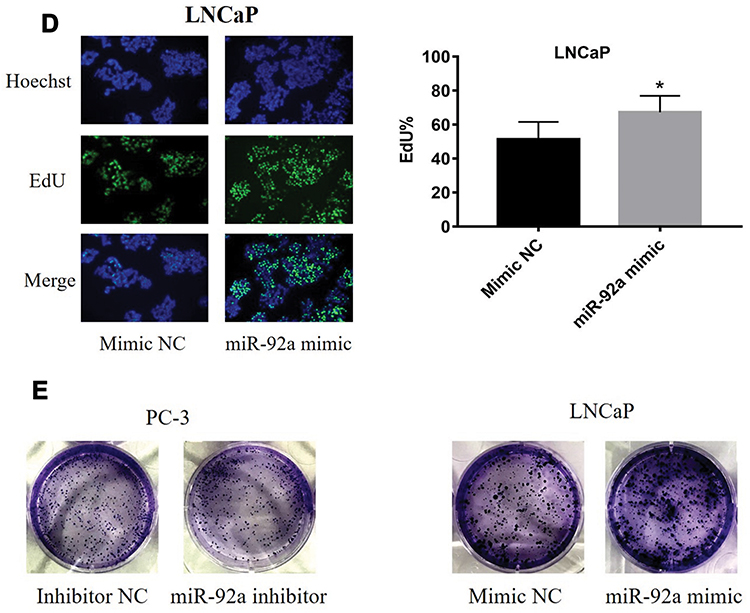 |
Figure 2 Effects of miR-92a inhibitor or miR-92a mimic transfection on the proliferation of PCa cells. (A) Relative expression of miR-92a in PC-3 and LNCaP cells transfected with miR-92a mimic or miR-92a inhibitor or mimic negative control (NC) or inhibitor negative control (NC) or without transfection (Blank) by qRT-PCR analysis. Expression of miR-92a in PC-3 cells transfected with inhibitor NC or in LNCaP cells transfected with mimic NC were set to 1. ** p < 0.01 vs inhibitor NC or mimic NC or blank group. (B-E) Proliferation of PC-3 cells following transfection with inhibitor NC or miR-92a inhibitor and of LNCaP cells following transfection with mimic NC or miR-92a mimic were detected by MTT assay (B), EdU assay (20× objective) (C, D) and Colony formation (E). * p < 0.05 ** p < 0.01 vs mimic NC or inhibitor NC. Per condition, three independent experiments were performed. |
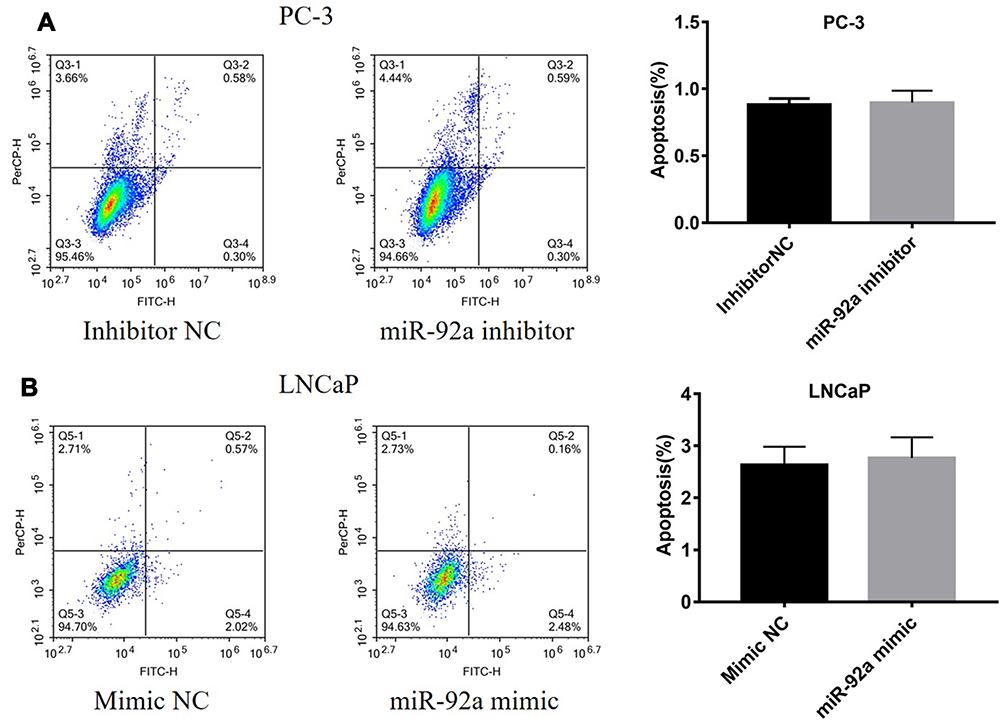 |
Figure 3 Expression levels of miR-92a do not affect apoptosis in PC-3 or LNCaP cells. PC-3 cells (A) were transfected with miR-92a inhibitor or inhibitor NC and LNCaP cells (B) were transfected with miR-92a mimic or mimic NC. Cells were harvested 36h after transfection, stained with annexin-V-FITC and PI, and analyzed by flow cytometry. The bar graphs show the combined percentages of early and late apoptotic cells (right quadrants). Abbreviation: NC, negative control. |
MiR-92a Regulates the Migration and Invasion of PCa Cells
Transwell assays were performed to investigate the role of miR-92a in the regulation of the migration and invasion ability of PCa cells in vitro (Figure 4). Our results showed that the migration capacity of PC-3 cells was significantly (p < 0.01) inhibited upon downregulation of miR-92a in the presence of the miR-92a inhibitor for 18 h and 24 h, compared with the control inhibitor NC (Figure 4A and B, left side). On the other hand, overexpression of miR-92a by transfecting the miR-92a mimic significantly (p < 0.01) promoted the migration capacity of the LNCaP cells after 24 h (Figure 4A and B, right side). Downregulation of miR-92a expression using the inhibitor significantly (p < 0.05) regulated the migration ability of PC-3 cells after 12 h, while upregulation of miR-92a expression using the mimic had no significant effect on the migration ability of LNCAP cells after 12 h, with significant differences only evident after 18 h (p < 0.05).
Our results showed that the downregulation of miR-92a expression by the inhibitor led to a significant (p < 0.05) inhibition of the invasion ability of PC-3 cells after 24h of treatment, while the upregulation of miR-92a expression significantly (p < 0.05) increased the invasion ability of LNCaP cells after 24 h (Figure 4C and D). Notably, the two opposite regulatory effects also displayed certain differences. In PC-3 cells the effect of the downregulation of miR-92a was already evident after 12–18 h, while in LNCaP cells, the up-regulation of miR-92a expression resulted in an increased invasion ability only after 18–24 h. Nevertheless, taken together these results demonstrated that miR-92a expression levels significantly affected the migration and invasion ability of both types of PCa cells.
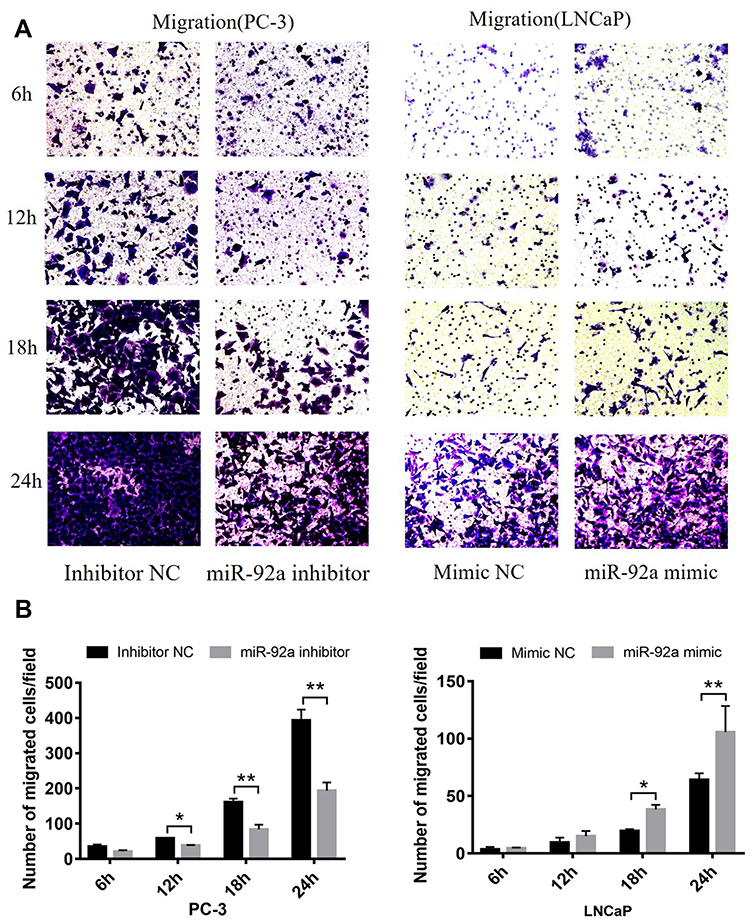 |
Figure 4 Continued. |
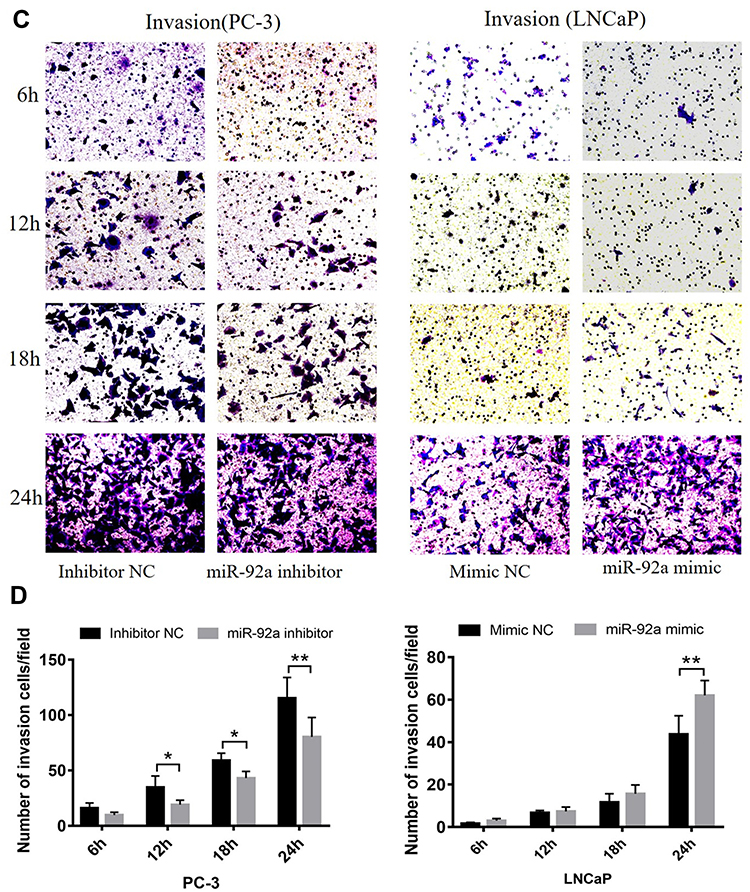 |
Figure 4 The migration and invasion of PC-3 and LNCaP cells after transfection with miR-92a inhibitor and miR-92a mimic, at 6, 12, 18, 24h as indicated. (A, C) Representative images of the invasion and migration of PC-3 or LNCaP cells taken by an inverted microscope (20× objective). (B, D) Quantitative analysis of cell migration (B) and invasion (D). **p < 0.01.*p < 0.05 vs mimic NC or inhibitor NC. Per condition, three independent experiments were performed. Abbreviation: NC, negative control. |
The Target Genes of miR-92a in Prostate Cancer Cells
We analyzed three databases, including TargetScan, starBase, and miRDB, for miR-92a targets and identified 17 candidate genes with 3ʹ untranslated regions (UTRs) containing potential miR-92a binding sites that were common to all three databases (Figure 5A). Next, we selected 7 potential miR-92a target genes with a target score greater than 80 for in-depth analysis, including AFF1, CHCHD10, FOSL2, NKX2-4, SETD5, ZFHX4 and SERTAD3 (Table 2). We used qRT-PCR to determine the transcriptional expression of these seven potential target genes in transfected PC-3 cells with downregulated of miR-92a and in transfected LNCaP cells with overexpressed miR-92a (Figures 5B and 7A). The results showed that the downregulation of miR-92a in PC-3 cells resulted in a significant (p < 0.05) upregulation the expression of CHCHD10, FOSL2, and SETD5, compared with control cells, and a significant (p < 0.01) downregulation of the expression of SERTAD3. However, the overexpression of miR-92a in LNCaP cells had no significant effect on the expression levels of the seven potential target genes at the mRNA level. These results suggested that the downregulation of miR-92a in PC-3 cells (with high metastasis potential) led to a downregulation of the expression of SERTAD3 at the transcriptional level, thus the regulation of both genes was positively correlated.
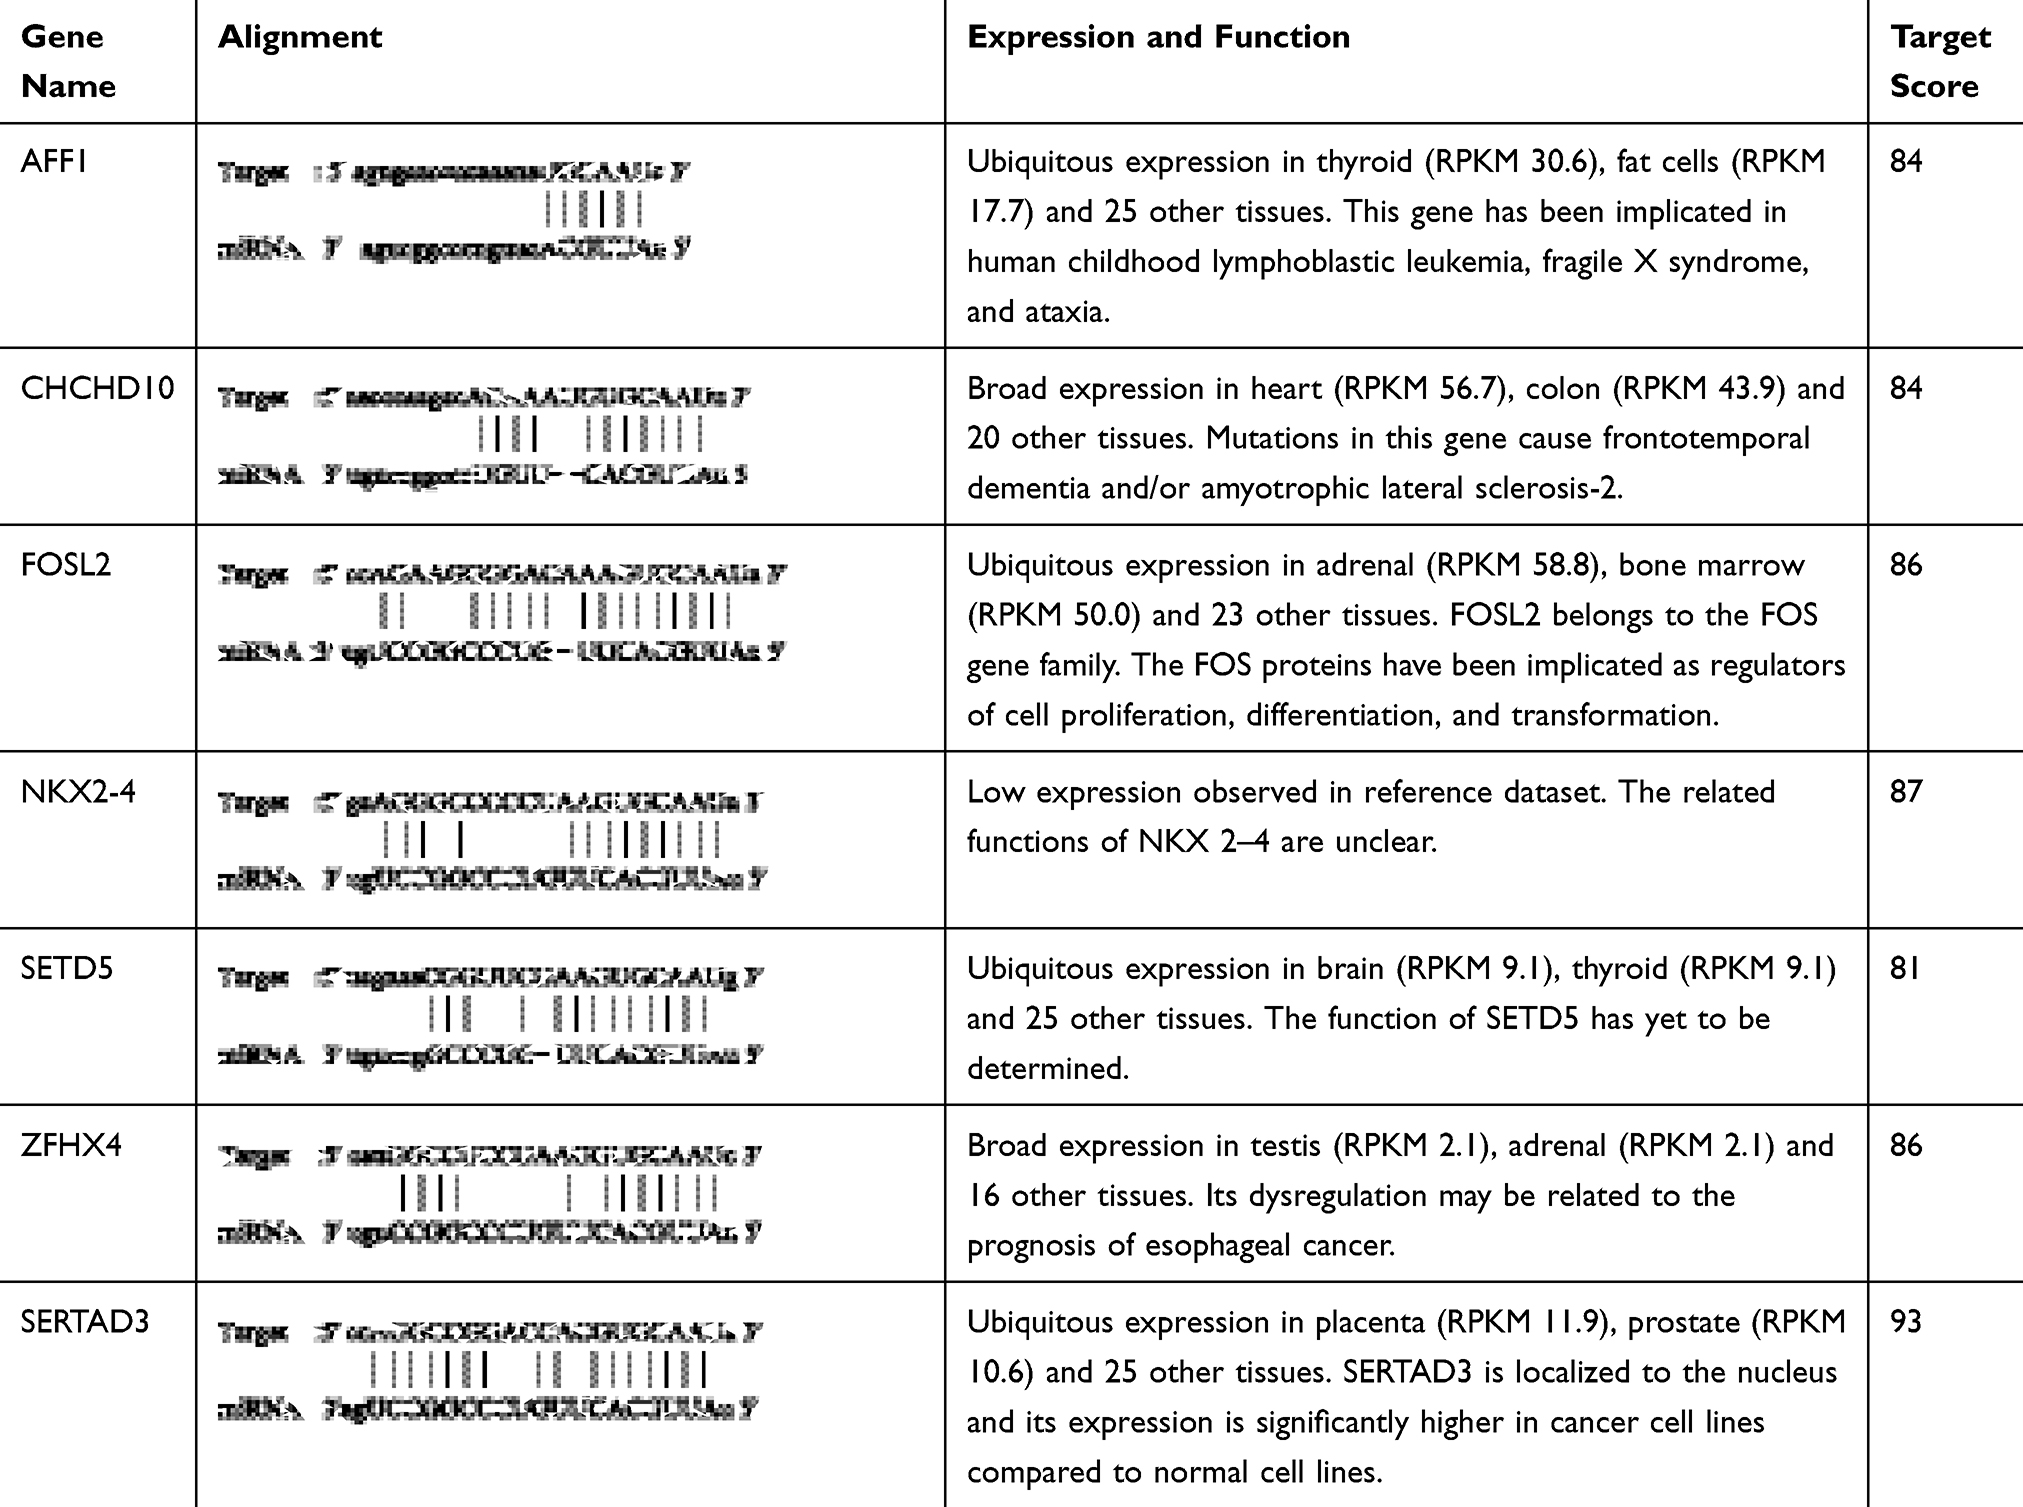 |
Table 2 Details of miR-92a Target Genes (Information from NCBI, StarBase and miRDB) |
In addition, Western blotting was used to detect effect on the protein expression levels of SERTAD3 in PC-3 cells upon downregulation of miR-92a (Figure 7B) and in LNCaP cells upon overexpression of miR-92a (Figure 7C). The results showed that the expression level of SERTAD3 in PC-3 was significantly lower upon the downregulation of miR-92a compared with control PC-3 (p < 0.01) and that the SERTAD3 protein was significantly up-regulated in LNCaP cells upon overexpression of miR-92a compared with control cells (p < 0.05), indicating that the expression of SERTAD3 was subject to regulation by miR-92a. In fact, SERTAD3 is localized to the nucleus and its expression was found to be significantly higher in MCF-7 breast cancer cells compared to normal breast cells.39 Inhibition of SERTAD3 expression led to a marked decrease in cell growth, migration, and invasion.39 Therefore, we decided to further investigate whether SERTAD3 is a direct regulatory target of miR-92a in PCa cells.
We constructed a luciferase expression vector including the 3ʹ-UTR of SERTAD3, or a mutant version that had lost its complementarity to miR-92a (Figure 6A, top) and co-transfected each with the empty vector (NC), the miR-92a inhibitor or the miR-92a mimic into 293T cells to detect the changes in luciferase activity that would indicate that the SERTAD3 gene was a target gene of miR-92a. The results (Figure 6A, bottom) demonstrated that expression of the miR-92a mimic led to a significant increase (p < 0.01) of the luciferase activity of the SERTAD3 3ʹ-UTR construct. In contrast, expression of the miR-92a inhibitor resulted in a significant decrease (p < 0.01) of the luciferase activity of the SERTAD3 3ʹ-UTR construct. Moreover, there were no changes in the mutant SERTAD3 3ʹ-UTR luciferase construct group (Figure 6A). Furthermore, we checked the sequence of the 3ʹ-UTRs of SERTAD family members SERTAD1, SERTAD2, SERTAD3, and SERTAD4 in the NCBI data base and analyzed the complementarity with the sequence of miR-92a (Figure 6B). The results showed that 72.3% of the nucleotides of miR-92a could complement the sequence of 3ʹ UTR of SERTAD3, while the other three members displayed no complementarity with miR-92a. These data suggested that SERTAD3, but not the other family members, is a direct target of miR-92a.
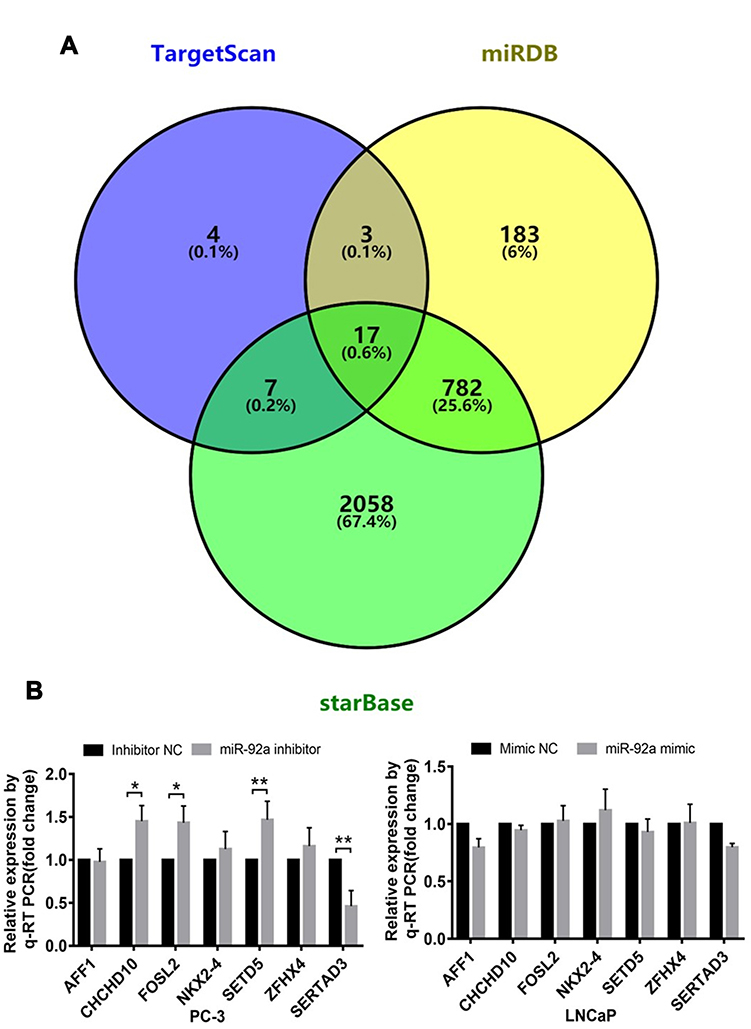 |
Figure 5 Identification of target genes of miR-92a. (A) TargetScan, miRDB and starBase (https://bioinfogp.cnb.csic.es/tools/venny/index.html) were screened for target genes of miR-92a. TargetScan showed 31 miR-92a target genes, starBase showed 2864 miR-92a target genes and miRDB showed 985 miR-92a target genes. StarBase and TargetScan shared 24 common target genes. StarBase and miRDB shared 799 common target genes. TargetScan and miRDB shared 20 common target genes. The Venn diagram indicated that 17 Target genes were common to all 3 databases. (B) Changes in relative transcription levels of potential target genes AFF1, CHCHD10, FOSL2, NKX2-4, SETD5, ZFHX4, and SERTAD3 in PC-3 cells transfected with miR-92a inhibitor compared with inhibitor NC (left panel), and in LNCaP cells transfected with miR-92a mimic compared with mimic NC (right panel). Transcription levels were assessed by qRT-PCR. GAPDH was used as an internal control. **p < 0.01. *p < 0.05 vs mimic NC or inhibitor NC. Per condition, three independent experiments were performed. NC, negative control. |
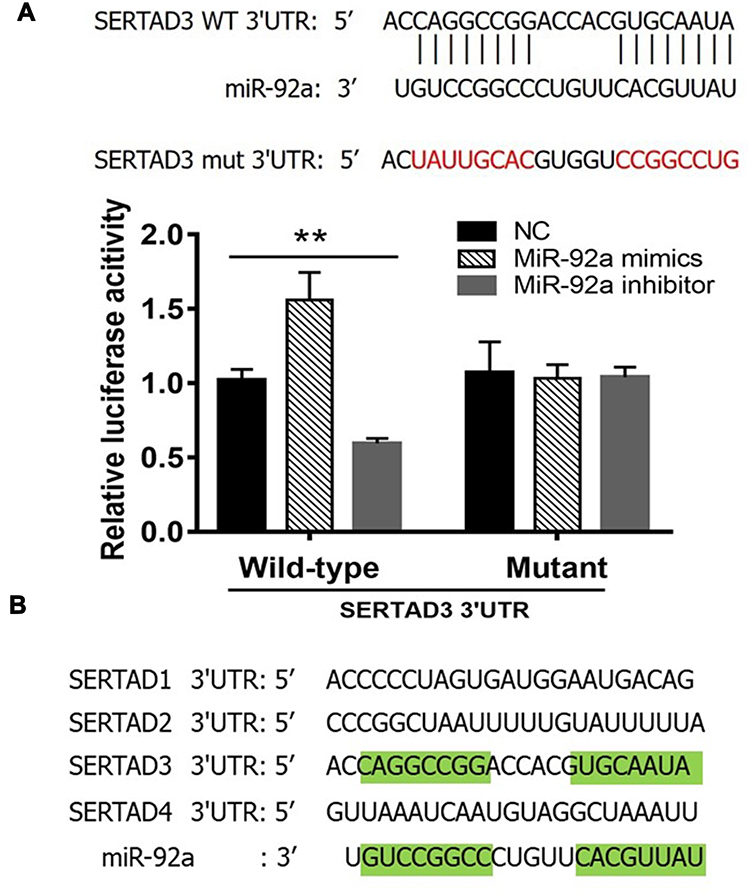 |
Figure 6 Dual-luciferase reporter gene assay. (A) Top: The 3ʹ-UTR sequence of SERTAD3 was fused to the luciferase gene. Indicated is the complementarity of the 3ʹ-UTR sequence with miR-92a. Also shown is the sequence of a mutant 3ʹ-UTR of SERTAD3 that has lost (indicated by red letters) its complementarity to miR-92a. Bottom: Relative luciferase assay comparing the PGL3-SERTAD3 and PGL3-SETRAD3-mut vectors in 293T cells co-transfected with miR-92a mimic, miR-92a inhibitor, and control (NC). Firefly luciferase activity was normalized to Renilla luciferase activity. **p < 0.01. Per condition, three independent experiments were performed. (B) Analysis of the 3ʹ-UTR sequences of the SERTAD family members identified SERTAD3 as the sole specific target of miR-92a. Green highlights in the SERTAD3 3ʹUTR sequence and in the miR-92a sequence indicate complementarity. |
SERTAD3-Dependent Regulation by miR-92a of the P38/P53/P21 Pathway in PC-3 Cells
It has been shown that SERTAD3 can regulate the activity of its downstream target gene p53 thereby regulating the proliferation of various cancer cells,40 while p38 is an upstream regulatory gene of p53 and p21 is a downstream regulatory gene of p53.41–43 Therefore, we assayed the expression of p38, p53, and p21 at the mRNA (Figure 7A) and protein levels (Figure 7B and C) in PCa cells with modified expression of miR-92a. Our results showed that the downregulation of SERTAD3 expression caused by the downregulation of miR-92a expression significantly (p < 0.01) upregulated the expression of p53 and p21 in PC-3 cells at the transcriptional and translational levels. In contrast, while there no significant effect on the expression of p38 at the transcriptional level in PC-3 cells, at the protein level a significant (p < 0.01) downregulation of p38 was evident (Figure 7A and B). There were no significant effects of overexpression of miR-92a in LNCaP cells on the expression of SERTAD3, p53, p38 and p21 at the transcriptional level. However, the expression of SERTAD3 (p < 0.05) and p38 (p < 0.01) were significantly upregulated at the protein level while p21 (p < 0.01) and p53 (p < 0.01) were significantly downregulated in LNCaP cells upon overexpression of miR-92a (Figure 7A and C). These results suggested that SERTAD3-dependent regulation of miR-92a affected the growth and metastasis of PCa cells which involved the regulation of the expression of p53, p38 and p21 proteins.
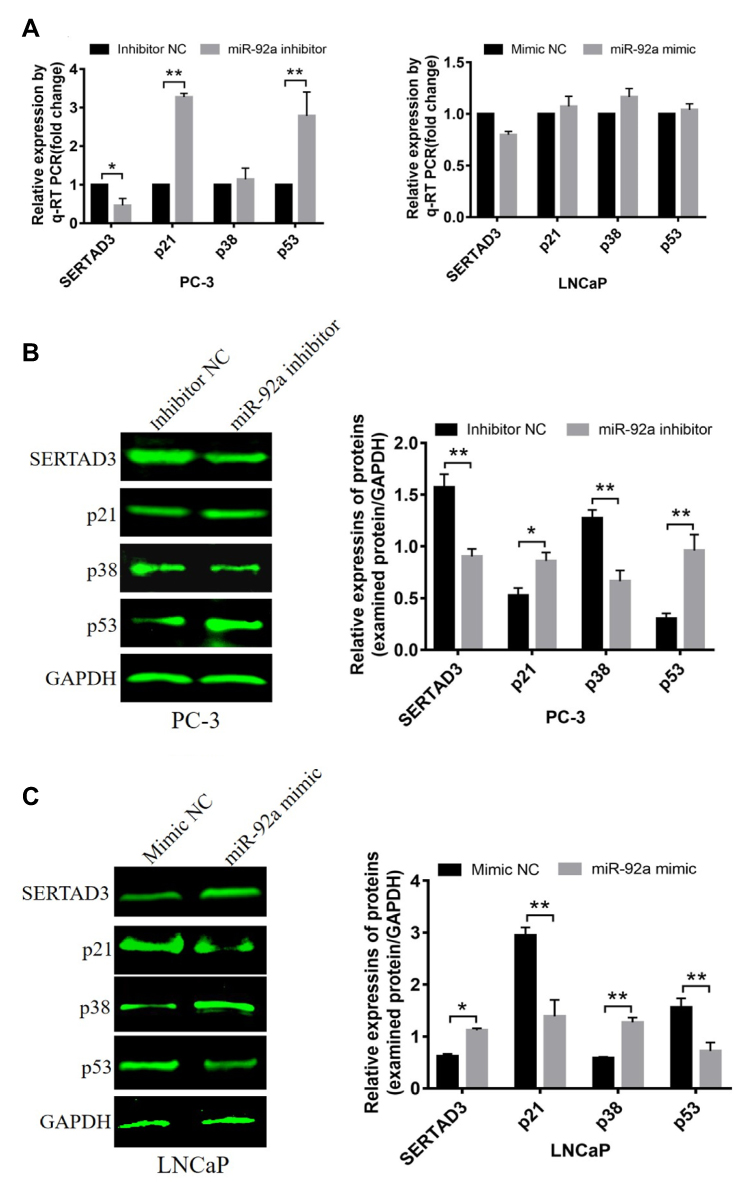 |
Figure 7 Effect of miR-92a on the expression of SERTAD3 and on the proteins of the p38/p53/p21 pathway. (A) Relative expression of four genes (SERTAD3, p21, p38 and p53) in PC-3 cells transfected with miR-92a inhibitor and in LNCaP cells transfected with miR-92a compared with control PC-3 or LNCaP cells, respectively. GAPDH was used as an internal reference. (B, C) miR-92a promoted the expression of the SERTAD3, p38 protein and suppressed the expression of p53 and p21.The relative protein levels were calculated by Image J software (Rawak Software, Inc., Dresden, Germany). GAPDH was used as a loading control. *p < 0.05 **p < 0.01. Per condition, three independent experiments were performed. |
Inhibition of PC-3 Cell Growth, Migration, and Invasion Upon Downregulation of miR-92a Expression Can Be Alleviated by Overexpressing SERTAD3
We further analyzed the effect of the regulation of the miR-92a target SERTAD3 on cell proliferation, viability, migration, and invasion by co-transfecting the miR-92a inhibitor and a SERTAD3-expressing vector into PC-3 cells (Figure 8). Our results show that, in the absence of exogenously induced expression of SERTAD3 (Figure 8A), downregulation of miR-92a expression by the inhibitor significantly (p < 0.01) inhibited the growth (Figure 8B), invasion, and migration of the PC-3 cells compared with control cells (miR-92a inhibitor + pcDNA3.1 vs inhibitor NC + pcDNA3.1), further demonstrating that down-regulation of miR-92a expression significantly inhibited the growth, invasion, and migration ability of PC-3 cells. Upon induction of exogenous expression of SERTAD3, down-regulation of miR-92a expression using the inhibitor also significantly (p < 0.01) inhibited the growth, invasion, and migration of the cells (mir-92a inhibitor + SERTAD3 vs inhibitor NC + SERTAD3, miR-92a inhibitor + pcDNA3.1 vs inhibitor NC + SERTAD3), which further indicated that the downregulation of SERTAD3 (Figure 8A) depended on the downregulation of miR-92a expression, which could significantly (p < 0.01) regulate the growth, invasion and migration of PCa cells. However, when miR-92a inhibitor was not used to downregulate the expression of miR-92a, induction of exogenous expression of SERTAD3 promoted (p < 0.01) the growth, invasion, and migration of cancer cells (inhibitor NC + SERTAD3 vs inhibitor NC + pcDNA3.1). In cells with exogenous expression of SERTAD3, down-regulation of miR-92a expression with the inhibitor slowed down the effect of exogenous overexpression of SERTAD3 on stimulating the growth, invasion and migration of cancer cells (miR-92a inhibitor + SERTAD3 vs inhibitor NC + pcDNA3.1). In cells in which the miR-92a inhibitor caused downregulation of the expression of miR-92a, induction of exogenous expression of SERTAD3 significantly (p < 0.05) promoted cell growth, invasion and migration (miR-92a inhibitor + SERTAD3 vs miR-92a inhibitor + pcDNA3.1), suggesting that overexpression of SERTAD3 could attenuate the inhibitory effects of down-regulation of miR-92a. Taken together, these results indicated that the overexpression of SERTAD3 promoted the growth, invasion and migration of PC-3 cells, and that the overexpression of SERTAD3 alleviated the inhibitory effect of miR-92a inhibitor on the growth, invasion, and migration of PC-3 cells caused by the down-regulation of miR-92a expression showing that SERTAD3 is a downstream effector of miR-92a in PCa cells.
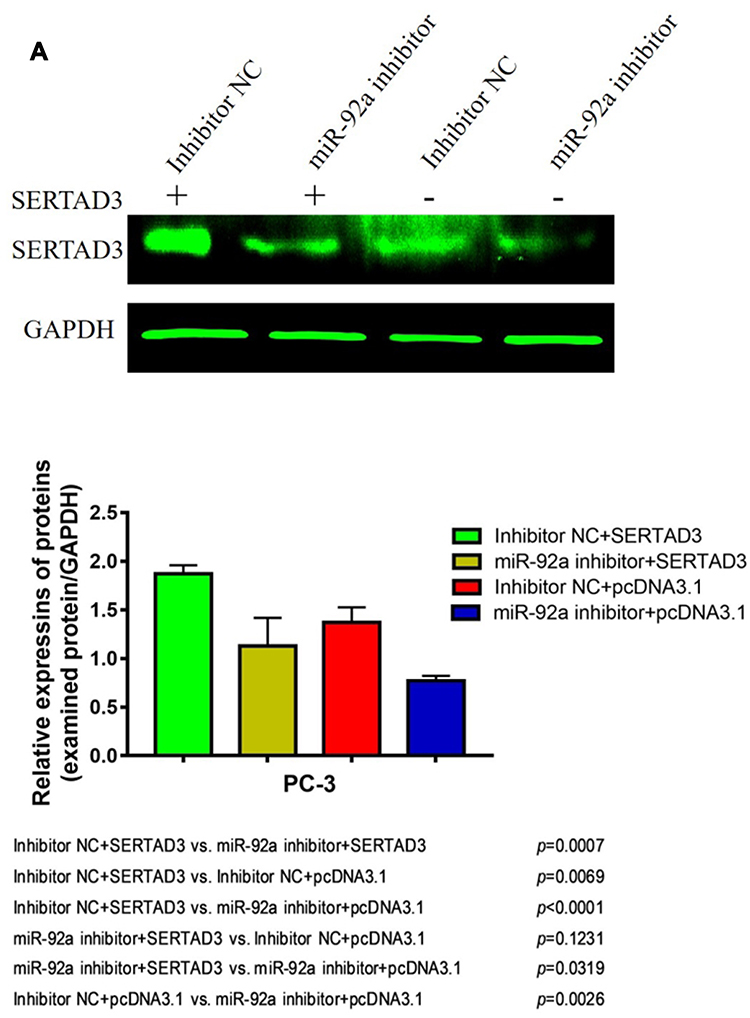 |
Figure 8 Continued. |
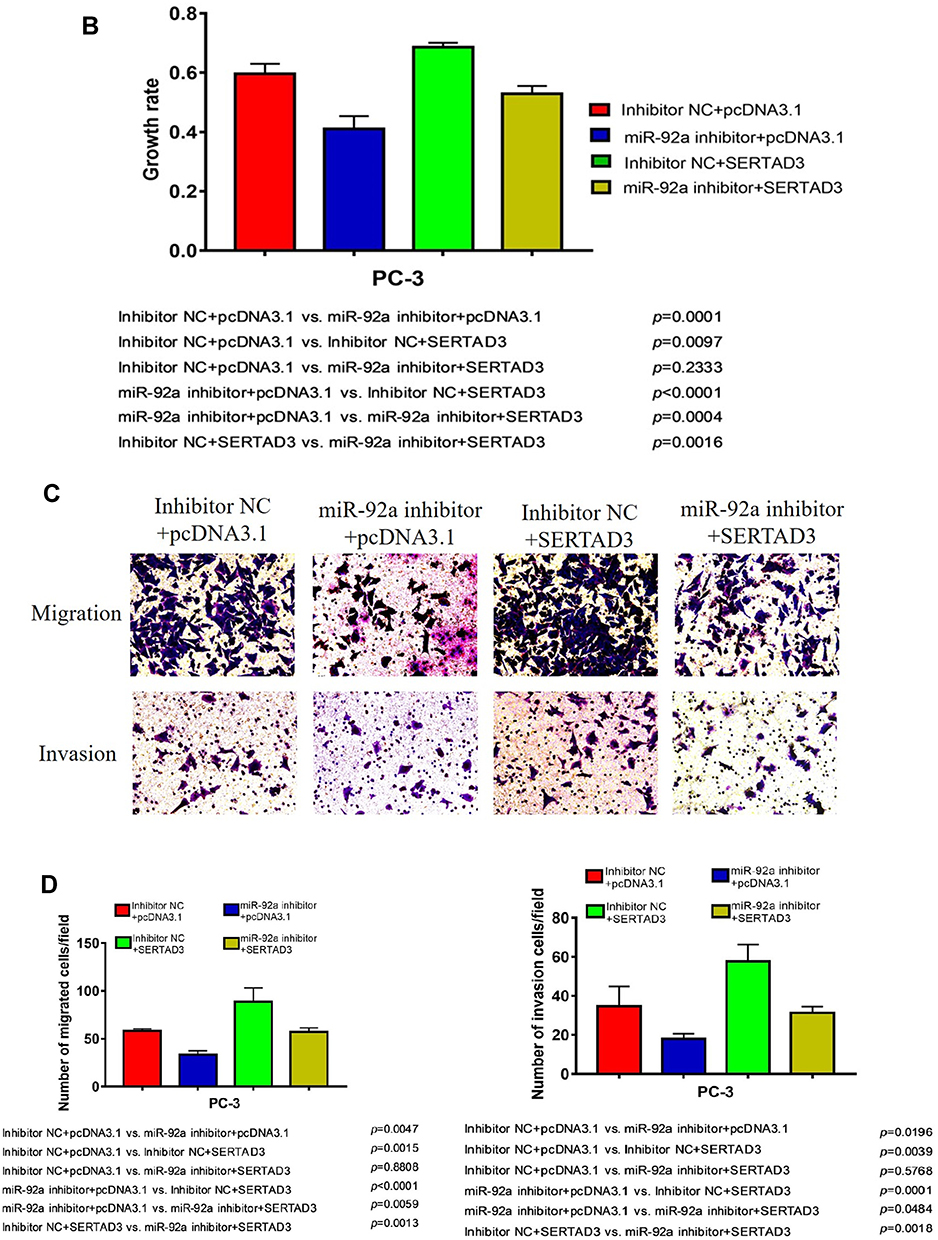 |
Figure 8 Overexpression of SERTAD3 attenuated the inhibitory effect of miR-92a overexpression in PC-3 cells. (A) Top part: SERTAD3 expression in PC-3 transfected with SETRAD3 or pcDNA3.1 with or without miR-92a inhibitor or inhibitor NC was analyzed by Western Blot. GAPDH expression was analyzed as an internal reference. A representative blot of three independent experiments is shown. Bottom part: Relative levels of protein expression were measured by the gray-scale value of the bands using Image J software. (B) Growth rates of PC-3 cells transfected with miR-92a inhibitor or inhibitor NC together with SERTAD3 or empty vector. The data were obtained using the MTT assay at 48 h after transfection. (C, D) SERTAD3 affected the invasion (12h) and migration (12h) of PC-3 cells transfected with miR-92a inhibitor or inhibitor NC. Abbreviation: NC, negative control. |
Discussion
Different miRNAs play important roles in cell proliferation, apoptosis, tissue differentiation, and other biological processes, and abnormal expression of miRNAs is closely implicated in the occurrence, development, metastasis, and prognosis of a variety of cancers. The present study contributes to our working knowledge of the oncogenic and tumor suppressive function of miRNAs, and the direct consequences of aberrant miRNA expression on tumorigenesis and development of PCa. Here, we report that the members of the miR-17-92 cluster are selectively expressed in PCa cells with different metastatic abilities. This result revealed the relationship between the expression of these miRNAs and the development of PCa. Aberrant expression of miR-92a, one of the members of the miR-17-92 cluster, resulted in dysregulation of cell proliferation, migration, and invasion of PC-3 cells. We confirmed that SERTAD3 is a direct target gene of miR-92a in PCa cells. In line with this, the effect of the inhibitor of miRNA-92a could be alleviated by the overexpression of SERTAD3. Moreover, the effect of downregulation of SERTAD3, associated with inhibition of miRNA-92a, on the inhibition of the growth, invasion, and migration of PC-3 cells was associated with differential expression of key genes of the p53 pathway, such as p38, p53, and p21. These results suggest that the inhibition of miR-92a may provide a treatment option of PCa, by targeting SERTAD3 expression, and provided a thorough discussion of both tumor-promoting and tumor-suppressing roles for individual members of the miR-17-92 cluster.
In our study, the mechanisms and implications of miR-92a expression on the metastasis of PCa were investigated using a series of molecular and biochemical approaches. SERTAD3 was confirmed as a target gene of miR-92a in our results, and could potentially serve as a hallmark of PCa progression. In fact, SERTAD3 is a novel transcriptional co-activator that interacts with the RPA protein, and that has a significantly higher activity in transformed cells.44 It has been reported that SERTAD3 can modify the cellular phenotype by regulating p53.40,44 Our results provide evidence that a miRNA, miR-92a, changes the phenotype of PCa cells by targeting SERTAD3. Generally, miRNAs regulate the degradation of target mRNA molecules and/or protein translation through complete or partial complementary pairing with the 3ʹ UTR of its target mRNAs, thereby playing their regulatory roles at the post-transcriptional level, resulting in gene silencing. Mature miRNAs play an important role in tumor proliferation, apoptosis, differentiation, and metastasis by inhibiting the expression of their target genes and may become new biomarkers for tumor treatment. Usually, miRNAs are directed at multiple targets and can therefore regulate multiple genes, amplifying their roles in biological processes. Previous studies have shown that the overexpression of SERTAD3 in non-transformed cells led to oncogenic transformation, both in vitro and in vivo.39 Conversely, SERTAD3 inhibition has been reported to result in a marked decrease in cell growth.39 Here, we demonstrated that SERTAD3, as a direct target of miR-92a, can be regulated by miR-92a at the post-transcriptional level in PCa cells. Notably, we found that the overexpression of SERTAD3 alleviated the inhibition of the proliferation, invasion, and migration of the highly metastatic PC-3 cells by a miR-92a inhibitor, indicating that miR-92a may regulate the malignant metastasis of PCa cells by directly targeting SERTAD3.
SERTAD family proteins are nuclear factors that are implicated in the regulation of the transcriptional activity of the p53 tumor suppressor protein. Expression of SERTAD3 strongly stimulates p53 transcriptional activity as well as a p53-dependent signaling pathway leading to growth inhibition. As a tumor suppressor, p53 plays a key role in various regulatory pathways including the regulation of cell cycle checkpoints, DNA repair, apoptosis,45 and metastasis. At present, a whole spectrum of new interventions targeting p53 and its pathway are being explored due to the excitement caused by the future entry into the clinic of p53 inhibitors. The extraordinary resources available to the p53 community in terms of reagents, models, and collaborative networks are generating breakthrough approaches to its clinical use in cancer therapy. The activation of the expression of p53 inhibits the tumorigenesis and development of various cancers, including head and neck squamous,46 and endometrial cancer,47 by targeting p21. It has been demonstrated by Park et al (2016) that p38 induces the rapid degradation of MDM2,48 leading to enhanced expression of EGFR, and consequently regulates stabilization of p53, which suggested for the first time that the p38/p53 axis is crucial for the facilitation of drug resistance in lung cancer. The inactivation of p38 has been found to result in upregulation of p21 expression in the cytoplasm of pancreatic cancer and lung cancer cells.49,50 It has been reported in breast cancer and lung cancer studies that overexpression of p38 can also cause p21 downregulation, further inducing cell growth promotion.51 In particular, the activation of the p38 gene promoted the proliferation of PCa cells.52 The synergistic role of p38 and p21 was pivotal for inhibiting tumor growth by regulating the cell cycle in esophageal cancer cells.53 The role of p38 in the development of PCa has also been reported, and p38 imbalance can also promote the proliferation of Pca cells.54 Given its similar role to SERTAD3, we suspect that p38 may be potentially associated with SERTAD3. We will explore this in subsequent studies.
The p38/p53/p21 pathway plays a key role in the occurrence and development of cancer, while negatively affecting the sensitivity of PCa cells to chemotherapy drugs.55 Additional data provide a foundation for the future development of potential therapeutic strategies that include the regulation of the p38/p53/p21 pathway for the treatment of cancer patients who are affected by drug resistance. In this study, we found that the expression of miR-92a, targeting SERTAD3 in PCa cells, could regulate the expression of members of the p38/p53/p21 pathway. In fact, the expression of p21 and of p38 was positively and negatively correlated with p53, respectively. Therefore, we suggest that the regulation of the p38/p53/p21 pathway is the core molecular mechanism responsible for the inhibition of cell proliferation, invasion, and migration of PCa cells by miR-92a and its target SERTAD3 (Figure 9).
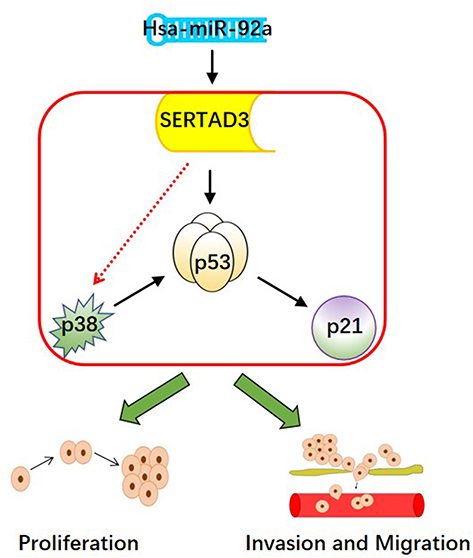 |
Figure 9 The hypothetical pathway for miR-92a-induced invasion, migration and proliferation in PCa cells. |
It is therefore conceivable that in tumors overexpressing miR-92a or carrying an amplified miR-92a locus, collaboration with preexisting conditions is necessary to generate the imbalanced expression of this member of the miR-17-92 cluster to convert the PCa cells from a premalignant to a malignant phenotype, especially related to their metastatic capability. Further research into the relationship between the expression levels of the different members of the miR-17-92 cluster and metastatic ability can potentially be exploited for the diagnosis and treatment of PCas displaying miR-17-92 gene amplification. Detailed characterization of the miR-17-92 gene cluster and its individual members, such as miR-92a, may increase our understanding of the basic mechanisms of regulation in PCa cells and may be helpful for the development of novel and efficient molecular targets for preventing cellular migration and invasion, and consequently inhibit the malignant growth of PCa.
Disclosure
The authors report no conflicts of interest in this work.
References
1. Siegel RL, Miller KD, Jemal A. Cancer statistics, 2019. CA Cancer J Clin. 2019;69(1):7–34. doi:10.3322/caac.21551
2. Litwin MS, Tan HJ. The diagnosis and treatment of prostate cancer: a review. JAMA. 2017;317(24):2532–2542. doi:10.1001/jama.2017.7248
3. Saad F, Fizazi K. Androgen deprivation therapy and secondary hormone therapy in the management of hormone-sensitive and castration-resistant prostate cancer. Urology. 2015;86(5):852–861. doi:10.1016/j.urology.2015.07.034
4. Nabid A, Carrier N, Martin A-G, et al. Duration of androgen deprivation therapy in high-risk prostate cancer: a randomized Phase III trial. Eur Urol. 2018;74(4):432–441. doi:10.1016/j.eururo.2018.06.018
5. Boevé LMS, Hulshof MCCM, Vis AN, et al. Effect on survival of androgen deprivation therapy alone compared to androgen deprivation therapy combined with concurrent radiation therapy to the prostate in patients with primary bone metastatic prostate cancer in a prospective randomised clinical trial: data from the HORRAD trial. Eur Urol. 2019;75(3):410–418. doi:10.1016/j.eururo.2018.09.008
6. Barthel SR, Hays DL, Yazawa EM, et al. Definition of molecular determinants of prostate cancer cell bone extravasation. Cancer Res. 2013;73(2):942–952. doi:10.1158/0008-5472.CAN-12-3264
7. Semenas J, Allegrucci C, Boorjian SA, Mongan NP, Persson JL. Overcoming drug resistance and treating advanced prostate cancer. Curr Drug Targets. 2012;13(10):1308–1323. doi:10.2174/138945012802429615
8. Zhang S, Zheng C, Yao S, et al. Proteomic analysis of human prostate cancer PC-3M-1E8 cells and PC-3M-2B4 cells of same origin but with different metastatic potential. PLoS One. 2018;13(10):e0206139. doi:10.1371/journal.pone.0206139
9. Bartel DP. MicroRNAs: genomics, biogenesis, mechanism, and function. Cell. 2004;116(2):281–297. doi:10.1016/S0092-8674(04)00045-5
10. Bartel DP. MicroRNAs: target recognition and regulatory functions. Cell. 2009;136(2):215–233. doi:10.1016/j.cell.2009.01.002
11. Lai EC, Tomancak P, Williams RW, Rubin GM. Computational identification of Drosophila microRNA genes. Genome Biol. 2003;4(7):R42. doi:10.1186/gb-2003-4-7-r42
12. Lewis BP, Burge CB, Bartel DP. Conserved seed pairing, often flanked by adenosines, indicates that thousands of human genes are microRNA targets. Cell. 2005;120(1):15–20. doi:10.1016/j.cell.2004.12.035
13. Lu J, Getz G, Miska EA, et al. MicroRNA expression profiles classify human cancers. Nature. 2005;435(7043):834–838. doi:10.1038/nature03702
14. Ota A, Tagawa H, Karnan S, et al. Identification and characterization of a novel gene, C13orf25, as a target for 13q31-q32 amplification in malignant lymphoma. Cancer Res. 2004;64(9):3087–3095. doi:10.1158/0008-5472.CAN-03-3773
15. Sikand K, Slane SD, Shukla GC. Intrinsic expression of host genes and intronic miRNAs in prostate carcinoma cells. Cancer Cell Int. 2009;9:21. doi:10.1186/1475-2867-9-21
16. Hayashita Y, Osada H, Tatematsu Y, et al. A polycistronic microRNA cluster, miR-17-92, is overexpressed in human lung cancers and enhances cell proliferation. Cancer Res. 2005;65(21):9628–9632. doi:10.1158/0008-5472.CAN-05-2352
17. Alcantara KMM, Garcia RL. MicroRNA92a promotes cell proliferation, migration and survival by directly targeting the tumor suppressor gene NF2 in colorectal and lung cancer cells. Oncol Rep. 2019;41(4):2103–2116. doi:10.3892/or.2019.7020
18. Lv H, Zhang Z, Wang Y, Li C, Gong W, Wang X. MicroRNA-92a promotes colorectal cancer cell growth and migration by inhibiting KLF4. Oncol Res. 2016;23(6):283–290. doi:10.3727/096504016X14562725373833
19. Dai H, Wang C, Yu Z, et al. MiR-17 regulates prostate cancer cell proliferation and apoptosis through inhibiting JAK-STAT3 signaling pathway. Cancer Biother Radiopharm. 2018;33(3):103–109. doi:10.1089/cbr.2017.2386
20. Wu D, Zhang H, Ji F, Ding W. MicroRNA-17 promotes osteosarcoma cells proliferation and migration and inhibits apoptosis by regulating SASH1 expression. Pathol Res Pract. 2019;215(1):115–120. doi:10.1016/j.prp.2018.10.012
21. Liu G, Liu Y, Yang Z, Wang J, Li D, Zhang X. Tumor suppressor microRNA-18a regulates tumor proliferation and invasion by targeting TBPL1 in colorectal cancer cells. Mol Med Rep. 2015;12(5):7643–7648. doi:10.3892/mmr.2015.4335
22. Hsu TI, Hsu CH, Lee KH, et al. MicroRNA-18a is elevated in prostate cancer and promotes tumorigenesis through suppressing STK4 in vitro and in vivo. Oncogenesis. 2014;3:e99. doi:10.1038/oncsis.2014.12
23. Wang SY, Shiboski S, Belair CD, et al. miR-19, miR-345, miR-519c-5p serum levels predict adverse pathology in prostate cancer patients eligible for active surveillance. PLoS One. 2014;9(6):e98597. doi:10.1371/journal.pone.0098597
24. Zhu Q, Zang Q, Jiang ZM. Enhanced expression of non coding miR 92a expression is implicated in the development of lung cancer. Eur Rev Med Pharmacol Sci. 2018;22(4):1028–1034. doi:10.26355/eurrev_201802_14385
25. Shin VY, Siu MT, Liu X, Ng EKO, Kwong A, Chu KM. MiR-92 suppresses proliferation and induces apoptosis by targeting EP4/Notch1 axis in gastric cancer. Oncotarget. 2018;9(36):24209–24220. doi:10.18632/oncotarget.24819
26. Li ZH, Li L, Kang LP, Wang Y. MicroRNA-92a promotes tumor growth and suppresses immune function through activation of MAPK/ERK signaling pathway by inhibiting PTEN in mice bearing U14 cervical cancer. Cancer Med. 2018.
27. Li X, Guo S, Min L, Guo Q, Zhang S. miR-92a-3p promotes the proliferation, migration and invasion of esophageal squamous cell cancer by regulating PTEN. Int J Mol Med. 2019;44(3):973–981. doi:10.3892/ijmm.2019.4258
28. El-Halawani N, Hamed N, Eldafrawi M, Mourad Z, Sorour A, Ghallab O. Diagnostic and prognostic value of plasma level of microRNA-92a in acute myeloid leukemia. Am J Mol Biol. 2014;04(01):1–10. doi:10.4236/ajmb.2014.41001
29. Wu Y-Z, Sun J, Zhang Y, et al. Effective integration of targeted tumor imaging and therapy using functionalized InP QDs with VEGFR2 monoclonal antibody and miR-92a inhibitor. ACS Appl Mater Interfaces. 2017;9(15):13068–13078. doi:10.1021/acsami.7b02641
30. Liu Y, Liu R, Yang F, et al. miR-19a promotes colorectal cancer proliferation and migration by targeting TIA1. Mol Cancer. 2017;16(1):53. doi:10.1186/s12943-017-0625-8
31. Fan Y, Yin S, Hao Y, et al. miR-19b promotes tumor growth and metastasis via targeting TP53. RNA (New York, NY). 2014;20(6):765–772. doi:10.1261/rna.043026.113
32. Si W, Shen J, Du C, et al. A miR-20a/MAPK1/c-Myc regulatory feedback loop regulates breast carcinogenesis and chemoresistance. Cell Death Differ. 2018;25(2):406–420. doi:10.1038/cdd.2017.176
33. Wang M, Zeng X, Li S, et al. A novel tanshinone analog exerts anti-cancer effects in prostate cancer by inducing cell apoptosis, arresting cell cycle at G2 phase and blocking metastatic ability. Int J Mol Sci. 2019;20:18.
34. Fang LL, Sun BF, Huang LR, et al. Potent Inhibition of miR-34b on migration and invasion in metastatic prostate cancer cells by regulating the TGF-β pathway. Int J Mol Sci. 2017;18(12):12. doi:10.3390/ijms18122762
35. He J, Mai J, Li Y, et al. miR-597 inhibits breast cancer cell proliferation, migration and invasion through FOSL2. Oncol Rep. 2017;37(5):2672–2678. doi:10.3892/or.2017.5558
36. Zhang YQ, Wen ZH, Wan K, et al. A novel synthesized 3ʹ, 5ʹ-diprenylated chalcone mediates the proliferation of human leukemia cells by regulating apoptosis and autophagy pathways. Biomed Pharmacother. 2018;106:794–804. doi:10.1016/j.biopha.2018.06.153
37. Chen C, Deng Y, Hu X, et al. miR-128-3p regulates 3T3-L1 adipogenesis and lipolysis by targeting Pparg and Sertad2. J Physiol Biochem. 2018;74(3):381–393. doi:10.1007/s13105-018-0625-1
38. Aalinkeel R, Nair MP, Sufrin G, et al. Gene expression of angiogenic factors correlates with metastatic potential of prostate cancer cells. Cancer Res. 2004;64(15):5311–5321. doi:10.1158/0008-5472.CAN-2506-2
39. Darwish H, Cho JM, Loignon M, Alaoui-Jamali MA. Overexpression of SERTAD3, a putative oncogene located within the 19q13 amplicon, induces E2F activity and promotes tumor growth. Oncogene. 2007;26(29):4319–4328. doi:10.1038/sj.onc.1210195
40. Watanabe-Fukunaga R, Iida S, Shimizu Y, Nagata S, Fukunaga R. SEI family of nuclear factors regulates p53-dependent transcriptional activation. Genes Cells. 2005;10(8):851–860. doi:10.1111/j.1365-2443.2005.00881.x
41. Wu GS. The functional interactions between the p53 and MAPK signaling pathways. Cancer Biol Ther. 2004;3(2):156–161. doi:10.4161/cbt.3.2.614
42. Stramucci L, Pranteda A, Bossi G. Insights of crosstalk between p53 protein and the MKK3/MKK6/p38 MAPK signaling pathway in cancer. Cancers. 2018;10(5):5. doi:10.3390/cancers10050131
43. Barr AR, Cooper S, Heldt FS, et al. DNA damage during S-phase mediates the proliferation-quiescence decision in the subsequent G1 via p21 expression. Nat Commun. 2017;8(1):14728. doi:10.1038/ncomms14728
44. Cho JM, Song DJ, Bergeron J, Benlimame N, Wold MS, Alaoui-Jamali MA. RBT1, a novel transcriptional co-activator, binds the second subunit of replication protein A. Nucleic Acids Res. 2000;28(18):3478–3485. doi:10.1093/nar/28.18.3478
45. Vousden KH, Lu X. Live or let die: the cell’s response to p53. Nat Rev Cancer. 2002;2(8):594–604. doi:10.1038/nrc864
46. Jin S, Yang X, Li J, Yang W, Ma H, Zhang Z. p53-targeted lincRNA-p21 acts as a tumor suppressor by inhibiting JAK2/STAT3 signaling pathways in head and neck squamous cell carcinoma. Mol Cancer. 2019;18(1):38. doi:10.1186/s12943-019-0993-3
47. Li L-H, Zhang P-R, Cai P-Y, Li Z-C. Histone deacetylase inhibitor, Romidepsin (FK228) inhibits endometrial cancer cell growth through augmentation of p53-p21 pathway. Biomed Pharmacother. 2016;82:161–166. doi:10.1016/j.biopha.2016.04.053
48. Park S-H, Seong M-A, Lee H-Y. p38 MAPK-induced MDM2 degradation confers paclitaxel resistance through p53-mediated regulation of EGFR in human lung cancer cells. Oncotarget. 2016;7(7):8184–8199. doi:10.18632/oncotarget.6945
49. Aasrum M, Thoresen GH, Christoffersen T, Brusevold IJ. p38 differentially regulates ERK, p21, and mitogenic signalling in two pancreatic carcinoma cell lines. J Cell Commun Signal. 2018;12(4):699–707. doi:10.1007/s12079-017-0444-0
50. Yu S-Y, Liao C-H, Chien M-H, Tsai T-Y, Lin J-K, Weng M-S. Induction of p21(Waf1/Cip1) by garcinol via downregulation of p38-MAPK signaling in p53-independent H1299 lung cancer. J Agric Food Chem. 2014;62(9):2085–2095. doi:10.1021/jf4037722
51. Neve RM, Holbro T, Hynes NE. Distinct roles for phosphoinositide 3-kinase, mitogen-activated protein kinase and p38 MAPK in mediating cell cycle progression of breast cancer cells. Oncogene. 2002;21(29):4567–4576. doi:10.1038/sj.onc.1205555
52. Zhu M, Huang C, Ma X, et al. Phthalates promote prostate cancer cell proliferation through activation of ERK5 and p38. Environ Toxicol Pharmacol. 2018;63:29–33. doi:10.1016/j.etap.2018.08.007
53. Zhong D, Gu C, Shi L, et al. Obatoclax induces G1/G0-phase arrest via p38/p21(waf1/Cip1) signaling pathway in human esophageal cancer cells. J Cell Biochem. 2014;115(9):1624–1635. doi:10.1002/jcb.24829
54. Browne AJ, Göbel A, Thiele S, Hofbauer LC, Rauner M, Rachner TD. p38 MAPK regulates the Wnt inhibitor Dickkopf-1 in osteotropic prostate cancer cells. Cell Death Dis. 2016;7:e2119. doi:10.1038/cddis.2016.32
55. Gan L, Wang J, Xu H, Yang X. Resistance to docetaxel-induced apoptosis in prostate cancer cells by p38/p53/p21 signaling. Prostate. 2011;71(11):1158–1166. doi:10.1002/pros.21331
 © 2020 The Author(s). This work is published and licensed by Dove Medical Press Limited. The full terms of this license are available at https://www.dovepress.com/terms.php and incorporate the Creative Commons Attribution - Non Commercial (unported, v3.0) License.
By accessing the work you hereby accept the Terms. Non-commercial uses of the work are permitted without any further permission from Dove Medical Press Limited, provided the work is properly attributed. For permission for commercial use of this work, please see paragraphs 4.2 and 5 of our Terms.
© 2020 The Author(s). This work is published and licensed by Dove Medical Press Limited. The full terms of this license are available at https://www.dovepress.com/terms.php and incorporate the Creative Commons Attribution - Non Commercial (unported, v3.0) License.
By accessing the work you hereby accept the Terms. Non-commercial uses of the work are permitted without any further permission from Dove Medical Press Limited, provided the work is properly attributed. For permission for commercial use of this work, please see paragraphs 4.2 and 5 of our Terms.