Back to Journals » Diabetes, Metabolic Syndrome and Obesity » Volume 15
Mice Lacking Gpr75 are Hypophagic and Thin
Authors Powell DR ![]() , Doree DD, DaCosta CM, Platt KA, Brommage R
, Doree DD, DaCosta CM, Platt KA, Brommage R ![]() , Buhring L, Revelli JP, Shadoan MK
, Buhring L, Revelli JP, Shadoan MK
Received 5 October 2021
Accepted for publication 15 December 2021
Published 5 January 2022 Volume 2022:15 Pages 45—58
DOI https://doi.org/10.2147/DMSO.S342799
Checked for plagiarism Yes
Review by Single anonymous peer review
Peer reviewer comments 4
Editor who approved publication: Prof. Dr. Antonio Brunetti
David R Powell,1 Deon D Doree,1 Christopher M DaCosta,1 Kenneth A Platt,2 Robert Brommage,1 Lindsey Buhring,1 Jean-Pierre Revelli,1 Melanie K Shadoan1
1Department of Pharmaceutical Biology, Lexicon Pharmaceuticals, Inc, The Woodlands, TX, USA; 2Department of Molecular Biology, Lexicon Pharmaceuticals, Inc., The Woodlands, TX, USA
Correspondence: David R Powell
Department of Pharmaceutical Biology, Lexicon Pharmaceuticals, Inc., 2445 Technology Forest Boulevard, The Woodlands, TX, 77381, USA
Tel +1 713 249 3972
Fax +1 281 863 8115
Email [email protected]
Purpose: Humans with haploinsufficiency of GPR75, an orphan GPCR, are thin. Gpr75 knockout (KO) mice are also thin with improved glucose homeostasis. We wanted to confirm these findings in Gpr75 KO mice and determine whether decreased energy intake and/or increased energy expenditure contributed to the thin phenotype.
Methods: Gpr75 KO mice were generated by homologous recombination. All studies compared female and male Gpr75 KO mice to their wild type (WT) littermates. Body composition was measured by DXA and QMR technologies. Glucose homeostasis was evaluated by measuring glucose and insulin levels during oral glucose tolerance tests (OGTTs). Food intake was measured in group-housed mice. In singly housed mice, energy expenditure was measured in Oxymax indirect calorimetry chambers, and locomotor activity was measured in Oxymax and Photobeam Activity System chambers.
Results: In all 12 cohorts of adult female or male mice, Gpr75 KO mice had less body fat; pooled data showed that, compared to WT littermates (n = 103), Gpr75 KO mice (n = 118) had 49% less body fat and 4% less LBM (P < 0.001 for each). KO mice also had 8% less body fat at weaning (P < 0.05), and during the month after weaning as the thin phenotype became more exaggerated, Gpr75 KO mice ate significantly less than, but had energy expenditure and activity levels comparable to, their WT littermates. During OGTTs, Gpr75 KO mice showed improved glucose tolerance (glucose AUC 23% lower in females, P < 0.05, and 26% lower in males, P < 0.001), accompanied by significantly decreased insulin levels and significantly increased insulin sensitivity indices.
Conclusion: Gpr75 KO mice are thin at weaning, are hypophagic as the thin phenotype becomes more exaggerated, and exhibit improved glucose tolerance and insulin sensitivity as healthy-appearing adults. These results suggest that inhibiting GPR75 in obese humans may safely decrease energy intake and body fat while improving glucose tolerance and insulin sensitivity.
Keywords: obesity, diabetes, druggable, insulin sensitivity, healthy thinness
Introduction
The obesity pandemic remains a major public health problem. The prevalence of obesity has increased steadily since 1980, and by 2015 107.7 million children and 603.7 million adults worldwide were obese.1 These obesity estimates are based on body-mass index (BMI) data, calculated as weight/height2 (kg/meter2), with obesity defined as BMI ≥ 30. High BMI is a risk factor for many chronic diseases, resulting in a profound health and economic burden.1–4 There is an urgent need for new interventions that safely decrease the amount of body fat in these individuals.
Human obesity is heritable, with the genetic component explaining ~30% of the variability.5,6 Most prior studies focused on identifying genetic variants that increase body fat.7,8 The value in identifying these genetic variants is the potential to predict individual risk for future obesity and the potential to identify targets for therapeutic intervention. Unfortunately, the genetic component of obesity is polygenic with >250 GWAS loci providing minor contributions,5,9–12 and identifying these loci has not resulted in models with acceptable ability to predict obesity risk.13 Also, a few genes with variants that result in severe obesity have been identified,7,8 but to date studying these genes has not led to effective therapeutics for polygenic obesity.
Recent work has focused on large human populations to identify genetic variants associated with healthy thinness.14–16 Similar to human obesity, human thinness is a heritable trait with the genetic component explaining ~28% of the variability; importantly, although both traits share many established BMI variant loci, there are differences suggesting the presence of unique genes associated with thinness.14 Among the findings generated by these recent studies, GPR75 haploinsufficiency provides a particularly striking phenotype of low body fat in otherwise healthy individuals.16 This approach may be more fruitful from the standpoint of drug discovery because inactivating gene mutations resulting in healthy thinness require therapeutics that inhibit the protein product of that gene while inactivating mutations resulting in obesity require activators, and many more proteins and protein families have been targeted successfully by inhibitors than by activators.17–21 In humans and mice, inactivating mutations in at least 18 genes result in a shared obese phenotype.8 These mouse models provide insight into mechanisms behind development of obesity in affected humans. The low body fat reported in Gpr75 knockout (KO) mice16 suggests that this conservation between humans and mice extends to thin phenotypes.
Here, we confirm that adult Gpr75 KO mice are thin. We further show that, relative to their wild type (WT) littermates, male and female Gpr75 KO mice have modestly lower body fat at weaning that progresses rapidly, in association with decreased food intake, to markedly lower body fat and improved glucose homeostasis in healthy-appearing adult mice.
Materials and Methods
Mouse Care and Study
All mouse studies were performed in strict accordance with the recommendations in the Guide for the Care and Use of Laboratory Animals of the National Institutes of Health. The protocols for all studies were approved by the Lexicon Institutional Animal Care and Use Committee (OLAW Assurance Number, A4152-01; AAALAC International Accreditation Number, 001025). General methods for mouse care have been described previously.22–24 Briefly, WT and KO mice were housed together, with a maximum of 5 mice/cage, in a temperature-controlled environment on a fixed 12-hour light/12-hour dark cycle and with free access to food and water. Mice received standard rodent chow 9F 5020 (Purina, St. Louis, MO) as our chow diet and D12451 (Research Diets, New Brunswick, NJ) containing 45% of kcals from fat as our high-fat diet (HFD). Food consumption studies were performed on mice fed HFD, with KO and WT mice housed separately in groups of 2–3 mice/cage.
Generation of Knockout Mice
Our approach to KO and phenotype mouse orthologs of the estimated 5000 potential drug targets in the human genome (Genome 5000TM project) is published.17,18,22,25–29 Gpr75 KO mice were generated by homologous recombination. The Gpr75 targeting vector was derived using long-range PCR to generate the 5ʹand 3ʹ arms of homology using 129S5 ES cell DNA as a template. The 3181 bp 5ʹ arm was generated using primers Gpr75-29 (BamHI) [5ʹ-TACTAGGATCCAAGAATTAGTATGGAGCTCTGGGTTG-3ʹ] and Gpr75-55 (AscI) [5ʹ-TACTAGGCGCGCCTCTCAGCTCACAGACGACGAGCATGTGC-3ʹ] and cloned using the TOPO (Invitrogen) cloning kit. The 5030 bp 3ʹ arm was generated using primers Gpr75-42 (AscI) [5ʹ-TACTAGGCGCGCCTGGCCAGCGAGTCTGGAGGGAATGGTTT-3ʹ] and Gpr75-49 (EcoRI) [5ʹ-TACTAGAATTCCAACAGTAGTAGCAACGTGAAGACCCAGC-3ʹ] and cloned using the TOPO cloning kit. The 5ʹ arm was excised from the holding plasmid using BamHI and AscI. The 3ʹ arm was excised from the holding plasmid using AscI and EcoRI. The arms were ligated to an AscI prepared selection cassette containing a Beta-galactosidase-Neomycin/Puromycin marker and inserted into a BamHI/EcoRI cut pKO Scrambler vector (Stratagene) to complete the Gpr75 targeting vector which results in the deletion of the single coding exon 2. The NotI linearized targeting vector was electroporated into 129S5 (Lex-2) ES cells. G418/FIAU resistant ES cell clones were isolated, and correctly targeted clones were identified and confirmed by Southern analysis using a 590 bp 5ʹ internal probe (10/11), generated by PCR using primers Gpr75-10 [5ʹ-CAGTCCACAGTCAATGCAAC-3ʹ] and Gpr75-11 [5ʹ-GTGTGTTGTTCTAGCTGCTG-3ʹ], and a 402 bp 3ʹ external probe (12/13), amplified by PCR using primers Gpr75-12 [5ʹ-GGAGGTAATTATTTCTGCCTG-3ʹ] and Gpr75-13 [5ʹ-CACCTGAAGGACAATTTAACTC-3ʹ]. Southern analysis using probe 10/11 detected a 13.3 Kb WT band and 3.9 Kb mutant band in EcoRI digested genomic DNA while probe 12/13 detected a 13.3 Kb WT band and 10.4 Kb mutant band in EcoRI digested genomic DNA. Four targeted ES cell clones were identified and two microinjected into C57BL/6J-Tyrc-Brd blastocysts to generate chimeric males which were then bred to C57BL/6J-Tyrc-Brd females to generate F1 heterozygous (HET) progeny. These HET mice were intercrossed to generate F2 WT, HET and KO (homozygous mutant) offspring which were then studied in our high-throughput primary phenotypic screen and in all additional studies. All mice reported here were on a C57BL/6J-Tyrc-Brd X 129SvEvBrd hybrid background and in all studies, KO mice were compared directly with their WT littermates. Genotyping at the Gpr75 locus was performed by screening DNA from tail biopsy samples using quantitative PCR for the Neo cassette, as described previously.30
Primary High-Throughput Screen
As part of Lexicon’s Genome5000TM program to KO and phenotype the druggable mouse genome, adult WT and KO mice were evaluated by a comprehensive battery of phenotype screening assays as described previously.25,28,31 Included in this high-throughput screen (HTS) protocol were assays evaluating body composition, oral glucose tolerance, and serum chemistries. Two cohorts of mice were studied in the HTS. The chow cohort, fed chow diet from weaning, usually consisted of 4 WT, 4 HET and 8 KO mice, half male and half female, for each project. The HFD cohort, fed HFD from weaning, consisted of up to 8 WT and 8 KO male mice for each project.
Body composition was analyzed on both HTS mouse cohorts. At 14 weeks of age, the cohort of chow-fed mice was screened, usually by dual-energy X-ray absorptiometry (DXA) using a GE/Lunar PIXImus scanner (GE Medical Systems, Madison, WI) but occasionally by Bruker Minispec QMR Analyzer (ECHO Medical Systems, Houston, TX), as described previously.8,22,32 Briefly, for each KO line, mean KO % body fat/mean WT littermate % body fat was calculated for both male and female mice, and then these male and female values were averaged and multiplied x100, yielding a normalized % body fat (n%BF) value. For most KO lines, 4 male KO, 2 male WT, 4 female KO and 2 female WT mice were analyzed. KO lines with fewer than 4 KO or 3 WT mice were excluded, except for X-linked lines where only male data were used, usually from 8 KO and 2 WT mice. The separate cohort of HFD-fed male mice was screened at 11 weeks of age by Bruker Minispec QMR Analyzer as described previously;32 all lines with between 3 and 8 KO mice and between 3 and 8 WT littermate controls were included in the analysis. The n%BF for each line was calculated as described above for the chow-fed cohort.
Oral glucose tolerance tests (OGTTs) were also performed on both HTS mouse cohorts after an overnight fast, as described previously.32 Briefly, OGTTs were routinely performed on the 2 WT and 4 KO male mice from the chow-fed cohort at 14 weeks of age; all HTS cohorts with at least 3 KO mice studied are included in the present analysis. Blood glucose levels obtained at baseline (fasting) and at 30, 60 and 90 minutes after receiving 2 g/kg glucose by oral gavage were then used to calculate a glucose area under the curve (AUC) value. For each individual KO line analyzed, the mean glucose AUC of the KO mice was divided by the mean glucose AUC of the OGTTs performed on all 6039 WT mice pooled from the 2987 KO lines studied, yielding a normalized glucose AUC value for each KO line.32 For the separate cohort of HFD-fed mice, 3–4 WT and 3–6 KO mice underwent an OGTT at 11 weeks of age which was performed as described above except blood glucose levels measured at 30 and 60 minutes after oral glucose challenge were used to calculate glucose AUCs. For each of the 2490 KO lines analyzed, the mean glucose AUC of the KO mice was divided by the mean glucose AUC of the OGTTs performed on all 9306 WT mice pooled from the 2490 KO lines studied, yielding a normalized glucose AUC value for each KO line.
As part of the HTS, retroorbital blood was obtained in the fed state from 15-week-old conscious, unanesthetized male and female Gpr75 KO and WT mice fed chow diet from weaning. Serum was assayed for glucose, lipids and other analytes by Cobas Integra 400 analyzer (Roche Diagnostics, Indianapolis, IN) as described previously.25,33
Additional Cohorts
Additional cohorts of Gpr75 KO and WT littermate mice were studied to confirm the HTS body fat and OGTT findings. Body composition was studied using QMR technology as described above; in some of these studies, normalized body weight, body fat, % body fat, and lean body mass (LBM) were calculated exactly as described above for n%BF. Confirmatory OGTT studies, and additional phenotyping assays, were performed on additional cohorts using the methods described below.
OGTTs
OGTTs were performed on conscious, unanesthetized KO and WT mice from additional cohorts. After an overnight fast, mice were bled at baseline and then received 2 g/kg glucose by oral gavage. Glucose levels from each mouse, obtained on whole blood samples at 0 (baseline), 30, 60, 90 and/or 120 minutes using an ACCU-CHEK Aviva glucometer (Roche, Indianapolis, IN), were used to calculate glucose AUC values which were then analyzed statistically. Two additional serum aliquots obtained at 0 (baseline) and 30 minutes were used to measure insulin levels (Ultra-Sensitive Rat Insulin ELISA Kit, Cat. 90060; Crystal Chem, Downers Grove, IL). The homeostatic model assessment (HOMA) insulin sensitivity index34 and the composite insulin sensitivity index35 were calculated using the OGTT glucose and insulin data for each mouse.
Indirect Calorimetry and Activity Measurements
Oxygen consumption (VO2), respiratory exchange ratio (RER), energy expenditure and ambulatory activity were measured using the Oxymax indirect calorimetry system (Oxymax, Columbus Instruments, Columbus, OH).8,32,36 Briefly, mice were individually housed in one of four Oxymax chambers starting at 4 pm of the first day, and after a 4-hour acclimation period, mouse VO2, RER, energy expenditure and activity were measured over 10-minute increments for two full 12-hour dark cycles and one full 12-hour light cycle.
Circadian locomotor activity was measured using a San Diego Instruments cage rack Photobeam Activity System (PAS-Home Cage, San Diego Instruments, San Diego, CA); the circadian chambers measured 48.2 cm x 26.5 cm and allowed free access to food and water. Over 27 days, mice were tested over 22 full 12-hour dark cycles and 19 full 12-hour light cycles. Activity was recorded in one-hour intervals throughout testing. Total activity for each 12-hour cycle was calculated, and effect of genotype was determined for each dark and light cycle.
Statistics
Data are presented as mean ± SD. Comparisons between two groups were analyzed by unpaired Student’s t test; when variances between the two groups were significantly different, the data were analyzed using the nonparametric Mann–Whitney test. All statistical tests were performed using PRISM 4.03 (GraphPad Software, Inc., La Jolla, CA, USA). Differences were considered statistically significant when P<0.05.
Results
The mouse Gpr75 gene consists of 2 exons, with the entire protein coding sequence confined to exon 2, which was targeted by homologous recombination to generate Gpr75 KO mice (Supplementary Figure 1). At weaning, the Gpr75 KO line showed a normal Mendelian distribution of 170 WT, 351 HET and 181 KO mice.
Our HTS evaluated body composition of cohorts from 3650 KO lines fed chow diet from weaning and of independent cohorts from 2490 KO lines fed HFD from weaning. Figure 1A shows that, among the % body fat values from all chow fed KO lines, mean Gpr75 KO values were more than 1 SD below the population mean and Gpr75 HET values were intermediate between the Gpr75 KO and population mean values. Figure 1B shows that, among the % body fat values from all HFD fed KO lines, Gpr75 KO values were more than 2 SD below the population mean and were among the lowest values observed in this screen. Our HTS also evaluated OGTTs in the cohorts from 2987 of the chow-fed KO lines and from all 2490 of the HFD-fed KO lines. Figure 1C shows that, among the glucose AUC values from all studied chow-fed KO lines, the mean Gpr75 KO value was almost 2 SD below the population mean. Figure 1D shows that, among the glucose AUC values from all the HFD-fed KO lines, the mean Gpr75 KO value was 1 SD below the population mean.
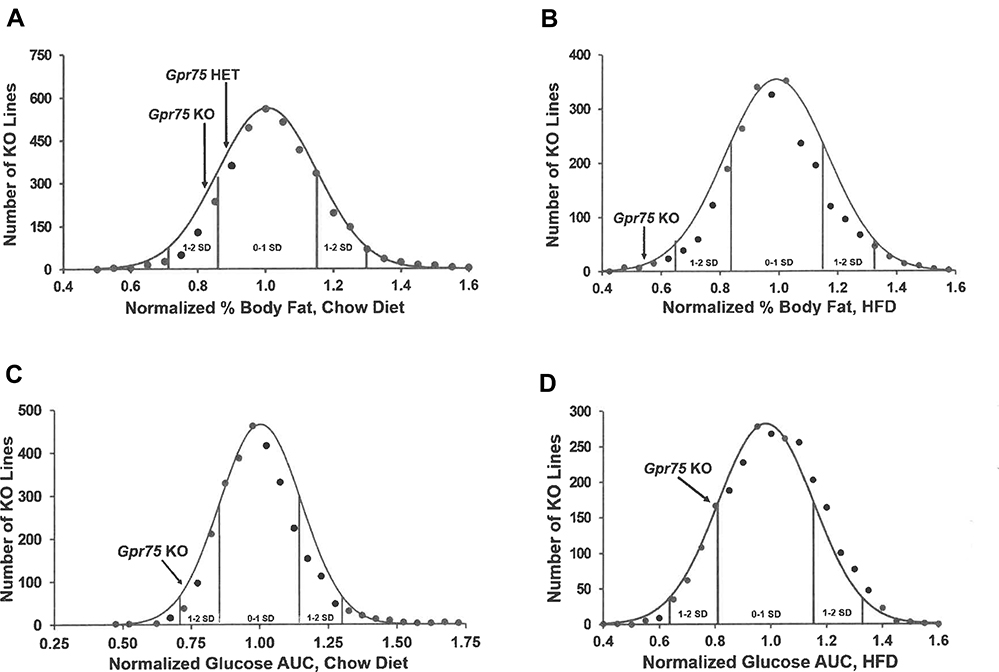 |
Figure 1 Gpr75 KO mice had low body fat and improved glucose tolerance in our high-throughput screen (HTS). (A) Histogram of normalized % body fat (n%BF) values for the 3650 KO lines maintained on chow diet that were included in our HTS. Body composition analyses performed by DXA on 14-week-old mice were used to calculate n%BF for the cohort from each individual KO line. Solid points indicate actual numbers of KO lines within that mean ± 2.5% value of n%BF. Curved line shows the calculated curve. The range for 1 and 2 SD from the population mean is indicated by lines located below the curve, and the mean n%BF values for the Gpr75 KO and HET mice from the HTS cohort are indicated by arrows above the curve. (B) Histogram of n%BF values for the 2488 KO lines maintained on HFD that were included in our HTS. Body composition analyses performed by QMR on 11-week-old mice were used to calculate n%BF for the cohort from each individual KO line. The histogram is organized as in (A) above. (C) Histogram of normalized glucose AUC values calculated from OGTTs performed on 11-week-old mice from 2987 of the chow fed cohorts evaluated in our HTS. The histogram is organized as in (A) above. (D) Histogram of normalized glucose AUC values calculated from OGTTs performed on 14-week-old mice from all 2490 of the HFD cohorts evaluated in our HTS. The histogram is organized as in (A) above. |
Additional cohorts of Gpr75 KO and WT mice confirmed the HTS body fat phenotype. Body composition data for each individual cohort of adult mice are presented in Supplementary Table 1. These data were then normalized such that the mean value for each parameter in individual cohorts of WT male or female mice was assigned a value of 100%, which allows data to be pooled by minimizing between-cohort variability resulting from differences in age, sex and intake of dietary fat. When data pooled from all adult KO and all adult WT mice were compared, Gpr75 KO mice showed significant decreases of 17% in body weight, 49% in body fat, 39% in % body fat and 4% in LBM relative to their WT littermates (Figure 2A–D, Table 1). A highly significant decrease in body fat and % body fat was present in adult male and female Gpr75 KO mice fed either chow or HFD from weaning (Table 1), and in every cohort of adult male and female mice studied, body fat and % body fat values were lower in Gpr75 KO mice relative to their WT littermates (Supplementary Table 1).
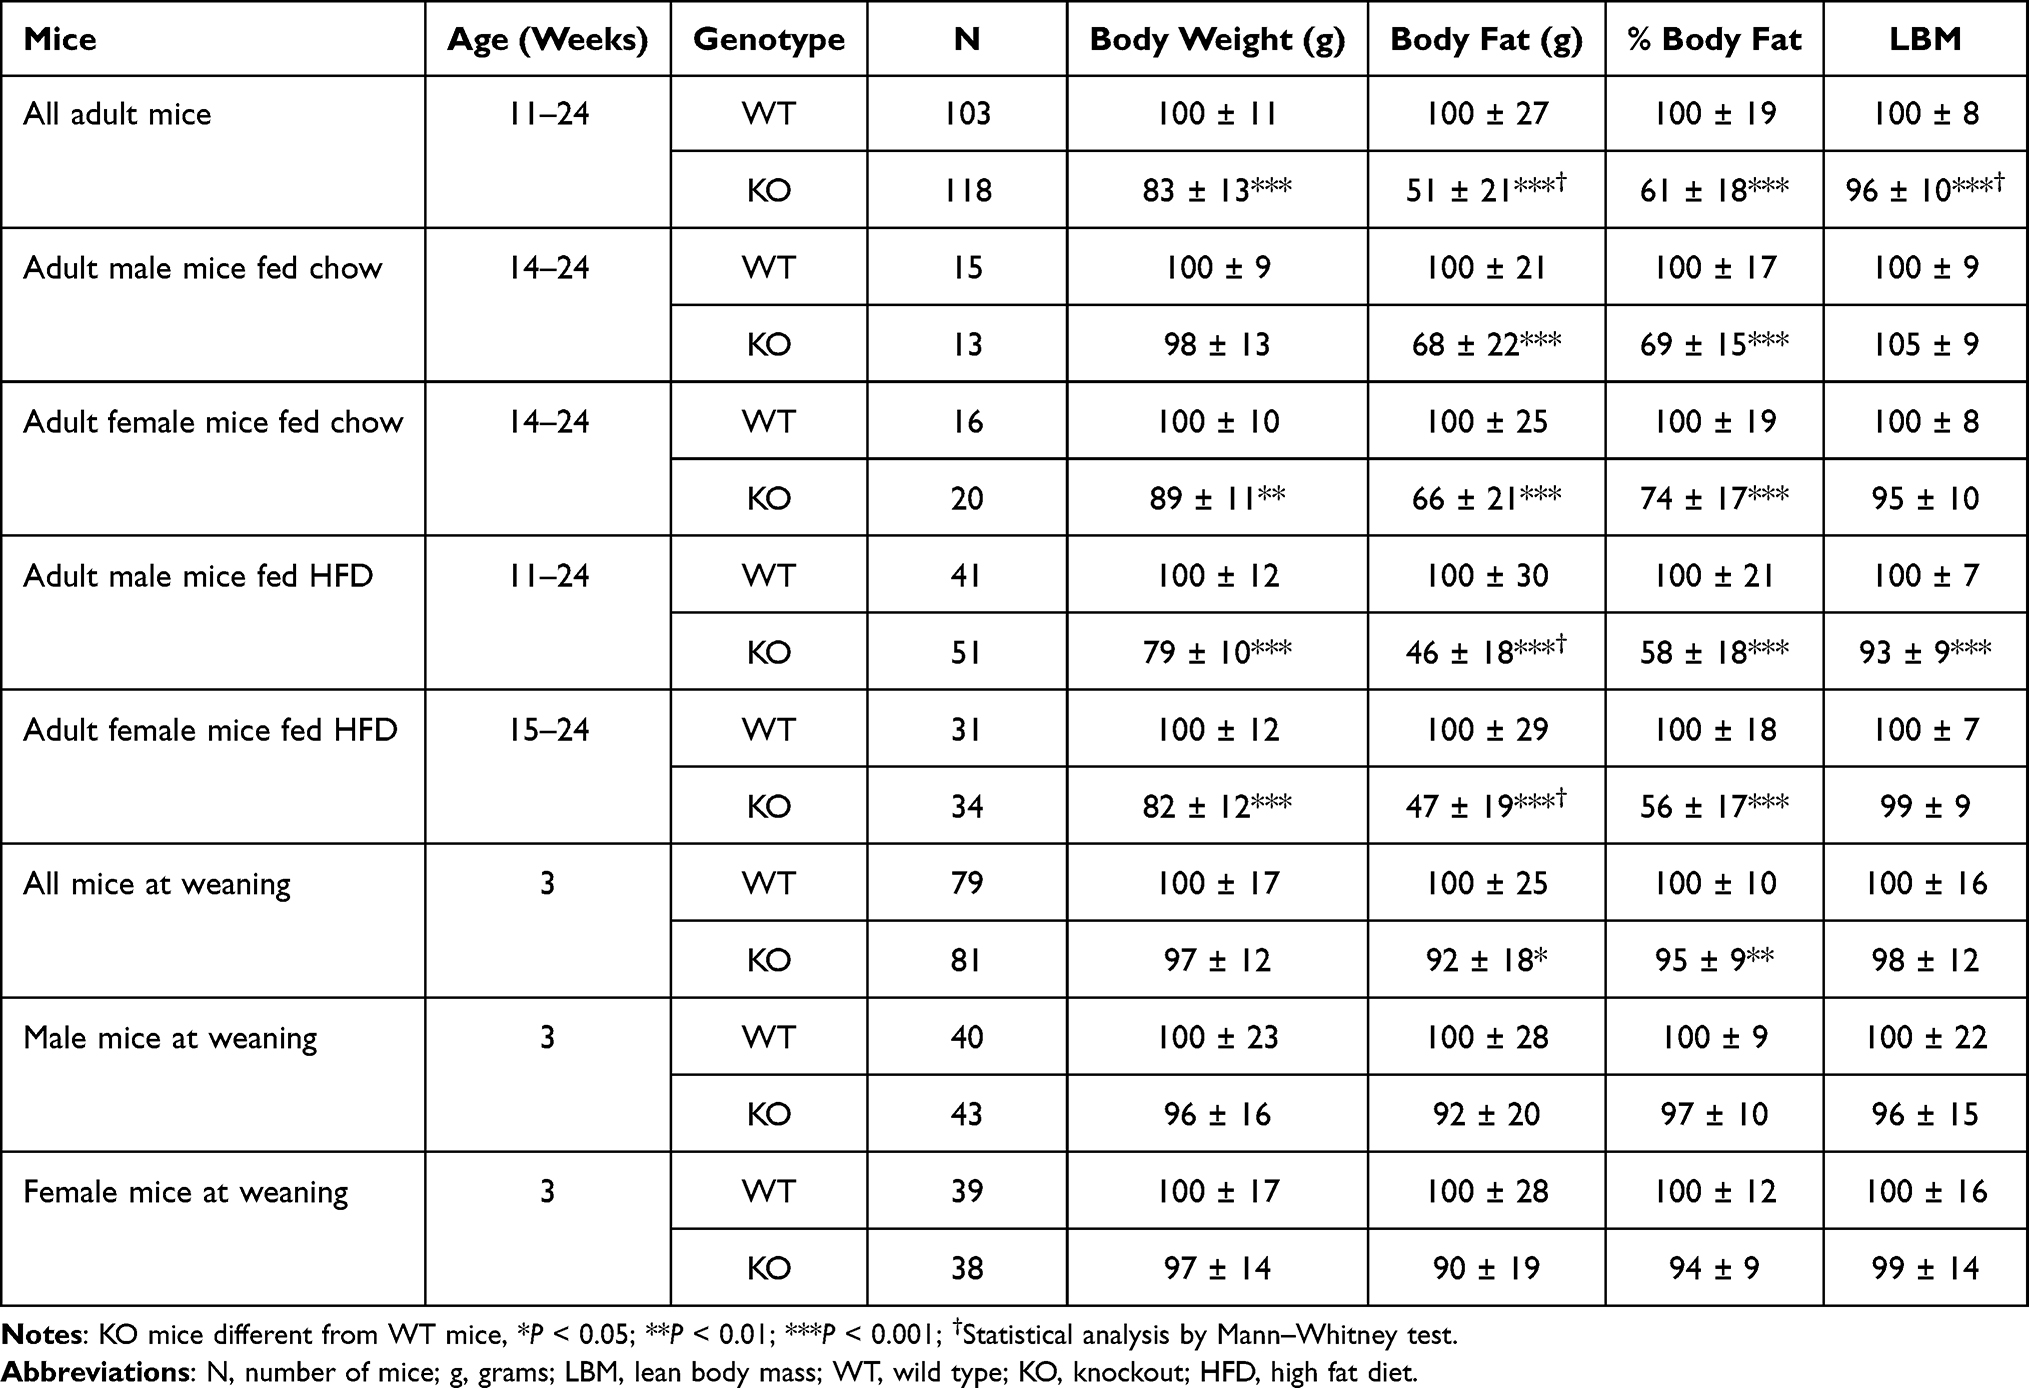 |
Table 1 Normalized Body Composition Data for Gpr75 KO Mice |
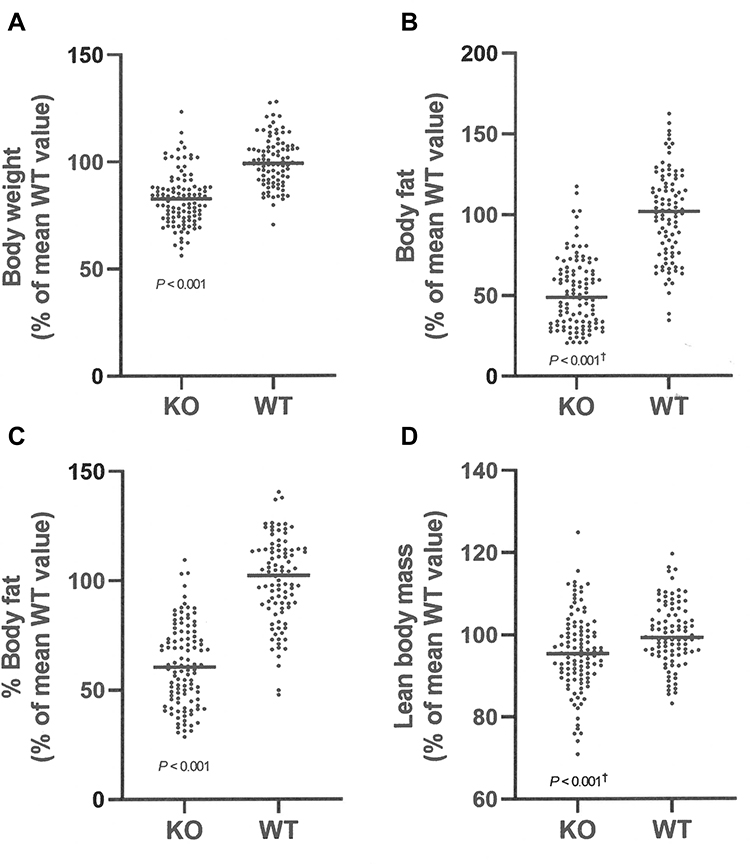 |
Figure 2 Body composition of Gpr75 KO mice and their WT littermates. (A) Body composition data were normalized and combined from all 118 Gpr75 KO mice (54 female, 64 male) and all 103 WT littermate mice (47 female, 56 male) that were weighed and analyzed by QMR at 11–24 weeks of age (Supplementary Table 1). (A) body weight; (B) body fat; (C) % body fat; and (D) lean body mass. †Statistical analysis by Mann–Whitney test. |
At weaning, Gpr75 KO mice had modestly lower body fat relative to WT littermates (Table 1). Differences in body fat rapidly increased during the first few weeks after cohorts of Gpr75 KO and WT male (Figure 3A) and female (Figure 3B) mice were weaned onto HFD. An independent cohort of Gpr75 KO and WT mice were studied for energy expenditure and activity levels during the first 4 weeks after weaning onto HFD. During this 4-week period, Gpr75 KO mice gained less body weight (Figure 4A) and body fat (Figure 4B) than their WT littermates. The mice were individually housed for the entire 4 weeks, primarily in cages that measured circadian locomotor activity, where KO and WT mice showed comparable activity levels during both the dark and light cycles, either when the data were analyzed on each individual day (Supplementary Table 2) or as daily levels averaged over the entire study (Figure 4C and D). Indirect calorimetry studies performed on male mice from this cohort during this time interval confirmed the comparable activity levels of Gpr75 KO and WT mice and also showed that VO2, RER and energy expenditure were similar between KO and WT littermates during the dark and light cycles (Figure 5). Food intake was studied for 1 week in another independent cohort of Gpr75 KO and WT mice beginning a few days after weaning. Both male and female Gpr75 KO mice gained less weight and body fat than their WT littermates during this week, accompanied by decreased food intake during each measurement interval (Figure 6). Because changes were comparable for both male and female mice during this 1-week study, their data were pooled, revealing significantly decreased weight gain (Figure 7A), body fat accumulation (Figure 7B) and total food intake (Figure 7C) by Gpr75 KO mice relative to their WT littermates.
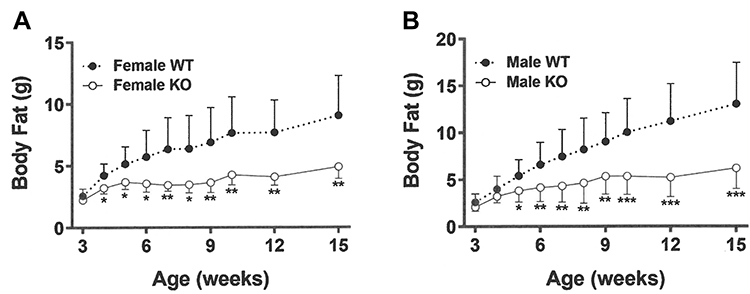 |
Figure 3 Gpr75 KO mice exhibit low body fat early in life: time course data. Body fat was measured by QMR at multiple timepoints between 3 weeks of age (weaning) and 15 weeks of age on HFD-fed (A) female Gpr75 KO mice (n=7) and their WT littermates (n=11), and (B) male Gpr75 KO mice (n=12) and their WT littermates (n=10). KO mice different from WT mice of the same age and sex, *P < 0.05, **P < 0.01, ***P < 0.001. |
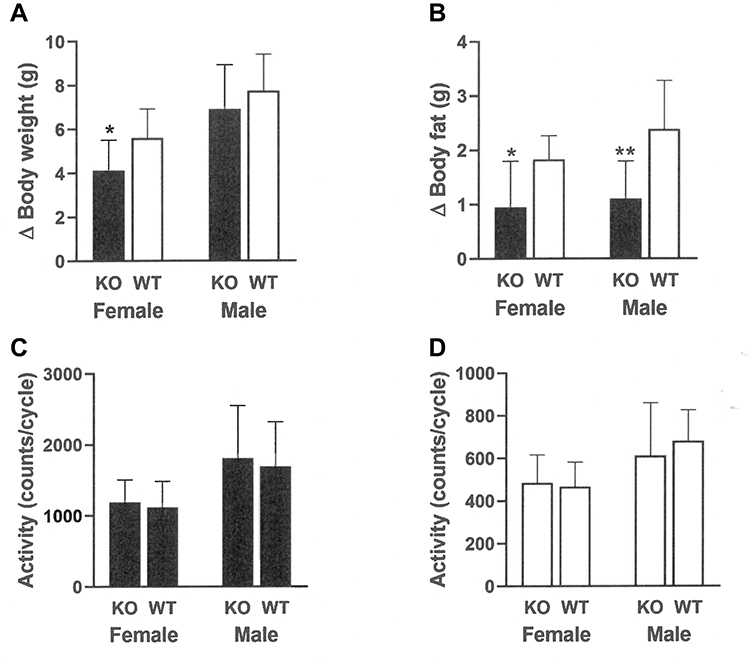 |
Figure 4 Gpr75 KO and WT mice exhibit comparable activity early in life as low body fat phenotype is developing. Individually housed Gpr75 KO (9 female, 9 male) and WT (9 female, 9 male) mice were studied for 27 days starting immediately after weaning onto HFD. Change (∆) in (A) body weight and (B) body fat during this 27-day interval. Mean 12-hour (C) dark cycle and (D) light cycle circadian locomotor activity levels in all mice over this 27-day period, based on data from 22 full 12-hour dark cycles and 19 full 12-hour light cycles. KO mice different from WT mice of the same age and sex, *P < 0.05, **P < 0.01. |
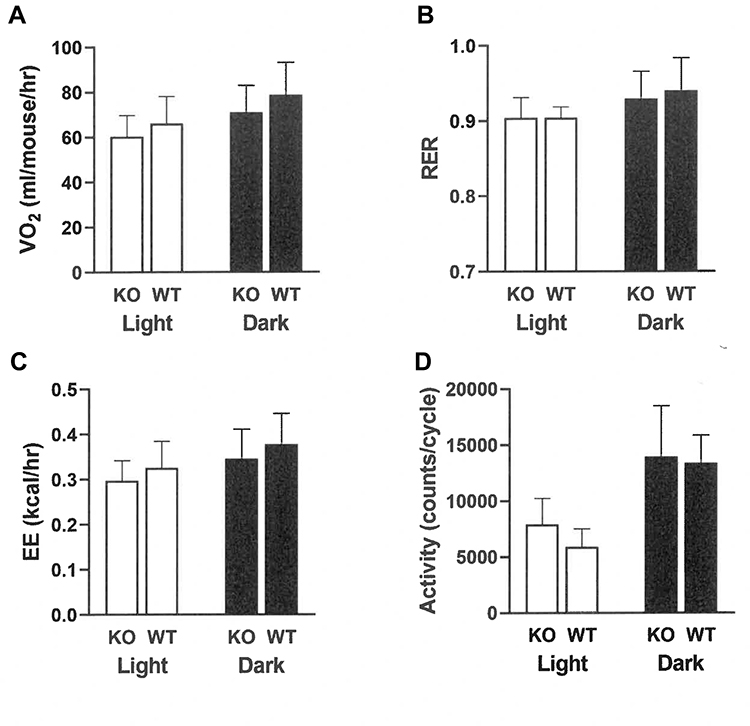 |
Figure 5 Gpr75 KO and WT mice exhibit comparable energy expenditure and activity levels early in life as low body fat phenotype is developing. Individually housed Gpr75 KO (8 male) and WT (8 male) mice were studied in Oxymax indirect calorimetry chambers for two full 12-hour dark cycles and one full 12-hour light cycle during the 27-day interval starting immediately after weaning onto HFD. Parameters measured include (A) Oxygen consumption (VO2), (B) respiratory exchange ratio (RER), (C) energy expenditure (EE), and (D) activity levels. |
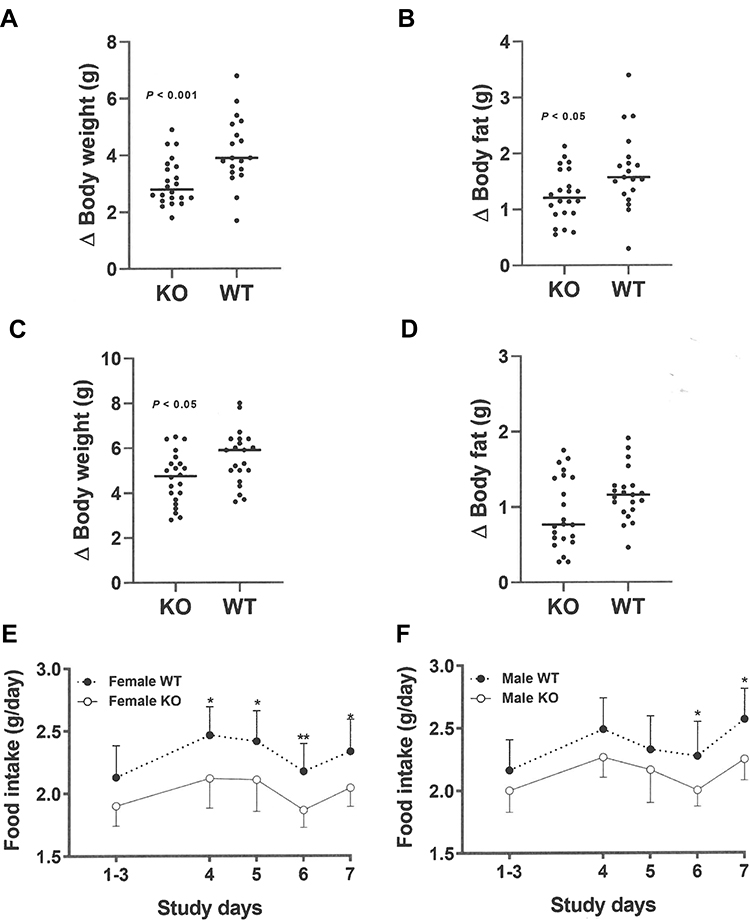 |
Figure 6 Decreased food intake by female and male Gpr75 KO mice early in life as low body fat phenotype is developing. Gpr75 KO mice (22 female, 22 male) and WT mice (19 female, 21 male) group housed by sex and genotype (2–3 mice/cage) were studied for 7 days starting immediately after weaning onto HFD. Change (∆) in (A) female body weight, (B) female body fat, (C) male body weight, and (D) male body fat over these 7 days. Daily food intake in grams (g) for female (E) and male (F) mice during the 5 intervals where food intake was measured, calculated as mean food intake/mouse for each cage of group-housed KO mice (16 cages, 8 female and 8 male) and WT mice (14 cages, 7 female and 7 male). KO mice different from WT mice, *P < 0.05, **P < 0.01. |
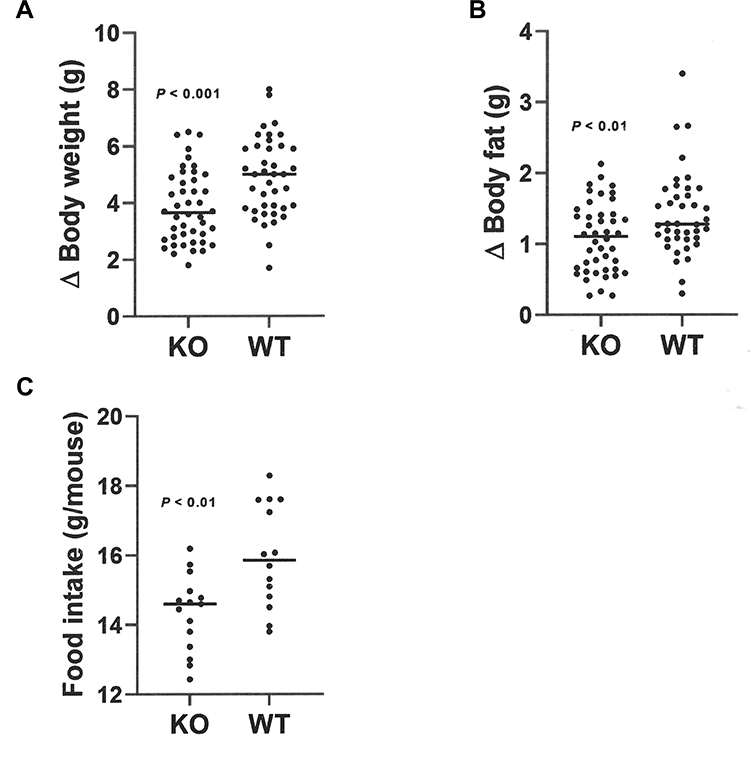 |
Figure 7 Decreased food intake by Gpr75 KO mice early in life as low body fat phenotype is developing: pooled female and male data. Gpr75 KO mice (22 female, 22 male) and WT mice (19 female, 21 male) were group housed by sex and genotype (2–3 mice/cage) and then studied for 7 days starting immediately after weaning onto HFD. Change (∆) in (A) body weight and (B) body fat during this 7-day interval. (C) Mean food intake in grams (g) during this 7-day interval, calculated as mean food intake/mouse for each cage of group-housed KO mice (16 cages, 8 female and 8 male) and WT mice (14 cages, 7 female and 7 male). |
OGTTs performed in mice at 9 weeks of age showed comparable glucose and insulin responses in Gpr75 KO and WT mice (Supplementary Figure 2), but in male and female mice studied at 24–36 weeks of age, Gpr75 KO mice had lower glucose excursions, fasting insulin levels and 30-minute insulin levels, accompanied by increased insulin sensitivity indices, relative to their WT littermates (Figure 8). Fasting glucose levels were also lower in male KO mice (KO = 71 ± 14 vs WT = 94 ± 28 mg/dL, P < 0.001 by Mann-Whitney test) but not in female KO mice (KO = 59 ± 15 vs WT = 62 ± 11 mg/dL).
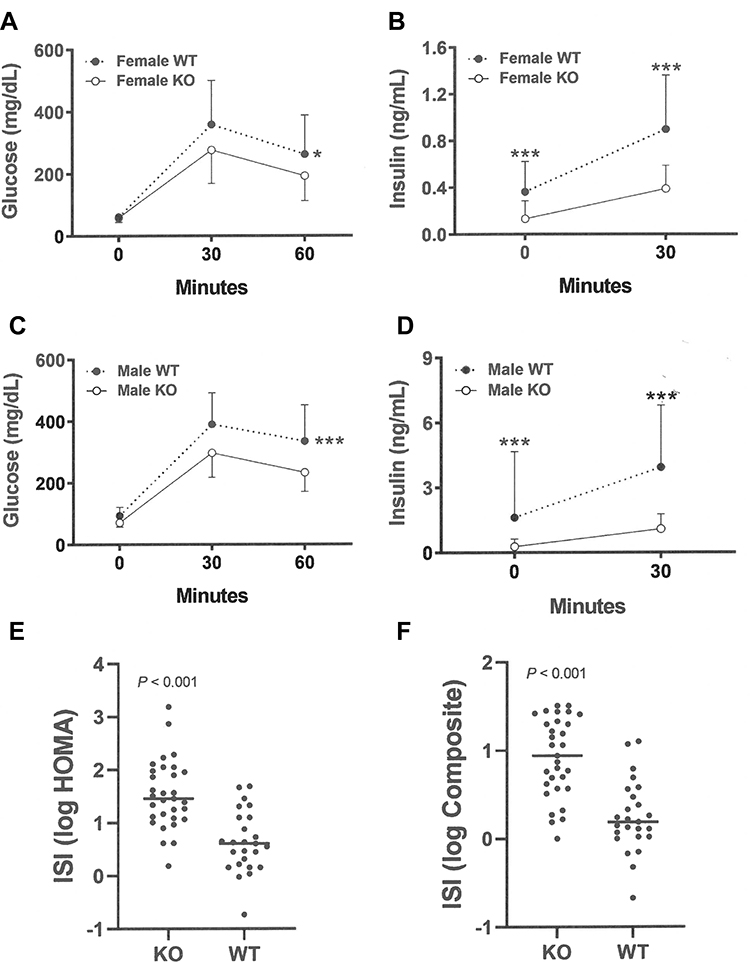 |
Figure 8 Improved glucose homeostasis in adult Gpr75 KO mice. (A) Glucose excursions, and (B) 0-minute and 30-minute insulin levels, from OGTTs performed on HFD-fed female Gpr75 KO mice (n=28) and their WT littermates (n=20) at 24–30 weeks of age. (C) Glucose excursions, and (D) 0-minute and 30-minute insulin levels, from OGTTs performed on HFD-fed male Gpr75 KO mice (n=31) and their WT littermates (n=25) at 24–36 weeks of age. Log-transformed (E) HOMA and (F) composite insulin sensitivity index (ISI) values for all mice; higher ISI values indicate increased insulin sensitivity. KO mice different from WT mice, *P < 0.05, ***P < 0.001. |
Additional relevant data were collected on chow-fed mice at 15 weeks of age as part of the HTS. Levels of all blood chemistry analytes were comparable between Gpr75 KO and WT mice except for triglyceride levels that were significantly lower in the KO mice relative to their WT littermates (Table 2). Gpr75 KO and WT mice also had comparable body length (KO 9.7 ± 0.6 cm, n = 8 vs WT 9.4 ± 0.3 cm, n = 4), hemoglobin (KO 15 ± 1.2 g/dL, n = 8 vs WT 15.6 ± 0.7 g/dL, n = 4), and hematocrit (KO 43 ± 3%, n = 8 vs WT 45 ± 2%, n = 4).
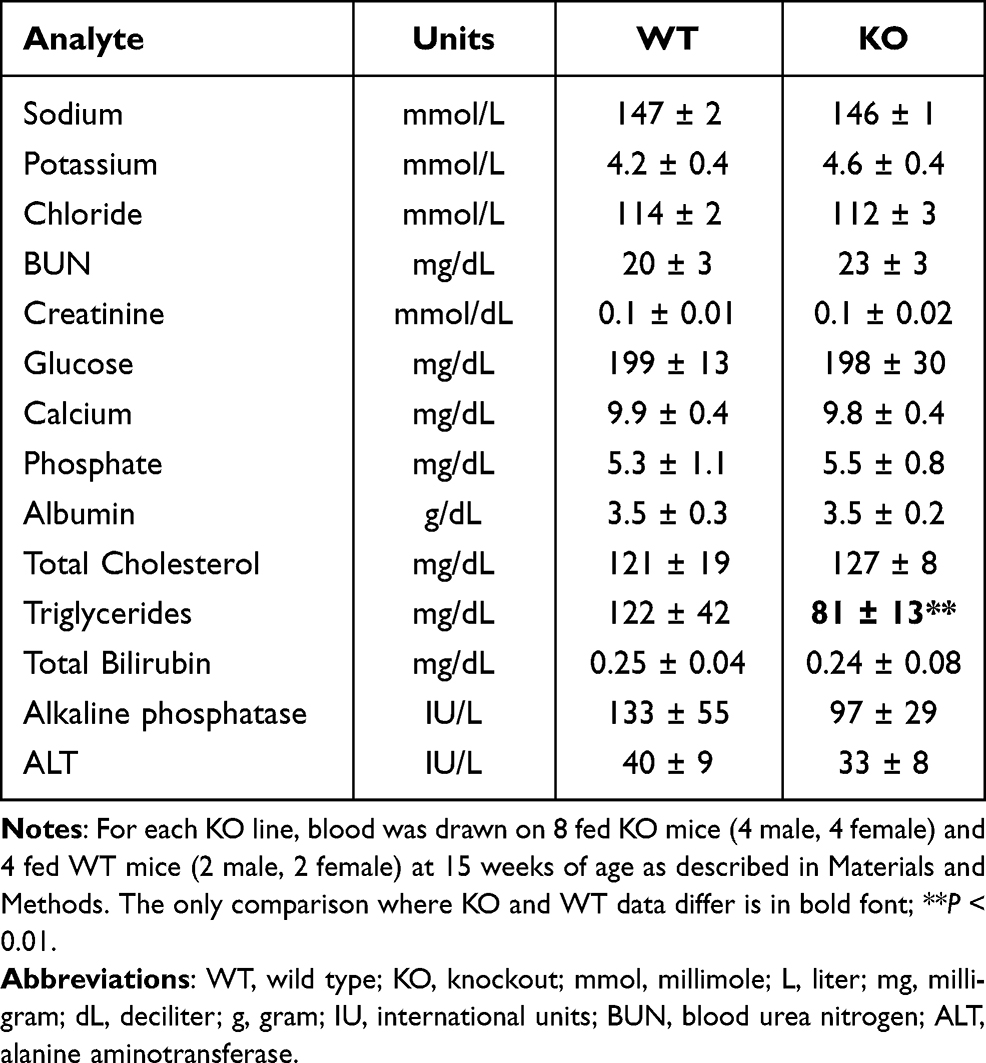 |
Table 2 Serum Chemistries of Gpr75 KO Mice and Their WT Littermates |
Discussion
Gpr75 KO mice were among the thinnest KO mice identified in our HTS, with Gpr75 HET mice exhibiting an intermediate phenotype. Studies of additional cohorts of Gpr75 KO and WT mice confirmed our HTS data and the published thin phenotype of Gpr75 KO mice.16 Gpr75 KO mice were thin at weaning and the difference in body fat between KO and WT mice increased rapidly over the next few weeks in both females and males. Adult Gpr75 KO mice were among the thinnest mice that we examined with additional cohorts; relative to WT littermates, their body fat was lower than that observed in Fads1, Plin1, Mchr1, Pip4k2b and Gpam KO mice and comparable to that observed in Dagla, Cnr1, Ptpn1 and Scd1 KO mice.22,37,38 The relative strength of the thin phenotype in Gpr75 KO mice is consistent with the observation that, among rare nonsynonymous human gene variants associated with decreased BMI, GPR75 variants were associated with much lower BMI than were variants in other genes; haploinsufficiency was estimated to lower body weight by 5.3 kg for GPR75 and by only 1.3 kg for GIPR, which had the second strongest thin phenotype.16 The central location of GPR75 among a large cluster of BMI variants on chromosome 2 further suggests a role for this gene in regulating body fat (https://hugeamp.org/, accessed on 12/5/2021). Studies of the genetic architecture of human obesity and thinness suggest that the BMI of severely obese individuals deviates significantly more from the mean than does the BMI of healthy thin individuals, perhaps because the same degree of thinness may not be compatible with healthy human life;14 the distribution of body fat values among our Gpr75 KO and WT mice support this observation, with KO mice showing an attenuated distribution of extremely low body fat values relative to those of their WT littermates. This observation suggests the possibility that GPR75 inhibition might result in even greater weight loss in severely obese individuals.
Early in life as their thin phenotype developed, Gpr75 KO mice ate less than their WT littermates but had comparable activity levels, oxygen consumption, and energy expenditure, suggesting that Gpr75 KO mice were thin due to differences in energy intake rather than energy expenditure. These data, along with the association of increased energy intake and obesity in mice and humans with inactivating mutations in 18 monogenic obesity genes8 and with the likelihood that the obesity pandemic is driven primarily by increased energy intake,5,39 support the idea that mammalian body fat stores are regulated mainly by energy intake and suggest that GPR75 may play a role in this process. GPR75 is expressed primarily in CNS and not adipose or other tissues in humans (https://gtexportal.org/home/) and mice,40 further suggesting that GPR75 influences body composition by regulating energy balance and not by regulating another process such as adipogenesis.
DAGLA and CNR1 are protein members of the endocannabinoid pathway that regulates food intake, other metabolic parameters and some emotional behaviors.38 The phenotype of Cnr1 KO mice predicted the ability of the CNR1 inverse agonist rimonabant to lower body weight, body fat, and levels of hemoglobin A1c, insulin, cholesterol and triglycerides in mice and humans.38,41,42 These observations provide precedent for the ability of a thin KO phenotype to predict that a drug targeting the protein product of the inactivated gene can reproduce that thin phenotype in humans and suggest that GPR75 inhibition may not only lower body fat but also improve other metabolic parameters. This possibility is obviously strengthened by the fact that humans with GPR75 haploinsufficiency are thin;16 to our knowledge, no data are available on humans with CNR1 haploinsufficiency. Although rimonabant improved several metabolic outcomes, treatment with this compound was associated with affective disturbances such as depression and anxiety that rendered it unsuitable for routine clinical use.38,41,43 The fact that FADS1, DAGLA and CNR1 can be linked to the same endocannabinoid pathway likely explains the limited effort to target FADS1 and DAGLA for metabolic indications.37,38 To date, there are no published data linking GPR75 to this pathway.
We investigated food intake based on past studies of Dagla and Cnr1 KO mice, where food intake was significantly lower immediately post-weaning while these KO mice were becoming thin, but was not lower in older adult Dagla and Cnr1 KO mice when the thin phenotype was established.38 The Dagla and Cnr1 KO mice remained thin as older adults likely because they were not hyperphagic and thus were not compensating for their earlier hypophagia. These data are consistent with the effects of the CNR1 inverse agonist rimonabant on food intake and body fat in WT mice; rimonabant treatment reduced food intake strongly in the first two weeks of administration as the mice became thin, but food intake in treated mice approached control levels after 2 weeks of treatment when the thin phenotype was established and not becoming more exaggerated.44 These data suggest that studies of the mechanism responsible for thinness in KO mice should be performed while the mice are becoming thin.
OGTTs performed on adult Gpr75 KO and WT mice fed HFD from weaning revealed improved glucose tolerance and lower insulin levels in KO mice, confirming published data.16 These data were used to calculate HOMA and composite insulin sensitivity indices,34,35 which suggested that insulin sensitivity was improved markedly in both male and female KO mice. Improved glucose homeostasis observed in female Gpr75 KO mice was not observed in female Fads1 KO mice,37 or in female Dagla KO mice where the deficit in body fat was comparable to that of female Gpr75 KO mice.38 Although the rarity of human GPR75 nonsynonymous variants precluded linking them to significantly lower risk for type 2 diabetes (T2D),16 the lower insulin levels and increased insulin sensitivity of Gpr75 KO mice suggests that GPR75 inhibition may provide a new treatment for T2D and other conditions associated with insulin hypersecretion and resistance.
Hypophagia and low body fat are common findings in many disease states, often associated with decreased body length and LBM.8,45 Our Gpr75 KO mice appeared healthy, and our HTS did not identify any abnormalities that suggest the hypophagia was caused by an underlying chronic disease state. The lower body weight of Gpr75 KO mice was due primarily to lower body fat rather than lower LBM, and their body length appeared normal, both consistent with healthy mice. Hemoglobin, hematocrit and albumin levels are often decreased in chronic disease states but were comparable between KO and WT mice, and serum chemistries provided evidence for normal liver and kidney function. The lower triglyceride levels, rather than suggesting a chronic illness, suggest instead that Gpr75 deficiency may have a beneficial effect on dyslipidemia.
GPR75 is a constitutively active orphan GPCR that couples to Gi1 and β-arrestin.46–48 Past studies proposed RANTES and 20-HETE as ligands for GPR75 but additional studies failed to support these findings.46,47 A better understanding of how GPR75 regulates energy balance requires characterizing the GPR75 CNS expression pattern, determining the specific brain regions, nuclei and neurons where GPR75 is active, and identifying ligands and/or intracellular proteins that interact with this GPCR.
Conclusion
GPR75 deficiency results in healthy thinness in mice. Gpr75 KO mice are thin at weaning, and both male and female KO mice are hypophagic as the low body fat phenotype becomes more exaggerated. As adults, male and female Gpr75 KO mice appear healthy and exhibit improved glucose tolerance and insulin sensitivity. These results suggest that inhibiting GPR75 in humans will decrease energy intake and body fat stores while improving glucose tolerance and insulin sensitivity.
Disclosure
All authors were employed by Lexicon Pharmaceuticals, Inc., at the time these studies were performed and may own common stock or may have been granted stock options or other equity incentive awards. The authors report no other conflicts of interest in this work.
References
1. Afshin A, Forouzanfar MH, Reitsma MB, et al. Health effects of overweight and obesity in 195 countries over 25 years. N Engl J Med. 2017;377:13–27.
2. Bhupathiraju SN, Hu FB. Epidemiology of obesity and diabetes and their cardiovascular complications. Circ Res. 2016;118:1723–1735. doi:10.1161/CIRCRESAHA.115.306825
3. Tremmel M, Gerdtham UG, Nilsson PM, Saha S. Economic burden of obesity: a systematic literature review. Int J Environ Res Public Health. 2017;14:435. doi:10.3390/ijerph14040435
4. Pillon NJ, Loos RJF, Marshall SM, Zierath JR. Metabolic consequences of obesity and type 2 diabetes: balancing genes and environment for personalized care. Cell. 2021;184:1530–1544. doi:10.1016/j.cell.2021.02.012
5. Locke AE, Kahali B, Berndt SI, et al. Genetic studies of body mass index yield new insights for obesity biology. Nature. 2015;518:197–206. doi:10.1038/nature14177
6. Yang J, Bakshi A, Zhu Z, et al. Genetic variance estimation with imputed variants finds negligible missing heritability for human height and body mass index. Nat Genet. 2015;47:1114–1120. doi:10.1038/ng.3390
7. van der Klaauw AA, Farooqi IS. The hunger genes: pathways to obesity. Cell. 2015;161:119–132. doi:10.1016/j.cell.2015.03.008
8. Powell DR, Revelli J-P, Doree DD, et al. High-throughput screening of mouse gene knockouts identifies established and novel high body fat phenotypes. Diabetes Metab Syndr Obes. 2021;14:3753–3785. doi:10.2147/DMSO.S322083
9. Akiyama M, Okada Y, Kanai M, et al. Genome-wide association study identifies 112 new loci for body mass index in the Japanese population. Nat Genet. 2017;49:1458–1467. doi:10.1038/ng.3951
10. Turcot V, Lu Y, Highland HM, et al. Protein-altering variants associated with body mass index implicate pathways that control energy intake and expenditure in obesity. Nat Genet. 2018;50:26–41. doi:10.1038/s41588-017-0011-x
11. Yengo L, Sidorenko J, Kemper KE, et al. Meta-analysis of genome-wide association studies for height and body mass index in ∼700000 individuals of European ancestry. Hum Mol Genet. 2018;27(20):3641–3649. doi:10.1093/hmg/ddy271
12. Hoffmann TJ, Choquet H, Yin J, et al. A large multiethnic genome-wide association study of adult body mass index identifies novel loci. Genetics. 2018;210:499–515.
13. Loos RJF, Janssens ACJW. Predicting polygenic obesity using genetic information. Cell Metab. 2017;25:535–543. doi:10.1016/j.cmet.2017.02.013
14. Riveros-McKay F, Mistry V, Bounds R, et al. Genetic architecture of human thinness compared to severe obesity. PLoS Genet. 2019;15:e1007603. doi:10.1371/journal.pgen.1007603
15. Orthofer M, Valsesia A, Mägi R, et al. Identification of ALK in thinness. Cell. 2020;181:1246–1262.e22. doi:10.1016/j.cell.2020.04.034
16. Akbari P, Gilani A, Sosina O, et al. Sequencing of 640,000 exomes identifies GPR75 variants associated with protection from obesity. Science. 2021;373:eabf8683. doi:10.1126/science.abf8683
17. Zambrowicz BP, Sands AT. Knockouts model the 100 best-selling drugs – will they model the next 100? Nat Rev Drug Discov. 2003;2:38–51. doi:10.1038/nrd987
18. Walke DW, Han C, Shaw J, Wann E, Zambrowicz B, Sands A. In vivo drug target discovery: identifying the best targets from the genome. Curr Opin Biotechnol. 2001;12:626–631. doi:10.1016/S0958-1669(01)00271-3
19. Hopkins AL, Groom CR. The druggable genome. Nature Rev Drug Discov. 2002;1:727–730. doi:10.1038/nrd892
20. Zheng CJ, Han LY, Yap CW, Ji ZL, Cao ZW, Chen YZ. Therapeutic targets: progress of their exploration and investigation of their characteristics. Pharmacol Rev. 2006;58:259–279. doi:10.1124/pr.58.2.4
21. Landry Y, Gies JP, Drugs and their molecular targets: an updated overview. Fundam Clin Pharmacol. 2008;22:1–18. doi:10.1111/j.1472-8206.2007.00548.x
22. Brommage R, Desai U, Revelli JP, et al. High-throughput screening of mouse knockout lines identifies true lean and obese phenotypes. Obesity. 2008;16:2362–2367.
23. Donoviel DB, Freed DD, Vogel OH, et al. Proteinuria and perinatal lethality in mice lacking NEPH1, a novel protein with homology to NEPHRIN. Mol Cell Biol. 2001;21:4829–4836. doi:10.1128/MCB.21.14.4829-4836.2001
24. Powell DR, DaCosta C, Gay J, et al. Improved glycemic control in mice lacking Sglt1 and Sglt2. Am J Physiol Endocrinol Metab. 2013;304:E117–E130. doi:10.1152/ajpendo.00439.2012
25. Beltrandelrio H, Kern F, Lanthorn T, et al. Saturation screening of the druggable mammalian genome. In: Carroll PM, Fitzgerald K, editors. Model Organisms in Drug Discovery. Chichester: Wiley & Sons; 2003:251–278.
26. Brommage R, Liu J, Hansen GM, et al. High-throughput screening of mouse gene knockouts identifies established and novel skeletal phenotypes. Bone Res. 2014;2:14034. doi:10.1038/boneres.2014.34
27. Wattler S, Kelly M, Nehls M. Construction of gene targeting vectors from lambda KOS genomic libraries. Biotechniques. 1999;26:1150–1160. doi:10.2144/99266rr02
28. Zambrowicz BP, Abuin A, Ramirez-Solis R, et al. Wnk1 kinase deficiency lowers blood pressure in mice: a gene-trap screen to identify potential targets for therapeutic intervention. Proc Natl Acad Sci USA. 2003;100:14109–14114. doi:10.1073/pnas.2336103100
29. Zambrowicz BP, Holt KH, Walke DW, Kirkpatrick LL, Eberhart DE. Generation of transgenic animals. Target Validation Drug Discovery. 2006:3–26. doi:10.1016/B978-012369393-8/50002-X
30. Zhang W, Rajan I, Savelieva KV, et al. Netrin-G2 and netrin-G2 ligand are both required for normal auditory responsiveness. Genes Brain Behav. 2008;7:385–392. doi:10.1111/j.1601-183X.2007.00361.x
31. Brommage R, Powell DR, Vogel P. Predicting human disease mutations and identifying drug targets from mouse gene knockout phenotyping campaigns. Dis Model Mech. 2019;12:dmm038224. doi:10.1242/dmm.038224
32. Revelli JP, Smith D, Allen J, et al. Profound obesity secondary to hyperphagia in mice lacking kinase suppressor of ras 2. Obesity. 2011;19:1010–1018. doi:10.1038/oby.2010.282
33. Powell DR, Doree DD, DaCosta CM, et al. Obesity of G2e3 knockout mice suggests that obesity-associated variants near human G2E3 decrease G2E3 activity. Diabetes Metab Syndr Obes. 2020;13:2641–2652. doi:10.2147/DMSO.S259546
34. Turner RC, Holman RR, Matthews D, Hockaday TD, Peto J. Insulin deficiency and insulin resistance interaction in diabetes: estimation of their relative contribution by feedback analysis from basal plasma insulin and glucose concentrations. Metabolism. 1979;28:1086–1096. doi:10.1016/0026-0495(79)90146-x
35. Matsuda M, DeFronzo RA. Insulin sensitivity indices obtained from oral glucose tolerance testing: comparison with the euglycemic insulin clamp. Diabetes Care. 1999;22:1462–1470. doi:10.2337/diacare.22.9.1462
36. Speakman JR. Measuring energy metabolism in the mouse - theoretical, practical, and analytical considerations. Front Physiol. 2013;4:34. doi:10.3389/fphys.2013.00034
37. Powell DR, Gay J, Wilganowski N, et al. Fads1 knockout mice are lean with improved glycemic control and decreased development of atheromatous plaque. Diabetes Metab Syndr Obes. 2016;9:185–199. doi:10.2147/DMSO.S106653
38. Powell DR, Gay JP, Wilganowski N, et al. Diacylglycerol lipase α knockout mice demonstrate metabolic and behavioral phenotypes similar to those of cannabinoid receptor 1 knockout mice. Front Endocrinol (Lausanne). 2015;6:86. doi:10.3389/fendo.2015.00086
39. Speakman JR, O’Rahilly S. Fat: an evolving issue. Dis Model Mech. 2012;5:569–573. doi:10.1242/dmm.010553
40. Vassilatis DK, Hohmann JG, Zeng H, et al. The G protein-coupled receptor repertoires of human and mouse. Proc Natl Acad Sci USA. 2003;100:4903–4908. doi:10.1073/pnas.0230374100
41. Van Gaal L, Pi-Sunyer X, Després JP, McCarthy C, Scheen A. Efficacy and safety of rimonabant for improvement of multiple cardiometabolic risk factors in overweight/obese patients: pooled 1-year data from the Rimonabant in Obesity (RIO) program. Diabetes Care. 2008;31(Suppl 2):S229–240. doi:10.2337/dc08-s258
42. Van Gaal LF, Scheen AJ, Rissanen AM, Rössner S, Hanotin C, Ziegler O, RIO-Europe Study Group. Long-term effect of CB1 blockade with rimonabant on cardiometabolic risk factors: two year results from the RIO-Europe Study. Eur Heart J. 2008;29:1761–1771. doi:10.1093/eurheartj/ehn076
43. Moreira FA, Crippa JA. The psychiatric side-effects of rimonabant. Braz J Psychiatry. 2009;31:145–153. doi:10.1590/s1516-44462009000200012
44. Ravinet Trillou C, Delgorge C, Menet C, Arnone M, Soubrié P. CB1 cannabinoid receptor knockout in mice leads to leanness, resistance to diet-induced obesity and enhanced leptin sensitivity. Int J Obes Relat Metab Disord. 2004;28:640–648. doi:10.1038/sj.ijo.0802583
45. Kyle UG, Shekerdemian LS, Coss-Bu JA. Growth failure and nutrition considerations in chronic childhood wasting diseases. Nutr Clin Pract. 2015;30:227–238. doi:10.1177/0884533614555234
46. Southern C, Cook JM, Neetoo-Isseljee Z, et al. Screening β-arrestin recruitment for the identification of natural ligands for orphan G-protein-coupled receptors. J Biomol Screen. 2013;18:599–609. doi:10.1177/1087057113475480
47. Iyinikkel RJ. Identifying Novel G Protein-Coupled Receptor Targets in Pulmonary Arterial Hypertension: Uncovering the Role of GPR75 [PhD thesis]. University of Aberdeen School of Medicine; 2018.
48. Lu S, Jang W, Inoue A, Lambert NA. Constitutive G protein coupling profiles of understudied orphan GPCRs. PLoS One. 2021;16:e0247743. doi:10.1371/journal.pone.0247743
 © 2022 The Author(s). This work is published and licensed by Dove Medical Press Limited. The
full terms of this license are available at https://www.dovepress.com/terms
and incorporate the Creative Commons Attribution
- Non Commercial (unported, 3.0) License.
By accessing the work you hereby accept the Terms. Non-commercial uses of the work are permitted
without any further permission from Dove Medical Press Limited, provided the work is properly
attributed. For permission for commercial use of this work, please see paragraphs 4.2 and 5 of our Terms.
© 2022 The Author(s). This work is published and licensed by Dove Medical Press Limited. The
full terms of this license are available at https://www.dovepress.com/terms
and incorporate the Creative Commons Attribution
- Non Commercial (unported, 3.0) License.
By accessing the work you hereby accept the Terms. Non-commercial uses of the work are permitted
without any further permission from Dove Medical Press Limited, provided the work is properly
attributed. For permission for commercial use of this work, please see paragraphs 4.2 and 5 of our Terms.