Back to Journals » International Journal of Nanomedicine » Volume 18
Methodological and Cellular Factors Affecting the Magnitude of Breast Cancer and Normal Cell Radiosensitization Using Gold Nanoparticles
Authors Musielak M ![]() , Boś-Liedke A, Piwocka O, Kowalska K
, Boś-Liedke A, Piwocka O, Kowalska K ![]() , Markiewicz R
, Markiewicz R ![]() , Lorenz A
, Lorenz A ![]() , Bakun P, Suchorska W
, Bakun P, Suchorska W
Received 14 March 2023
Accepted for publication 18 June 2023
Published 11 July 2023 Volume 2023:18 Pages 3825—3850
DOI https://doi.org/10.2147/IJN.S412458
Checked for plagiarism Yes
Review by Single anonymous peer review
Peer reviewer comments 2
Editor who approved publication: Prof. Dr. Anderson Oliveira Lobo
Marika Musielak,1– 3 Agnieszka Boś-Liedke,4 Oliwia Piwocka,1– 3 Katarzyna Kowalska,5 Roksana Markiewicz,6 Aleksandra Lorenz,7 Paweł Bakun,2,8 Wiktoria Suchorska1,3
1Department of Electroradiology, Poznan University of Medical Sciences, Poznan, Poland; 2Doctoral School, Poznan University of Medical Sciences, Poznan, Poland; 3Radiobiology Laboratory, Department of Medical Physics, Greater Poland Cancer Centre, Poznan, Poland; 4Department of Macromolecular Physics, Faculty of Physics, Adam Mickiewicz University, Poznan, Poland; 5Department of Histology and Embryology, Poznan University of Medical Sciences, Poznan, Poland; 6NanoBioMedical Centre, Adam Mickiewicz University, Poznan, Poland; 7Faculty of Agronomy, Horticulture and Bioengineering, Poznan University of Life Sciences, Poznan, Poland; 8Chair and Department of Chemical Technology of Drugs, Poznan University of Medical Sciences, Poznan, Poland
Correspondence: Marika Musielak, Department of Electroradiology, Poznan University of Medical Sciences, Garbary 15, Poznan, 61-866, Poland, Tel +48505372 290, Email [email protected]
Purpose: Breast cancer (BC) is the most common malignant tumor in women, which most often originates from the epithelial tissue of the breast gland. One of the most recommended kinds of treatment is radiotherapy (RT), but irradiation (IR) can affect not only the cancer tumor but also the healthy tissue around it. Au nanoparticles (AuNPs) were proposed as a radiosensitizing agent for RT which would allow for lower radiation doses, reducing the negative radiation effects on healthy tissues. The main objective of the study is to assess the dependence on the radiosensitivity of BC (MDA-MB-231) and normal mammary gland epithelial cells (MCF12A) to ionizing radiation, caused by functionalized AuNPs under diverse conditions.
Methods: The viability, uptake, reactive oxygen species induction, and mitochondrial membrane potential in cells were analyzed applying a time and concentration-dependent manner. After different incubation times with AuNPs, cells were exposed to 2 Gy. The determination of radiation effect in combination with AuNPs was investigated using the clonogenic assay, p53, and γH2AX level, as well as, Annexin V staining.
Results: Our results highlighted the strong need for assessing the experimental conditions’ optimization before the AuNPs will be implemented with IR. Moreover, results indicated that AuNPs did not act universally in cells.
Conclusion: AuNPs could be a promising tool as a radiotherapy sensitizing agent, but it should be specified and deeply investigated under what conditions it will be applied taking into consideration not only AuNPs modifications but also the model and experimental conditions.
Keywords: oncology, nanotechnology, nanoparticles, radiotherapy, breast cancer
Introduction
The radiosensitization effect of Au nanoparticles (AuNPs) on breast cancer (BC) cells is widely known.1 It was proposed to reduce the harmful side effects of radiotherapy while increasing the effectiveness of treatment, particularly when other conventional methods are limited for the specific molecular type of cancer. NPs are nanostructures consisting of at least one dimension reaching less or about 100 nm.2 The gold metal is inert and cannot be metabolized. Many properties, such as biocompatibility and pharmacokinetics, are heavily influenced by the stabilizing organic coating and possible surface functionalization.3 AuNPs are usually modified to increase the internalization and accumulation in cells inducing eg oxidative stress by reactive oxygen species (ROS).4 Sensitizing tumor cells to radiotherapy (RT) would allow for lower radiation doses, reducing the negative radiation effects on healthy tissues. This involves unknown physical, chemical, and biological processes between AuNPs and cells during irradiation (IR), requiring additional research.5
The size and functionalization of AuNPs have a very significant impact on the way they penetrate the cell.6 During internalization, AuNPs must cross the cell membrane barrier, avoid degradation in endosomes or lysosomes, translocate in the cytoplasm, and enter the nucleus.7 Polyethylene glycol (PEG) is often used as a nanoparticle coating material to reduce its toxicity and avoid accumulation in lysosomes.8 Achieving better intracellular transport and avoiding degradation in cell structures is a major challenge and a rarely undertaken research topic. Analyzing the scientific literature, a significant lack of data on the variability of experimental conditions in AuNP research can be observed. For this purpose, the effect of the incubation time of cells with AuNPs before exposure to ionizing radiation should be investigated, as this key parameter is too often omitted. Moreover, no consensus has yet been reached on the role of AuNPs in DNA damage repair. There are conflicting reports on the effect of AuNPs on the inhibition of DNA double-strand break (DSB) repair. In addition, an extra layer on the surface of the nanoparticle may change the way the ionizing radiation interacts with the irradiated medium. PEG is mainly tested for minimization of toxicity. However, there are no literature data relating to its direct effect on changing the radiosensitivity of cells.
The conditions for inducing high radiosensitivity by nanoparticles are still not defined. The emphasis is placed on making the nanoparticles themselves more toxic rather than the conditions under which they should be implemented. It is necessary to possess a thorough understanding of how these variables regulate crucial biological processes. Since there is no transparent systematic describing the effects of action depending on the selected properties of AuNPs, it is also essential to identify the optimal physical parameters of nanoparticles. The clinical success of nanoparticles in the future is expected to be based on a better understanding of the mechanisms by which their physicochemical properties influence cellular radiobiological responses.
The main goal of the study is to assess the dependence on the radiosensitivity of BC and normal mammary gland epithelial cells to ionizing radiation, caused by functionalized AuNPs under diverse conditions. There are two specific objectives namely (1) the evaluation and comparison of effects caused by differently functionalized AuNPs using BC and normal breast cells and (2) the evaluation of the impact of incubation time with AuNPs on BC and normal breast cells after exposure to ionizing radiation.
Materials and Methods
Synthesis and Functionalization of AuNPs
Based on our previous work,9 we used the AuNPs functionalized with the PEG chain and RGD (Arg-Gly-Asp) peptide but in different, extended conditions. The protocol of synthesis and functionalization were described previously. The Au nanospheres were synthesized using two techniques, namely the inverse method published by Schulz et al10 and the Turkevich technique presented by Wang et al.11 The RGD complex and PEG chains in two molecular weights of 800 and 2000 were used for the functionalization of 10 nm and 30 nm nanospheres. The functionalization was performed using the protocol determined by Yang et al.12 Finally, the four different nanostructures: RGD-PEG800-AuNPs10nm, RGD-PEG2000-AuNPs10nm, RGD-PEG800-AuNPs30nm, RGD-PEG2000-AuNPs30nm were obtained. All AuNPs were additionally characterized using Dynamic Light Scattering (DLS) technique (ZetaSizer Nano, Malvern Instruments, Malvern, UK). Measurements were performed in triplicate.
Cell Culture
In the study, breast cancer cell (MDA-MB-231) and breast mammary epithelial cell (MCF12A) lines were used (ATCC). Cells were cultured at 37°C, in a standard atmosphere enriched with 5% CO2, and saturated with a water vapor incubator (Binder, Germany). The MDA-MB-231 cell culture medium was DMEM (Biowest, France) supplemented with 10% fetal bovine serum (FBS) (Biowest, France), and the addition of antibiotic agents (penicillin/streptomycin (P/S) at a final concentration of 1%) (Merck Millipore Corporation, Germany). MCF12A cells were cultured in 1:1 DMEM and Ham’s F12 (Biowest, France), supplemented with 5% horse serum (Biowest, France), 20 ng/mL epidermal growth factor (EGF), 0.5 µg/mL hydrocortisone, 10 µg/mL insulin, 100 ng/mL cholera toxin and 1% P/S. When cell confluency reached 80–90%, cells were passaged with trypsin-EDTA. Tests were carried out under aseptic conditions in a laminar flow hood.
Viability Test
MDA-MB-231 and MCF12A cells were plated at a density of 15,000 cells per well in 96-well flat-bottomed plates. After 24 h, RGD-PEG800-AuNPs10nm, RGD-PEG2000-AuNPs10nm, RGD-PEG800-AuNPs30nm, RGD-PEG2000-AuNPs30nm were added in culture media at final volumes of 100 μL per well at 0.0004, 0.0008, 0.0012, 0.0020, 0.0060, 0.0120 and 0.0200 mg/mL concentration. The analysis was carried out after 24 and 48 h incubation. The medium containing AuNPs was then removed, and MTT (3-(4,5-dimethylthiazol-2-yl)-2,5-diphenyltetrazolium bromide) (Affymetrix, Cleveland, OH, USA) was added at a final concentration of 0.5 mg/mL in culture media. Cells were cultured for 3h, before discarding the medium and adding 100 μL DMSO (Thermo Scientific, USA) per well to dissolve the formazan crystals formed. The results were read using a Multiskan plate reader at 570/590 nm and 655 nm for the background (Thermo Scientific, USA).
Internalization Analysis
The internalization (uptake) of AuNPs was determined using the method described by Park et al.13 Cells were seeded on the 12-well plates at a density of 200,000 cells per well. After 24 h, RGD-PEG800-AuNPs10nm, RGD-PEG2000-AuNPs10nm, RGD-PEG800-AuNPs30nm, RGD-PEG2000-AuNPs30nm were added at 0.0004, 0.0008, 0.0012 mg/mL for each AuNP type. The level of AuNP internalization in cells was determined after 0.5, 1, 3, 6, and 24 h. Cells were harvested after incubation, suspended in Phosphate Buffered Saline (PBS) (Biowest, France), and washed once to discard excess AuNPs from the sample. Cytoflex Beckman Coulter cytometer (Beckman Coulter Life Sciences, Indianapolis, IN, USA) was used for cytometric analysis. Fluorescence was measured at 611 nm by analyzing the side scatter parameter (SSC). Analysis of the obtained results was performed using FlowJo v10.
Reactive Oxygen Species (ROS) Assay
The 200,000 cells per well were seeded. In the absence of serum, a 1:1000 solution of 2’,7’-Dichlorofluorescin Diacetate DCFH-DA (Merck Millipore Corporation, Germany) in a culture medium was prepared. The culture media were removed, and cells were washed with PBS once. The cells were then dyed with a dye solution and incubated for 45 min in an incubator at 37°C. After this time, the dye solution was discarded and the cells were washed with PBS once. A solution of complete culture medium containing RGD-PEG800-AuNPs10nm, RGD-PEG2000-AuNPs10nm, RGD-PEG800-AuNPs30nm, and RGD-PEG2000-AuNPs30nm at a concentration of 0.0004, 0.0008 and 0.0012 mg/mL were added to cells followed by incubations of 10, 20, 30, 40 min and 1, 3, 6 and 24 h. Cells were collected, suspended in PBS, and analyzed using flow cytometry. A flow cytometer was used to measure the fluorescein isothiocyanate-height (FITC-H) channel (at 485 nm excitation wavelength and 527 nm emission).
Mitochondrial Membrane Potential Assay (JC-1)
To investigate the mitochondrial membrane potential assay, the JC-1 1:1000 solution in PBS was prepared. Based on the ROS results, the time point (TP) of 30 min incubation of cells with AuNPs was chosen, because of increasing trends in ROS generation in this TP.
Cells were seeded at 200,000 cells/well. After 24h, cells were washed with PBS and JC-1 solution was added. Cells were incubated for 15 min at 37°C. After the incubation time, cells were washed with PBS once. A solution of culture medium with each AuNP, RGD-PEG800-AuNPs10nm, RGD-PEG2000-AuNPs10nm, RGD-PEG800-AuNPs30nm, and RGD-PEG2000-AuNPs30nm, at a concentration of 0.0004 mg/mL were added to cells and incubated for previously chosen TP of 30 min. After incubation time, cells were washed with PBS, harvested, and suspended in PBS for cytometric analysis. For positive control, the carbonyl cyanide m-chlorophenyl hydrazone (CCCP) was used. The measurement was performed using a flow cytometer on the FITC-H channel and phycoerythrin-height (PE) channel.
Cell Cycle
The 200,000 cells were seeded on each well of the 12-well plate. After 24h, the medium was removed, and a solution of culture medium with each AuNP, RGD-PEG800-AuNPs10nm, RGD-PEG2000-AuNPs10nm, RGD-PEG800-AuNPs30nm, and RGD-PEG2000-AuNPs30nm, at a concentration of 0.0004, 0.0008 and 0.0012 mg/mL was added to cells and incubated for 24, 48, 72 h. Afterward, cells were collected and fixed in 70% ice-cold ethanol solution (POCh, Poland). Samples were stored at −20°C. For the cell cycle analysis, the cell pellet was dyed using 1 mg/mL propidium iodide (Cayman Chemical Company, USA) and 10 mg/mL RNase I enzyme (PanReac AppliChem, ITW Reagents, Chicago, IL, USA) in PBS solution. Cells were incubated for 30 min at 37 °C, protected from light. Fluorescence was measured at 611 nm. The obtained results were analyzed using FlowJo v10.
Irradiation
Cells were irradiated after the incubation with RGD-PEG800-AuNPs10nm, RGD-PEG2000-AuNPs10nm, RGD-PEG800-AuNPs30nm, and RGD-PEG2000-AuNPs30nm. Based on the previous results, three different TPs of cell incubation with AuNPs were chosen: 30 min, 3 h, and 24 h. Cells were first plated on 10 cm plates. The cells were then incubated in a medium containing only one type of AuNPs. Further, the irradiation was carried out using a Gamma Cell® 1000 Elite device (Best Theratronics Ltd., Canada) with a dose rate of 2.5 Gy/min using a closed source Cs-137 with an activity of 20.4 TBq. The cells were exposed to the dose of 2 Gy.
Clonogenic Assay
Following irradiation, cells were plated on 6-well plates and incubated for 7 days (500 cells per well for the control group (0 Gy) and 1000 cells per well for irradiated groups (2 Gy)). Clonogenic assays were terminated when a colony of at least 50 clones was observed in the control group. The medium was removed, and cells were washed with PBS. Next, cells were fixed with denatured ethanol. After removing the ethanol, the plates were stained with about 2 mL of Coomassie Blue solution (Merck Millipore Corporation, Germany) and incubated for 20 min. The buffer was then discarded, and the plates were washed in warm water and dried. Plates were photographed using the ChemiDoc Touch Bio-Rad system (Hercules, USA). Automatic colony counting was performed using the Gene Tools Syngene program.
Immunofluorescence
Two different experiments were performed using immunofluorescence. The first one was completed for the JC-1 assay (1), and the second one was for detecting P53 and γH2AX after irradiation of cells (2).
JC-1 Assay
The MDA-MB-231 and MCF12A cells were plated on 96 flat-bottomed plates. The culture medium was removed, and cells were washed once with PBS. The JC-1 1:1000 solution in PBS was added in a volume of 200 μL per well. Next, cells were incubated for 15 min at 37 °C. Then, a solution of the culture medium with each AuNP, RGD-PEG800-AuNPs10nm, RGD-PEG2000-AuNPs10nm, RGD-PEG800-AuNPs30nm, and RGD-PEG2000-AuNPs30nm, at a concentration of 0.0004 mg/mL was added to cells. Cells were photographed every 10 min till 40 min of incubation to observe the effect of AuNPs on mitochondrial membrane potential.
P53 and γH2AX
Cells were seeded on the 8-well chamber slides (VWR, Germany) with a 50,000 cells/well density. After 24h, a solution of the culture medium with each AuNP, RGD-PEG800-AuNPs10nm, RGD-PEG2000-AuNPs10nm, RGD-PEG800-AuNPs30nm, and RGD-PEG2000-AuNPs30nm, at a concentration of 0.0004 mg/mL was added to cells. The 30 min, 3h, and 24 h TP were chosen for the incubation time of cells with AuNPs. Then, cells were irradiated with a dose of 2 Gy. Next, the cells were incubated for 45 min at 37°C. Next, cells were washed with PBS, fixed in 4% paraformaldehyde for 20 min at RT and permeabilized with ice-cold 100% methanol at −20°C for 20 min. Next, the blocking was performed by incubation with 0.2% Triton X-100 and 1% Bovine Serum Albumin (BSA) (VWR, Germany) solution for 30 min at RT. Then, the cells were washed with PBS. Next, 200 µL of a primary antibody solution γH2AX (ab22551, Abcam, UK) produced in mouse and P53 (ab26, Abcam, UK) produced in rabbit was added into each chamber and slides were incubated overnight in 4°C. Then, the cells were washed thrice with 2% BSA in PBS solution and incubated with 250 µL of secondary antibody solution for 1 h at 37°C in darkness. All slides were washed thrice with 2% BSA in PBS solution and 400 µL of DAPI (catalogue number: SAFSD8417) (VWR, Germany) solution was added. Immunofluorescence was photographed using an Olympus IX83 microscope (Boston Industries, Inc., MA, USA).
Flow Cytometry Analysis After Irradiation
γH2AX
After irradiation, cells were separated into samples of 200,000 cells. Forty-five minutes after, the cells were washed with PBS, fixed, and permeabilized with the Fixation/Permeabilization Kit (BD Biosciences, NJ, USA). Cells were incubated with the 3.5 µL anti-γH2AX antibody (Becton Dickinson, USA) and PBS in the final volume of 20 µL for 30 min at 4°C. Finally, cells were washed with PBS and suspended in 200 µL of PBS for the cytometric analysis.
P53
Following irradiation, cells were seeded on the 6-well plate (200,000 cells/well). After 24 h, cells were harvested, collected and washed with PBS once. Next, cells were fixed, and permeabilized with the Fixation/Permeabilization Kit (BD Biosciences, NJ, USA). Using the 1:50 dye solution of anti P53 antibody (R&D systems, USA) and PBS, cells were incubated for 30 min in 4°C. Then, cells were washed with PBS and prepared for cytometric analysis.
Annexin V
Cells were irradiated and plated on the 6-well plate (200,000 cells/well). After 24 h, cells were divided into probes per 200,000 cells. Next, cells were prepared and stained following the annexin V kit and protocol (Life Technologies, Invitrogen, USA).
All stained cells were analyzed by Cytoflex Beckman Coulter cytometer (Beckman Coulter Life Sciences, ID, USA). Analysis of the obtained results was performed using FlowJo v10 (FlowJo LLC, USA).
Statistical Analysis
PQStat Software v.1.8.2 and Microsoft® Excel® were used for the statistical analysis (Microsoft Office Professional Plus 2019). The Shapiro–Wilk test was used to determine the normality of the observed data distribution. For multiple comparisons, one-way ANOVA was used. Tukey’s post hoc test was applied to calculate the differences for a complex system (more than two groups) and multiple comparison procedures. If Levene’s test indicated that the variances are not equal across the groups, the unequal variance t-Test (Welch’s t-Test) was implemented. The p-value = 0.05 was used to determine whether the data were significant. The setting of the p-value was * p < 0.05, ** p < 0.01, *** p < 0.001.
Results
This study was a continuation of our previous article.9 In this work, we analyzed the effects of the same AuNPs but the new parameters were checked by applying different cell lines. The protocol of synthesis, functionalization, and characterization of AuNPs was previously described.9 Briefly, the AuNPs were synthesized obtaining the size of 10 and 30 nm, and functionalized using the RGD peptide and two PEG chains of 800 and 2000 molecular weight (MW). The 4 kinds of AuNPs have been established: RGD-PEG800-AuNPs10nm, RGD-PEG2000-AuNPs10nm, RGD-PEG800-AuNPs30nm, and RGD-PEG2000-AuNPs30nm.
Viability of Cells
The MDA-MB-231 and MCF12A cells were exposed to RGD-PEG800-AuNPs10nm, RGD-PEG2000-AuNPs10nm, RGD-PEG800-AuNPs30nm, and RGD-PEG2000-AuNPs30nm using concentrations of 0.0004, 0.0008, 0.0012, 0.002, 0.006, 0.012 and 0.02 mg/mL (Figure 1). Cells were incubated with AuNPs for 24 and 48 h. The greatest discrepancy in the results was observed after the 24 h incubation of cells with AuNPs. The smallest in size and functionalization of AuNPs caused a decrease to 80% of viability using concentration from 0.0004 to 0.002 mg/mL. In higher concentrations, the viability increased to 100%. The AuNPs in the same size but functionalized with PEG2000 did not change the cells’ viability after 24h. The 30 nm AuNPs with PEG800 induced a slight trend of decreasing viability related to increasing AuNPs concentration, but the lowest viability gained about 80%. The RGD-PEG2000-AuNPs30nm in the concentration of 0.002 mg/mL occurred to be the most toxic one reducing the viability level by 30% compared to the control group. After 48 h, the results were highly homogenous. The AuNPs did not induce cytotoxicity effects. Only one diversity was observed according to RGD-PEG2000-AuNPs30nm, where an increase of 30% in the proliferation level was observed using 0.0012 and 0.02 mg/mL concentrations. A similar tendency in results of heterogeneity after the 24 h and homogeneity after the 48 h incubation time was noticed in the MCF12A cell line. The smallest AuNPs in the concentration of 0.0012 mg/mL caused an increase in the proliferation level of about 70% after the 24 h incubation. In the range of the AuNP concentration from 0.0004 to 0.0012 mg/mL a higher proliferation level was presented. Comparing the two sizes of AuNPs, a higher level was observed in AuNPs in the size of 10 nm. Considering higher concentrations of AuNPs, the intensified proliferation of MCF12A cells was observed, but in RGD-PEG2000-AuNPs30nm, the trend of decreasing proliferation with increasing AuNP concentration levels was noticed. After 48 h, a homogenous tendency of increased proliferation was detected, reaching the highest level of about 200%. In the highest AuNP concentration, analyzing 30 nm AuNPs, the level of proliferation was similar compared to the control group.
 |
Figure 1 The viability of MDA-MB-231 (blue) and MCF12A (green) cells after the incubation with RGD-PEG800-AuNPs10nm, RGD-PEG2000-AuNPs10nm, RGD-PEG800-AuNPs30nm, RGD-PEG2000-AuNPs30nm. (A) The viability of MDA-MB-231 cells after 24 h of incubation with AuNPs. (B) The viability of MDA-MB-231 cells after 48 h of incubation with AuNPs. (C) The viability of MCF12A cells after 24 h of incubation with AuNPs. (D) The viability of MCF12A cells after 48 h of incubation with AuNPs. The wide range of the AuNPs concentration was checked; 0.0004, 0.0008, 0.0012, 0.002, 0.006, 0.012, 0.02 mg/mL. The values presented in the graph are the mean of the obtained results and the standard deviation. The experiment was performed in triplicate. |
The Uptake
The internalization of AuNPs into the cells (uptake) was checked using the lowest three AuNP concentrations (0.0004, 0.0008, 0.0012 mg/mL) (Figure 2). The TPs of the cell incubation with AuNPs were 30 min, 1, 3, 6, and 24 h. The SSC-H parameter was studied using flow cytometry. With the increase in the number of nanoparticles incorporated into the cell interior, its granularity rises, and, consequently, the value of the SSC-H parameter changes. In MDA-MB-231 cells, the highest granularity was observed after 3 h of incubation. Before, the increasing trend of the relative SSC-H level was noticed. After reaching the SSC-H point in 3 h, the granularity decreased. Considering different concentrations, a similar effect was detected. All of the used concentrations caused a similar SSC-H relative level in MDA-MB-231, which suggested that the lowest concentration was enough to saturate cells to the maximum level. Moreover, comparing all kinds of used nanoparticles, a similar SSC-H 1.3 enhancement was observed. Analyzing MCF12A cells, the increasing SSC-H level was noticed, reaching the highest point at 6 h of the incubation time. After it, the granularity decreased in TP of 24 h. As in the previous results, there were no differences between the used concentrations and the kind of nanoparticles analyzing diversity in the SSC-H relative level in MCF12A cells. The cellular incorporation of AuNPs is strongly dependent on the AuNP surface charge. To assess whether AuNPs were negatively or positively charged, the zeta potential was measured. The following values of zeta potential were obtained: for RGD-PEG800-AuNPs10nm, −1.81 mV; RGD-PEG2000-AuNPs10nm, −4.17 mV; RGD-PEG800-AuNPs30nm, −2.94 mV; and RGD-PEG2000-AuNPs30nm, −21.47 mV.
 |
Figure 2 The relative SSC-H parameter level of MDA-MB-231 and MCF12A cells after the incubation with AuNPs. All AuNPs’ concentrations were 0.0004, 0.0008, and 0.0012 mg/mL. The experiment was performed in triplicate in TP of the 30 min, 1, 3, 6 and 24 h incubation using MDA-MB-231 cells with RGD-PEG800-AuNPs10nm (A) and RGD-PEG2000-AuNPs10nm (B), RGD-PEG800-AuNPs30nm (C) and RGD-PEG2000-AuNPs30nm (D). The uptake assessment for MCF12A cells was performed in triplicate in TP of the 30 min, 1, 3, 6 and 24 h incubation with RGD-PEG800-AuNPs10nm (E) and RGD-PEG2000-AuNPs10nm (F), RGD-PEG800-AuNPs30nm (G) and RGD-PEG2000-AuNPs30nm (H). |
ROS Generation
ROS generation level is considered one of the main causes of the radiosensitivity effect in BC cells. Based on the previous optimization, the ROS level was checked during the first 1 h of the incubation of the cells with AuNPs (Figure 3). The same concentrations as in the uptake investigation were used. The ROS level was analyzed per 10 min from point “0” to 40 min. Considering the MDA-MB-231 cells, the diversity in ROS generation results was observed. Using RGD-PEG800-AuNPs10nm, the lowest concentration caused the highest ROS point reaching 1.4 in 20 min. Higher concentrations generated much lower ROS levels from 1.2 to 1.1. In contrast, the RGD-PEG2000-AuNPs10nm did not induce a higher ROS level compared to the control group in every TP. The highest ROS induction was detected using RGD-PEG800-AuNPs30nm in the concentration of 0.0008 mg/mL. Analyzing this kind of AuNPs, the concentration, and time-dependent manner were noticed. With increasing time, the ROS induction was higher till the TP of 30 min. In the TP of 40 min, the ROS generation level decreased. The lowest ROS was induced using 0.0012 mg/mL of RGD-PEG800-AuNPs30nm. The RGD-PEG2000-AuNPs30nm caused similar effects using all concentrations. The ROS induction level was maintained at the level of 1.3 in tested TPs. In MCF12A, the effect of increasing ROS level was not detected in any concentration, TP, and kind of AuNPs. Moreover, the ROS level was even lower compared to the control group.
 |
Figure 3 The Comparison of ROS generation level between MDA-MB-231 and MCF12A cells. The experiment was performed using TPs of the 10, 20, 30 and 40 min incubation. The ROS assay was carried out using MDA-MB-231 cells exposed to RGD-PEG800-AuNPs10nm (A) and RGD-PEG2000-AuNPs10nm (B), RGD-PEG800-AuNPs30nm (C) and RGD-PEG2000-AuNPs30nm (D) and MCF12A cells treated with RGD-PEG800-AuNPs10nm (E) and RGD-PEG2000-AuNPs10nm (F), RGD-PEG800-AuNPs30nm (G) and RGD-PEG2000-AuNPs30nm (H). All AuNPs’ concentrations were 0.0004, 0.0008, and 0.0012 mg/mL. |
Mitochondrial Membrane Potential
An intracellular oxidative stress state induced by high ROS levels might result in long-lasting cell damage. The most vulnerable part of the cell is the mitochondria, due to the damage in mitochondrial membrane potential which is considered to be biologically caused by the AuNP radiosensitization effect. We studied the changes in the mitochondrial membrane potential (JC-1) after the incubation of MDA-MB-231 (Figure 4) and MCF12A (Figure 5) cells with RGD-PEG800-AuNPs10nm, RGD-PEG2000-AuNPs10nm, RGD-PEG800-AuNPs30nm, and RGD-PEG2000-AuNPs30nm. In living cells, the JC-1 dye is absorbed into active mitochondria, where it forms aggregates with fluorescent properties. JC-1 monomers fluoresce under green light (530nm light emission) and JC-1 aggregates fluoresce under red light (595nm light emission). In apoptotic or damaged cells with a low potential of the mitochondrial membrane, JC-1 does not form aggregates, it remains in the form of green fluorescent monomers. The JC-1 level was checked every 5 min till 30 min. An increase in mitochondrial damage was observed especially after 10, 20, and 25 min. The RGD-PEG800-AuNPs30nm occurred to be the most reducing the mitochondrial membrane potential from 5 min, reaching the highest point at 1.4 in 25 min. AuNPs in the size of 10 nm induced comparable results in every TP. In the case of 30s AuNPs, the results were more variable. The 30 nm AuNPs functionalized with the longer chain showed a tendency of generating lower values than AuNPs functionalized with the shorter PEG. In MCF12A cells, the mitochondria damage occurred after 20 min of incubation with AuNPs. In the first 15 min, the mitochondrial membrane potential did not change. From the 20 min, results presented similar effects comparing different AuNPs, but, as in MDA-MB-231 cells, the RGD-PEG800-AuNPs30nm appeared to be the most effective in inducing mitochondrial damages reaching about 1.6. The MCF12A cells showed that they are more sensitive to AuNPs analyzing the parameter of the mitochondrial membrane potential. The immunofluorescence JC-1 images were taken after 5, 15, and 25 min of incubation with AuNPs to present the effects of AuNPs.
 |
Figure 4 The mitochondrial membrane potential (JC-1) after the incubation of MDA-MB-231 cells with RGD-PEG800-AuNPs10nm, RGD-PEG2000-AuNPs10nm, RGD-PEG800-AuNPs30nm and RGD-PEG2000-AuNPs30nm. In living cells, the JC-1 dye is absorbed into active mitochondria, where it forms aggregates with fluorescent properties. JC-1 monomers fluoresce under green light (530nm light emission) and JC-1 aggregates fluoresce under red light (595nm light emission). In apoptotic or damaged cells with a low potential of the mitochondrial membrane, JC-1 does not form aggregates, it remains in the form of green fluorescent monomers. The JC-1 level was checked every 5 min till 30 min (A). The control group (CTR) was TP of 0 min (B). The immunofluorescence JC-1 images were taken after 5, 15 and 25 min of the incubation with AuNPs. The MDA-MB-231 cells were photographed after the 5 min (C), 15 min (D) and 25 min (E) incubation with RGD-PEG800-AuNPs10nm, after the 5 min (F), 15 min (G) and 25 min (H) incubation with RGD-PEG2000-AuNPs10nm, after the 5 min (I), 15 min (J) and 25 min (K) incubation with RGD-PEG800-AuNPs30nm, after the 5 min (L), 15 min (M) and 25 min (N) incubation with RGD-PEG2000-AuNPs30nm. Immunofluorescence was photographed using a Olympus IX83 microscope (Boston Industries, Inc., MA, USA). |
 |
Figure 5 The mitochondrial membrane potential (JC-1) after the incubation of MCF12A cells with RGD-PEG800-AuNPs10nm, RGD-PEG2000-AuNPs10nm, RGD-PEG800-AuNPs30nm, and RGD-PEG2000-AuNPs30nm. In living cells, the JC-1 dye is absorbed into active mitochondria, where it forms aggregates with fluorescent properties. JC-1 monomers fluoresce under green light (530nm light emission) and JC-1 aggregates fluoresce under red light (595nm light emission). In apoptotic or damaged cells with a low potential of the mitochondrial membrane, JC-1 does not form aggregates, it remains in the form of green fluorescent monomers. The JC-1 level was checked every 5 min till 30 min (A). The control group (CTR) was TP of 0 min (B). The immunofluorescence JC-1 images were taken after 5, 15 and 25 min of the incubation with AuNPs. The MCF12A cells were photographed after the 5 min (C), 15 min (D) and 25 min (E) incubation with RGD-PEG800-AuNPs10nm, after the 5 min (F), 15 min (G) and 25 min (H) incubation with RGD-PEG2000-AuNPs10nm, after the 5 min (I), 15 min (J) and 25 min (K) incubation with RGD-PEG800-AuNPs30nm, after the 5 min (L), 15 min (M) and 25 min (N) incubation with RGD-PEG2000-AuNPs30nm. Immunofluorescence was photographed using a Olympus IX83 microscope (Boston Industries, Inc., MA, USA). |
Cell Cycle
Many researchers suggested that the radiosensitization effect is related to blocking cells in the G2 phase of the cell cycle caused by the AuNPs. Cells in the G2 phase of the cell cycle are considered to be sensitive to ionizing radiation. This proposal was also checked in our study. The cell cycle of MDA-MB-231 and MCF12A was analyzed after the 24, 48, and 72 h incubation with RGD-PEG800-AuNPs10nm, RGD-PEG2000-AuNPs10nm, RGD-PEG800-AuNPs30nm, and RGD-PEG2000-AuNPs30nm (Figure 6). In MDA-MB-231 cells, there was no difference between cells exposed to AuNPs and incubated alone depending on time. The cell cycle distribution slightly changed between TPs, but it might be associated with the time of incubation and cell phase synchronization. Analyzing MCF12A cells, there was no higher percentage of cells in the G2 phase. Moreover, a decrease in the number of cells in this phase was observed. In all TPs, comparing cells treated and non-treated with AuNPs there was a difference in the G1 phase. After the incubation with AuNPs, cells demonstrated a higher percentage of cells in the G1 phase, but this result was supposed to have no connection with the radiosensitization effects.
 |
Figure 6 Percentage of cells in the G1, S, and G2 phases of cell cycle after incubation with RGD-PEG800-AuNPs10nm, RGD-PEG2000-AuNPs10nm, RGD-PEG800-AuNPs30nm and RGD-PEG2000-AuNPs30nm. The concentration of AuNPs was 0,0004 mg/mL. Three different TPs of incubation were used (24, 48 and 72 h). Plots present the cell cycle distribution of MDA-MB-231 cells after the 24 h (A), 48 h (B) and 72 h (C) incubation and of MCF12A cells after the 24 h (D), 48 h (E) and 72 h (F) incubation. |
Surviving Fraction (SF)
The MDA-MB-231 and MCF12A cells were irradiated with a dose of 2 Gy (Figure 7). Before the irradiation, cells were divided into two groups – incubated and non-incubated with AuNPs. Based on the previous results, three incubation TPs were chosen: 30 min, 3, and 24 h. The tested AuNPs concentration was 0.0004 mg/mL as it was the most effective one and simultaneously, the lowest one inducing effects in cells. The aim was to determine the most probable causes of radiosensitization. Suggested radiosensitization explanations of ROS generation, mitochondrial damages, and the highest AuNP internalization or cell cycle distributions are related to different biological effects regulated by processes occurring in specified time. The 30 min incubation time with AuNPs was selected because of the high ROS generation and, as a consequence, the mitochondrial dysfunction in this period. Some authors investigated radiosensitization effects, irradiating cells when they incorporated the maximum amount of AuNPs. Due to this, the cells were irradiated after 3 h of incubation with AuNPs, because in this TP MDA-MB-231 cells showed the highest uptake. The scheme was designed aiming the increase in survival fraction of BC cells, so the TP was chosen for both used cell lines. The most popular TP of cell irradiation after the previous incubation with AuNPs is 24 h. It is usually used TP pretending to be the effective one to induce the biological effects of AuNPs in irradiated cells, but it is selected without a specific explanation.
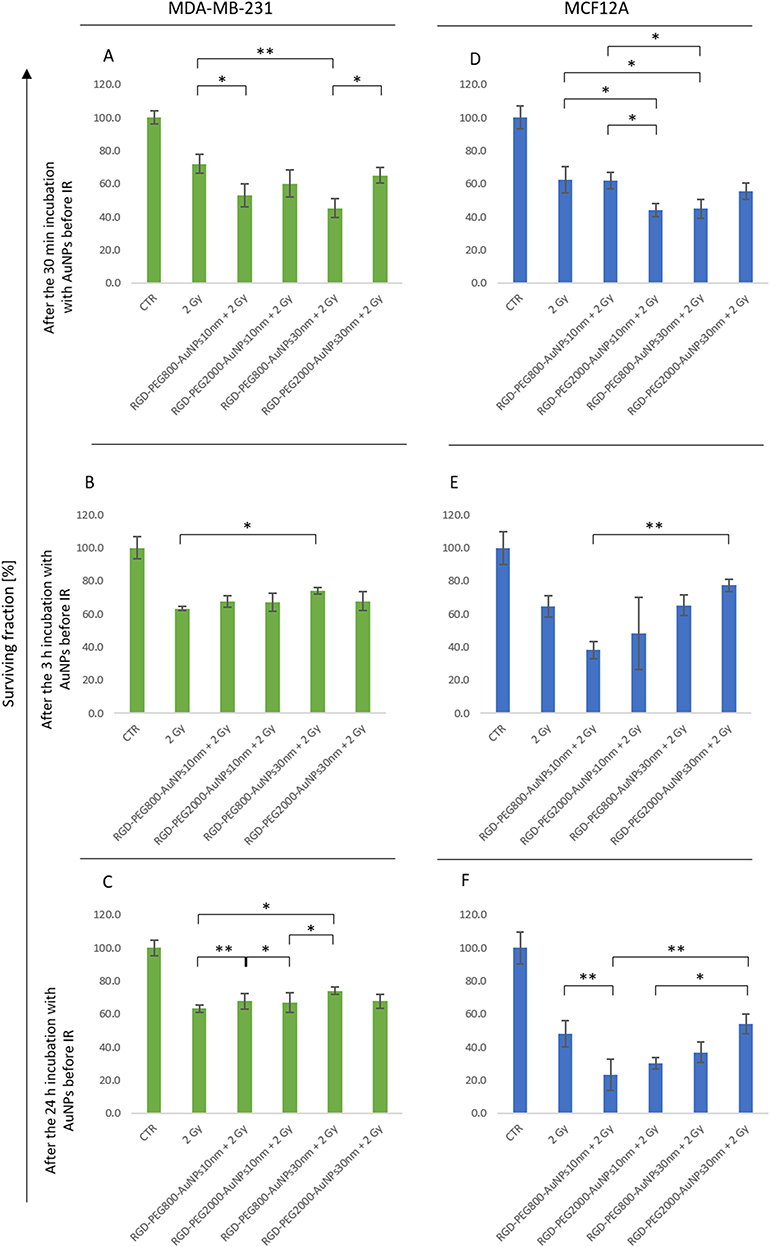 |
Figure 7 The surviving fraction (SF) of MDA-MB-231 and MCF12A cells. SF was analyzed after the cells exposure to a dose of 2 Gy and dose of 2 Gy with the previous 30 min, 3 and 24 h incubation with RGD-PEG800-AuNPs10nm, and RGD-PEG2000-AuNPs10nm, RGD-PEG800-AuNPs30nm and RGD-PEG2000-AuNPs30nm in the concentration of 0.0004 mg/mL. The control group was not exposed to AuNPs and IR. Plots show obtained SF results of MDA-MB-231 cells after exposition of 2 Gy and: the 30 min (A), 3 h (B), 24 h (C) previous incubation with AuNPs and MCF12A cells after exposition of 2 Gy and: the 30 min (D), 3 h (E), 24 h (F) previous incubation with AuNPs. The setting of the p-value was *p < 0.05, **p < 0.01. |
The statistically significant differences of SF between the MDA-MB-231 cells treated and non-treated with AuNPs before IR occurred only after the 30 min incubation with AuNPs. The highest one was observed using RGD-PEG800-AuNPs30nm (p = 0.003543). A similar effect was noticed considering SF after IR and incubation with AuNPs with the same PEG chain, but smaller in size (p = 0.029649). Comparing results obtained using AuNPs in size of 30 nm, there was a significant difference. More effective in reducing the SF value after IR was AuNPs with the shorter PEG chain. After 3 h of incubation with AuNPs, the SF did not decrease but increased. The statistical difference occurred between cells previously incubated with RGD-PEG800-AuNPs30nm (p = 0.046662). The same in the size and functionalization AuNPs in dependence on time showed an opposite effect. A similar situation was noticed after the 24 h incubation with AuNPs before IR. The highest increase was also detected using RGD-PEG800-AuNPs30nm (p = 0.011788), but statistically, the highest significant difference appeared applying the smallest AuNPs (p = 0.006412). Comparing increases between different kinds of AuNPs, there were differences between RGD-PEG800-AuNPs10nm and RGD-PEG2000-AuNPs10nm (p = 0.015007), as well as RGD-PEG2000-AuNPs10nm and RGD-PEG800-AuNPs30nm (p = 0.028494).
In the case of MCF12A cells, a comparable situation was observed after the 30 min incubation with AuNPs. The most effective in the reduction of the SF value after irradiation was RGD-PEG2000-AuNPs10nm (p = 0.01933) and RGD-PEG800-AuNPs30nm (p = 0.026642). There was also a statistically significant difference between AuNPs with the same PEG800 chain (p = 0.029158) where the AuNPs bigger in the size caused a decrease in the SF. Comparing the effectiveness of 10 nm AuNPs, a higher reduction of the SF value was observed in cells previously incubated with RGD-PEG2000-AuNPs10nm (p = 0.021113). After the 3 h incubation with AuNPs, the decrease in the SF was also observed, but it was not significant. One difference appeared between the smallest and the biggest AuNPs (p = 0.009638), but the SF of cells irradiated and previously incubated with RGD-PEG2000-AuNPs30nm had a higher value compared to the SF of cells irradiated alone. The identical situation appeared after the 24 incubation (p = 0.002095). The MCF12A cells occurred to be the most sensitive for AuNPs after this TP. The RGD-PEG800-AuNPs10nm caused the highest decrease of the SF (p = 0.009378). Moreover, the reduced SF after the incubation with RGD-PEG2000-AuNPs10nm was statistically lower than the SF after the incubation with RGD-PEG2000-AuNPs30nm (p = 0.012742).
The Relative γH2AX and P53 Level
The relative γH2AX level associated with the DNA damage after IR was analyzed (Figure 8). The values were compared during the time taking into account the effect caused by AuNPs. Considering the 30 min and 3 h incubation times, results were homogenous and no statistically significant difference was observed between γH2AX levels. After the 24 h incubation and IR, the RGD-PEG2000-AuNPs10nm caused a decrease in the relative γH2AX level compared to cells irradiated alone (p = 0.041141), cells irradiated and previously incubated with RGD-PEG800-AuNPs10nm (p = 0.003788), RGD-PEG800-AuNPs30nm (p = 0.002311) and RGD-PEG2000-AuNPs30nm (p = 0.020856). In contrast, in the MCF12A cells, statistically significant differences occurred after the 30 min incubation with AuNPs. Comparing the previously treated and non-treated with AuNPs cells, the difference was observed using RGD-PEG2000-AuNPs10nm (p = 0.000606). Moreover, analyzing the AuNPs with the same 10 nm size, the higher relative γH2AX level was noticed applying AuNPs with the longer PEG chain (p = 0.040624). Another difference was also noticed between cells previously exposed to the RGD-PEG2000-AuNPs10nm and RGD-PEG800-AuNPs30nm (p = 0.002907) where the bigger AuNPs gained a lower relative γH2AX level. Considering the effects caused by AuNPs with the same PEG2000 chain, the smaller AuNPs again generated a higher relative γH2AX level (p = 0.018677). Analyzing effects after the 3 h incubation, the increase in the relative γH2AX level was observed between cells irradiated alone and cells previously incubated with RGD-PEG800-AuNPs10nm (p = 0.017601) and RGD-PEG2000-AuNPs10nm (p = 0.017601). There was no difference between cells treated with the 30 nm AuNPs. While in the MDA-MB-231 cells, differences in relative γH2AX levels appeared after the 24 h of previous incubation with AuNPs, in the MCF12A cells, effects were comparable without differences.
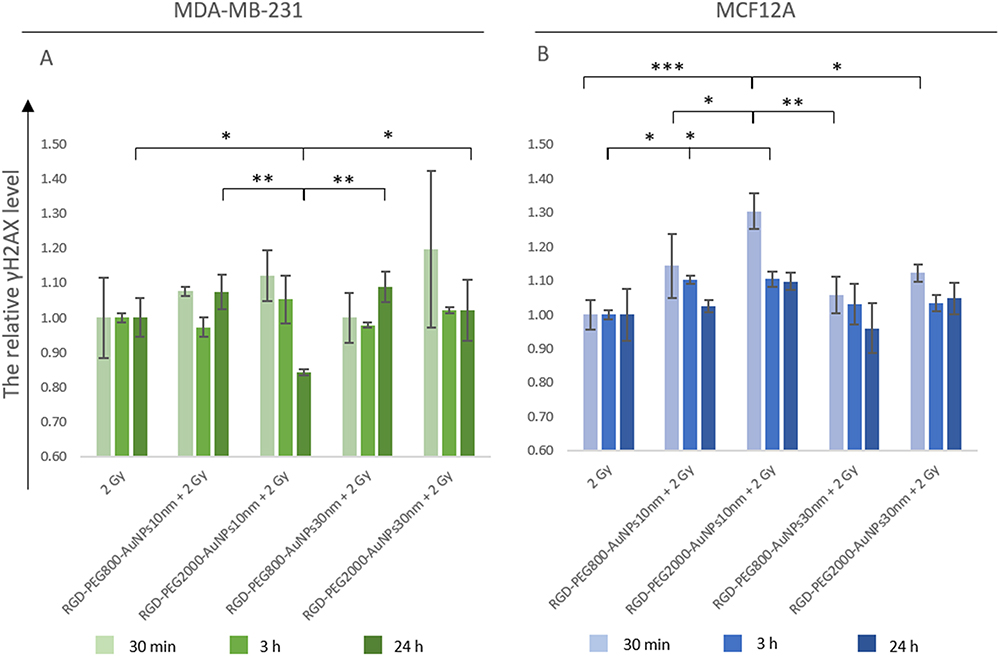 |
Figure 8 The relative γH2AX level of MDA-MB-231 (A) and MCF12A cells (B). Cells were previously incubated with AuNPs for 30 min, 3 and 24 h before irradiation of 2 Gy. The setting of the p-value was *p < 0.05, **p < 0.01, **p < 0.001. |
The relative P53 level was investigated after the IR and previous incubation with AuNPs following the same TPs (Figure 9). After the 30 min incubation before IR, the tendency of the increasing relative P53 level was noticed in cells previously treated with AuNPs, but results were not statistically significant. Considering the 3 h of incubation with AuNPs, the relative P53 level increased in cells treated with AuNPs before irradiation. The highest level was reached using RGD-PEG2000-AuNPs10nm (about 1.3 compared to the control group). The statistical comparison showed that results differed concerning cells irradiated and treated with RGD-PEG2000-AuNPs30nm. The p values were established as follows: comparing to cells irradiated alone – p = 0.00237, cells irradiated and treated with RGD-PEG800-AuNPs10nm – p = 0.009483, with RGD-PEG2000-AuNPs10nm – p = 0.005886 and RGD-PEG800-AuNPs30nm – p = 0.038195. After 24 h of AuNP incubation, the relative P53 level did not change. In MCF12A cells, there was no statistically significant difference between cells treated with diverse schemes. After 30 min of AuNP incubation, cells occurred with a decreasing trend of the relative P53 level compared to the control group. Analyzing longer incubation times, results presented similar effects.
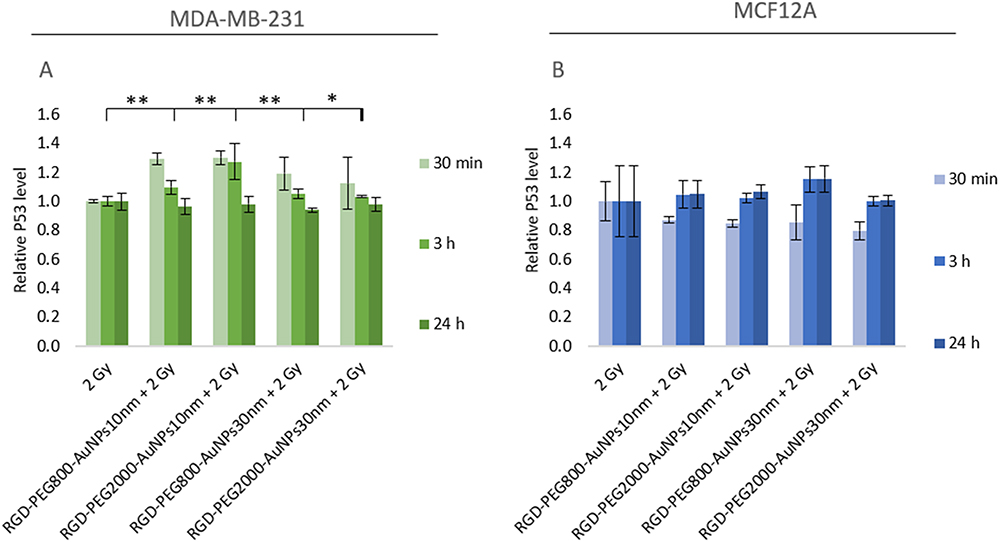 |
Figure 9 The relative P53 level of MDA-MB-231 (A) and MCF12A cells (B). Cells were previously incubated with AuNPs for 30 min, 3 and 24 h before irradiation of 2 Gy. The setting of the p-value was *p < 0.05, **p < 0.01. |
The immunofluorescence of MDA-MB-231 (Figure 10) and MCF12A (Figure 11) cells after the IR and previous incubation with AuNPs were performed to detect γH2AX (red color) and P53 foci (green color). The nucleus of cells was dyed with DAPI solution (blue color). The control group was not exposed to AuNPs and IR. To compare the effect of AuNPs added before IR, the group of cells exposed only to 2Gy was presented (D-F). Immunofluorescence was photographed using an Olympus IX83 microscope (Boston Industries, Inc., MA, USA).
 |
Figure 10 Immunofluorescence of MDA-MB-231 cells after irradiation and previous incubation with RGD-PEG800-AuNPs10nm, RGD-PEG2000-AuNPs10nm, RGD-PEG800-AuNPs30nm and RGD-PEG2000-AuNPs30nm. The concentration of AuNPs was 0.0004 mg/mL. Three different TPs of the cells incubation with AuNPs before irradiation were used (30 min, 3 and 24 h). Cells after being exposed to AuNPs and irradiated, were analyzed using immunofluorescence to detect γH2AX (red color) and P53 foci (green color). The nuclei of cells were dyed with DAPI solution (blue color). The control group was not exposed to AuNPs and IR (A–C). To compare the effect of AuNPs added before IR, the group of cells exposed only to 2 Gy was presented (D–F). Images show obtained results of MDA-MB-231 cells after exposition of 2 Gy and: the 30 min (G), 3 h (H), 24 h (I) previous incubation with RGD-PEG800-AuNPs10nm; the 30 min (J), 3 h (K), 24 h (L) previous incubation with RGD-PEG2000-AuNPs10nm; the 30 min (M), 3 h (N), 24 h (O) previous incubation with RGD-PEG800-AuNPs30nm and the 30 min (P), 3 h (R), 24 h (S) previous incubation with RGD-PEG2000-AuNPs30nm. Immunofluorescence was photographed using a Olympus IX83 microscope (Boston Industries, Inc., MA, USA). |
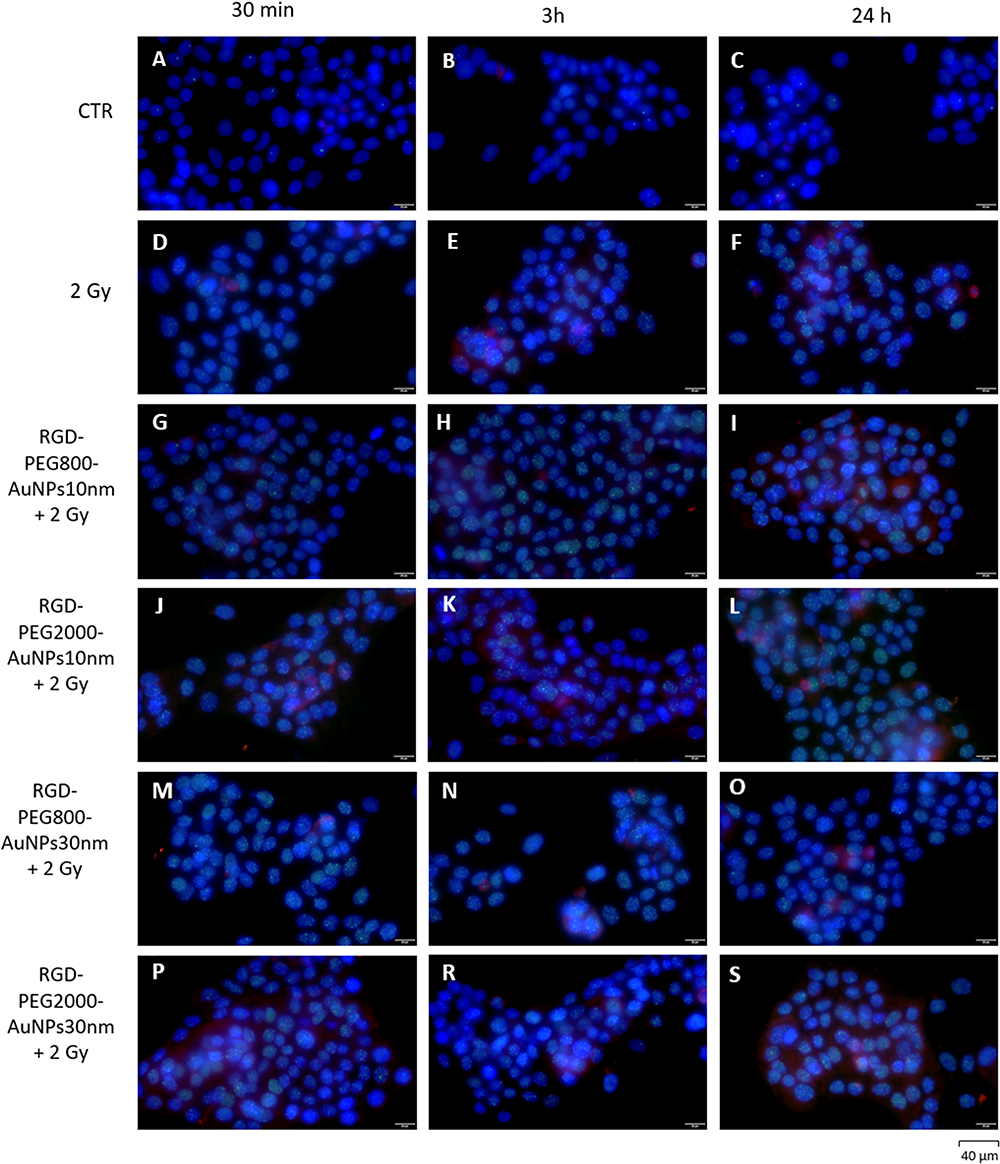 |
Figure 11 Immunofluorescence of MCF12A cells after irradiation and previous incubation with RGD-PEG800-AuNPs10nm, RGD-PEG2000-AuNPs10nm, RGD-PEG800-AuNPs30nm and RGD-PEG2000-AuNPs30nm. The concentration of AuNPs was 0.0004 mg/mL. Three different TPs of the cells incubation with AuNPs before irradiation were used (30 min, 3 and 24 h). Cells after exposition to AuNPs and IR were analyzed using immunofluorescence to detect γH2AX (red color) and P53 foci (green color). The nuclei of cells were dyed with DAPI solution (blue color). The control group was not exposed to AuNPs and IR (A–C). To compare the effect of AuNPs added before IR, the group of cells exposed only to 2 Gy was presented (D–F). Images show obtained results of MCF12A cells after exposition of 2 Gy and: the 30 min (G), 3 h (H), 24 h (I) previous incubation with RGD-PEG800-AuNPs10nm; the 30 min (J), 3 h (K), 24 h (L) previous incubation with RGD-PEG2000-AuNPs10nm; the 30 min (M), 3 h (N), 24 h (O) previous incubation with RGD-PEG800-AuNPs30nm and the 30 min (P), 3 h (R), 24 h (S) previous incubation with RGD-PEG2000-AuNPs30nm. Immunofluorescence was photographed using a Olympus IX83 microscope (Boston Industries, Inc., MA, USA). |
The Annexin V Results
The annexin V assay was performed to assess the apoptotic cells after the IR and previous incubation with AuNPs (Figure 12). In MDA-MB-231 cells, after 30 min of incubation, the increase of cells in early apoptosis was observed between cells exposed to 2 Gy with RGD-PEG2000-AuNPs10nm and cells irradiated alone (p = 0.0144). The percentage of cells in late apoptosis and dead cells did not differ compared to the control group in this TP. After the longer incubation time (3 h) with AuNPs, a higher value of early apoptotic cells was noticed considering cells incubated with RGD-PEG800-AuNPs10nm before irradiation and cells which were irradiated only (p = 0.019416). Moreover, a significant decrease was observed (p = 0.007075), comparing the percentage of early apoptosis in cells treated previously with the 10 nm AuNPs and 30 nm AuNPs with the same PEG800, where the reduction was noticed applying the AuNPs bigger in the size. Analyzing the percentage of dead cells, the tendency of increasing number was detected in this TP (after 3 h) considering cells previously treated with AuNPs, but differences were not significant. After 24 h incubation, results were homogenous without any diversity comparing the state of apoptosis in cells and different AuNPs treatments before the exposition to IR. The dominant percentage of cells after the 24 h incubation with AuNPs was related to the early apoptosis. In MCF12A cells, after 30 min of the incubation time with AuNPs before IR, cells did not present differences between percentages in diverse apoptotic states. A noticeable increase was observed in cells previously treated with RGD-PEG2000-AuNPs30nm compared to cells irradiated alone, but it was not statistically significant. In the next TP, the results occurred as highly heterogeneous. When the uptake was the highest, irradiated cells showed a significant increase in the percentage of early apoptosis. The lowest value was noticed for cells previously incubated with RGD-PEG800-AuNPs10nm (p = 0.000155) compared to cells irradiated alone. Considering the values of early apoptosis in cells treated with AuNPs before irradiation and cells irradiated alone, the differences were noticed for RGD-PEG2000-AuNPs10nm (p = 0.000168), RGD-PEG800-AuNPs30nm (p = 0.000469) and RGD-PEG2000-AuNPs30nm (p = 0.010065). Moreover, the tendency of the increasing percentage of cells in early apoptosis with the AuNP size escalation was observed. Taking into consideration the smallest and the biggest AuNPs in size and functionalization, the difference was on the level of p = 0.003005. Comparing the same PEG2000 chain, the decrease in the early apoptotic cells was detected by applying smaller AuNPs (p = 0.008984). Considering the percentage of cells in late apoptosis, the homogenous increase in the cells previously treated with RGD-PEG800-AuNPs10nm (p = 0.000606), RGD-PEG2000-AuNPs10nm (p = 0.001352), RGD-PEG800-AuNPs30nm (p = 0.01207) and RGD-PEG2000-AuNPs30nm (p = 0.01207) was noticed compared to the control group. The percentage of dead cells was similar in every group of cells in this TP. After 24 h of incubation with AuNPs, cells in early apoptosis and dead cells maintained the same distribution through different applied treatment schemes. Considering cells in late apoptosis, the trend of the increasing percentage of cells with the AuNP size escalation was detected. The highest difference was observed using RGD-PEG2000-AuNPs30nm (p = 0.015621).
 |
Figure 12 The annexin V assay result. After IR and the previous incubation with RGD-PEG800-AuNPs10nm, RGD-PEG2000-AuNPs10nm, RGD-PEG800-AuNPs30nm and RGD-PEG2000-AuNPs30nm cells were analyzed using the annexin V to assess the percentage of cells in each kind of apoptotic states. The concentration of AuNPs was 0,0004 mg/mL. Three different TPs of the cells incubation with AuNPs before irradiation were used (30 min, 3 and 24 h). The control group was not exposed to AuNPs. Plots show obtained results of MDA-MB-231 cells after exposition of 2 Gy and: the 30 min (A), 3 h (B), 24 h (C) previous incubation with AuNPs and MCF12A cells after exposition of 2 Gy and: the 30 min (D), 3 h (E), 24 h (F) previous incubation with AuNPs. The setting of the p-value was *p < 0.05, **p < 0.01, ***p < 0.001. |
Discussion
The radiosensitization effect of cancer cells is caused by many different factors. They can be divided into three categories. The first, most extensively researched category is related to the used nanomaterial and its modification or functionalization. The second is connected with the response of a specific type and subtype of cancer and the form in which it is tested (in vitro or in vivo model). The third, least proven, contains the experimental conditions, particularly time- and concentration-dependent methodology. It is confirmed that the impact of ionizing radiation is analyzed by dividing the effects over time into physical, chemical, and biological phases. Leaving aside this issue, the effect of radiosensitivity will be unexplained. Considering these, three categories of parameters affecting the efficiency of radiosensitivity induction, the effect of nanoparticle size, PEG chain length, and incubation time before irradiation on two different cell types were tested.
The use of non-immunogenic and biocompatible PEG molecules stabilizes the core size of the AuNPs while also regulating their surface charge, which affects their biodistribution. Kumar et al14 demonstrated the low cytotoxicity and biocompatibility of PEGylated AuNPs (pAuNPs) using Hela cells. Cell death after treatment with different concentrations of pAuNPs increased by 1.3–2.8 times when combined with in vitro X-ray irradiation compared to the control group (without pAuNPs). According to Yasui et al,15 PEGylated nano gels containing AuNPs combined with 220 kVp X-ray irradiation radiosensitized murine squamous cell carcinoma and Chinese hamster lung fibroblast V79. Radiosensitization may be caused by increased apoptosis and impaired DNA repair capacity caused by overexpression of endoplasmic reticulum stress-related proteins. Another in vitro study16 found that PEGylated AuNPs increased cellular uptake in B16F10 murine melanoma cells and caused radiosensitization when exposed to 6 MeV radiation.
Several groups investigated the cytotoxicity of gold nanoparticles. The general consensus is that gold nanoparticles are safe at low concentrations. However, at high concentrations, the results are still controversial and contradictory. Recent reviews emphasized gold nanoparticles’ size, shape, and concentration-dependent cytotoxicity.17 In our work, the AuNPs did not indicate the effects of toxicity in both kinds of cells. The BC cells appeared to be more vulnerable than normal cells, especially using higher concentrations of AuNPs bigger in the size. Considering effects in MCF12A cells, the promotion of proliferation was observed after the incubation with AuNPs. AuNPs of various diameters were used to study the proliferation of human periodontal ligament cells (hPDLCs) and human periodontal ligament stem cells (hPDLSCs) (20, 40, 60, and 80 nm).18 Only AuNPs with a diameter of 60 nm were able to effectively promote hPDLC and hPDLSC proliferation, whereas the other three AuNPs (20, 40, and 80 nm) inhibited proliferation. The continuation of this study revealed that 60 nm gold-particles at concentration 56µM have induced in hPDLSC cells elevated proliferation via modulation of the WNT/β-catenin pathway. Moreover, the studies regarding their effect onto different source of mesenchymal stem cells (MSC) have shown that the presence of AuNPs and their size can affect the differentiation process, especially into osteogenic and adipogenic tissue probably via ROS mechanism.19 This is related to the fact that at small doses, ROS are proliferative agent in many cells;20 however, we were unable to determine the exact ROS level in our study. Scientists21 reported that long-term exposure has been linked to increased cell resistance to AgNPs. This motivated authors to study if AgNPs may cause a hormetic reaction. A low dosage pretreatment of A549 human epithelial cells with AgNPs elicited protection against a hazardous dose of AgNPs. This type of stimulation has been referred to as hormesis.22 Another research group23 determined the study of cell viability to detect the cytotoxicity of AuNPs for K562 cells. A viability assay was used to assess cytotoxicity after 48 hours of culture in the presence of the AuNPs. They observed that the low concentration of gold (75 g/mL) had no obvious effect on cell viability and no cytotoxicity. The high concentration of gold (150 mg/mL) indicated a slight decrease in cell viability. Cell viabilities are 93.9%, 96.7%, 93.3%, 77.5%, 68.8%, and 41.8%, respectively, corresponding to 18.75, 37.5, 75, 150, 300, and 600 g/mL gold. Based on the cytotoxicity results and our previous work,9 the three AuNP concentrations were chosen for further analysis; 0.0004, 0.0008, and 0.0012 mg/mL.
The next step was to determine the AuNPs’ internalization by cells. The wide range of TPs was used to find a possible point of the highest cellular uptake. The TPs of 30 min, 1, 3, 6, and 24 h were used. In MDA-MB-231 cells the highest peak was reached after the 3 h incubation, whereas, in MCF12A cells the maximum internalization was observed after 6 h. Moreover, there was no difference between concentrations. Due to this, the lowest one was used for further analysis as the one which cause the highest uptake and simultaneously no toxicity. In research, NPs enter cells via a variety of mechanisms, including clathrin-mediated endocytosis, clathrin-caveolin independent endocytosis, and caveolae-mediated endocytosis.24 The majority of NPs, including AuNPs, enter the cell primarily through clathrin-mediated or receptor-mediated endocytosis (RME).25 The RME process’s efficiency is determined by the interaction of molecules on the NP surface (ligands) with cell membrane receptors. The RME is also affected by NP size, shape, and surface properties. Chithrani et al26 investigated the effect of both size and shape on AuNP internalization. Bare AuNPs with a diameter of 50 nm had the highest uptake in the size range of 10–100 nm. They also discovered that rod-shaped NPs had lower cellular uptake than their spherical counterparts. This result was explained as the result of a balance between the energy required for NP membrane wrapping and the kinetics of receptor diffusion across the cell membrane.27 AuNPs’ pharmacokinetics can be influenced by a variety of factors. AuNPs will have a different fate in vivo depending on their size.8 The in vivo distribution showed that smaller PEGylated AuNPs (4 nm and 13 nm) had high blood levels for 24 hours and were cleared after 7 days, whereas larger AuNPs (100 nm) were cleared after 24 hours. Furthermore, accumulation of smaller AuNP in the liver and spleen peaked after 7 days, and in the mesenteric lymph node after a month, followed by clearance after 6 months. Within 30 minutes, larger AuNPs were taken up by the liver, spleen, and mesenteric lymph nodes. Larger AuNPs were concentrated in the kidney and spleen, while smaller AuNPs were found in more organs.28 Furthermore, changing the surface charges of AuNPs might cause changes in the cellular internalization. Multiple studies have thoroughly established the systematic assessment of numerous characteristics such as NPs size, shape, and surface charge in controlling uptake efficiency.29 In our study, the zeta potential of obtained AuNPs indicated the negative charge on the AuNPs’ surface. Due to this characteristic, the uptake was probably enhanced according to the study published by Sujai et al.30 Surface-enhanced Raman spectroscopy (SERS) was used to track the uptake efficiency and penetration phenomenon of AuNPs in the size of 40–50 nm using three different surface charges in monolayer (2D) cells, multicellular spheroids (3D), and in vivo tumors. While positively charged AuNPs had a two-fold increase in internalization in monolayer cells, SERS-tag based line scanning on multi-layered tumor spheroids revealed that negatively charged AuNPs had a nearly nine-fold higher penetrating capability. Furthermore, the improved solid tumor dispersion provided by the negatively charged AuNPs particles may significantly increase their therapeutic value in cancer therapy. Another authors31 investigated the transport of 10 nm AuNPs with varying surface charges (neutral, negative, and positive) via a hydrogel composite. 3D in vitro models of BC cells loaded in the hydrogel composite were utilized to assess the qualitative and quantitative absorption of AuNPs. Surprisingly, an inverse relationship between nanoparticle diffusion coefficients and cellular uptake was discovered. Although positively charged AuNPs had strong cellular absorption, their diffusion coefficient indicated delayed transit across the hydrogel matrix. Neutral particles, on the other hand, exhibited rapid diffusion but minimal cellular absorption.
As reported by Chen et al,4 AuNP radiosensitization’s “chemical mechanisms” are primarily involved in radical reactions and/or inducing activation of “open” chromatin structures, which makes DNA more vulnerable to radiation-induced damage. Two possible chemical mechanisms were proposed based on AuNP subcellular localization: 1) Chemical sensitization of DNA to radiation-induced damage; 2) AuNP activation surface increases radical generation and catalysis. The former mechanism necessitates the nuclear localization of AuNPs to bind to DNA. However, in most studies, AuNPs are restricted to the endo/lysosomal cytoplasm. Alternatively, the catalytic effect of AuNPs promotes electron transfer and the production of ROS via the interaction between activated surface and molecular oxygen, and the catalytic performance is enhanced when combined with X-ray radiation. The increased ROS is closely related to the emission of photons and Auger electrons from AuNPs, as well as secondary radiolysis of water, resulting in indirect oxidative damage to DNA, proteins, and lipid membranes, which initiates apoptosis/death.32
In our study, the ROS induction level was detected in short periods of time. The ROS level was checked every 10 min in both cell lines. Interestingly, changes were noticed only in a BC cell line. The highest peak was reached after 30 min, especially using RGD-PEG800-AuNPs30nm. Analyzing effects obtained after the incubation with each AuNP kind, the decrease was observed in 40 min. For this reason, the selected TP of incubation with AuNPs before IR was 30 min to observe whether the SF value changes with the increasing ROS level. The interaction of free radicals and ROS produced by water radiolysis with various cellular biomolecules, resulting in apoptosis/death, is one of the main mechanisms of radiation-induced cell death.33 ROS, such as superoxide anion radicals, hydrogen peroxide, and hydroxyl radicals, can cause cell damage directly by interacting with biomolecules such as cellular DNA, or they can cause cell apoptosis or necrosis indirectly by oxidizing lipids, proteins, and DNA, as well as mitochondrial dysfunction. As previously stated, AuNPs of various sizes, shapes, and surface functions can effectively induce ROS formation.
Moreover, the mitochondrial membrane potential after the incubation of MDA-MB-231 and MCF12A cells with AuNPs was checked. To detect specified time differences, the level of mitochondrial damage was detected per 5 min of the incubation with AuNPs. The dominant trend was that smaller AuNPs cause a lower mitochondrial membrane potential from the 10 min of incubation in BC cells, but the highest level was observed after the 25 min using RGD-PEG800-AuNPs30nm. In MCF12A cells, the increase was noticed after 20 min of the incubation time. Comparing various size and functionalization of AuNPs, there was no difference in inducting mitochondrial damage between them. Mitochondria are thought to be the “energy powerhouse of cells”. It is one of the critical targets that must not be overlooked during the radiosensitization process.34 Apoptosis or cellular death may result from oxidative stress-induced mitochondrial dysfunction, which includes mitochondrial DNA damage, cytochrome C mobilization, and other biological effects.35 Furthermore, it was proposed that inhibiting proteins involved in maintaining cellular oxidative homeostasis (such as thioredoxin reductase TrxR1) may result in AuNP-induced oxidative stress.36 Our assumption associated with the mitochondrial damage is that the uptake must not be the highest to generate the increased ROS levels. They might be detected before the maximum AuNP internalization because of the presence in the cell culture media and in the intracellular area. Another explanation could be related to that cancer cells have higher internal ROS levels due to their biology – increased metabolism and proliferation, which generate cells adapted to the stressful conditions. The addition of exogenous factors, such as AuNPs, could be overcome to our advantage by crossing the line and enhancing the ROS production causing damage to the cell.37 On the other hand, the malignant cells have better accommodation to that conditions, which may correspond to better endurance than normal non-cancerous cells, as well as more efficient mechanisms. Next, the generated ROS could induce the mitochondrial damage.38 Analyzing effects of AuNPs on the molecular and cellular level, the consideration should be divided into the time-dependent manner. ROS are short-lived radicals, and we indicated the ROS decrease after 40 min of the incubation with AuNPs. In the MCF12A cells, the ROS production was not detected, so the mitochondrial damage in this kind of cells must have another reason. In the future, the analysis of another possible backgrounds of mitochondrial damage in normal cell line should be performed.
Another considered cause of radiosensitization effects is related to diverse cell cycle distribution after the incubation with AuNPs. The cell cycle phase is thought to be critical to the radiotherapeutic mechanism.39 When a therapeutic agent, such as AuNPs, is used to accumulate cells in the G2/M phase while decreasing cells in the G0/G1 phase, radiosensitivity is increased.40 In our analysis, the percentage of cells in each cell cycle phase did not alter. Also, in this case, the 3 different TPs of the incubation with AuNPs were taken into consideration. Slight changes in cell cycle distribution were observed in MCF12A cells, but they were not associated with radiosensitization effects highlighted in literature data.41 A higher accumulation was observed in the G1 phase which did not induce radiosensitivity in cells. Roa et al42 presented results of radiosensitization effects associated with the cell cycle altered by AuNPs. They showed that the level of cellular uptake of AuNPs and the cell cycle changes induced by AuNPs varied over time and between cancerous and non-cancerous cells, resulting in varying degrees of radiosensitivity enhancement. The authors suggested that a “kinetic” approach to AuNPs enhanced radiotherapy will be required, with an emphasis on the importance of AuNPs administration timing. The greatest IR sensitization caused by AuNPs occurred at 6 h when the highest RCGG (RCGG = value of G2/M (%)/value of G0/G1 (%)) value was obtained. As a result, the in vitro RCGG value may be useful in optimizing the schedule of the AuNPs administration to maximize radiation sensitivity.
In this work, the decrease in the SF after the treatment with 0.0004 mg/mL AuNPs and 2 Gy was noticed after the 30 min incubation in MDA-MB-231 cells. The most effective was the RGD-PEG800-AuNPs30nm, which also caused the highest ROS levels and mitochondrial damage. Smaller AuNPs functionalized with the same PEG chain induced a similar reduction. Here, the importance of the PEG chain was highlighted, and the same AuNPs functionalized with the PEG chain different in the length acted variously. The longer incubation times did not result in an SF decrease after IR. In MCF12A cells, the decrease of SF was observed after 30 min and 24 h of incubation with AuNPs. The causes of radiosensitization effects in the shorter period time could be similar to those in the BC cell lines, whereas there might also be long-term effects that determined the decrease in the longer TP. The same SF reduction was noticed using RGD-PEG2000-AuNPs10nm and RGD-PEG800-AuNPs30nm in the 30 min incubation. In contrast, after the 24 h time, the RGD-PEG800-AuNPs10nm in combination with 2 Gy induced the lowest level of SF. It showed that MCF12A cells are more sensitive to combined treatment using AuNPs and IR, but also that shorter incubation time with AuNPs before irradiation should be taken into account. Butterworth et al43 carried out time-course tests to assess the impact of gold nanoparticles on cell survival in the absence of radiation. They also determined the nanoparticle incubation period before irradiation. In the absence of X–irradiation, AuNPs produced a variable response within the first 2 h, before dropping to a plateau level of around 80% after 4 h. Cells exposed to a single 4 Gy radiation dose had an average surviving fraction of 0.52. When AuNPs were combined with 4 Gy X-rays, the surviving fraction of cells was significantly reduced to 0.32 when irradiated 1 hour after the addition of gold nanoparticles. An another group investigated the radiosensitization effect of glucose-capped AuNPs (Glu-AuNPs) in various diameters (16 nm and 49 nm) on MDA-MB-231 cells applying megavoltage X-rays.44 The microscopical images revealed that Glu-AuNPs are mostly found in cells’ cytoplasm, including endosomes and lysosomes. According to an uptake, MDA-MB-231 cells absorbed more 49-nm Glu-AuNPs than 16-nm Glu-AuNPs. Glu-AuNPs had little cytotoxicity against MDA-MB-231 cells at concentrations less than 20 nM. In the clonogenic assay, the combination of Glu-AuNPs and radiation inhibited growth significantly more than radiation alone. Furthermore, 49-nm Glu-AuNPs induced significantly greater radiation effects than 16-nm Glu-AuNPs. Flow cytometry demonstrated that Glu-AuNPs induced cellular arresting in the G2/M phase, with 49-nm Glu-AuNPs having a greater effect than 16-nm Glu-AuNPs. The radiosensitizing impact of AuNPs is highly dependent on tumor targeting effectiveness. In order to induce the selectivity of AuNP performance between BC and normal cells, another kind of functionalization should be implemented. Folic acid and glutamine might be used as agents targeting AuNPs to BC cells. Researchers presented the study aiming to indicate the most efficient targeting functionalization for BSA-AuNPs.45 The Glucose-BSA-AuNPs, glutamine-BSA-AuNPs, and folic acid-BSA-AuNPs were used. Folic acid and glutamine decorations improved the tumor targeting performance of BSA-AuNPs, with gold accumulation increasing by 2.1 and 2.4 times, respectively, when compared to BSA-AuNPs. In comparison to BSA-AuNPs, they had the maximum radiosensitizing effectiveness and produced a 33% reduction in tumor volume following 6 Gy radiation treatment. As a result, the addition of glutamine and folic acid to BSA-AuNPs can greatly improve tumor targeting and therapeutic effectiveness as a radiosensitizer.
Double-strand breaks (DSBs) in DNA are the primary lethal type of radiation-induced damage and are associated with the survival capacity of cells. When DNA DSB repair fails, it affects genomic stability, which causes cell death in a variety of ways. The earliest sensitive markers are thought to be phosphorylated histone variants – H2AX and p53-binding protein 1 (53BP1).46 Many experiments showed the dynamic monitoring of H2AX and 53BP1 foci associated with DNA repair after radiation exposure in combination with AuNPs.47 In our study, the relative γH2AX and P53 levels were analyzed. Analyzing the incubation TPs, the significant decrease in the γH2AX level was observed only after the 24 h previous incubation with RGD-PEG2000-AuNPs10nm, whereas the same kind of AuNPs generated the increase in MCF12A cells but after the 3 h incubation. The highest relative γH2AX escalation was noticed after the 30 min and 3 h incubation with AuNPs before IR in MCF12A cells using AuNPs in the size of 10 nm. This result might be associated with the lowest SF level obtained in this cell line, suggesting that smaller AuNPs could play a potential role in generating a higher quantity of DSBs. Analyzing the P53 relative level in MDA-MB-231 cells, there was an increase after the 3 h of incubation time. It suggested that P53 generation, after incubation with AuNPs and IR, might be related to the highest uptake in BC cells, whereas in MCF12A cells there was no noticeable change. Moreover, taking into consideration the apoptosis generation in cells incubated with AuNPs before irradiation, the highest differences were also detected in the TP of 3h. In MDA-MB-231 cells, the rising participation in the percentage distribution was noticed in cells with early apoptosis, while in the MCF12A line, the increase occurred in cells in late apoptosis using the same TP. These results suggested that the parameter of the incubation time plays a crucial role in the radiobiological response in different kinds of cells, and it should be investigated further.
López-Valverde et al48 demonstrated that dose enhancement could be used in treatment planning to calculate dose distribution and increase the dose in the tumor volume while decreasing the dose in the organ at risk. With an energy beam close to 1MeV, the proposed AuNP presented therapeutic efficacy as a radiotherapy dose enhancer. Based on in silico experiments with accurate modeling of the physical problem, dose enhancement was increased to 16% in these conditions. In vitro experiments using H2AX foci methodology yielded even more promising results on radiosensitization, with a 46% improvement. Because this dose enhancement occurred at the cell level, AuNP implementation is part of the precision medicine role in future radiotherapy. Different parameters in AuNPs generated by radiosensitivity are under investigation. The authors49 highlighted a new kind of factor associated with the radiosensitization effect such as tumor microenvironment (TME). They observed that cancer-associated fibroblasts (CAFs) enhanced pancreatic cancer cell growth, whereas this type of TME cells incorporated more AuNPs than cancer cells. Furthermore, after IR, the co-cultured cells showed a significant reduction in DNA DSBs compared to the monoculture. When cancer cells are grown in co-culture with CAFs, the results show evidence of radiation resistance. In both monoculture and co-cultures of cancer cells and CAFs, the incorporation of AuNPs in RT caused a significant radiosensitization effect compared to IR alone. This paves the way for new treatment modalities that use AuNPs as a radiosensitizing agent to target both cell lines. More research is needed to determine the precise mechanism of CAF radioresistance in co-culture.
Conclusion
In our work, a complex explanation of the radiosensitization causes was proposed. Based on our previous article9 and the current study, it is evident that the time- and concentration-dependent manner is crucial in the AuNPs implementation in radiotherapy. Our results highlighted the strong need for assessing the experimental conditions’ optimization before the AuNPs will be implemented with IR. Moreover, results indicated that AuNPs did not act universally in cells. Each kind of cell line responds differently considering AuNPs size, functionalization, and incubation time. AuNPs could be a promising tool as a radiotherapy sensitizing agent, but it should be specified and deeply investigated under what conditions it will be applied taking into consideration not only AuNPs modifications but also the cellular or animal model and experimental conditions.
Abbreviations
BC, breast cancer; RT, radiotherapy; IR, irradiation; AuNPs, Au nanoparticles; ROS, Reactive oxygen species; REG, Polyethylene glycol; RGD, arginyl-glycyl-aspartic acid; DSB, double-strand break; FBS, fetal bovine serum; P/S, penicillin/streptomycin; EGF, epidermal growth factor; PBS, Phosphate Buffered Saline; SSC, side scatter parameter; MTT, 3-(4,5-dimethylthiazol-2-yl)-2,5-diphenyltetrazolium bromide; DCFH-DA, 2’,7’-Dichlorofluorescin Diacetate; FITC-H, fluorescein isothiocyanate-height; JC-1, mitochondrial membrane potential assay; CCCP, carbonyl cyanide m-chlorophenyl hydrazone; PE, phycoerythrin-height; SF, Surviving fraction; hPDLCs, human periodontal ligament cells; hPDLSCs, human periodontal ligament stem cells; RME, receptor-mediated endocytosis.
Acknowledgments
This research was funded by a grant no. 5/05/2021/prb/wco/004 from Greater Poland Cancer Centre.
Disclosure
The authors report no conflicts of interest in this work.
References
1. Ajnai G, Chiu A, Kan T, Cheng CC, Tsai TH, Chang J. Trends of gold nanoparticle-based drug delivery system in cancer therapy. J Exp Clin Med. 2014;6(6):172–178. doi:10.1016/j.jecm.2014.10.015
2. Cooper DR, Bekah D, Nadeau JL, Pannico M, Mensitieri G. Gold nanoparticles and their alternatives for radiation therapy enhancement. Front Chem. 2014;2:2. doi:10.3389/fchem.2014.00086
3. Hainfeld JF, Dilmanian FA, Slatkin DN, Smilowitz HM. Radiotherapy enhancement with gold nanoparticles. J Pharm Pharmacol. 2010;60(8):977–985. doi:10.1211/jpp.60.8.0005
4. Chen Y, Yang J, Fu S, Wu J. Gold nanoparticles as radiosensitizers in cancer radiotherapy. IJN. 2020;15:9407–9430. doi:10.2147/IJN.S272902
5. Bromma K, Chithrani DB. Advances in gold nanoparticle-based combined cancer therapy. Nanomaterials. 2020;10(9):1671. doi:10.3390/nano10091671
6. Jin H, Heller DA, Sharma R, Strano MS. Size-dependent cellular uptake and expulsion of single-walled carbon nanotubes: single particle tracking and a generic uptake model for nanoparticles. ACS Nano. 2009;3(1):149–158. doi:10.1021/nn800532m
7. Liu M, Li Q, Liang L, et al. Real-time visualization of clustering and intracellular transport of gold nanoparticles by correlative imaging. Nat Commun. 2017;8(1):15646. doi:10.1038/ncomms15646
8. Cho WS, Cho M, Jeong J, et al. Size-dependent tissue kinetics of PEG-coated gold nanoparticles. Toxicol Appl Pharmacol. 2010;245(1):116–123. doi:10.1016/j.taap.2010.02.013
9. Musielak M, Boś-Liedke A, Piwocka O, et al. The role of functionalization and size of gold nanoparticles in the response of MCF-7 Breast cancer cells to ionizing radiation comparing 2D and 3D in vitro models. Pharmaceutics. 2023;15(3):862. doi:10.3390/pharmaceutics15030862
10. Schulz F, Homolka T, Bastús NG, Puntes V, Weller H, Vossmeyer T. Little adjustments significantly improve the turkevich synthesis of gold nanoparticles. Langmuir. 2014;30(35):10779–10784. doi:10.1021/la503209b
11. Wang M, Liu Y, Zhang X, et al. Gold nanoshell coated thermo-pH dual responsive liposomes for resveratrol delivery and chemo-photothermal synergistic cancer therapy. J Mater Chem B. 2017;5(11):2161–2171. doi:10.1039/C7TB00258K
12. Yang J, Chithrani B. Nuclear targeting of gold nanoparticles for improved therapeutics. CTMC. 2015;16(3):271–280. doi:10.2174/1568026615666150701115012
13. Park J, Ha MK, Yang N, Yoon TH. Flow cytometry-based quantification of cellular au nanoparticles. Anal Chem. 2017;89(4):2449–2456. doi:10.1021/acs.analchem.6b04418
14. Kumar R, Korideck H, Ngwa W, Berbeco RI, Makrigiorgos GM, Sridhar S. Third generation gold nanoplatform optimized for radiation therapy. Transl Cancer Res. 2013;2(4). doi:10.3978/j.issn.2218-676X.2013.07.02
15. Yasui H, Takeuchi R, Nagane M, et al. Radiosensitization of tumor cells through endoplasmic reticulum stress induced by PEGylated nanogel containing gold nanoparticles. Cancer Lett. 2014;347(1):151–158. doi:10.1016/j.canlet.2014.02.005
16. Mousavi M, Nedaei HA, Khoei S, et al. Enhancement of radiosensitivity of melanoma cells by pegylated gold nanoparticles under irradiation of megavoltage electrons. Int J Radiat Biol. 2017;93(2):214–221. doi:10.1080/09553002.2017.1231944
17. Lewinski N, Colvin V, Drezek R. Cytotoxicity of Nanoparticles. Small. 2008;4(1):26–49. doi:10.1002/smll.200700595
18. Li C, Li Z, Wang Y, Liu H. Gold nanoparticles promote proliferation of human periodontal ligament stem cells and have limited effects on cells differentiation. J Nanomater. 2016;2016:1–10. doi:10.1155/2016/1431836
19. Abdal Dayem A, Lee S, Cho SG. The impact of metallic nanoparticles on stem cell proliferation and differentiation. Nanomaterials. 2018;8(10):761. doi:10.3390/nano8100761
20. Day RM, Suzuki YJ. Cell proliferation, reactive oxygen and cellular glutathione. Dose-Response. 2005;3(3):dose–response.0. doi:10.2203/dose-response.003.03.010
21. Sthijns MM, Thongkam W, Albrecht C, et al. Silver nanoparticles induce hormesis in A549 human epithelial cells. Toxicol in Vitro. 2017;40:223–233. doi:10.1016/j.tiv.2017.01.010
22. Iavicoli I, Calabrese EJ, Nascarella MA. Exposure to Nanoparticles and Hormesis. Dose-Response. 2010;8(4). doi:10.2203/dose-response.10-016.Iavicoli
23. Zhang XD, Guo ML, Wu HY, et al. Irradiation stability and cytotoxicity of gold nanoparticles for radiotherapy. Int J Nanomedicine. 2009;4:165–173. doi:10.2147/ijn.s6723
24. Foroozandeh P, Aziz AA. Insight into cellular uptake and intracellular trafficking of nanoparticles. Nanoscale Res Lett. 2018;13(1):339. doi:10.1186/s11671-018-2728-6
25. Chithrani DB. Optimization of bio-nano interface using gold nanostructures as a model nanoparticle system. Insciences J. 2011;115–135. doi:10.5640/insc.0103115
26. Chithrani BD, Ghazani AA, Chan WCW. Determining the size and shape dependence of gold nanoparticle uptake into mammalian cells. Nano Lett. 2006;6(4):662–668. doi:10.1021/nl052396o
27. Gao H, Shi W, Freund LB. Mechanics of receptor-mediated endocytosis. Proc Natl Acad Sci USA. 2005;102(27):9469–9474. doi:10.1073/pnas.0503879102
28. Li X, Hu Z, Ma J, et al. The systematic evaluation of size-dependent toxicity and multi-time biodistribution of gold nanoparticles. Colloids Surf B Biointerfaces. 2018;167:260–266. doi:10.1016/j.colsurfb.2018.04.005
29. Cho EC, Xie J, Wurm PA, Xia Y. Understanding the role of surface charges in cellular adsorption versus internalization by selectively removing gold nanoparticles on the cell surface with a I 2 /KI etchant. Nano Lett. 2009;9(3):1080–1084. doi:10.1021/nl803487r
30. Sujai PT, Joseph MM, Saranya G, Nair JB, Murali VP, Maiti KK. Surface charge modulates the internalization vs. penetration of gold nanoparticles: comprehensive scrutiny on monolayer cancer cells, multicellular spheroids and solid tumors by SERS modality. Nanoscale. 2020;12(13):6971–6975. doi:10.1039/D0NR00809E
31. Valente KP, Suleman A, Brolo AG. Exploring diffusion and cellular uptake: charged gold nanoparticles in an in vitro breast cancer model. ACS Appl Bio Mater. 2020;3(10):6992–7002. doi:10.1021/acsabm.0c00872
32. Dimitriou NM, Tsekenis G, Balanikas EC, et al. Gold nanoparticles, radiations and the immune system: current insights into the physical mechanisms and the biological interactions of this new alliance towards cancer therapy. Pharmacol Ther. 2017;178:1–17. doi:10.1016/j.pharmthera.2017.03.006
33. Rosa S, Connolly C, Schettino G, Butterworth KT, Prise KM. Biological mechanisms of gold nanoparticle radiosensitization. Cancer Nano. 2017;8(1):2. doi:10.1186/s12645-017-0026-0
34. Mkandawire MM, Lakatos M, Springer A, et al. Induction of apoptosis in human cancer cells by targeting mitochondria with gold nanoparticles. Nanoscale. 2015;7(24):10634–10640. doi:10.1039/C5NR01483B
35. Mateo D, Morales P, Ávalos A, Haza AI. Oxidative stress contributes to gold nanoparticle-induced cytotoxicity in human tumor cells. Toxicol Mech Methods. 2014;24(3):161–172. doi:10.3109/15376516.2013.869783
36. Liu R, Wang Y, Yuan Q, An D, Li J, Gao X. The Au clusters induce tumor cell apoptosis via specifically targeting thioredoxin reductase 1 (TrxR1) and suppressing its activity. Chem Commun. 2014;50(73):10687. doi:10.1039/C4CC03320E
37. Nakamura H, Takada K. Reactive oxygen species in cancer: current findings and future directions. Cancer Sci. 2021;112(10):3945–3952. doi:10.1111/cas.15068
38. Hayes JD, Dinkova-Kostova AT, Tew KD. Oxidative stress in cancer. Cancer Cell. 2020;38(2):167–197. doi:10.1016/j.ccell.2020.06.001
39. Formenti SC, Symmans WF, Volm M, et al. Concurrent paclitaxel and radiation therapy for breast cancer. Semin Radiat Oncol. 1999;9(2 Suppl 1):34–42.
40. Zoli W, Ricotti L, Barzanti F, et al. Schedule-dependent interaction of doxorubicin, paclitaxel and gemcitabine in human breast cancer cell lines. Int J Cancer. 1999;80(3):413–416. doi:10.1002/(SICI)1097-0215(19990129)80:3<413::AID-IJC13>3.0.CO;2-I
41. Musielak M, Boś-Liedke A, Piotrowski I, Kozak M, Suchorska W. The role of gold nanorods in the response of prostate cancer and normal prostate cells to ionizing radiation—in vitro model. IJMS. 2020;22(1):16. doi:10.3390/ijms22010016
42. Roa W, Zhang X, Guo L, et al. Gold nanoparticle sensitize radiotherapy of prostate cancer cells by regulation of the cell cycle. Nanotechnology. 2009;20(37):375101. doi:10.1088/0957-4484/20/37/375101
43. Butterworth KT, Coulter JA, Jain S, et al. Evaluation of cytotoxicity and radiation enhancement using 1.9 nm gold particles: potential application for cancer therapy. Nanotechnology. 2010;21(29):295101. doi:10.1088/0957-4484/21/29/295101
44. Wang C, Jiang Y, Li X, Hu L. Thioglucose-bound gold nanoparticles increase the radiosensitivity of a triple-negative breast cancer cell line (MDA-MB-231). Breast Cancer. 2015;22(4):413–420. doi:10.1007/s12282-013-0496-9
45. Kefayat A, Ghahremani F, Motaghi H, Mehrgardi MA. Investigation of different targeting decorations effect on the radiosensitizing efficacy of albumin-stabilized gold nanoparticles for breast cancer radiation therapy. Eur J Pharm Sci. 2019;130:225–233. doi:10.1016/j.ejps.2019.01.037
46. Djuzenova CS, Elsner I, Katzer A, et al. Radiosensitivity in breast cancer assessed by the histone γ-H2AX and 53BP1 foci. Radiat Oncol. 2013;8(1):98. doi:10.1186/1748-717X-8-98
47. Jain S, Coulter JA, Hounsell AR, et al. Cell-specific radiosensitization by gold nanoparticles at megavoltage radiation energies. Int J Radiat Oncol Biol Phys. 2011;79(2):531–539. doi:10.1016/j.ijrobp.2010.08.044
48. López-Valverde JA, Jiménez-Ortega E, Leal A. Clinical feasibility study of gold nanoparticles as theragnostic agents for precision radiotherapy. Biomedicines. 2022;10(5):1214. doi:10.3390/biomedicines10051214
49. Alhussan A, Palmerley N, Smazynski J, et al. Potential of gold nanoparticles in current radiotherapy using a co-culture model of cancer cells and cancer associated fibroblasts. Cancers. 2022;14(15):3586. doi:10.3390/cancers14153586
 © 2023 The Author(s). This work is published and licensed by Dove Medical Press Limited. The
full terms of this license are available at https://www.dovepress.com/terms
and incorporate the Creative Commons Attribution
- Non Commercial (unported, 3.0) License.
By accessing the work you hereby accept the Terms. Non-commercial uses of the work are permitted
without any further permission from Dove Medical Press Limited, provided the work is properly
attributed. For permission for commercial use of this work, please see paragraphs 4.2 and 5 of our Terms.
© 2023 The Author(s). This work is published and licensed by Dove Medical Press Limited. The
full terms of this license are available at https://www.dovepress.com/terms
and incorporate the Creative Commons Attribution
- Non Commercial (unported, 3.0) License.
By accessing the work you hereby accept the Terms. Non-commercial uses of the work are permitted
without any further permission from Dove Medical Press Limited, provided the work is properly
attributed. For permission for commercial use of this work, please see paragraphs 4.2 and 5 of our Terms.