
Back to Journals » Journal of Pain Research » Volume 19
Metabolomic Insights into Reprogrammed Caffeine Metabolism in the Hippocampus of Myofascial Pain Syndrome Rats
Authors Sheng D, Meng Y, An S, Wu Z, Yao J, Huang Y, Wang L
Received 1 August 2025
Accepted for publication 18 December 2025
Published 11 February 2026 Volume 2026:19 557588
DOI https://doi.org/10.2147/JPR.S557588
Checked for plagiarism Yes
Review by Single anonymous peer review
Peer reviewer comments 2
Editor who approved publication: Dr Alaa Abd-Elsayed
Duanyang Sheng,1,* Yujie Meng,1,* Songsong An,1 Zhenqi Wu,1 Jing Yao,2 Yuanxin Huang,2 Lin Wang2
1School of Anesthesiology, Guizhou Medical University, Guiyang, Guizhou, 550004, People’s Republic of China; 2Pain Department, Affiliated Hospital of Guizhou Medical University, Guiyang, Guizhou, 550004, People’s Republic of China
*These authors contributed equally to this work
Correspondence: Lin Wang, Department of Pain, Affiliated Hospital of Guizhou Medical University, No. 28 Guiyi Street, Yunyan District, Guiyang, Guizhou, 550004, People’s Republic of China, Email [email protected] Yuanxin Huang, Department of Pain, Affiliated Hospital of Guizhou Medical University, No. 28 Guiyi Street, Yunyan District, Guiyang, Guizhou, 550004, People’s Republic of China, Email [email protected]
Purpose: The objective of this investigation was to examine the histopathological alterations in the rat hippocampus induced by myofascial trigger points (MTrPs), assess hippocampal neuronal excitability by measuring c-fos protein expression, and Non-targeted metabolomics was employed to profile hippocampal metabolite variations and elucidate the pathophysiological mechanisms underlying myofascial pain syndrome (MPS).
Methods: Male SD rats were divided into MTrPs group (n=6) and control group (n=6). The MTrPs model was induced through localized blunt impact to the gastrocnemius muscle followed by repetitive eccentric exercise. Successful modeling was confirmed by the presence of palpable taut bands (TBs), along with measurements of mechanical and thermal withdrawal thresholds (MWT and TWL), and electromyographic (EMG) recordings. We assessed hippocampal neuropathological damage using HE and Nissl staining and measured c-fos protein expression to reflect hippocampal neuronal activity. Metabolomics analysis with statistical variable analysis helped distinguish affected individuals from controls.
Results: TB detection, MWT, TWL and EMG confirmed successful model establishment. Pathological evaluation indicated a disorganized structure and neuronal injury in the CA1 region of the hippocampus in MTrPs rats, alongside elevated c-fos protein expression, suggesting heightened neuronal excitation and potential central sensitization. Metabolomic profiling revealed 79 differentially expressed metabolites (VIP > 1, P < 0.05) in MPS rats compared with controls. Further KEGG enrichment analysis demonstrated that 26 of these metabolites were involved in 20 metabolic pathways, with caffeine metabolism being notably affected (P = 0.000444), highlighting its critical role in the pathophysiology of MPS.
Conclusion: MPS causes pathological damage to the hippocampus, and increased c-fos protein expression suggests possible central sensitization in MPS rats. Metabolomics analysis revealed significant hippocampal changes, particularly reduced caffeine metabolism, underscoring potential central mechanisms in MPS. This study enhances our understanding of MPS etiology based on hippocampal pathology and provides potential biological markers.
Keywords: caffeine metabolism, myofascial pain syndrome, hippocampus, metabolomics
Introduction
Myofascial pain syndrome (MPS) represents a prevalent chronic pain condition affecting skeletal muscles. The development of multiple myofascial trigger points (MTrPs), characterized as hyperirritable spots in the muscles and fascia, is commonly observed within this syndrome. Clinically, it presents with localized pain, muscle tension bands, and referred pain.1 MPS patients may also experience autonomic symptoms such as abnormal sweating and dizziness; visual disturbances like blurred vision; auditory issues such as tinnitus; as well as numbness and paresthesia. Additional issues include reduced work tolerance, muscle fatigue, weakness, and other functional conditions. Some patients develop anxiety, depression, and insomnia, which can impair normal work and life. Due to insufficient attention or delayed and inappropriate treatment, MPS can lead to severe functional impairment and chronic intractable pain.2,3 Thus, exploring the pathogenesis and effective treatment targets for MPS is crucial.
The hippocampus, an essential component of the limbic system, plays a crucial role in the regulation of emotions and the processing of pain-related information. Research indicate that chronic pain affects the structure and function of the hippocampus, and these hippocampal changes can cause abnormal pain perception, negative emotions, and cognitive dysfunction during chronic pain, showing a close link between pain and the hippocampus.4 Recent metabolomic analyses of the hippocampus in chronic migraine models have revealed significant disturbances in energy metabolism and imbalances in neurotransmitters, implying that such metabolic dysfunctions may worsen chronic migraine conditions by adversely affecting synaptic plasticity and promoting neuroinflammatory responses.5 MRI investigations have identified atrophy of the hippocampal gray matter in patients with MPS, suggesting that these structural modifications may be associated with disruptions in pain perception and emotional regulation.6 These observations further emphasize the potential involvement of the central nervous system in the pathogenesis of MPS.
c-Fos, a nuclear protein belonging to the immediate early gene family, serves as a marker of neuronal activation and has been extensively studied in the context of chronic pain.7 Its expression within the central nervous system correlates with processes such as learning, memory, and pain perception. Increased levels of c-Fos indicate neuronal hyperexcitability and aberrant activity, positioning it as a significant molecular indicator of central sensitization.8 Central sensitization leads to an exaggerated response of pain-transmitting neurons within the central nervous system to typical stimuli, resulting in persistent pain amplification and the chronicity of pain.9 In chronic pain animal models, hippocampal c-Fos expression patterns change significantly, possibly due to hippocampal damage and alterations in synaptic plasticity and neurotransmitter systems. These changes may disrupt normal hippocampal function, thereby contributing to the pathophysiology of chronic pain.10
Metabolomics is a technique used to detect metabolites. Since metabolites serve as direct informational biomarkers of biological systems, metabolomics reflects the regulation by both genotype and environmental factors.11 It is widely applied in disease investigation, drug discovery, and mechanistic studies.12 Caffeine metabolism has been identified as a key factor in MPS analysis. The levels of caffeine and its metabolites are reduced in the hippocampus of groups with MTrPs, suggesting a potential link between caffeine metabolism and MPS pathology. Caffeine is commonly used to treat migraines and headaches because it enhances analgesic effects and improves alertness, mood, and attention while reducing depression,13 These effects may alleviate the negative emotions associated with chronic pain in MPS patients14. We employed UPLC-MS/MS to characterize the metabolomic profile of hippocampal tissue in a rat model of MPS, uncovering abnormal metabolite profiles and investigating the central mechanisms underlying MPS through the assessment of differential metabolites.
Materials and Methods
Experimental Animals and Grouping
Thirty adult male Sprague-Dawley (SD) rats (specific pathogen-free [SPF] grade, weighing 200–250 g), were obtained from the Laboratory Animal Center of Guizhou Medical University (license No.: SYXK (Gui): 2023–0002). The rats were randomly divided into two groups: a control group (n=6) and a model group (n=24). During the modeling phase, rats exhibiting unclear pain threshold values were excluded, ultimately resulting in a cohort of six rats with successful modeling outcomes, were assigned to the model cohort. We maintained all animals in a rigorously controlled housing environment, under conditions of 22.0±0.5°C, 50–60% humidity, and a standard 12-hour light/dark cycle. All animal procedures were conducted in compliance with the protocols approved by the Animal Ethics Committee of Guizhou Medical University (Ethical Approval No.: 2,403,152), and were performed in accordance with the National Institutes of Health Guide for the Care and Use of Laboratory Animals.
MPS Model Rats
Model establishment followed previously described methods15,16. Before the experiment, all animals underwent a three-day treadmill acclimatization training program (WI32812 multi-channel treadmill, Beijing Dongyiyi Technology Co., Ltd.) to familiarize themselves with the movement on the treadmill at an incline of −16° and a speed of 16 m/min for 15 minutes each day. The MPS model was induced by an 8-week blunt impact combined with an eccentric exercise period and a 4-week recovery period for the experimental group rats. The experimental group SD rats received a blunt strike once a week and eccentric exercise once every two days. The blunt strike was performed using a 1200 g hammer manufactured experimentally, dropped vertically from a height of 20 cm, repeated 3 times, striking the right vastus medialis muscle. The SD rats received eccentric exercise every two days, with a running condition of an incline of −16° (downward), a speed of 16 m/min and a duration of 15 minutes. During exercise, the rats were kept walking by light stimulation to ensure training compliance. The modeling process lasted for 8 weeks, with all mice entering a 4-week recovery period. Successful MPS modeling was confirmed by reduced pain threshold, palpable tight bands and hard swollen nodules in the right vastus medialis, and electromyography showing local twitch responses and spontaneous electrical activity. Rats with lower pain thresholds after successful modeling were selected for the study.
Assessment of Pain Threshold
Von Frey Hair Test for Mechanical Pain Threshold (MWT)
MWT was evaluated using the Von Frey hair test. The mechanical withdrawal threshold of the rats was recorded at intervals of 1, 2, 4, 6, and 8 weeks following the modeling, and also at 2 and 4 weeks after the conclusion of the modeling phase. We placed each rat in a transparent acrylic enclosure (26×20×14 cm^3) and allowed to acclimatize for 20 minutes before testing. Various stiffness von Frey filaments (0.4, 0.6, 1.4, 2, 4, 6, 8, 15 g) were applied manually to progressively increase stimulation at the center of the right foot sole,17 with a 1-minute interval between each stimulation. The maximum stimulation intensity set for this study is 15g. Beyond this intensity, no further stimulation will be provided. Utilizing the up-down method, the data were processed to derive the 50% mechanical withdrawal threshold.18
Thermal Hyperalgesia Test for Thermal Pain Threshold (TWL)
TWL using the Hargreaves’ test, conducted two hours subsequent to the mechanical pain threshold test with a standardized device (Ugo Basile, Italy). Before testing, rats were allowed to acclimate to the instrument glass plate for 15–30 minutes. The thermal radiation stimulus intensity was set at 50% to ensure standardization and comparability of stimulation intensity. A thermal radiation stimulus was positioned beneath the targeted hind paw, with the withdrawal latency automatically recorded. For animals that showed resistance, stimulation was halted after 25 seconds to prevent tissue damage. The withdrawal latency for each hind paw was documented three times per rat, with intervals exceeding 15 minutes between trials. The mean value was computed as the withdrawal latency.
Electromyography (EMG) Examination
Upon completion of the modeling phase, EMG assessments were conducted on all rats following an intraperitoneal injection of sodium pentobarbital (50 mg/kg) and subsequent depilation. The rats were positioned supinely to ensure complete exposure of the right lower limb. Taut bands and hard nodules were located in the right vastus medialis via abdominal palpation. Electromyographic (EMG) recordings were obtained using a NATUS apparatus set to the following parameters: sampling frequency, 20 Hz–10,000 Hz; sensitivity, 0.2 mV/grid; scan speed, 10 ms/grid. An acupuncture needle electrode (Φ0.3 mm, 30G) was inserted into the visibly tense muscle band, while a detection electrode was positioned within the muscle tight band. Upon observation of a local twitch response, the trigger point was confirmed. A reference electrode was positioned at a distance of 4–6 cm from the trigger point for monitoring spontaneous electrical activity. EMG evaluations were also performed on the same site in control rats.
Histological Analysis
Post-testing, rats were anesthetized via an intraperitoneal injection of 2% sodium pentobarbital. After the administration of a solution (0.4 mL/100 g), the subjects were euthanized. The cerebral tissue was extracted and segregated into two segments. One segment underwent fixation in 4% paraformaldehyde, followed by dehydration with ethanol, clearing in xylene, and embedding in paraffin. Sections with a thickness of 4 µm were prepared. Post-dewaxing, these sections were stained in accordance with the protocols provided by the HE and Nissl staining kits (Solarbio, Beijing). For immunofluorescence staining, following treatment with blocking buffer, the sections were incubated overnight at 4 °C with antibody against c-Fos. (1:100, AF5354, Affinity Biosciences, China). After extensive rinsing, the sections were incubated for one hour at ambient temperature in the dark with a CoraLite® Plus 488-conjugated goat anti-rabbit IgG secondary antibody (Multi-rAb™, 1:200, RGAR002, Proteintech, China). Finally, tissue sections were coverslipped with a DAPI-embedded antifade mounting medium (Solarbio, Beijing) and examined using an upright fluorescence microscope. The remaining cerebral tissue samples were immediately snap-frozen in liquid nitrogen and maintained at −80 °C for subsequent Western blotting and metabolomic profiling.
Western Blot
Tissue samples from the MTrPs group were homogenized in RIPA lysis buffer (Solarbio, Beijing, China). Protein concentration was determined using a BCA assay kit. The primary antibody employed for Western blotting was rabbit anti-C-fos (1:1,000, AF5354, Affinity Biosciences, China), while the secondary antibody utilized was goat anti-rabbit (1/200, SA00001-2, Proteintech, China). Immunoblotting results were visualized via the ECL method (ECL, G2020-50ML, Servicebio, China). The protein bands of interest were cropped using Adobe Photoshop CS2, and the gray values of these bands were quantified using ImageJ.
Metabolomics Analysis
Metabolites were extracted from individually pulverized tissue samples (100 mg) with liquid nitrogen. The resulting powder was reconstituted in ice-cold 80% aqueous methanol and vigorously vortexed. The mixtures were centrifuged (15,000 ×g, 4°C, 20 min). An aliquot of the supernatant was diluted with LC–MS grade water to 53% methanol, transferred to new tubes, and centrifuged again Metabolites were extracted from separately pulverized tissue samples (100 mg) and treated with liquid nitrogen. The resulting powder was redissolved in ice-cold 80% hydrated methanol and vigorously shaken. The mixture was centrifuged (15,000 × g, 4°C, 20 min). A small sample of the supernatant was diluted to 53% methanol with LC-MS grade water, transferred to a new tube, and centrifuged again (15,000 ×g, 4°C, 20 min).
Metabolites were extracted from individually pulverized hippocampal tissue samples (100 mg per sample). Each 100 mg of tissue was resuspended in 1 mL of ice-cold 80% methanol solution. The mixture was vortexed on ice for 1 minute to ensure thorough mixing, followed by sonication on ice for 10 minutes (300 W). The mixture was centrifuged at 15,000 × g for 20 minutes at 4°C. The supernatant was diluted with LC-MS grade water to a final methanol concentration of 53%, transferred to a new tube, and centrifuged again (15,000 × g, 4°C, 20 minutes) to retain the supernatant19.
Chromatographic separation was performed on a Vanquish UHPLC system (ThermoFisher, Germany) coupled to an Orbitrap Q Exactive™ HF or HF-X mass spectrometer (ThermoFisher, Germany) at Genechem Co., Ltd. (Shanghai, China). Separation used a Hypersil Gold column (100 × 2.1 mm, 1.9 μm) with a 12-minute linear gradient at a flow rate of 0.2 mL/min. Eluents for both polarities were (A) 0.1% aqueous formic acid; (B) methanol. Gradient conditions: 2% B (0–1.5 min), 2–85% B (1.5–4.5 min), 85–100% B (4.5–14.5 min), 100–2% B (14.5–15.6 min), and re-equilibration at 2% B (15.6–17.6 min). Data acquisition was carried out in both positive and negative polarities with the following instrument settings: spray voltage, 3.5 kV; capillary temperature, 320 °C; sheath gas, 35 psi; auxiliary gas, 10 L/min; S-lens RF level, 60; and auxiliary gas heater, 350 °C. We used a mixed quality control (QC) sample, with one QC sample inserted for every 4 experimental samples. Metabolite peak areas with a relative standard deviation (RSD) of less than 20% in the QC sample and metabolites with a coefficient variation (CV) greater than 30% were removed.
ROC Curves
The predicted probabilities of each candidate biomarker (caffeine, xanthine and Xanthine) were obtained from the machine learning models of the control and MTrP groups. Receiver operating characteristic (ROC) curves for each biomarker were calculated using the roc() function in the pROC package. True positive rate (sensitivity) and false positive rate (1-specificity) were plotted at different classification thresholds. The AUC value for each ROC curve was calculated using the auc() function in the same package. A higher AUC value indicates better inter-group discrimination.
Statistical Analysis
Statistical analyses were conducted using several computational tools. R (v3.4.3), Python (v2.7.6), and CentOS (v6.6) were employed for data processing and multivariate modeling. Non-normally distributed data were standardized via the formula: sample value/(total sample sum/QC1 sample sum). Metabolites displaying a coefficient of variation (CV) greater than 30% across quality control (QC) replicates were removed. Multivariate analyses of principal component analysis (PCA) and orthogonal partial least squares discriminant analysis (OPLS-DA) were performed in the MetaX environment. All experiments used male mice of the same sex, and body weight was matched prior to modeling to ensure no significant differences between groups. Therefore, the confounding effects of body weight and sex factors were minimized, and the observed separation between groups can be robustly attributed to the MTrPs modeling itself. Differential metabolites were selected according to the thresholds: VIP > 1, p < 0.05 (by t-test), and absolute fold change ≥ 2. KEGG pathway enrichment was assessed with significance criteria set as x/n > y/N and p < 0.05.
For group comparisons, SPSS version 27.0 was used. Differences between two groups were assessed with independent-sample t-tests or Mann–Whitney U-tests, depending on data distribution. Repeated-measures ANOVA was employed to analyze mechanical withdrawal threshold data across various time points, with a significance threshold set at P < 0.05. In order to determine which specific groups contributed to the overall significant effect observed in the ANOVA, a post-hoc analysis using Tukey’s Honest Significant Difference (HSD) test was performed. All figures were generated using GraphPad Prism version 8.
Result
Analysis of the MPS Model
This study modeled the effects of eccentric exercise on all rats (Figure 1A). Of the 24 rats induced by MTrPs, 18 were excluded because their pain threshold did not show significant changes compared to other rats. Thus, the final analysis incorporated 12 rats (MTrPs group: n = 6, control group: n = 6, Table 1). Furthermore, the MWT and TWL values of the MTrPs group were significantly lower than those of the control group with increasing culture time (Figure 1B). The electromyography waveforms of the control group were relatively smooth and stable, while those of the MTrPs group were relatively complex and disordered (Figure 1C). This indicates that the presence of MTrPs leads to pathological, spontaneous abnormal muscle discharges.
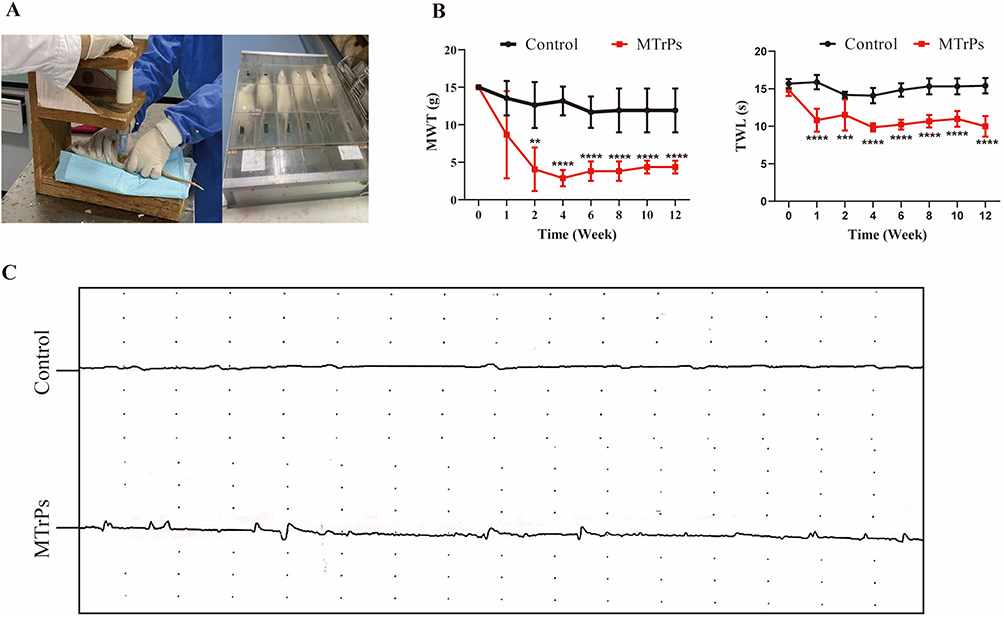 |
Figure 1 Modeling conditions. (A) Eccentric exercise. (B) During the modeling phase, the MWT and TWL in the MTrPs group of rats progressively decreased. Significant differences compared with the control group were observed from week 2 and persisted until the end of the experiment. (C) Electromyography findings are also presented. ** represents p < 0.01, *** represents p < 0.001, **** represents p <0.0001. Abbreviations: MWT, mechanical pain threshold; MWT, mechanical pain threshold. |
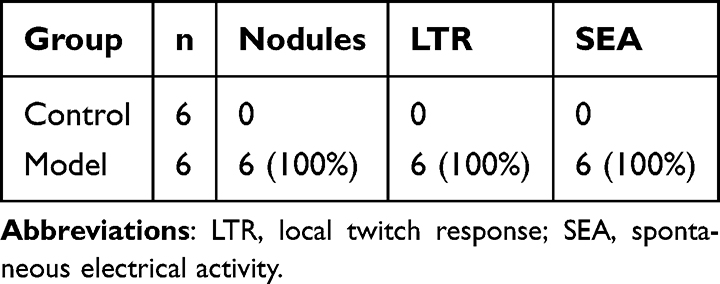 |
Table 1 Summary of MTrPs Modeling |
H&E and Nissl Staining of the Hippocampus
H&E staining of the CA1 region indicated that neurons in the control group exhibited well-organized arrangements, robust morphology, lightly stained cytoplasmic regions, and centrally located, deeply stained nuclei. Conversely, the MTrPs group exhibited structural anomalies characterized by shrunken nuclei, reduced cell body size, and a noticeable decrease in neuron population (Figure 2A). Nissl staining further illustrated that the control group presented abundant and regularly shaped CA1 pyramidal cells, with distinctly visible Nissl bodies. In stark contrast, the MTrPs group revealed disordered and reduced Nissl bodies, with many appearing fragmented and deeply stained (Figure 2B). These observations underscore the pathological damage inflicted by MPS within the CA1 region of the hippocampus.
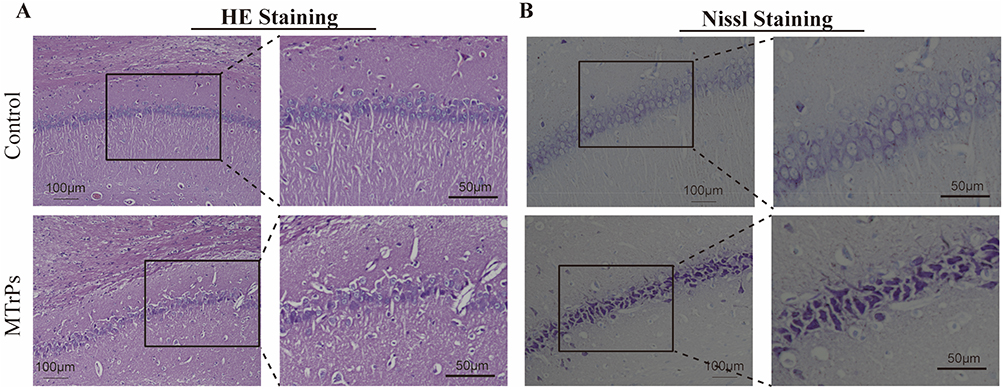 |
Figure 2 Histomorphological features of hippocampal tissue across groups. (A) Hematoxylin and eosin staining (H&E) staining in the CA1 region of the hippocampus from the control and MTrPs groups. (B) Nissl staining of the same hippocampal CA1 region in both groups. Scale bars = 100 μm (low magnification, ×200) and 50 μm (high magnification, ×400). |
Hippocampal c-Fos Expression in MTrPs and Control Groups
To assess neuronal excitability, we detected c-Fos protein expression in the rat hippocampus via fluorescence staining following model establishment. Immunofluorescence revealed stronger c-Fos staining within the nuclei of the MTrPs group compared to the control animals (Figure 3A). Colocalization analysis showed that the MTrPs group had a higher number of cells positive for colocalization than the control group (control: 66 ± 4.28; MTrPs: 130 ± 11.22, P < 0.001) (Figure 3B). Western blot analysis confirmed higher c-fos protein expression in the MTrPs group (Figure 3C and D).
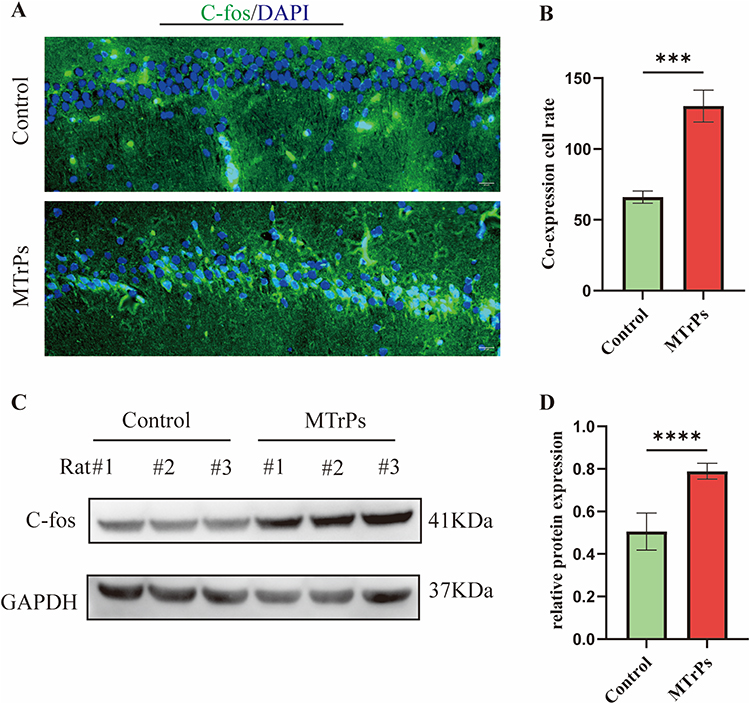 |
Figure 3 Changes in hippocampal c-Fos protein expression across groups. (A) Representative immunofluorescence images showing c-Fos localization (scale bar = 20 μm). (B) Quantification of c-Fos and DAPI colocalization. Data are expressed as mean ± SEM (n = 6). (C) Western blot analysis of c-Fos in hippocampal lysates. (D) Relative c-Fos protein levels after normalization to loading control. Results represent mean ± SEM (n = 6). DAPI: 4′,6-Diamidino-2-Phenylindole. *** represents p < 0.001, **** represents p < 0.0001. |
Mass Spectrometry TIC of Quality Control Samples
Non-targeted metabolomics analysis using UPLC was performed on hippocampal samples from MPS rats. The TIC chromatograms of QC samples exhibited well-overlapping peaks with consistent retention times and signal intensities in both positive and negative ion modes (Figure 4A and B). Based on the criteria of RSD less than 20% and CV greater than 30%, we screened metabolites and identified 901 metabolites in positive ion mode and 329 metabolites in negative ion mode (Table S1). These findings underscore the robust stability and repeatability of the instrumentation, thereby validating the subsequent multivariate statistical analysis.
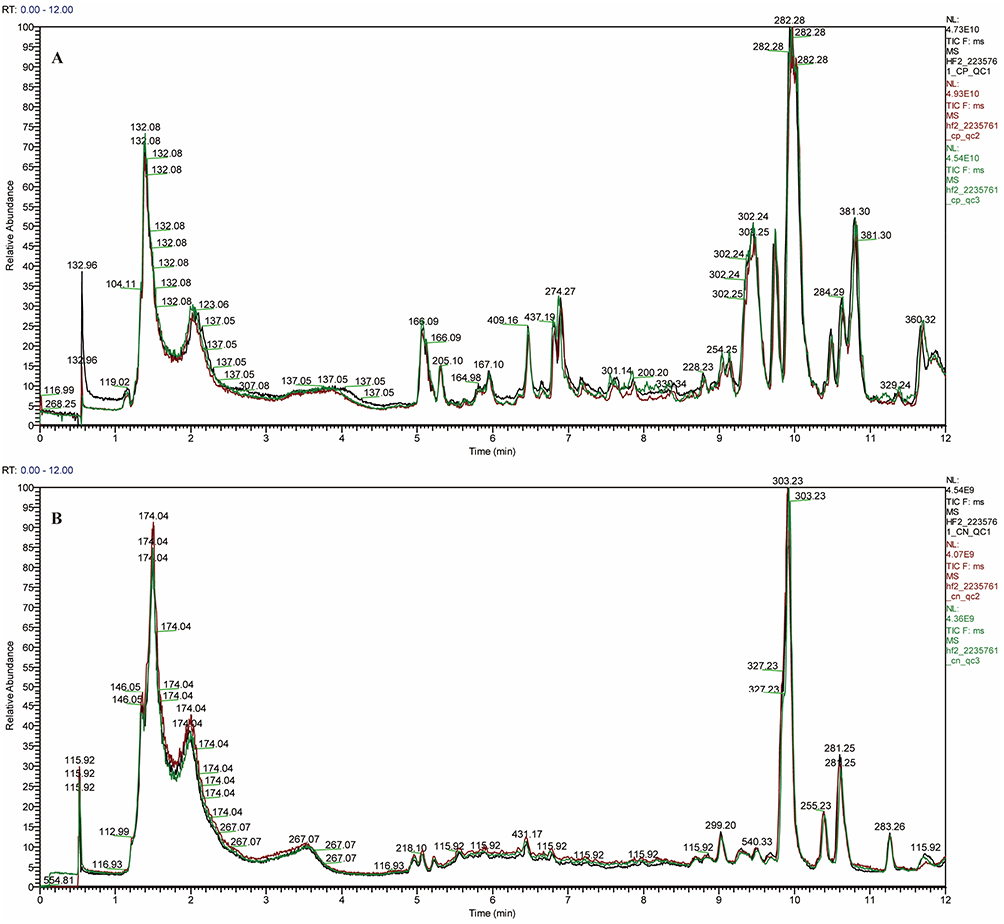 |
Figure 4 Total ion chromatogram (TIC) in positive (A) and negative (B) ion modes, showing representative profiles from the control and MTrPs groups. |
PCA and OPLS-DA
To investigate the metabolic differences between the control group and the MTrPs model group, this study performed metabolomics analysis on the hippocampal tissues of both groups. In the 3D PCA model with two components, a clear separation between control and model rats was observed (Figure 5A and B). Subsequently, OPLS-DA models were established to identify differential metabolites, showing distinct separation between the groups (Figures 5C and D), which indicates metabolic abnormalities caused by chronic unpredictable stress associated with MTrPs modeling. To prevent overfitting, the OPLS-DA models were validated by randomizing the Y matrix 200 times while keeping the X matrix constant. Regression analysis of the original model’s R2Y and Q2Y values yielded intercepts corresponding to R2 and Q2 parameters. In positive ion mode, the R2 and Q2 values for the OPLS-DA model were recorded at 0.945 and 0.323. And in negative ion mode, they measured 0.957 and 0.3. R2 values approaching 1 signify good model stability and predictive capacity, while intercept Q2 values below 0.5 imply the absence of overfitting (Figures 5E and F).
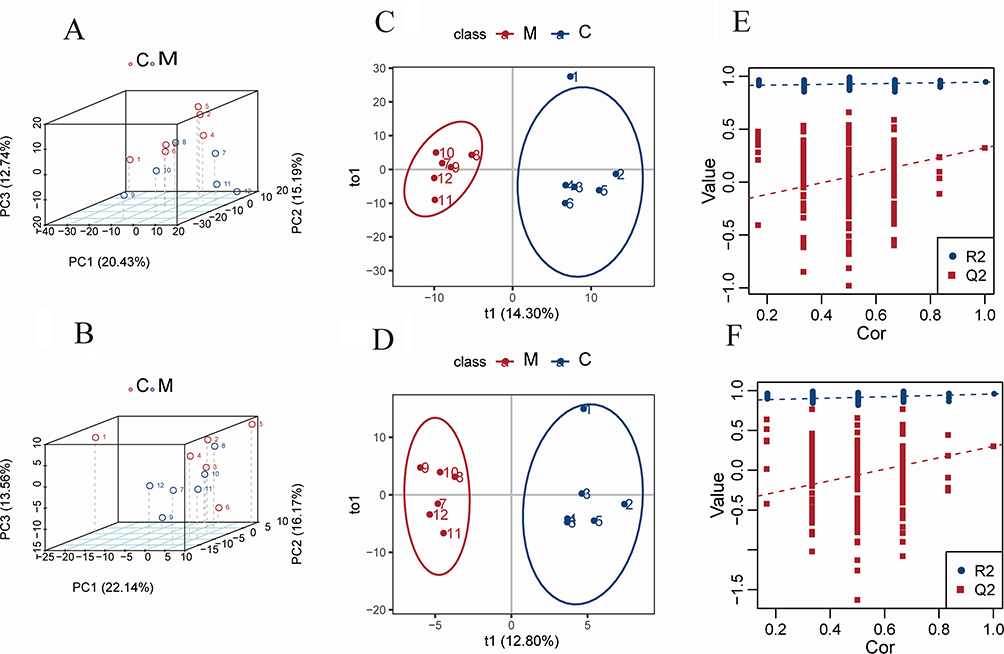 |
Figure 5 Metabolic profiling of hippocampal tissue from control and MTrPs model groups based on LC-MS analysis. (A) 3D principal component analysis (PCA) score plot in positive ion mode, the first three principal components (PCs) account for 20.43%, 15.19% and 12.74% of the total variance. (B) 3D PCA score plot in negative ion mode, showing similar separation between groups, the first three principal components (PCs) account for 22.14%, 16.17% and 13.56% of the total variance. (C) Orthogonal projections to latent structures-discriminant analysis (OPLS-DA) score plot in positive ion mode, t1 represents the score of the first predicted component. t1 represents the score of the first orthogonal component. (D) OPLS-DA score plot in negative ion mode. (C) Validation plot of the OPLS-DA model using positive ion mode data. The intercepts for R2 (0.945) and Q2 (0.323) indicate a robust model without overfitting. (F) Validation plot of the OPLS-DA model from negative ion mode data, with intercepts for R2 (0.957) and Q2 (0.3). Abbreviations: C, control group; M, MTrPs group; Cor: Correlation Coefficient. |
Identification of Potential Biomarkers
Differential metabolites were selected based on the following thresholds: VIP > 1.0, FC ≥ 1.2 or ≤ 0.833, and P < 0.05 from the OPLS-DA model. A comparative analysis between the MTrPs and control groups revealed substantial alterations in 79 metabolites, with 27 being upregulated and 52 downregulated (Figure 6A and B). Among these, 26 identified compounds were associated with 20 enriched metabolic pathways by KEGG annotation. These metabolites include amino acids, carbohydrates, purines, and the fatty acid esters (Table 2). A heatmap (Figure 6C) showed significant metabolic differences between the groups. These differences indicate metabolic abnormalities caused by chronic unpredictable stress during MTrPs modeling.
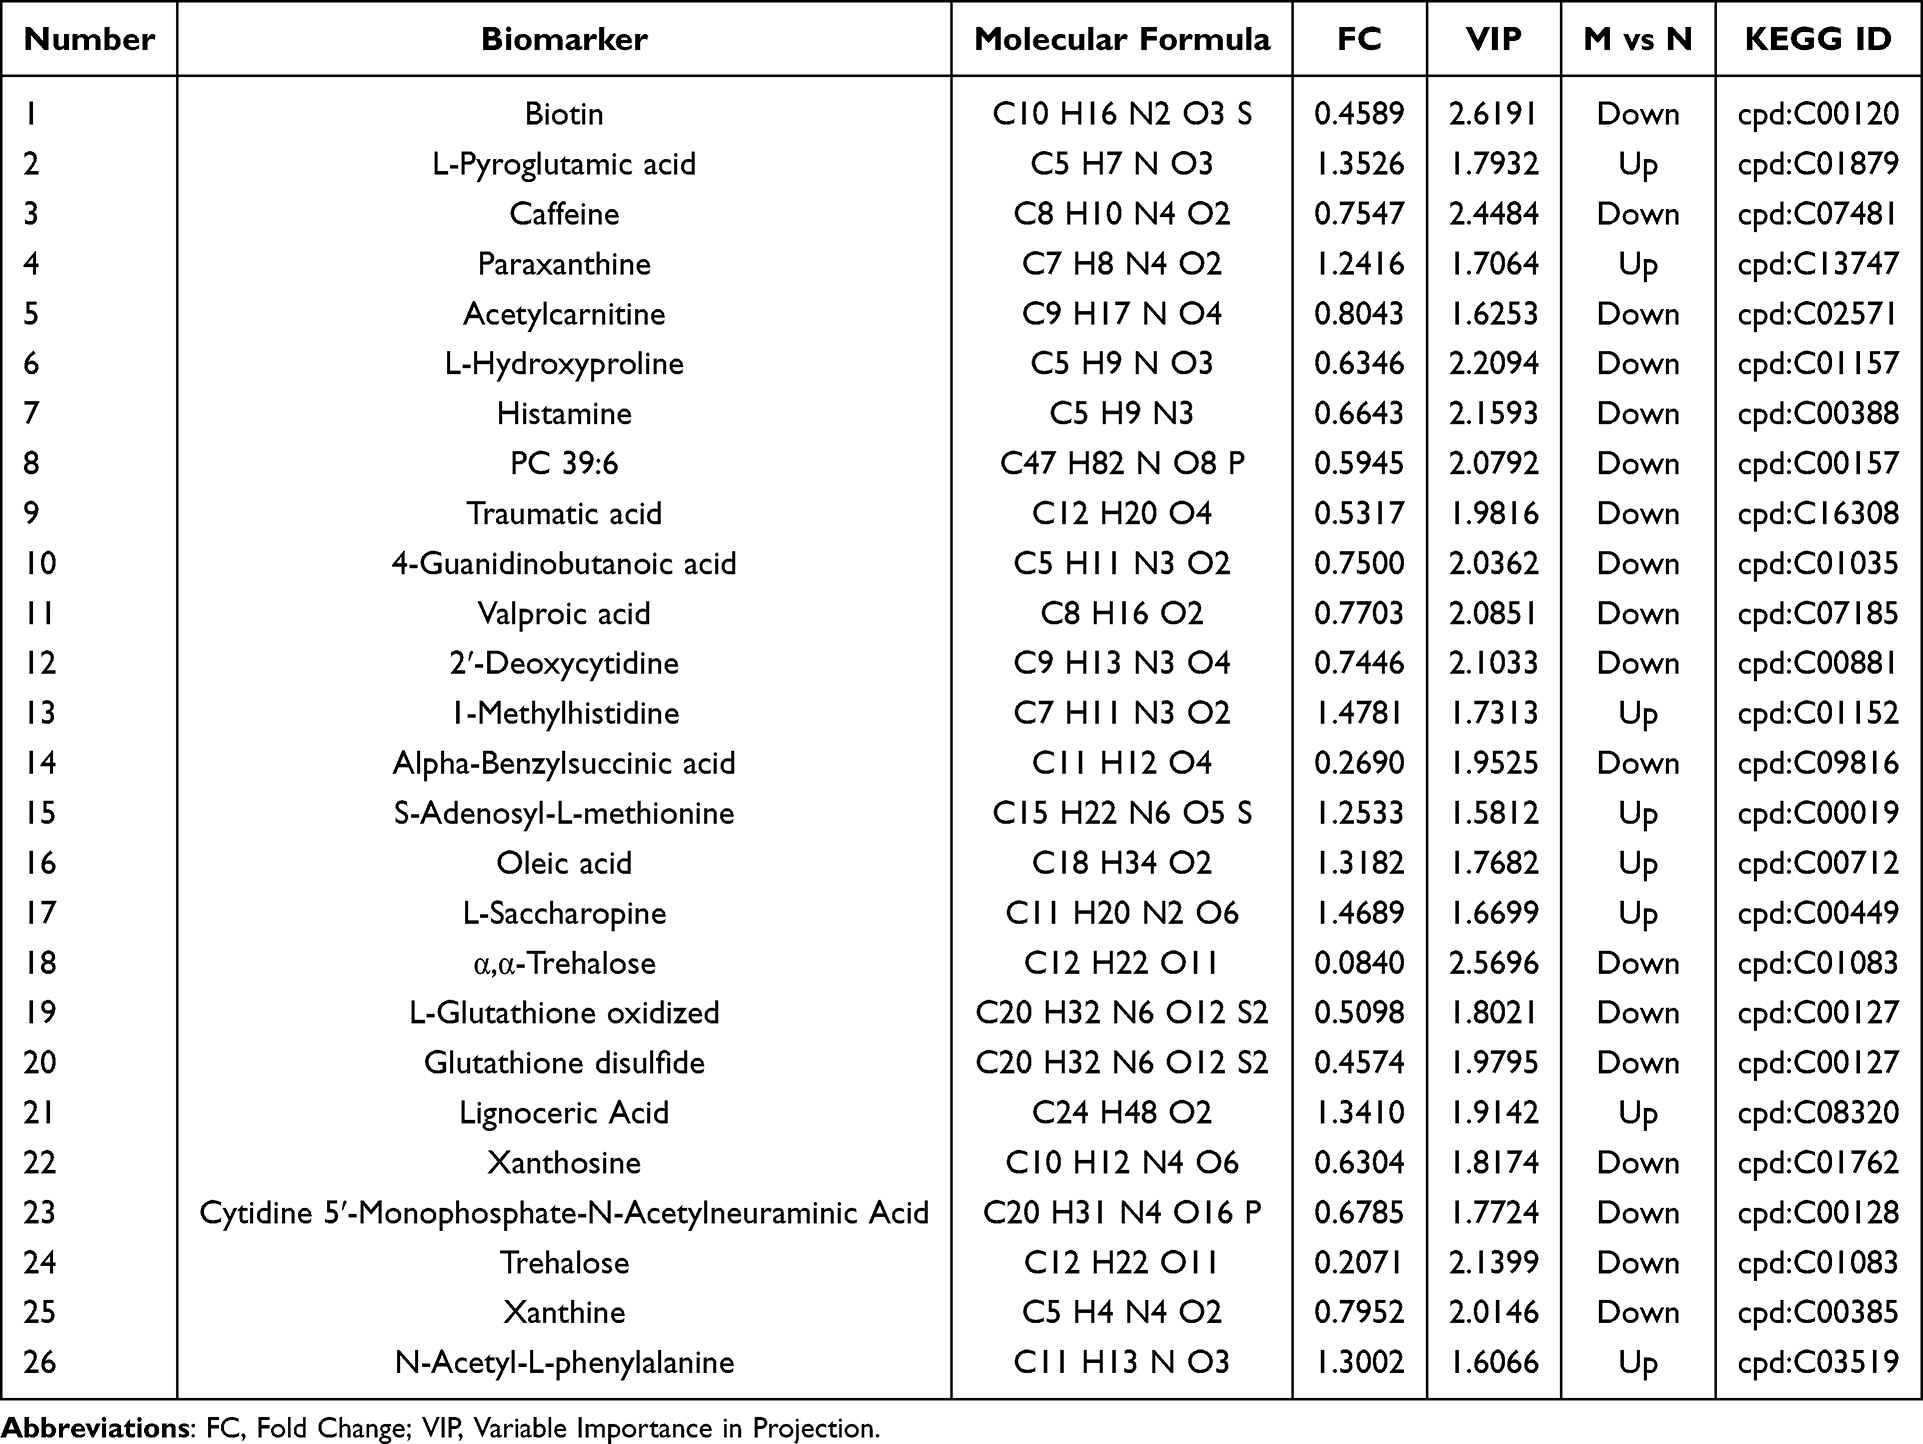 |
Table 2 Detailed Information of Differential Metabolites |
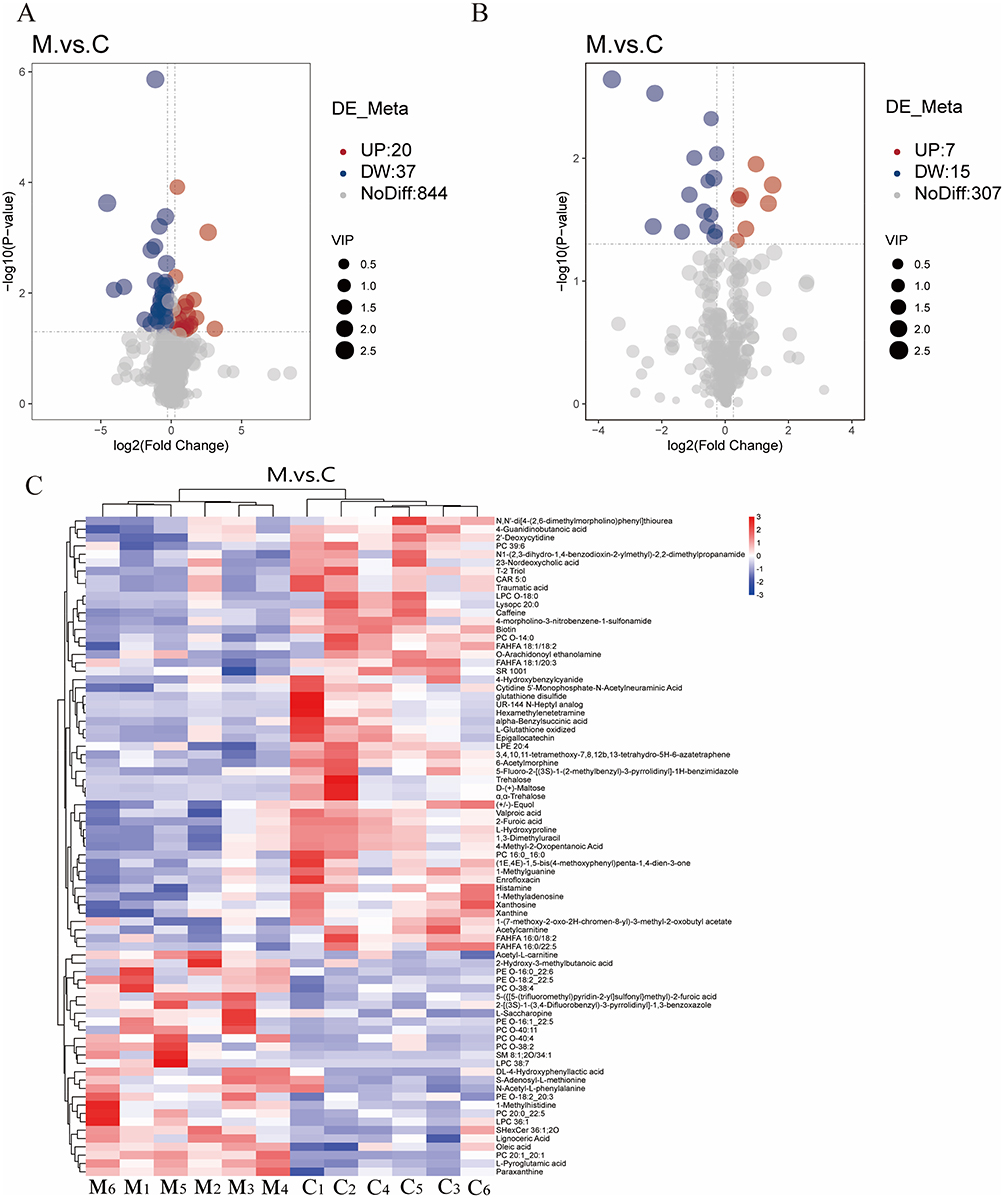 |
Figure 6 Identification of metabolic biomarkers in the hippocampal tissue across experimental groups. Volcanic plot analysis under (A) positive and (B) negative ion modes illustrates the distribution of differential metabolites according to VIP score, fold change, and statistical significance. Red points represent significantly upregulated metabolites, blue points denote significantly downregulated metabolites, and gray points indicate metabolites with minimal or nonsignificant changes (P > 0.05 or VIP < 1). (C) Heatmap visualization of the intensity levels of potential biomarkers across groups. Abbreviations: C, control group; M, MTrPs group. |
Metabolic Pathway Analysis
Furthermore, a global metabolic pathway analysis was conducted utilizing KEGG IDs to ascertain enriched pathways. Hypergeometric testing revealed significant enrichment of differentially expressed metabolites across 20 metabolic pathways (Figure 7A and Table 3). Among these, pathways such as caffeine metabolism, biotin metabolism, gastric acid secretion, alpha-linolenic acid metabolism, synaptic vesicle cycling, and neuroactive ligand-receptor interactions were notably altered in MPS, highlighting their potential relevance to the disorder. Notably, caffeine metabolism emerged as the pathway most significantly associated with the observed conditions (p = 0.000444) (Figure 7B). Four pivotal metabolites within the caffeine metabolic pathway were identified (cpd: C13747 (Caffeine), cpd: C07481 (Paraxanthine), cpd: C01762 (Xanthosine) and cpd: C01083 (Xanthine)) that showed marked trend changes (Table 3). In addition, this study analyzed the correlation between these four caffeine metabolites and c-fos protein expression levels. The study found a weak negative correlation between paraxanthine and c-fos expression (Table 4), while no significant correlation was found between the other metabolites. Among these, caffeine, xanthine and Xanthine exhibited notable alterations in levels in the hippocampus of MPS, underscoring their important biological role in this region.
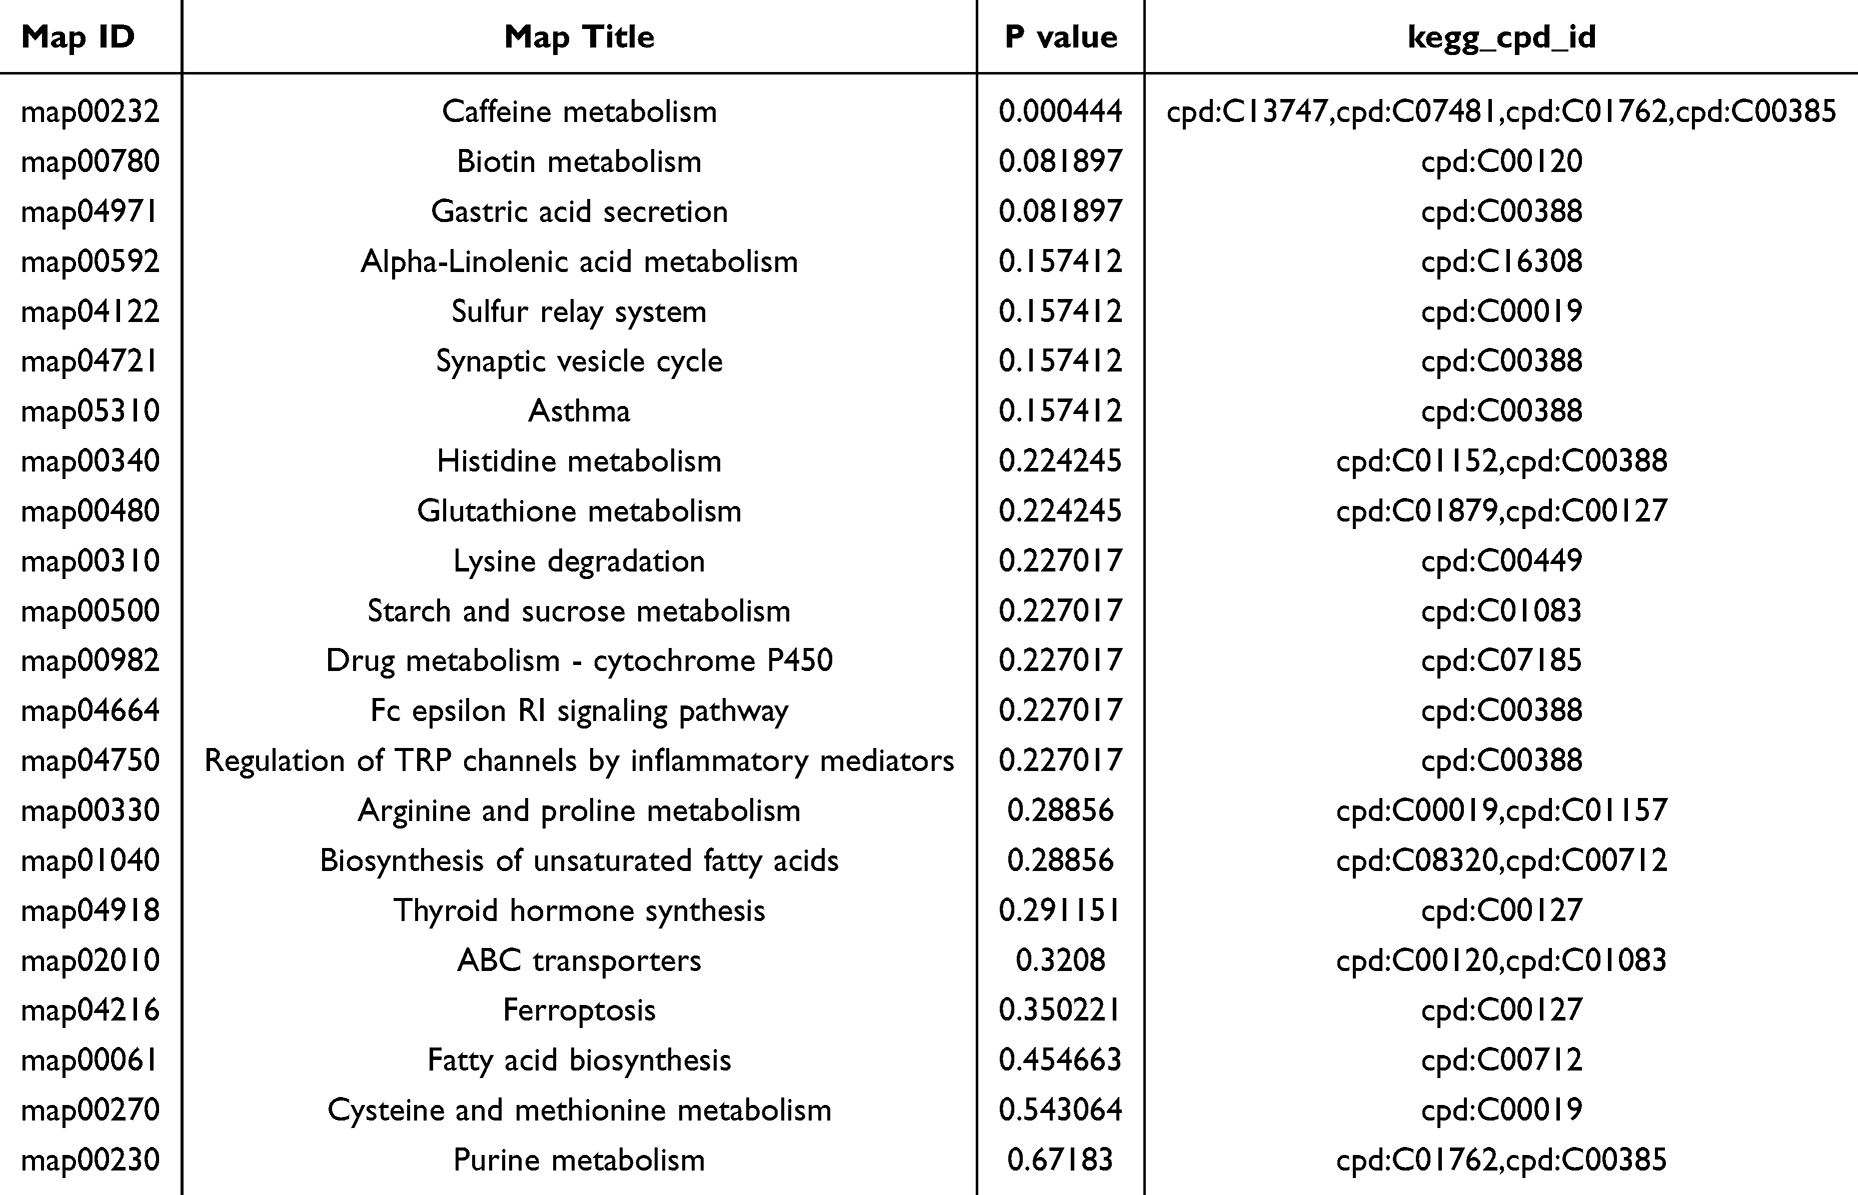 |
Table 3 List of 20 Significantly Dysregulated Pathways in MTrPs |
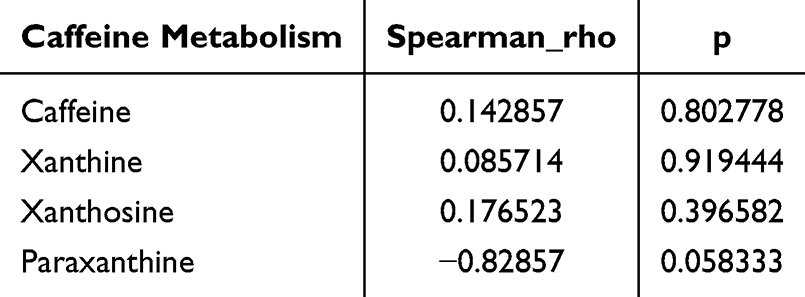 |
Table 4 Correlation Analysis Between Caffeine Levels and c-Fos Protein Expression |
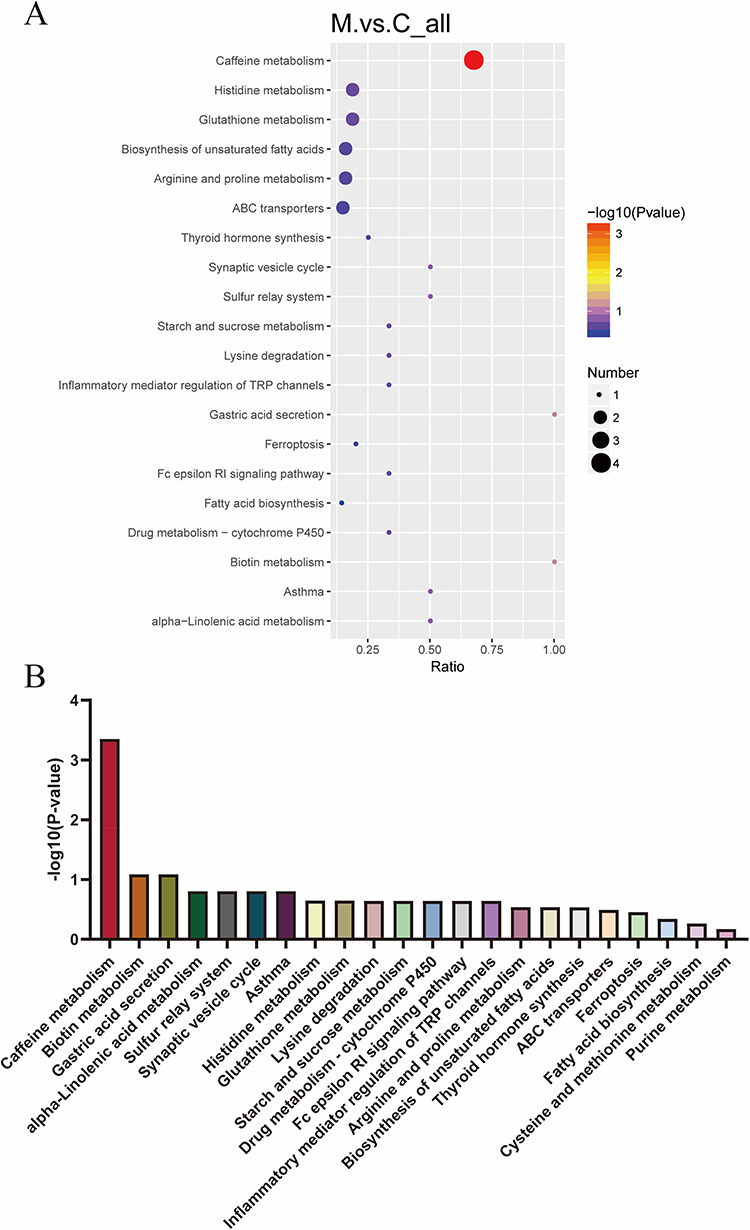 |
Figure 7 Metabolic pathway analysis of hippocampal metabolites between MTrPs and control groups. (A) Bubble chart of 20 significantly altered pathways. The color gradient of dots corresponds to the p-value from the hypergeometric test, with darker shades indicating higher statistical significance. Dot size corresponds to the number of differentially abundant metabolites per pathway, where larger dots represent a higher count of metabolites. (B) Bar graph displaying the p-values for each of the 20 metabolic pathways. Abbreviations: C, control group; M, MTrPs group. |
ROC Curve Analysis
We integrated metabolomic profiling with machine learning to select three candidate biomarkers associated with the caffeine metabolism pathway. ROC analysis was employed to evaluate the sensitivity and specificity of these biomarkers and to illustrate their diagnostic performance graphically. The AUC value was used to quantify overall diagnostic accuracy, with higher values indicating superior discriminative ability. Notably, Caffeine, Xanthosine and Xanthine achieved AUC values of 1.0, 0.889, and 0.806, respectively, demonstrating high predictive power in distinguishing between the control and MTrPs groups. This biomarker panel provides potential mechanistic insight into MPS development (Figure 8).
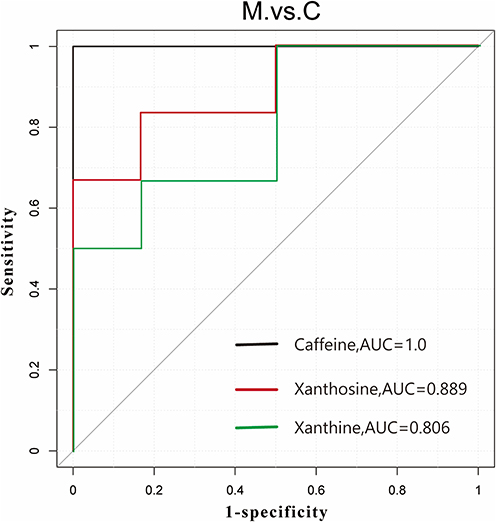 |
Figure 8 Receiver operating characteristic (ROC) curves of the three biomarker panels. Black represents Caffeine (AUC = 1.000, cutoff value= 0.50), red represents Xanthosine (AUC = 0.889, cutoff value= 0.64) and green represents Xanthine (AUC = 0.806, cutoff value= 0.71). The dashed diagonal line represents the reference line of no discriminatory power (AUC = 0.50). The axes represent the true positive rate (sensitivity). |
Discussion
Patients with MPS often experience chronic pain, especially local pain, which is the most common symptom. They also frequently experience non-pain symptoms including anxiety, depression, sleep disturbances, and fatigue, all of which profoundly compromise occupational performance and activities of daily living2,3. The formation or activation of MTrPs constitutes a major cause of peripheral and central sensitization20. In this study, after successful establishment of the MTrP model, when EMG electrodes were inserted into taut muscle bands, we observed local twitch responses and spontaneous electrical activity, indicating MTrP formation and activation within the right rat vastus medialis. These findings suggest that effective treatments aimed at reducing harmful afferent input from MTrPs and inhibiting peripheral sensitization may prevent central sensitization, thereby alleviating pain and improving quality of life.
The hippocampus, situated within the medial temporal lobe, comprises the Cornu Ammonis (CA) subfields (CA1–CA4) and the Dentate Gyrus (DG). Pyramidal neurons represent the principal cell type throughout the CA regions, whereas the DG is characterized by its granule cell layers and mossy cells.21 Chronic pain can induce morphological and neuroplastic alterations in the hippocampus, particularly manifesting as volume reduction in the DG and CA subfields. This structural change is considered a critical factor contributing to central sensitization in individuals with chronic pain.22,23 Peripheral sensitization caused by muscle injury is believed to induce hippocampal pathology in MPS. Prolonged spontaneous resting electrical activity and persistent peripheral pain memory input can lead to central sensitization and hippocampal structural changes24, ultimately inducing depressive moods. Negative emotions can lower pain tolerance and increase subjective pain perception, thereby creating a vicious cycle25. In this study, the hippocampal volume in the model group was significantly reduced. This result is consistent with the crucial role of the hippocampus in the nervous system. A reduction in hippocampal volume is typically associated with pathological states, such as chronic stress, nerve damage and chronic pain.26,27 Similar studies have found that in chronic stress models, a reduction in hippocampal volume is closely related to memory loss, decreased neural plasticity and neuronal death.28,29 MTrPs models may indirectly affect the central nervous system by inducing sustained muscle contraction and pain, which can lead to changes in the neural structure of the hippocampus. C-Fos protein, a marker of neuronal excitability, migrates into the nucleus where it modulates transcriptional activity following neuronal activation30. In rat models of chronic migraine, central sensitization leads to reduced neuronal excitation thresholds and heightened responses to noxious stimuli. This process promotes the upregulation of immediate early genes such as c-Fos and contributes to structural impairments within the hippocampus31,32. Nissl and HE staining in this study revealed pathological damage in the hippocampus along with elevated c-Fos immunoreactivity in MPS rats. These findings suggest central sensitization and support the hypothesis that central sensitization contributes to MPS pathogenesis. This validates the rat model as a faithful representation of central sensitization, thereby providing critical insight into MPS mechanisms and creating a framework for future development of treatments.
Hippocampal metabolomics in MPS rats were profiled using UHPLC-LC-MS/MS, a non-targeted, stable, and reproducible analytical platform. The results showed significant deviations in the hippocampal metabolomics of MPS rats compared to controls, especially caffeine metabolism and its metabolites (caffeine, Xanthosine and Xanthine) (Figure 6C). Caffeine, a methylxanthine and central nervous system stimulant with three methyl groups (1,3,7-trimethylxanthine), is primarily found in coffee, tea, guarana fruits, and cocoa beans33,34. After ingestion, caffeine is metabolized in the liver mainly via the cytochrome P450 system. CYP1A2 serves as the predominant isoenzyme catalyzing this transformation, generating three key dimethylxanthines: paraxanthine, theobromine, and theophylline. These compounds exhibit distinct pharmacological activities. A minor portion of caffeine is eliminated unchanged via urinary, biliary, salivary, seminal, and mammary excretion.35
Caffeine and its methylxanthine derivatives are categorized as purine alkaloids due to their structural foundation in the xanthine scaffold, synthesized or recycled from adenine and guanine or their derivatives in plants36. Adenosine, a ubiquitous bioactive molecule, is involved in energy metabolism as a part of energy carriers ADP and ATP and also forms the second messenger cAMP. It also plays a role in controlling excitotoxic mediators, limiting calcium influx, hyperpolarizing neurons, and modulating glial cells37. Importantly, adenosine acts as an inhibitory neuromodulator, reducing neuronal activity. It can be released by neurons like a traditional neurotransmitter but is more commonly a product of cellular adenine nucleotide breakdown38. Adenosine levels fluctuate with brain activity. During wakefulness, these substances build up primarily in cortical and basal forebrain regions, leading to increased fatigue and diminished alertness, and are cleared during sleep39. The central effects of caffeine principally arise from its competitive blockade of adenosine receptors, particularly A1 and A2A subtypes, thereby counteracting adenosine-mediated neural inhibition40. In addition to adenosine receptor antagonism, caffeine and its metabolites inhibit several enzymes—such as acetylcholinesterase and monoamine oxidase—resulting in elevated levels of acetylcholine, monoamine neurotransmitters, and modulated amino acid decarboxylation, which collectively reduce neuronal excitability.41
Purine metabolism encompasses the synthesis, catabolism and salvage pathways of nucleotides. This process involves deamination reactions catalyzed by various deaminases, yielding metabolites such as xanthine, hypoxanthine, and uric acid. Among these, adenosine serves as an important modulator of neural excitability, synaptic plasticity, and neuroprotection42. Hippocampal adenosine receptors include A1A, A2A, and A2B, with A2A being the most abundant. A2A receptor antagonists are widely used to treat depression, anxiety, and pain43. Under chronic stress, concentrations of purine metabolites ATP, ADP, and AMP decrease in the hippocampus, leading to neuronal death and synapse degeneration.44 Caffeine, a methylxanthine alkaloid metabolized to xanthine and uric acid, acts as an adenosine A2A receptor antagonist and is used as an adjuvant therapy for migraine, since elevated plasma adenosine levels during attacks may trigger migraines.45 Stazi46 found that long-term caffeine intake reduced hippocampal neuron loss in AD mouse models. Moore47 demonstrated that duloxetine improved pain relief and emotional outcomes in adult chronic pain patients. Vannabhum48 identified enriched purine metabolism pathways in patients with trapezius myofascial pain using LC-MS/QTOF non-targeted metabolomics. Elevated purine metabolites can cause local metabolic abnormalities, inflammation, and oxidative stress.
Caffeine and its metabolites are central nervous system stimulants, primarily exerting their effects by antagonizing adenosine receptors, enhancing sympathetic nerve activity and increasing skeletal muscle excitability.40 Caffeine can enhance pain relief in the short term, but long-term high intake can lead to central nervous system dependence and sensitization, which can cause more frequent headaches and worsen MPS symptoms. Furthermore, an observational study involving 139 participants found that patients with shorter sleep durations or higher caffeine intake had higher pain sensitivity.49 These results suggest that caffeine and its metabolites may indirectly exacerbate the occurrence and maintenance of MPS-related pain through mechanisms such as enhanced central nervous system excitability, sympathetic nerve activation and muscle tension.
This study observed that in an MTrPs rat model, decreased levels of caffeine and its metabolites coexisted with increased expression of hippocampal injury/central sensitization markers (such as c-fos), suggesting that metabolic abnormalities may be involved in central mechanisms. Some studies have found that sustained moderate caffeine intake inhibits the proliferation of hippocampal neural progenitor cells in adult mice which reduces neurogenesis.50,51 A study showed that moderate-dose (20–30 mg/kg/day) caffeine treatment decreased the proliferation rate of newly formed neurons in the dentate gyrus.50 However, in some neurodegenerative models (such as drug-induced hippocampal injury models), caffeine has been reported to have neuroprotective effects on the hippocampus which can improve cognitive function and memory,51 such as reducing oxidative stress and inflammatory responses, and promoting the survival and maturation of newly formed neurons. Furthermore, caffeine can also regulate synaptic plasticity and neural network activity by antagonizing adenosine receptors. Studies have found that caffeine enhances NMDA receptor-mediated synaptic currents in hippocampal slices, potentially affecting synaptic transmission and plasticity.52 These studies suggest that the effects of caffeine on hippocampal neural structure and function are not uniform but may depend on dosage, administration method, timing, and the context of the animal/disease model.
Clinical studies have shown that MPS patients not only present with chronic myofascial pain but also frequently experience anxiety, depression and other mood abnormalities.53 Approximately 30–50% of patients had varying degrees of anxiety or depressive symptoms, and these mood abnormalities were closely related to pain intensity, duration and quality of life.54 These results indicate that the pathological mechanism of MPS involves not only peripheral myofascial injury but also is closely related to abnormal central nervous system regulation. This study observed decreased levels of caffeine and its metabolites in MTrPs-induced hypersensitivity rats, accompanied by increased c-fos expression in the hippocampus, suggesting that abnormal caffeine metabolism may be involved in central sensitization and abnormal neural activity. However, this study did not assess emotion-related behaviors in the model rats; therefore, the direct association between abnormal caffeine metabolism and emotional state remains unclear. Combined with clinical data, it can be inferred that metabolic abnormalities may not only drive pain but also exacerbate emotional symptoms. Therefore, future research should supplement the MTrPs model with emotional and behavioral assessments, and combine caffeine intervention or metabolite regulation experiments to verify its effects on pain and anxiety/depression-like behaviors.
Our study revealed a significant reduction of caffeine and its metabolites in the hippocampus of MPS rats. This finding suggests that caffeine depletion may exacerbate psychological distress. Negative emotions can both lower pain tolerance and increase pain perception, creating a vicious cycle that impacts health and quality of life25. Thus, using caffeine or A2A receptor antagonists may improve hippocampal injury-induced emotional and cognitive dysfunction and alleviate pain. Metabolomics analysis revealed the correlation between caffeine and its key metabolites and c-fos expression. However, we were unable to simultaneously obtain more refined histological indicators such as the number of neurons, synaptic density or glial cell activation in the hippocampal CA1 region. Therefore, we were unable to conduct a direct correlation analysis between xanthine levels and the degree of hippocampal histological damage. Although KEGG analysis enriched treatment-related pathways, functional validation of key metabolites or enzymes is still needed. Future studies could combine transcriptomics and metabolomics to explore gene expression regulation behind differential metabolites and construct a “gene - metabolite - phenotype” network. Additionally, employing siRNA or CRISPR techniques to knock down or edit key genes or metabolic enzymes in enriched pathways could verify their roles in MPS pathogenesis.
Conclusion
This study used MPS rat models to identify peripheral and central sensitization phenomena, thereby establishing a reliable model for studying the pathogenesis of MPS. UHPLC-HRMS analysis revealed hippocampal metabolomic changes in MPS rats, particularly a reduction in caffeine metabolism. These findings suggest a potential link between caffeine metabolism and the neurophysiological mechanisms of MPS. This may be related to multiple factors, including the overall reprogramming of purine metabolic pathways under chronic pain conditions, altered activity of hepatic CYP1A2 metabolic enzymes, changes in blood-brain barrier permeability, and metabolic redistribution caused by inflammation/stress. However, this study can only reveal the association, not directly establish a causal relationship. To prove whether the decrease in caffeine metabolites is involved in the pathological mechanism of MPS, future studies need to conduct time-series sampling, enzyme activity detection, isotope tracing, and intervention experiments such as caffeine supplementation or blockage to verify the potential causal relationship. This study enriches the theoretical basis of the central mechanism of MPS and provides a new theoretical basis for the search for potential metabolic biomarkers.
Acknowledgments
This study was supported by National Natural Science Foundation of China, Regional Foundation of China (No. 82160226); Guizhou Province Science and Technology Plan Project (Grants No: Qianke He Foundation -ZK[2024] Key 036); Guizhou Province Science and Technology Plan Project (Grants No: Qianke He Foundation -ZK[2023] Key 044); Guizhou Province Science and Technology Plan Project (Grants No: Qianke He Foundation –ZK[2023]general 389); Guizhou Province Science and Technology Plan Project (Grants No: Qianke He Foundation –ZK[2023]general 370).
Funding
There is no funding to report.
Disclosure
The authors report no conflicts of interest in this work.
References
1. Lam C, Francio VT, Gustafson K, et al. Myofascial pain - A major player in musculoskeletal pain. Best Pract Res Clin Rheumatol. 2024;38(1):101944. doi:10.1016/j.berh.2024.101944
2. Rezaee H, Behkar A, Tafakhori A, et al. Relationship of myofascial trigger points with related disability, anxiety, and depression in patients with migraine headaches. Head Face Med. 2024;20(1):47. doi:10.1186/s13005-024-00454-w
3. Bonder JH, Chi M, Rispoli L. Myofascial pelvic pain and related disorders. Phys Med Rehabil Clin N Am. 2017;28(3):501–18. doi:10.1016/j.pmr.2017.03.005
4. Ji Y, Xiao Y, Bai X, et al. Modulation of comorbid depression of neuropathic pain by dopamine input from VTA to the ventral hippocampus. Theranostics. 2025;15(9):4101–4123. doi:10.7150/thno.104394
5. Gao J, Wang D, Zhu C, et al. 1H-MRS reveals abnormal energy metabolism and excitatory-inhibitory imbalance in a chronic migraine-like state induced by nitroglycerin in mice. J Headache Pain. 2024;25(1):163. doi:10.1186/s10194-024-01872-6
6. Niddam D, Lee S-H, Su Y-T, et al. Brain structural changes in patients with chronic myofascial pain. Eur J Pain. 2017;21(1):148–158. doi:10.1002/ejp.911
7. Miao B, Yao H, Chen P, et al. Differential activation of pERK1/2 and c-Fos following injury to different regions of primary sensory neuron. Life. 2022;12(5). doi:10.3390/life12050752
8. Gao YJ, Ji RR. c-Fos and pERK, which is a better marker for neuronal activation and central sensitization after noxious stimulation and tissue injury? Open Pain J. 2009;2:11–17. doi:10.2174/1876386300902010011
9. Jayathilake NJ, Phan TT, Kim J, et al. Modulating neuroplasticity for chronic pain relief: noninvasive neuromodulation as a promising approach. Exp Mol Med. 2025;57(3):501–514. doi:10.1038/s12276-025-01409-0
10. Carter JL, Lubahn C, Lorton D, et al. Adjuvant-induced arthritis induces c-Fos chronically in neurons in the hippocampus. J Neuroimmunol. 2011;230(1–2):85–94. doi:10.1016/j.jneuroim.2010.09.005
11. Patti GJ, Yanes O, Siuzdak G. Innovation: metabolomics: the apogee of the omics trilogy. Nat Rev Mol Cell Biol. 2012;13(4):263–269. doi:10.1038/nrm3314
12. Johnson CH, Ivanisevic J, Siuzdak G. Metabolomics: beyond biomarkers and towards mechanisms. Nat Rev Mol Cell Biol. 2016;17(7):451–459. doi:10.1038/nrm.2016.25
13. Nehlig A. Effects of coffee/caffeine on brain health and disease: what should I tell my patients? Pract Neurol. 2016;16(2):89–95. doi:10.1136/practneurol-2015-001162
14. Ord AS, Coddington K, Maksad GP, et al. Neuropsychological symptoms and functional capacity in older adults with chronic pain. Gerontol Geriatr Med. 2024;10:23337214241307537. doi:10.1177/23337214241307537
15. Zhang H, Lü -J-J, Huang Q-M, et al. Histopathological nature of myofascial trigger points at different stages of recovery from injury in a rat model. Acupunct Med. 2017;35(6):445–451. doi:10.1136/acupmed-2016-011212
16. Huang QM, Lv -J-J, Ruanshi Q-M, et al. Spontaneous electrical activities at myofascial trigger points at different stages of recovery from injury in a rat model. Acupunct Med. 2015;33(4):319–324. doi:10.1136/acupmed-2014-010666
17. Chaplan SR, Bach FW, Pogrel JW, et al. Quantitative assessment of tactile allodynia in the rat paw. J Neurosci Methods. 1994;53(1):55–63. doi:10.1016/0165-0270(94)90144-9
18. Dixon WJ. Efficient analysis of experimental observations. Annu Rev Pharmacol Toxicol. 1980;20:441–462. doi:10.1146/annurev.pa.20.040180.002301
19. Want EJ, Masson P, Michopoulos F, et al. Global metabolic profiling of animal and human tissues via UPLC-MS. Nat Protoc. 2013;8(1):17–32. doi:10.1038/nprot.2012.135
20. Fernández-de-Las-Peñas C, Nijs J, Cagnie B, et al. Myofascial pain syndrome: a nociceptive condition comorbid with neuropathic or nociplastic pain. Life. 2023;13(3):694. doi:10.3390/life13030694
21. Shi H-J, Wang S, Wang X-P, et al. Hippocampus: molecular, cellular, and circuit features in anxiety. Neuroscience Bulletin. 2023;39(6):1009–1026. doi:10.1007/s12264-023-01020-1
22. Kami K, Tajima F, Senba E. Brain mechanisms of exercise-induced hypoalgesia: to find a way out from “fear-avoidance belief”. Int J Mol Sci. 2022;23(5):2886. doi:10.3390/ijms23052886
23. Wei J, Wang L, Zhang Y, et al. TRIM25 promotes temozolomide resistance in glioma by regulating oxidative stress and ferroptotic cell death via the ubiquitination of keap1. Oncogene. 2023;42(26):2103–2112. doi:10.1038/s41388-023-02717-3
24. de Tommaso M, Vecchio E, Nolano M. The puzzle of fibromyalgia between central sensitization syndrome and small fiber neuropathy: a narrative review on neurophysiological and morphological evidence. Neurol Sci. 2022;1–18.
25. Ma T, Ji -Y-Y, Yan L-F, et al. Gray matter volume abnormality in chronic pain patients with depressive symptoms: a systemic review and meta-analysis of voxel-based morphometry studies. Front Neurosci. 2022;16:826759. doi:10.3389/fnins.2022.826759
26. Vasic V, Schmidt MHH. Resilience and vulnerability to pain and inflammation in the hippocampus. Int J Mol Sci. 2017;18(4):739. doi:10.3390/ijms18040739
27. Romero-Grimaldi C, Berrocoso E, Alba-Delgado C, et al. Stress increases the negative effects of chronic pain on hippocampal neurogenesis. Anesth Analg. 2015;121(4):1078–1088. doi:10.1213/ANE.0000000000000838
28. Sheline YI, Liston C, McEwen BS. Parsing the hippocampus in depression: chronic stress, hippocampal volume, and major depressive disorder. Biol Psychiatry. 2019;85(6):436–438. doi:10.1016/j.biopsych.2019.01.011
29. Schwabe L, Hermans EJ, Joëls M, et al. Mechanisms of memory under stress. Neuron. 2022;110(9):1450–1467. doi:10.1016/j.neuron.2022.02.020
30. Alfonso Pecchio AR, Cardozo Gizzi AM, Renner ML, et al. c-Fos activates and physically interacts with specific enzymes of the pathway of synthesis of polyphosphoinositides. Mol Biol Cell. 2011;22(24):4716–4725. doi:10.1091/mbc.e11-03-0259
31. Zeng X, Mai J, Xie H, et al. Activation of CB1R alleviates central sensitization by regulating HCN2-pNR2B signaling in a chronic migraine rat model. J Headache Pain. 2023;24(1):44. doi:10.1186/s10194-023-01580-7
32. Sun Y, Ma L, Wang S, et al. Neuroimaging differences between chronic migraine with and without medication overuse headache: a 7 Tesla multimodal MRI study. J Headache Pain. 2025;26(1):54. doi:10.1186/s10194-025-01988-3
33. Arnaud MJ. Pharmacokinetics and metabolism of natural methylxanthines in animal and man. Handb Exp Pharmacol. 2011;(200):33–91.
34. Yelanchezian MY, Waldvogel HJ, Faull RL, Kwakowsky A, et al. Neuroprotective effect of caffeine in alzheimer’s disease. Molecules. 2022;27(12):3737.
35. Merighi S, Travagli A, Nigro M, et al. Caffeine for prevention of alzheimer’s disease: is the A(2A) adenosine receptor its target? Biomolecules. 2023;13(6):967. doi:10.3390/biom13060967
36. Kennedy DO, Wightman EL. Mental performance and sport: caffeine and co-consumed bioactive ingredients. Sports Med. 2022;52(Suppl 1):69–90. doi:10.1007/s40279-022-01796-8
37. Borea PA, Gessi S, Merighi S, et al. Pharmacology of adenosine receptors: the state of the art. Physiol Rev. 2018;98(3):1591–1625. doi:10.1152/physrev.00049.2017
38. Latini S, Pedata F. Adenosine in the central nervous system: release mechanisms and extracellular concentrations. J Neurochem. 2001;79(3):463–484. doi:10.1046/j.1471-4159.2001.00607.x
39. Huang ZL, Urade Y, Hayaishi O. The role of adenosine in the regulation of sleep. Curr Top Med Chem. 2011;11(8):1047–1057. doi:10.2174/156802611795347654
40. Fredholm BB, Bättig K, Holmén J, et al. Actions of caffeine in the brain with special reference to factors that contribute to its widespread use. Pharmacol Rev. 1999;51(1):83–133.
41. Belayneh A, Molla F. The effect of coffee on pharmacokinetic properties of drugs: a review. Biomed Res Int. 2020;2020(1):7909703. doi:10.1155/2020/7909703
42. Matsumura N, Aoyama K. Glutathione-Mediated neuroprotective effect of purine derivatives. Int J Mol Sci. 2023;24(17):13067. doi:10.3390/ijms241713067
43. Vincenzi F, Pasquini S, Contri C, et al. Pharmacology of adenosine receptors: recent advancements. Biomolecules. 2023;13(9):1387. doi:10.3390/biom13091387
44. Hamilton PJ, Chen EY, Tolstikov V, et al. Chronic stress and antidepressant treatment alter purine metabolism and beta oxidation within mouse brain and serum. Sci Rep. 2020;10(1):18134. doi:10.1038/s41598-020-75114-5
45. Guieu R, Devaux C, Henry H, et al. Adenosine and migraine. Can J Neurol Sci. 1998;25(1):55–58. doi:10.1017/S0317167100033497
46. Stazi M, Lehmann S, Sadman Sakib M, et al. Long-term caffeine treatment of Alzheimer mouse models ameliorates behavioural deficits and neuron loss and promotes cellular and molecular markers of neurogenesis. Cell Mol Life Sci. 2021;79(1):1–18.
47. Birkinshaw H, Friedrich CM, Cole P, et al. Antidepressants for pain management in adults with chronic pain: a network meta‐analysis. Cochrane Database Syst Rev. 2023(5).
48. Vannabhum M, Harnphadungkit K, Akarasereenont P, et al. Untargeted metabolomics analysis using LC-MSQTOF for metabolite profile comparison between patients with myofascial pain of upper trapezius muscle versus controls. Siriraj Med J. 2022;74(11):792–803. doi:10.33192/Smj.2022.94
49. Al-Khudhairy MW, Alkhamsi Alqahtani GB, Altwijri AMA, et al. Sleep, caffeine, BMI, and pressure pain threshold in temporomandibular disorder patients: an observational study. Cureus. 2024;16(4):e57703. doi:10.7759/cureus.57703
50. Wentz CT, Magavi SS. Caffeine alters proliferation of neuronal precursors in the adult hippocampus. Neuropharmacology. 2009;56(6–7):994–1000. doi:10.1016/j.neuropharm.2009.02.002
51. Tiwari V, Mishra A, Singh S, et al. Caffeine Improve memory and cognition via modulating neural progenitor cell survival and decreasing oxidative stress in alzheimer’s rat model. Curr Alzheimer Res. 2023;20(3):175–189. doi:10.2174/1567205020666230605113856
52. Martins RS, Rombo DM, Gonçalves-Ribeiro J, et al. Caffeine has a dual influence on NMDA receptor-mediated glutamatergic transmission at the hippocampus. Purinergic Sig. 2020;16(4):503–518. doi:10.1007/s11302-020-09724-z
53. Hampe CS, Yund BD, Orchard PJ, et al. Differences in MPS I and MPS II disease manifestations. Int J Mol Sci. 2021;22(15):7888. doi:10.3390/ijms22157888
54. Fernandez-de-Las-Penas C, Dommerholt J. International consensus on diagnostic criteria and clinical considerations of myofascial trigger points: a delphi study. Pain Med. 2018;19(1):142–150. doi:10.1093/pm/pnx207
 © 2026 The Author(s). This work is published and licensed by Dove Medical Press Limited. The
full terms of this license are available at https://www.dovepress.com/terms
and incorporate the Creative Commons Attribution
- Non Commercial (unported, 4.0) License.
By accessing the work you hereby accept the Terms. Non-commercial uses of the work are permitted
without any further permission from Dove Medical Press Limited, provided the work is properly
attributed. For permission for commercial use of this work, please see paragraphs 4.2 and 5 of our Terms.
© 2026 The Author(s). This work is published and licensed by Dove Medical Press Limited. The
full terms of this license are available at https://www.dovepress.com/terms
and incorporate the Creative Commons Attribution
- Non Commercial (unported, 4.0) License.
By accessing the work you hereby accept the Terms. Non-commercial uses of the work are permitted
without any further permission from Dove Medical Press Limited, provided the work is properly
attributed. For permission for commercial use of this work, please see paragraphs 4.2 and 5 of our Terms.