")
Back to Journals » Diabetes, Metabolic Syndrome and Obesity » Volume 16
Metabolic Characteristics of Gestational Diabetes Mellitus and the Effects on Pregnancy Outcomes
Authors Luo P , Fan Y , Xiong Y , Zhang C , Yang Z , Sun F , Mei B
Received 29 September 2022
Accepted for publication 30 November 2022
Published 11 January 2023 Volume 2023:16 Pages 15—29
DOI https://doi.org/10.2147/DMSO.S390999
Checked for plagiarism Yes
Review by Single anonymous peer review
Peer reviewer comments 2
Editor who approved publication: Prof. Dr. Antonio Brunetti
Ping Luo,1 Ying Fan,2 Yusha Xiong,2 Chunlin Zhang,1 Zhiping Yang,1 Fenglan Sun,1 Bing Mei1
1Department of Laboratory Medicine, Jingzhou Hospital Affiliated to Yangtze University, Jingzhou, People’s Republic of China; 2Gongan County Maternal and Child Health Care Hospital, Jingzhou, People’s Republic of China
Correspondence: Bing Mei, Department of Laboratory Medicine, Jingzhou Hospital Affiliated to Yangtze University, Jingzhou, People’s Republic of China, Email [email protected]
Objective: To describe the metabolic characteristics of gestational diabetes mellitus (GDM) and assess their effects on perinatal outcomes.
Methods: A two-center nested case‒control study was designed, including 192 pregnant women with GDM and 191 pregnant women with normal glucose tolerance (NGT). Serum glucose and insulin concentrations based upon the 75 g oral glucose tolerance test (OGTT) were measured. Several indices were calculated to describe the metabolic characteristics of the subjects. The relationship between glucose metabolism parameters and pregnancy outcomes was evaluated using stepwise linear regression and binary logistic regression.
Results: Compared with the NGT group, the GDM group showed significantly higher fasting and postprandial glucose parameters but significantly lower fasting and postprandial insulin responses. Meanwhile, the GDM group had significantly lower HOMA-β, DI and ISIMatsuda but comparable HOMA-IR. The IFG subgroup showed significantly lower FINS/FPG only, while the IGT and IFSG subgroups showed deficiency in both fasting and postprandial insulin response. The IFSG subgroup had the highest glucose parameters and the lowest insulin parameters, as well as significantly lower ISIMatsuda and HOMA-β than the NGT group. FPG had a significant effect on infants’ birth weight, and 1hPG and FINS/FPG had a significant effect on delivery gestational age. AUC-INS, IGI60 and DI were related to premature delivery risk after adjusting for confounders. The IFG subgroup of GDM was 2.319 times more likely to be subject to cesarean section than the NGT group. FPG, FINS/FPG, AUC-GLU, AUC-INS/AUC-GLU and HOMA-β were related to macrosomia risk.
Conclusion: Beta cell dysfunction rather than insulin resistance determines the occurrence of GDM in the central Chinese population. Women with predominant insulin secretion defects had a similar risk of adverse perinatal outcomes to women with NGT. Our study provided a basis for the selection of glucose metabolism monitoring indicators useful for the prevention of adverse perinatal outcomes.
Keywords: insulin resistance, insulin sensitivity, glucose metabolism, perinatal outcomes, type 2 diabetes mellitus
Introduction
Pregnancy is a complicated physiological process. The endocrine system and metabolism of pregnant women undergo great changes to meet the growth and nutritional needs of the fetus, especially insulin secretion and glucose metabolism.1 Gestational diabetes mellitus (GDM) is a group of clinical syndromes characterized by hyperglycemia caused by relative and/or absolute insufficiency of insulin due to hormonal changes, chronic low-grade inflammation, weight gain, and changes in eating habits during pregnancy.2–7 GDM is the most common endocrine disease in women during pregnancy, affecting 14% of pregnant women worldwide8 and leading to short- and long-term adverse outcomes for the mother and their offspring,9 such as future development of obesity, metabolic syndrome (MetS), type 2 diabetes mellitus (T2DM) and cardiovascular disease (CVD) for both the mother and the offspring.10–14
Although insulin resistance and islet β cell dysfunction are generally believed to affect glucose homeostasis and ultimately lead to the development of GDM,15 the relative contributions of β cell function and insulin sensitivity in the pathogenesis of GDM are ambiguous, and which of the two is the primary defect is much debated. Several studies suggested that impaired insulin sensitivity was a main factor for GDM,16,17 whereas others indicated that decreased β cell function was a predominant defect in the development of GDM,18 especially in lean GDM subjects.19 These inconsistent results might be attributable to different populations. However, to our knowledge, data about the Chinese population are sorely lacking, especially in central China.
Moreover, the pathogenesis of GDM seems to be different in individuals exhibiting discrepant glucose metabolism characteristics.17,20,21 Some pregnant women showed only elevated fasting blood glucose but normal postprandial blood glucose, and some showed the opposite, while others showed both abnormal fasting and postprandial blood glucose.16,22 Moreover, different metabolic phenotypes and mechanisms seem to be associated with different pregnancy outcomes. In this study, we compared insulin and glucose metabolism parameters of pregnant women with GDM and normal glucose tolerance (NGT), aiming to describe the endocrine and glucose metabolism characteristics of pregnant women with GDM and to explore the relationship of these characteristics with pregnancy outcomes.
Materials and Methods
Study Design and Participants
This was a two-center nested case‒control study of 383 subjects from the Jingzhou maternal and child health cohort. Pregnant women who were registered and willing to undergo routine pregnancy check-ups at Jingzhou Hospital Affiliated to Yangtze University and Gongan County Maternal and Child Health Care Hospital in Hubei Province of China from April 2021 to December 2021 were recruited into the cohort on the day of the first pregnancy check-up. According to the guidelines of the International Association of Diabetes and Pregnancy Study Groups (IADPSG), GDM was diagnosed when any one of the following conditions were met: fasting plasma glucose (FPG) ≥ 5.1 mmol/L, 1-hour plasma glucose (1hPG) ≥ 10.0 mmol/L, or 2-hour plasma glucose (2hPG) ≥ 8.5 mmol/L. A total of 208 pregnant women who met the above diagnostic criteria in the cohort were included in the case group (GDM group). A total of 208 age-, basal BMI-, hospital- and gestational age at serum sampling-matched NGT individuals in the cohort were selected as controls (NGT group) at a frequency of 1:1. Among the 208 GDM and 208 NGT individuals, subjects who met the following criteria were excluded: (1) had other types of diabetes; (2) had heart, liver or kidney disease, hypertension, thyroid dysfunction, polycystic ovary syndrome or any other pregnancy complications; (3) had taken drugs affecting glucose metabolism during pregnancy; (4) had twin or multiple pregnancies; (5) conceived by assisted reproduction technology; and (6) had pregnancy outcomes that could not be followed. Finally, a total of 383 subjects (192 patients and 191 controls) were included in our study. According to the different metabolic phenotypes of GDM cases, the GDM group was further classified into three subgroups: (1) impaired fasting glucose (IFG): with normal 1hPG and 2hPG values but abnormal FPG; (2) impaired glucose tolerance (IGT): with excessive 1hPG or 2hPG values but normal FPG; and (3) impaired fasting and stimulated glucose (IFSG): with both abnormal FPG and 1hPG or 2hPG values.
Two-milliliter serum samples based on 75 g OGTT were collected and stored at −80°C for insulin measurement. OGTT was performed on all 383 subjects, among which insulin levels were measured only in 209 subjects (104 patients and 105 controls).
Laboratory Measurements
The 75 g OGTT-based FPG, 1hPG and 2hPG were measured by the glucose oxidase method on AU680 and AU5800 biochemical analyzers (Beckman Coulter, America). OGTT-based fasting insulin (FINS), 1-hour insulin (1hINS) and 2-hour insulin (2hINS) were measured by enzyme-linked immunosorbent assay (ELISA) using the Insulin ELISA BS-0783 (Bensheng, China).
The department of Laboratory Medicine of both hospitals participated in External Quality Assessment (EQA) to ensure the accuracy of glucose test results and inter-laboratory comparison of Internal Quality Control (IQC) to ensure the consistency of glucose values organized by Hubei Center for Clinical Laboratory. Standard curves were protracted for each batch of insulin measurement with the correlation coefficient r exceeding 0.99.
Estimation of Insulin Resistance and β Cell Function
Among the many indices used for assessing insulin sensitivity/resistance and β cell function, we considered both indicators based on the homoeostasis model (fasting state) and dynamic indicators based on the 75 g OGTT. The homoeostasis model assessment of insulin resistance (HOMA-IR) and the Matsuda insulin sensitivity index (ISIMatsuda) were used to measure insulin sensitivity/resistance, while the homoeostasis model assessment of β cell function (HOMA-β), 60 min insulinogenic index (IGI60) and OGTT-derived disposition index (DI) were calculated to assess β cell function. FPG, 1hPG, and 2hPG and FINS, 1hINS, and 2hINS were the most direct evidence of insulin resistance and β cell function. The area under the insulin curve (AUC-INS) reflects the total amount of insulin secreted during the OGTT. Moreover, FINS/FPG, 1hINS/1hPG, 2hINS/2hPG and the ratio of the total area under the insulin curve to the area under the glucose curve (AUC-INS/AUC-GLU) were calculated to adjust the stimulating effect of blood glucose on insulin secretion. HOMA-IR was calculated as (FPG× FINS)/22.5, and HOMA-β was calculated as 20×FINS/(FPG-3.5); ISIMatsuda was calculated as 10000/[(FPG×FINS)1/2(GLUmean×INSmean)1/2] using fasting, 1-hour, and 2-hour values of 75 g OGTT. IGI60 was calculated as (1hINS-FINS)/(1hPG-FPG), and DI was estimated by multiplying IGI60 with ISIMatsuda to reflect β cell function adjusting for insulin sensitivity.17 AUC-GLU was calculated as 0.5×FPG+1hPG+0.5×2hPG, and AUC-INS was calculated as 0.5×FINS+1hINS+0.5×2hINS. Insulin levels were measured in μU/mL, and glucose levels were measured in mmol/L.
Definition
Preterm delivery: delivery between 28 and 37 weeks of gestation. Postpartum hemorrhage: for vaginal delivery, the bleeding volume exceeded 500 mL within 24 hours after delivery of the fetus; for cesarean section, the bleeding volume exceeded 1000 mL. Macrosomia: the birth weight of the newborn ≥ 4000 g. Infant health: infants with no complications at birth are assessed as good; infants with nonlife-threatening complications are assessed as average; and infants with life-threatening complications are assessed as poor.
Ethical Approval
Ethics approvals were obtained by the ethics committees of Jingzhou Hospital Affiliated to Yangtze University and Gongan County Maternal and Child Health Care Hospital. This study followed the principles of the Declaration of Helsinki. The women who participated in the study provided informed consent.
Statistical Analysis
Normally distributed data are presented as the mean ± SD. Nonnormally distributed data are displayed as the median (interquartile range). Normality of distribution for continuous variables was tested by the Kolmogorov‒Smirnov test, and the Levene test was used for homogeneity of variance test. Two-sample t-test for continuous variables conforming to normal distribution, Mann‒Whitney U-test for continuous variables with nonnormal distribution and Chi-square test or Mann‒Whitney U-test for categorical variables were used to evaluate the difference in means and proportions between case and control group. ANOVA and Kruskal‒Wallis tests were used for subgroup analyses. Multiple comparisons were conducted by Bonferroni test. Stepwise linear regression and binary logistic regression were used to analyze the relationship between glucose metabolism parameters and pregnancy outcomes. For pregnancy outcome variables that were continuous variables, stepwise linear regression analyses were performed. For pregnancy outcome variables that were categorical, univariate binary logistic regression was used to screen out risk factors for pregnancy outcomes from glucose metabolism parameters (FPG, 1hPG, 2hPG, FINS, 1hINS, 2hINS, AUC-GLU, AUC-INS, AUC-INS/AUC-GLU, ISIMatsuda, HOMA-IR, HOMA-β, IGI60, DI), demographic variables (age, weight, height, BMI, occupation, education, permanent address and the nature of household registration) and clinical characteristic variables (systolic blood pressure, diastolic blood pressure, gravidity and parity). Furthermore, demographic variables and clinical characteristic variables related to pregnancy outcomes were regarded as confounders to adjust for glucose metabolism parameters related to pregnancy outcomes using multivariate binary logistic regression. p< 0.05 was accepted as statistically significant. Analyses were performed with SPSS 25.0 software.
Results
Baseline Characteristics of Participants
To minimize the influence of confounding factors as much as possible, we matched the GDM and NGT groups according to age, basal BMI, hospital and gestational age at serum sampling to keep the baseline characteristics of the two groups as consistent as possible. As shown in Table 1, there was no significant difference in maternal age, height, prepregnancy weight, prepregnancy BMI, diastolic blood pressure and gestational age at enrollment between the two groups. There was also no significant difference in the composition ratio of occupation, education level, household registration address and nature, gravidity and parity between the two groups. However, systolic blood pressure in the GDM group was significantly higher than that in the NGT group at the first trimester of pregnancy (p=0.008), although it did not meet the diagnostic criteria for gestational hypertension.
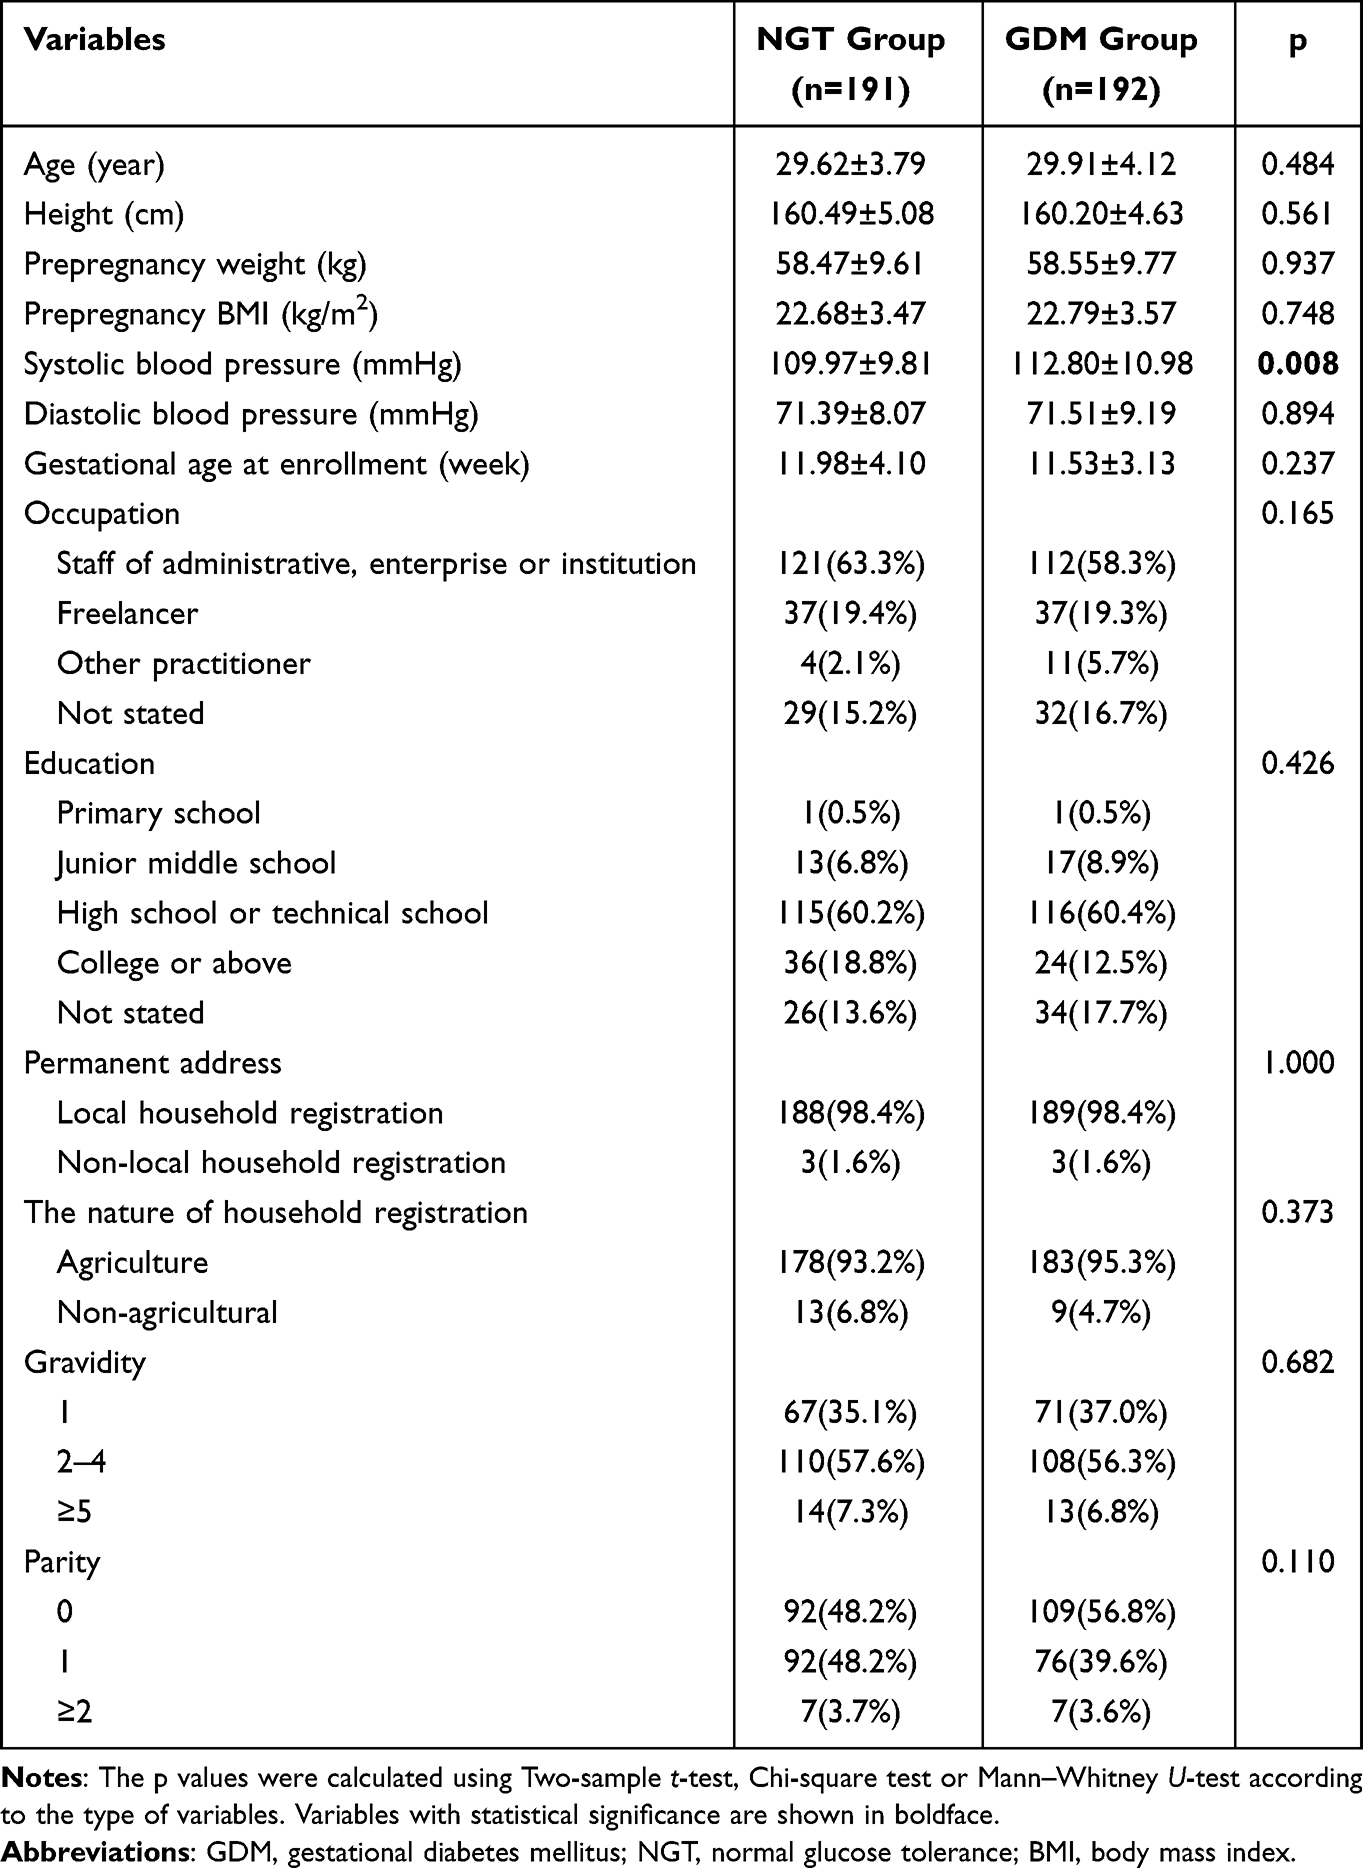 |
Table 1 Baseline Characteristics of the Study Population |
Metabolic Characteristics of Subjects
Figure 1 shows the metabolic characteristics of the NGT and GDM groups. Compared with the NGT group, the GDM group showed significantly higher fasting and postprandial glucose parameters (FPG, 1hPG, 2hPG and AUC-GLU) (Figure 1A and D), as well as significantly lower fasting and postprandial insulin responses (FINS, FINS/FPG, 1hINS/1hPG, 2hINS/2hPG, AUC-INS/AUC-GLU) (Figure 1B and C), suggesting that pregnant women with GDM had decreased β cell function. Meanwhile, subjects with GDM had significantly lower HOMA-β and DI (Figure 1E), further verifying that the function of β cells was impaired in pregnant women with GDM. However, individuals with GDM showed significantly lower FINS but comparable 1hINS, 2hINS and AUC-INS (Figure 1B and D), indicating that β cell function could still be enhanced compensatively with the stimulating effects of increasing postprandial blood glucose. With a significantly higher 1hPG and 2hPG than the NGT group (Figure 1A), the GDM group did not show significantly higher 1hINS and 2hINS (Figure 1B), just providing evidence for impaired β cell function in the GDM group. Combined with the results of insulin parameters adjusted by glucose that FINS/FPG, 1hINS/1hPG, 2hINS/2hPG and AUC-INS/AUC-GLU were significantly lower in the GDM group (Figure 1C and D), it was suggested that pregnant women with GDM had an absolute lack of fasting insulin and a relative lack of postprandial insulin compared with pregnant women with NGT. Moreover, the GDM group had significantly lower ISIMatsuda (p=0.035) but comparable HOMA-IR, which was underestimated due to the impairment of β cell function (Figure 1E). In addition to ISIMatsuda and HOMA-IR, the levels of insulin can also reflect the degree of insulin resistance to some extent. If the insulin secretion response stimulated by glucose does not decrease, the level of insulin will rise to a level corresponding to insulin resistance to maintain blood glucose at a normal level. However, the GDM group in our study did not show higher hyperinsulinemia than the NGT group. In contrast, the GDM group showed lower FINS than the NGT group (Figure 1B). The results above demonstrated that the decreased β cell function was unable to compensate for impaired insulin sensitivity, and β cell dysfunction may be a major factor in the development of GDM.
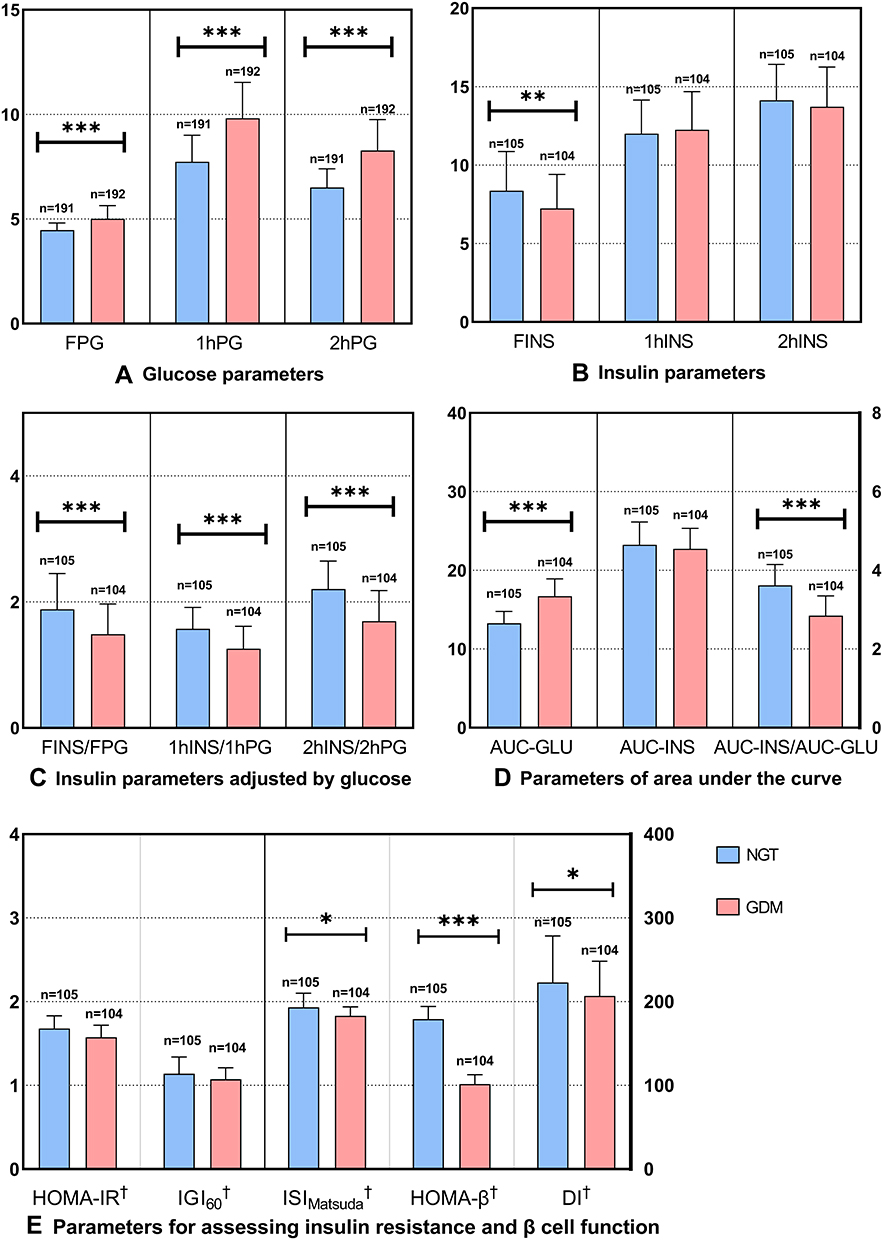 |
Figure 1 Metabolic characteristics of the NGT and GDM groups. (A) Glucose parameters; (B) Insulin parameters; (C) Insulin parameters adjusted by glucose; (D) Parameters of area under the curve; (E) Parameters for assessing insulin resistance and β cell function. †Variable was log-transformed before statistical analysis and is shown as median. *p<0.05; **p<0.01; ***p<0.001. Abbreviations: GDM, gestational diabetes mellitus; NGT, normal glucose tolerance; FPG, fasting plasma glucose; 1hPG, 1-hour plasma glucose; 2hPG, 2-hour plasma glucose; FINS, fasting insulin; 1hINS, 1-hour insulin: 2hINS, 2-hour insulin; INS, insulin; GLU, glucose; AUC, area under the curve; HOMA-IR, homeostasis model assessment of insulin resistance; HOMA-β, homeostasis model assessment of beta cell function; ISIMatsuda, Matsuda insulin sensitivity index; IGI60, insulinogenic index at 60 min; DI, disposition index. |
According to the glucose levels of the 75 g OGTT, the GDM group was divided into three subgroups (IFG, IGT and IFSG). Subjects with abnormal postprandial glucose tolerance only (IGT subgroup) comprised the majority of pregnant women with GDM. The incidence rates of the three subgroups in our study population were IFG 27.08%, IGT 55.21% and IFSG 17.71% (Figure 2). As shown in Figure 3, compared with the NGT group, the IFG group showed significantly lower FINS/FPG but comparable 1hINS/1hPG and 2hINS/2hPG (Figure 3C), indicating that the IFG group had a deficiency in fasting insulin and a normal insulin response to increased postprandial blood glucose. Conversely, the IGT and IFSG groups showed not only a deficiency in fasting insulin but also a decreased insulin response to increased postprandial blood glucose (Figure 3C). The insulin secretion (FINS, 1hINS, 2hINS, AUC-INS) during the OGTT of the three subgroups was not different compared to that of the NGT group, but AUC-INS/AUC-GLU was significantly lower in the IGT and IFSG groups (Figure 3B and D), which have significantly higher glucose parameters (FPG, 1hPG, 2hPG, AUC-GLU) (Figure 3A and D), indicating that the IGT and IFSG groups had a relatively insufficient insulin response to stimulation of increased postprandial blood glucose. Moreover, subjects in the IFSG group had the highest glucose parameters (FPG, 1hPG, 2hPG, AUC-GLU) and the lowest insulin parameters (FINS/FPG, 1hINS/1hPG, 2hINS/2hPG, AUC-INS/AUC-GLU) (Figure 3A–D), suggesting that the IFSG group had the most serious impairment of β cell function. On the other hand, the IFSG group showed significantly lower ISIMatsuda and HOMA-β than the NGT group (Figure 3E), which further verified the hypothesis mentioned above. Although the IGT group had normal FPG levels, the IGT group showed significantly higher FPG than the NGT group. In addition, the IGT and IFSG groups showed similar glucose metabolic characteristics and insulin responses. Therefore, we speculated that the IFG group might have a different pathogenesis from the IGT and IFSG groups and that IGT might be a transitional stage of IFSG. Patients with IGT in the poor control of blood glucose were highly likely to develop IFSG. However, our prediction needs to be further confirmed by cohort studies with more sufficient sample sizes in the future.
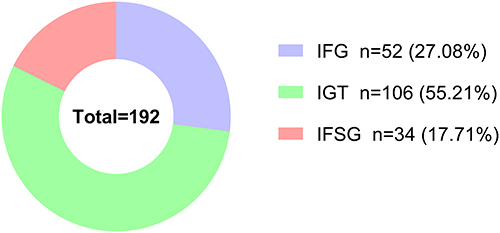 |
Figure 2 Prevalence of GDM subtypes in the GDM group. Abbreviations: GDM, gestational diabetes mellitus; IFG, impaired fasting glucose; IGT, impaired glucose tolerance; IFSG, impaired fasting and stimulated glucose. |
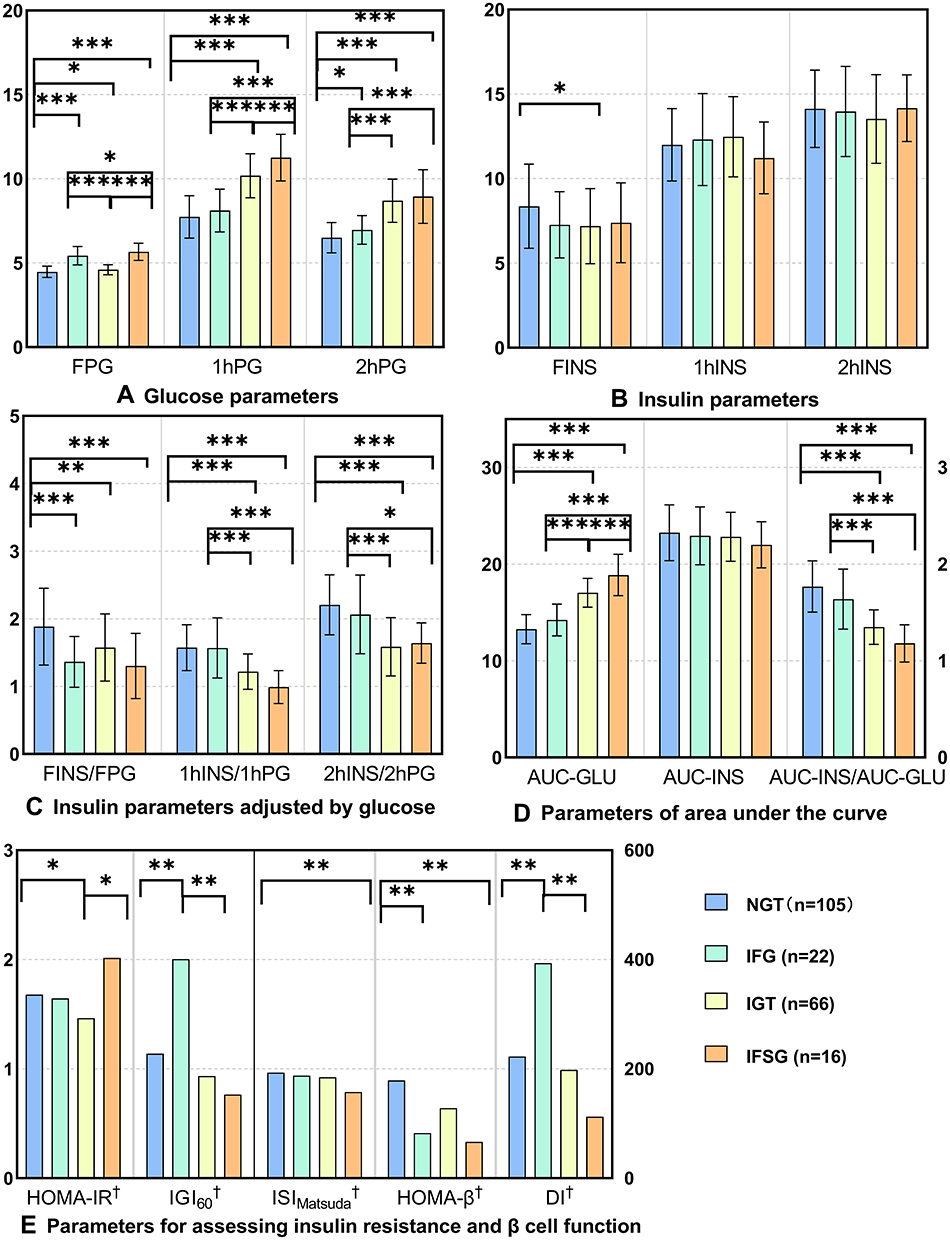 |
Figure 3 Metabolic characteristics of GDM subgroups. (A) Glucose parameters; (B) Insulin parameters; (C) Insulin parameters adjusted by glucose; (D) Parameters of area under the curve; (E) Parameters for assessing insulin resistance and β cell function. †Variables were log-transformed before statistical analysis and are shown as the median. *p<0.05; **p<0.01; ***p<0.001. Abbreviations: GDM, gestational diabetes mellitus; NGT, normal glucose tolerance; IFG, impaired fasting glucose; IGT, impaired glucose tolerance; IFSG, impaired fasting and stimulated glucose; FPG, fasting plasma glucose; 1hPG, 1 hour plasma glucose; 2hPG, 2 hour plasma glucose; FINS, fasting insulin; 1hINS, 1 hour insulin: 2hINS, 2 hour insulin; INS, insulin; GLU, glucose; AUC, area under the curve; HOMA-IR, homeostasis model assessment of insulin resistance; HOMA-β, homeostasis model assessment of beta cell function; ISIMatsuda, Matsuda insulin sensitivity index; IGI60, insulinogenic index at 60 min; DI, 75 g OGTT-derived disposition index. |
Delivery Outcomes of Participants
As shown in Table 2, no significant difference was found between the NGT and GDM groups. However, 3 newborns with birth defects were observed in the GDM group, whereas birth defects never existed in the NGT group. The three birth defects were varus of the right foot, one extra finger of the left thumb, and syndactyly of the left foot. According to the International Classification of Diseases, 10th Revision (ICD10), all 3 birth defects are classified as congenital malformations and deformations of the musculoskeletal system (specific codes: Q65-Q79). In addition, all three pregnant women were treated with diet and exercise interventions and never underwent the treatment with insulin after assessed by clinicians.
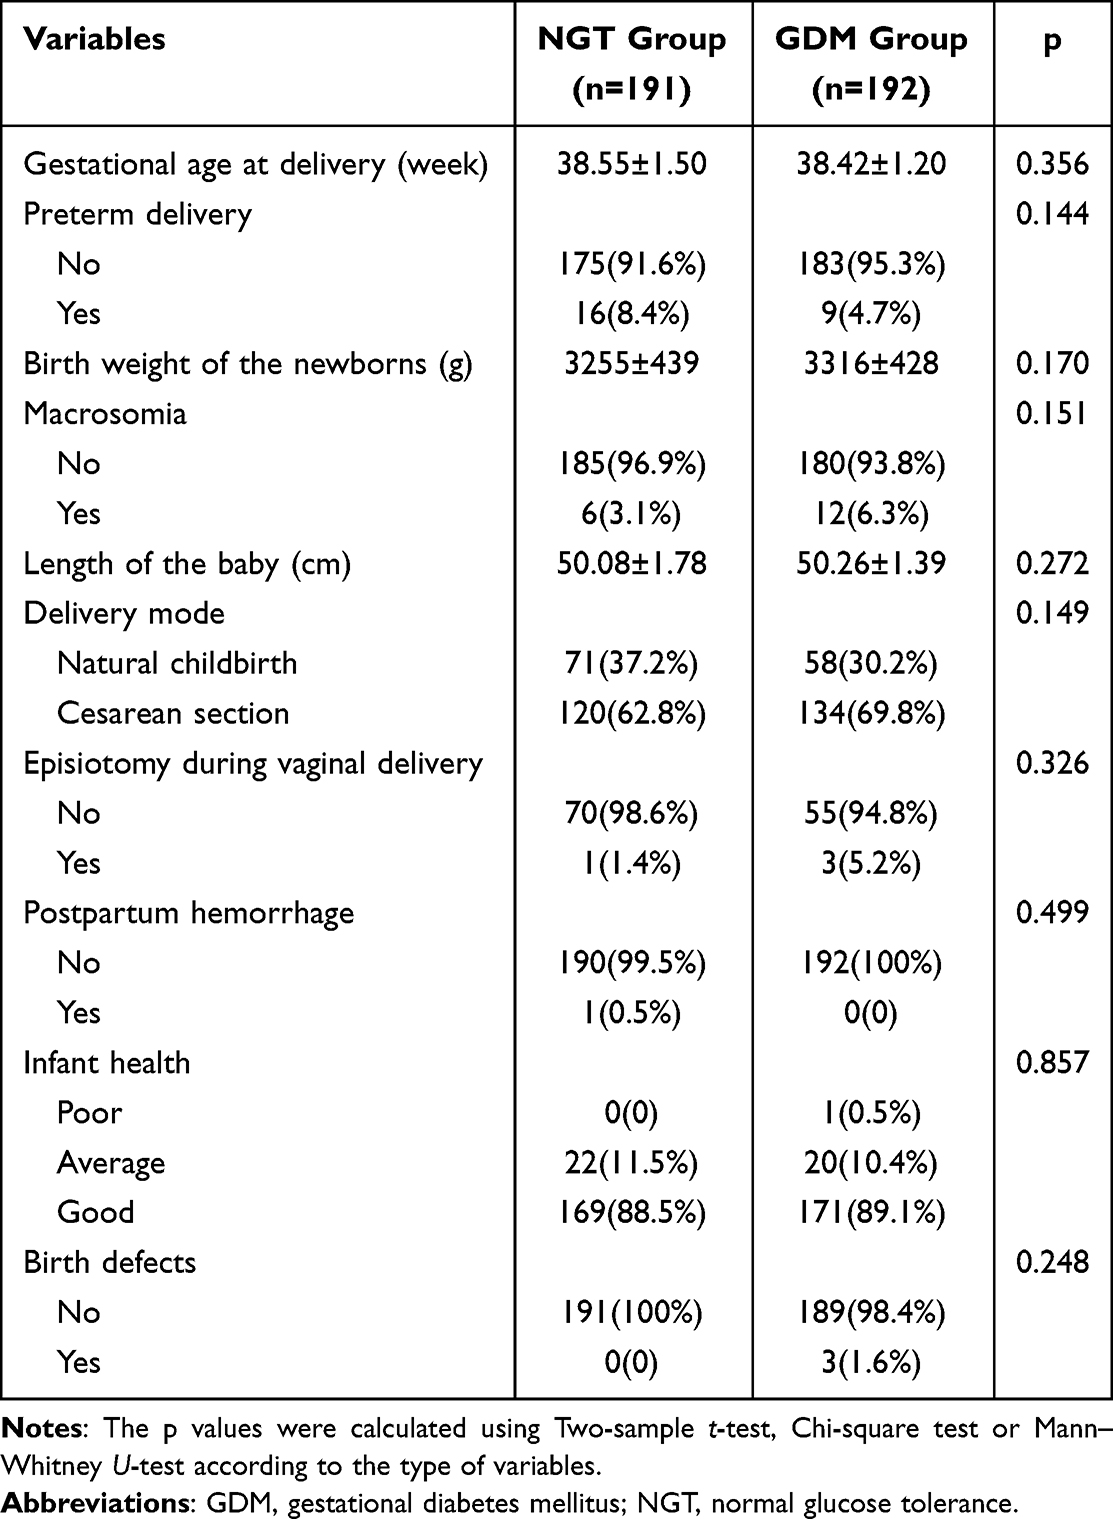 |
Table 2 Delivery Outcomes of Participants |
Effects of Glucose Metabolism on Pregnancy Outcomes
According to stepwise linear regression analysis, FPG, delivery gestational age and prepregnancy BMI had a significant effect on birth weight of infants (Figure 4A). The higher the level of FPG, the heavier the newborn’s birth weight. The regression equation was as follows: birth weight (g) = −3639+144.154×delivery gestational age (week) +191.651×FPG (mmol/L) + 22.289×BMI (kg/m2). These three factors could account for 24.2% of the newborn’s birth weight. Systolic blood pressure, 1hPG and FINS/FPG had a significant effect on delivery gestational age, which could account for 10.3% of the delivery gestational age (Figure 4B). Among them, 1hPG was the main influencing factor. The higher the levels of 1hPG and FINS/FPG, the earlier the delivery gestational age. The regression equation was as follows: delivery gestational age (week) = 43.091–0.169×1hPG (mmol/L)-0.023×systolic blood pressure (mmHg)-0.349×FINS/FPG (mU/L/mmol/L).
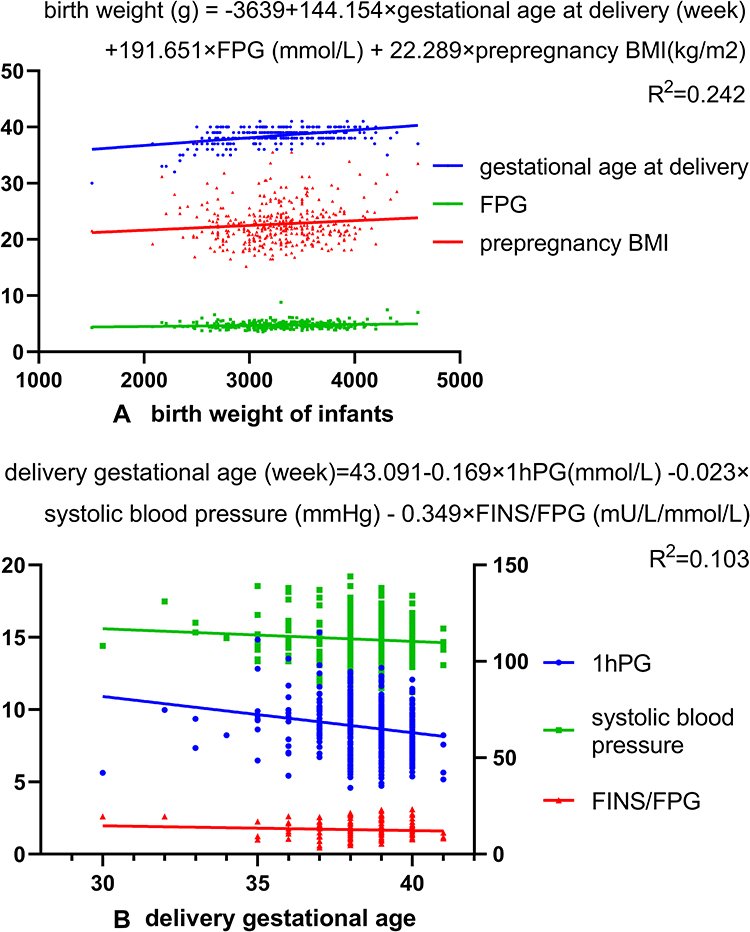 |
Figure 4 Stepwise linear regression analyses of glucose metabolism parameters and pregnancy outcomes (A): birth weight of infants. Independent variables included in the analysis were age, height, weight, prepregnancy BMI, systolic blood pressure, diastolic blood pressure, delivery gestational age and all glucose metabolism parameters of pregnant women; (B): delivery gestational age. Independent variables included in the analysis were age, weight, height, prepregnancy BMI, systolic blood pressure, diastolic blood pressure and all glucose metabolism parameters. Abbreviations: FPG, fasting plasma glucose; 1hPG, 1 hour plasma glucose; FINS/FPG, the ratio of fasting insulin to fasting plasma glucose; BMI, body mass index. |
For risk factors of premature delivery, univariate binary logistic regression analysis showed that AUC-INS, ISIMatsuda, IGI60, DI, prepregnancy BMI, systolic blood pressure and diastolic blood pressure were associated with the risk of premature delivery (Figure 5A). AUC-INS, IGI60 and DI were still related to premature delivery, independent of prepregnancy BMI, systolic blood pressure and diastolic blood pressure.
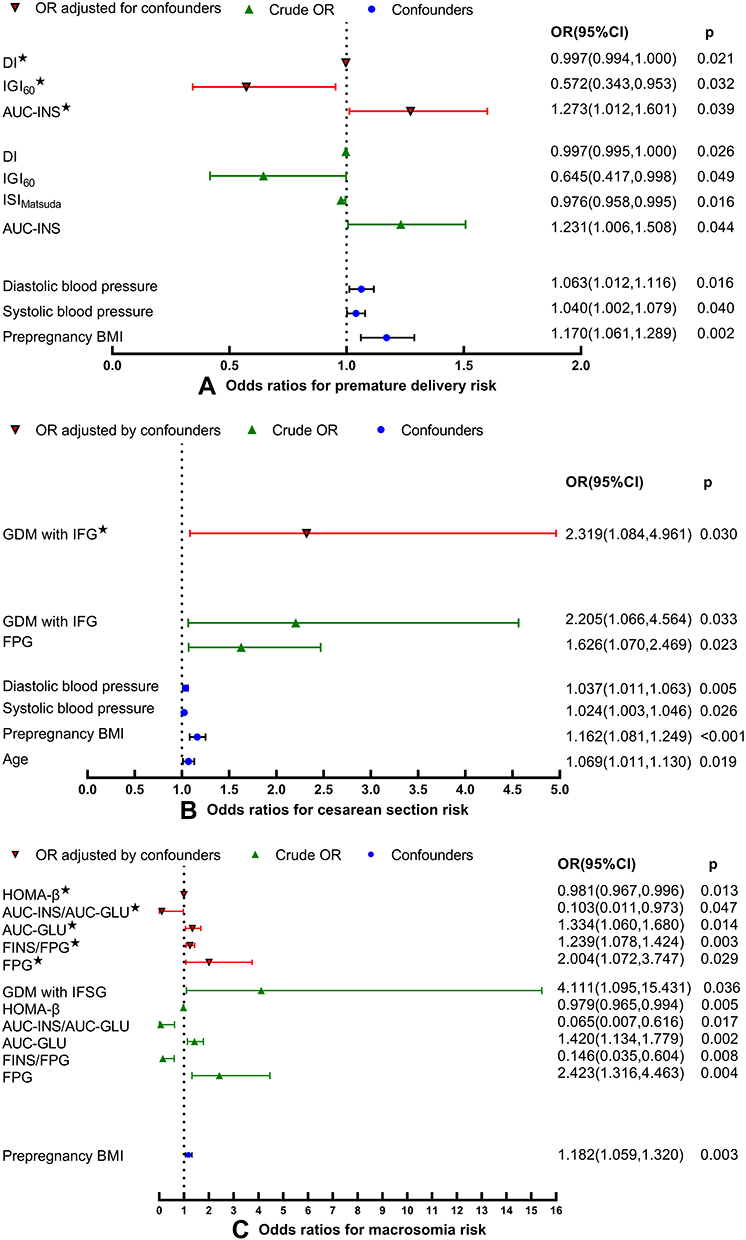 |
Figure 5 Risk factors for adverse perinatal outcomes in glucose metabolism parameters. (A) Odds ratios for premature delivery risk. ★OR was adjusted for prepregnancy BMI, systolic blood pressure and diastolic blood pressure; (B) Odds ratios for cesarean section risk. ★OR was adjusted for age, prepregnancy BMI, systolic blood pressure and diastolic blood pressure; (C) Odds ratios for macrosomia risk. ★OR was adjusted for prepregnancy BMI. Abbreviations: OR, odds ratio; CI, confidence interval; DI, 75 g OGTT-derived disposition index; IGI60, insulinogenic index at 60 min; AUC-INS, area under the insulin curve; ISIMatsuda, Matsuda insulin sensitivity index; BMI, body mass index; GDM, gestational diabetes mellitus; IFG, impaired fasting glucose; FPG, fasting plasma glucose; HOMA-β, homeostasis model assessment of beta cell function; AUC-INS/AUC-GLU, ratio of total area under the insulin curve to area under the glucose curve; AUC-GLU, area under the glucose curve; FINS/FPG, the ratio of fasting insulin to fasting plasma glucose; IFSG, impaired fasting and stimulated glucose. |
For risk factors of cesarean section, univariate binary logistic regression analysis showed that FPG, glucometabolic phenotype of IFG, age, prepregnancy BMI, systolic blood pressure and diastolic blood pressure were associated with the risk of cesarean section (Figure 5B). Multivariate binary logistic regression showed that GDM with IFG was 2.319 times more likely to be subject to cesarean section than the NGT group, independent of age, prepregnancy BMI, systolic blood pressure and diastolic blood pressure.
For risk factors of macrosomia, univariate binary logistic regression analysis showed that FPG, FINS/FPG, AUC-GLU, AUC-INS/AUC-GLU, HOMA-β, glucometabolic phenotype of IFSG and prepregnancy BMI were associated with the risk of macrosomia (Figure 5C). Multivariate binary logistic regression showed that FPG, FINS/FPG, AUC-GLU, AUC-INS/AUC-GLU and HOMA-β were still related to the risk of macrosomia adjusted for prepregnancy BMI.
Discussion
GDM is the most common metabolic disease during pregnancy and an important public health concern worldwide due to its increasing prevalence and adverse outcomes for both the mother and their offspring. However, GDM is a type of diabetes mellitus that is easily ignored because many pregnancy-related metabolic changes often resolve after gestation. Unfortunately, this recovery is temporary for most women with GDM.9
In our study, pregnant women with GDM showed decreased β cell function, which seemed to be the determinant leading to GDM, although decreased insulin sensitivity was also present. The same result was observed in the Bangladesh lean population (BMI < 23 kg/m2)18 and lean Austrian population (23.7 ±0.9 kg/m2)19 which has a prepregnancy BMI similar to our study population (22.79±3.57 kg/m2). However, it was reported that insulin resistance contributed relatively more than reduced insulin secretion to the development of early GDM and was associated with a greater risk of adverse perinatal outcomes.23 The inconsistency may derive from the average age and BMI of the study population, which were 32 ± 5.3 years and 34 ± 4.6 kg/m2 in this study, respectively. It is well known that advanced age and obesity are important risk factors leading to insulin resistance.9,24 Mirabelli et al even believed that maternal obesity was the strongest clinical predictor of GDM because the expanded visceral adipose tissue becomes severely dysfunctional, giving rise to a proinflammatory and insulin-resistant environment.25 Not surprisingly, it was reported in this study that women in the subgroup of GDM with below-median insulin secretion alone had lower prepregnancy BMI compared with the NGT group.23 It is thought that β cell defects are most likely present before conception in many cases.1 Minor deficiencies in the β cell machinery may only be exposed in times of metabolic stress, such as pregnancy.26 An interesting study of Lapolla A on Italian Caucasians that divided the subjects into GDM1 (diagnosed at 16–20 gestational weeks), GDM2 (diagnosed at 26–30 gestational weeks) and NGT groups, reported that β cell function defect in GDM1 was already detectable in the early stage of pregnancy, while GDM2 showed the lowest insulin sensitivity that could still be compensated by β cell function in early pregnancy but developed GDM in late pregnancy due to the defective β cell adaptation to the increase of insulin resistance from early to late pregnancy.27 This study indicates that some pregnant women develop GDM in early pregnancy characterized by β cell dysfunction, and some pregnant women develop GDM in late pregnancy characterized by high insulin resistance. Regrettably, this study did not describe BMI for the 3 subgroups respectively, so we do not know if the difference between GDM1 and GDM2 is derived from BMI. However, combining our study with the studies above, it can be sure that heterogeneity of GDM dominant pathogenesis exists in different populations and individuals. This may be part of the reason why some subjects with GDM continue to have abnormal glucose tolerance after delivery, and some patients whose glucose tolerance has normalized gradually develop T2DM later in life.
Subgroup analysis in our study suggested that the IFG group might have a different pathogenesis from the IGT and IFSG groups, and the IGT might be a transitional stage of IFSG. However, two other studies suggested that the IFG and IFSG subgroups had similar metabolic characteristics.28,29 This inconsistent conclusion may be due to the fact that the conclusions of the two studies were based on the clinical characteristic variables (weight, prevalence of obesity, gestational weight gain)28 and glucose metabolism parameters (fasting state only)29 at the beginning of pregnancy before the diagnosis of GDM, while the conclusions of our study were directly based on metabolic parameters (including fasting and dynamic indicators) in the second trimester on the day of GDM diagnosis. Since IFSG shares the characteristics of both IFG and IGT, the etiology of IFSG is difficult to confirm. However, it can be certain that IFG and IGT share different etiologies and mechanisms. Although the mechanisms of the different metabolic phenotypes of GDM are poorly studied, there are a large number of similar studies on T2DM which shares a genetic background and pathogenesis similar to GDM.30 GDM is even believed to be the early stage of T2DM to some extent.31 In a study of 21 nonpregnant individuals with isolated IFG, 61 nonpregnant individuals with isolated IGT and 240 healthy control subjects, Meyer et al suggested that different mechanisms existed for impaired fasting glucose (IFG) and impaired postprandial glucose tolerance (IGT), and IFG was due to impaired basal insulin secretion, whereas IGT mainly results from reduced second-phase insulin release.32 There should be different postpartum management, treatment and follow-up strategies for GDM pregnant women with different metabolic phenotypes, pathogeneses and illness severities.33–35
In our study, no differences in perinatal outcomes were found between the GDM and NGT groups. Many studies have reported that women with predominant insulin sensitivity defects had a greater risk of GDM-associated adverse outcomes, such as larger infants,17 hypertensive disorders of pregnancy,24 large for gestational age,24 neonatal hypoglycemia21 and preterm delivery,21,36 while women with predominant insulin secretion defects had a similar risk of adverse perinatal outcomes to women with NGT.17,21,37 The increased risk of adverse perinatal outcomes in women with GDM and insulin resistance may be due to the fact that these subjects tend to be obese.21 However, obesity and increased insulin resistance are high risk factors for adverse perinatal outcomes.36,38 In contrast, women with predominant insulin secretion defects tend to be lean.21,23 Although GDM women with predominant β cell dysfunction are less likely to be subject to short-term adverse perinatal outcomes than those with predominant insulin resistance, the long-term adverse outcomes still cannot be ignored because once β cell dysfunction begins, a vicious cycle of hyperglycemia, insulin resistance, and further β cell dysfunction is set in motion.39 Although pregnancy-related insulin resistance is alleviated after delivery, the impairment of β cell function still continues. The heterogeneity of future risk and progression of long-term adverse outcomes between GDM patients with insulin sensitivity and secretion defects is worth paying attention to in future studies.
Although a significant difference was never observed, 3 birth defects were found in the GDM group but not in the NGT group. Previous studies reported that GDM is associated with an increased risk of birth defects,40–42 especially in pregnant women with GDM who require treatment with insulin.43,44 However, due to the limited data on the treatment of GDM in our study, we will not discuss them here deeply. Larger samples are needed to clarify the association between GDM and birth defects.
Although no differences in pregnancy outcomes were observed between the GDM and NGT groups, we did find associations between glucose metabolism indices and pregnancy outcomes. In our study, several glucose metabolism indices, especially FPG, were found to affect newborn weight, gestational age of delivery and the risk of cesarean section, premature delivery and macrosomia. Previously, clinicians recognized that any degree of hyperglycemia resulted in poor perinatal outcomes. Langer et al demonstrated that every 10 mg/dL increase in FPG is associated with a 15% increase in both maternal and fetal adverse outcomes.45 It was also reported that the risk of macrosomia increased five times in women with FPG levels of 5.6–5.8 mmol/L in comparison with women with FPG levels of 4.2 mmol/L.46 In our study, the higher the level of FPG was, the heavier the baby’s birth weight. Moreover, FPG and some of the other indices mentioned above were related to the risk of macrosomia, which substantially increases the risk of cesarean delivery.47 Unsurprisingly, the IFG subgroup which was characterized by fasting hyperglycemia, was subjected to a higher cesarean section risk than the NGT group. Physiologically, most of the fetal high glucose requirement is maintained by a continuous transplacental transfer from the mother to the fetus, resulting in the blood glucose concentrations of the fetus being directly proportional to maternal glycemic levels. Meanwhile, fetal glucose influences the secreted amounts of insulin by the fetal pancreas and the production of insulin-like growth factors, whose primary role is to promote organ and tissue growth.25 Thus, it is not difficult to understand the influences of maternal glycemic levels on neonatal weight, as well as risk of cesarean section and macrosomia. In conclusion, it is meaningful to manage and treat women with GDM for future adverse perinatal outcomes by monitoring glucose metabolism indices, especially FPG.
Our study has some strengths. First, we kept the baseline characteristics of the GDM and NGT groups as consistent as possible by matching the subjects according to age, basal BMI, hospital and gestational age at serum sampling to reduce the interference of confounders on the results. Second, we evaluated insulin sensitivity/resistance and β cell function by multiple indices, including both fasting and dynamic indicators based on the 75 g OGTT. Third, data on the metabolic characteristics of GDM in the Chinese population, especially in the central Chinese population, are quite lacking, and our study supplements this. There were still some limitations in our study. First, the sample size was limited to some extent which weakened the statistical power of the subgroup analysis. Second, we can only use some indices calculated to estimate β cell function and insulin resistance due to the particular period of pregnancy, while the gold standard for assessing β cell function remains the glucose clamp study. Each calculated index has some limitations.
Conclusion
Defective insulin secretion seems to be a predominant defect in GDM subjects in the central Chinese population. Women with predominant insulin secretion defects had a similar risk of adverse perinatal outcomes to women with NGT. Our study provided a basis for the selection of glucose metabolism monitoring indicators during pregnancy, which is useful for the prevention of adverse perinatal outcomes. Different metabolic subtypes of GDM may have different pathogeneses. There should be different management, treatment and follow-up strategies for GDM patients with different etiologies, pathogeneses and metabolic phenotypes.
Abbreviations
GDM, gestational diabetes mellitus; NGT, normal glucose tolerance; T2DM, type 2 diabetes mellitus; MetS, metabolic syndrome; CVD, cardiovascular disease; GLU, glucose; INS, insulin; β cell, beta cell; FPG, fasting plasma glucose; 1hPG, 75 g OGTT-based 1-hour plasma glucose; 2hPG, 75 g OGTT-based 2-hour plasma glucose; FINS, fasting insulin; 1hINS, 75 g OGTT-based 1-hour insulin; 2hINS, 75 g OGTT-based 2-hour insulin; IFG, impaired fasting glucose; IGT, impaired glucose tolerance; IFSG, impaired fasting and stimulated glucose; HOMA-IR, homoeostasis model assessment of insulin resistance; HOMA-β, homoeostasis model assessment of β cell function; ISIMatsuda, Matsuda insulin sensitivity index; IGI60, insulinogenic index at 60 min; DI, 75 g OGTT-derived disposition index; AUC-INS, area under the insulin curve; AUC-GLU, area under the glucose curve; AUC-INS/AUC-GLU, ratio of total area under the insulin curve to area under glucose curve; BMI, body mass index.
Data Sharing Statement
The datasets used or analyzed in this study are available from the corresponding author on reasonable request.
Ethics Approval and Consent to Participate
Ethics approval was obtained from the ethics committees of Jingzhou Hospital Affiliated to Yangtze University and Gongan County Maternal and Child Health Care Hospital. This study followed the principles of the Declaration of Helsinki. The women who participated in the study provided informed consent.
Consent for Publication
All authors gave consent for publication.
Acknowledgments
The authors thank the study participants and hospital staff who participated in this work.
Author Contributions
All authors made a significant contribution to the work reported, whether that is in the conception, study design, execution, acquisition of data, analysis and interpretation, or in all these areas; took part in drafting, revising or critically reviewing the article; gave final approval of the version to be published; have agreed on the journal to which the article has been submitted; and agree to be accountable for all aspects of the work.
Funding
There is no funding to report.
Disclosure
All authors declare no conflicts of interest.
References
1. McIntyre HD, Catalano P, Zhang C, Desoye G, Mathiesen ER, Damm P. Gestational diabetes mellitus. Nat Rev Dis Primers. 2019;5(1):47. doi:10.1038/s41572-019-0098-8
2. Chen Z, Watanabe RM, Stram DO, Buchanan TA, Xiang AH. High calorie intake is associated with worsening insulin resistance and β-cell function in Hispanic women after gestational diabetes mellitus. Diabetes Care. 2014;37(12):3294–3300. doi:10.2337/dc14-1433
3. Kühl C. Etiology and pathogenesis of gestational diabetes. Diabetes Care. 1998;21:B19–B26.
4. Lacroix M, Battista MC, Doyon M, et al. Lower adiponectin levels at first trimester of pregnancy are associated with increased insulin resistance and higher risk of developing gestational diabetes mellitus. Diabetes Care. 2013;36(6):1577–1583. doi:10.2337/dc12-1731
5. Li G, Wei T, Ni W, et al. Incidence and risk factors of gestational diabetes mellitus: a prospective cohort study in Qingdao, China. Front Endocrinol. 2020;11:636. doi:10.3389/fendo.2020.00636
6. Smirnakis KV, Martinez A, Blatman KH, Wolf M, Ecker JL, Thadhani R. Early pregnancy insulin resistance and subsequent gestational diabetes mellitus. Diabetes Care. 2005;28(5):1207–1208. doi:10.2337/diacare.28.5.1207
7. Sun T, Meng F, Zhao H, et al. Elevated first-trimester neutrophil count is closely associated with the development of maternal gestational diabetes mellitus and adverse pregnancy outcomes. Diabetes. 2020;69(7):1401–1410. doi:10.2337/db19-0976
8. Wang H, Li N, Chivese T, et al. IDF diabetes atlas: estimation of global and regional gestational diabetes mellitus prevalence for 2021 by International Association of Diabetes in pregnancy study group’s criteria. Diabetes Res Clin Pract. 2022;183:109050. doi:10.1016/j.diabres.2021.109050
9. Damm P, Houshmand-Oeregaard A, Kelstrup L, Lauenborg J, Mathiesen ER, Clausen TD. Gestational diabetes mellitus and long-term consequences for mother and offspring: a view from Denmark. Diabetologia. 2016;59(7):1396–1399. doi:10.1007/s00125-016-3985-5
10. Clausen TD, Mathiesen ER, Hansen T, et al. High prevalence of type 2 diabetes and pre-diabetes in adult offspring of women with gestational diabetes mellitus or type 1 diabetes: the role of intrauterine hyperglycemia. Diabetes Care. 2008;31(2):340–346. doi:10.2337/dc07-1596
11. Faith MS, Hittner JB, Hurston SR, et al. Association of infant temperament with subsequent obesity in young children of mothers with gestational diabetes mellitus. JAMA Pediatr. 2019;173(5):424–433. doi:10.1001/jamapediatrics.2018.5199
12. Li J, Song C, Li C, Liu P, Sun Z, Yang X. Increased risk of cardiovascular disease in women with prior gestational diabetes: a systematic review and meta-analysis. Diabetes Res Clin Pract. 2018;140:324–338. doi:10.1016/j.diabres.2018.03.054
13. Tranidou A, Dagklis T, Tsakiridis I, et al. Risk of developing metabolic syndrome after gestational diabetes mellitus - a systematic review and meta-analysis. J Endocrinol Invest. 2021;44(6):1139–1149. doi:10.1007/s40618-020-01464-6
14. Vounzoulaki E, Khunti K, Abner SC, Tan BK, Davies MJ, Gillies CL. Progression to type 2 diabetes in women with a known history of gestational diabetes: systematic review and meta-analysis. BMJ. 2020;369:m1361. doi:10.1136/bmj.m1361
15. Plows JF, Stanley JL, Baker PN, Reynolds CM, Vickers MH. The pathophysiology of gestational diabetes mellitus. Int J Mol Sci. 2018;19(11):3342. doi:10.3390/ijms19113342
16. Yang M, Peng S, Li W, Wan Z, Fan L, Du Y. Relationships between plasma leptin levels, leptin G2548A, leptin receptor Gln223Arg polymorphisms and gestational diabetes mellitus in Chinese population. Sci Rep. 2016;6:23948. doi:10.1038/srep23948
17. Powe CE, Allard C, Battista MC, et al. Heterogeneous contribution of insulin sensitivity and secretion defects to gestational diabetes mellitus. Diabetes Care. 2016;39(6):1052–1055. doi:10.2337/dc15-2672
18. Fakhrul-Alam M, Sharmin-Jahan, Mashfiqul-Hasan, et al. Insulin secretory defect may be the major determinant of GDM in lean mothers. J Clin Transl Endocrinol. 2020;20:100226. doi:10.1016/j.jcte.2020.100226
19. Kautzky-Willer A, Prager R, Waldhausl W, et al. Pronounced insulin resistance and inadequate beta-cell secretion characterize lean gestational diabetes during and after pregnancy. Diabetes Care. 1997;20(11):1717–1723. doi:10.2337/diacare.20.11.1717
20. Retnakaran R, Ye C, Hanley AJ, Connelly PW, Sermer M, Zinman B. Subtypes of gestational diabetes and future risk of pre-diabetes or diabetes. EClinicalMedicine. 2021;40:101087. doi:10.1016/j.eclinm.2021.101087
21. Benhalima K, Van Crombrugge P, Moyson C, et al. Characteristics and pregnancy outcomes across gestational diabetes mellitus subtypes based on insulin resistance. Diabetologia. 2019;62(11):2118–2128. doi:10.1007/s00125-019-4961-7
22. Shao B, Mo M, Xin X, et al. The interaction between prepregnancy BMI and gestational vitamin D deficiency on the risk of gestational diabetes mellitus subtypes with elevated fasting blood glucose. Clin Nutr. 2020;39(7):2265–2273. doi:10.1016/j.clnu.2019.10.015
23. Immanuel J, Simmons D, Harreiter J, et al. Metabolic phenotypes of early gestational diabetes mellitus and their association with adverse pregnancy outcomes. Diabet Med. 2021;38(2):e14413. doi:10.1111/dme.14413
24. Lin J, Jin H, Chen L. Associations between insulin resistance and adverse pregnancy outcomes in women with gestational diabetes mellitus: a retrospective study. BMC Pregnancy Childbirth. 2021;21(1):526. doi:10.1186/s12884-021-04006-x
25. Mirabelli M, Chiefari E, Tocci V, Greco E, Foti D, Brunetti A. Gestational diabetes: implications for fetal growth, intervention timing, and treatment options. Curr Opin Pharmacol. 2021;60:1–10. doi:10.1016/j.coph.2021.06.003
26. Prentki M, Nolan CJ. Islet beta cell failure in type 2 diabetes. J Clin Invest. 2006;116(7):1802–1812. doi:10.1172/JCI29103
27. Lapolla A, Dalfrà MG, Mello G, et al. Early detection of insulin sensitivity and beta-cell function with simple tests indicates future derangements in late pregnancy. J Clin Endocrinol Metab. 2008;93(3):876–880. doi:10.1210/jc.2007-1363
28. Kotzaeridi G, Blätter J, Eppel D, et al. Characteristics of gestational diabetes subtypes classified by oral glucose tolerance test values. Eur J Clin Invest. 2021;51(9):e13628. doi:10.1111/eci.13628
29. Parrettini S, Ranucci L, Caroli A, Bini V, Calafiore R, Torlone E. Gestational diabetes: a link between OGTT, maternal-fetal outcomes and maternal glucose tolerance after childbirth. Nutr Metab Cardiovasc Dis. 2020;30(12):2389–2397. doi:10.1016/j.numecd.2020.08.002
30. Pervjakova N, Moen GH, Borges MC, et al. Multi-ancestry genome-wide association study of gestational diabetes mellitus highlights genetic links with type 2 diabetes. Hum Mol Genet. 2022;ddac050. doi:10.1093/hmg/ddac050
31. Di Cianni G, Lacaria E, Lencioni C, Resi V. Preventing type 2 diabetes and cardiovascular disease in women with gestational diabetes - the evidence and potential strategies. Diabetes Res Clin Pract. 2018;145:184–192. doi:10.1016/j.diabres.2018.04.021
32. Meyer C, Pimenta W, Woerle HJ, et al. Different mechanisms for impaired fasting glucose and impaired postprandial glucose tolerance in humans. Diabetes Care. 2006;29(8):1909–1914. doi:10.2337/dc06-0438
33. Rowan JA, Hague WM, Gao W, Battin MR, Moore MP; MiG Trial Investigators. Metformin versus insulin for the treatment of gestational diabetes. N Engl J Med. 2008;358(19):2003–2015. doi:10.1056/NEJMoa0707193
34. Yun P, Du AM, Chen XJ, Liu JC, Xiao H. Effect of acarbose on long-term prognosis in acute coronary syndromes patients with newly diagnosed impaired glucose tolerance. J Diabetes Res. 2016;2016:1602083. doi:10.1155/2016/1602083
35. Qiu M, Ding LL, Zhang M, Lin JH, Wei XB, Huang H. GLP-1RAs and SGLT2is reduce cardiovascular events independent of reductions of systolic blood pressure and body weight: a meta-analysis with meta-regression. Diabetes Ther. 2020;11(10):2429–2440. doi:10.1007/s13300-020-00912-z
36. Sun YY, Juan J, Xu QQ, Su RN, Hirst JE, Yang HX. Increasing insulin resistance predicts adverse pregnancy outcomes in women with gestational diabetes mellitus. J Diabetes. 2020;12(6):438–446. doi:10.1111/1753-0407.13013
37. Liu Y, Hou W, Meng X, et al. Heterogeneity of insulin resistance and beta cell dysfunction in gestational diabetes mellitus: a prospective cohort study of perinatal outcomes. J Transl Med. 2018;16(1):289. doi:10.1186/s12967-018-1666-5
38. Bianchi C, de Gennaro G, Romano M, et al. Pre-pregnancy obesity, gestational diabetes or gestational weight gain: which is the strongest predictor of pregnancy outcomes? Diabetes Res Clin Pract. 2018;144:286–293. doi:10.1016/j.diabres.2018.08.019
39. Ashcroft FM, Rohm M, Clark A, Brereton MF. Is type 2 diabetes a glycogen storage disease of pancreatic β cells? Cell Metab. 2017;26(1):17–23. doi:10.1016/j.cmet.2017.05.014
40. Correa A, Gilboa SM, Besser LM, et al. Diabetes mellitus and birth defects. Am J Obstet Gynecol. 2008;199(3):237.e1–237.e2379. doi:10.1016/j.ajog.2008.06.028
41. Anderson JL, Waller DK, Canfield MA, Shaw GM, Watkins ML, Werler MM. Maternal obesity, gestational diabetes, and central nervous system birth defects. Epidemiology. 2005;16(1):87–92. doi:10.1097/01.ede.0000147122.97061.bb
42. Schraw JM, Langlois PH, Lupo PJ. Comprehensive assessment of the associations between maternal diabetes and structural birth defects in offspring: a phenome-wide association study. Ann Epidemiol. 2021;53:14–20.e8. doi:10.1016/j.annepidem.2020.08.006
43. Ramos-Arroyo MA, Rodriguez-Pinilla E, Cordero JF. Maternal diabetes: the risk for specific birth defects. Eur J Epidemiol. 1992;8(4):503–508. doi:10.1007/BF00146367
44. Becerra JE, Khoury MJ, Cordero JF, Erickson JD. Diabetes mellitus during pregnancy and the risks for specific birth defects: a population-based case-control study. Pediatrics. 1990;85(1):1–9. doi:10.1542/peds.85.1.1
45. Langer O, Yogev Y, Most O, Xenakis EM. Gestational diabetes: the consequences of not treating. Am J Obstet Gynecol. 2005;192(4):989–997. doi:10.1016/j.ajog.2004.11.039
46. Metzger BE, Lowe LP ; HAPO Study Cooperative Research Group. Hyperglycemia and adverse pregnancy outcomes. N Engl J Med. 2008;358(19):1991–2002. doi:10.1056/NEJMoa0707943
47. Hancerliogullari N, Kansu-Celik H, Asli Oskovi Kaplan Z, Oksuzoglu A, Ozgu-Erdinc AS, Engin-Ustun Y. Correlation of maternal neck/waist circumferences and fetal macrosomia in low-risk Turkish pregnant women, a preliminary study. Fetal Pediatr Pathol. 2021;40(3):181–188. doi:10.1080/15513815.2019.1675831
 © 2023 The Author(s). This work is published and licensed by Dove Medical Press Limited. The full terms of this license are available at https://www.dovepress.com/terms.php and incorporate the Creative Commons Attribution - Non Commercial (unported, v3.0) License.
By accessing the work you hereby accept the Terms. Non-commercial uses of the work are permitted without any further permission from Dove Medical Press Limited, provided the work is properly attributed. For permission for commercial use of this work, please see paragraphs 4.2 and 5 of our Terms.
© 2023 The Author(s). This work is published and licensed by Dove Medical Press Limited. The full terms of this license are available at https://www.dovepress.com/terms.php and incorporate the Creative Commons Attribution - Non Commercial (unported, v3.0) License.
By accessing the work you hereby accept the Terms. Non-commercial uses of the work are permitted without any further permission from Dove Medical Press Limited, provided the work is properly attributed. For permission for commercial use of this work, please see paragraphs 4.2 and 5 of our Terms.