Back to Journals » Nature and Science of Sleep » Volume 13
Measuring Visceral Adipose Tissue Metabolic Activity in Sleep Apnea Utilizing Hybrid 18F-FDG PET/MRI: A Pilot Study
Authors Kundel V ![]() , Lehane D
, Lehane D ![]() , Ramachandran S, Fayad Z, Robson P, Shah N, Mani V
, Ramachandran S, Fayad Z, Robson P, Shah N, Mani V
Received 9 July 2021
Accepted for publication 18 October 2021
Published 28 October 2021 Volume 2021:13 Pages 1943—1953
DOI https://doi.org/10.2147/NSS.S327341
Checked for plagiarism Yes
Review by Single anonymous peer review
Peer reviewer comments 2
Editor who approved publication: Prof. Dr. Ahmed BaHammam
Vaishnavi Kundel,1 Daniel Lehane,2 Sarayu Ramachandran,3 Zahi Fayad,3 Philip Robson,3 Neomi Shah,1 Venkatesh Mani3
1Department of Medicine, Division of Pulmonary, Critical Care, and Sleep Medicine, Icahn School of Medicine at Mount Sinai, New York, NY, USA; 2University of Rochester School of Medicine and Dentistry, Rochester, NY, USA; 3Department of Radiology, BioMedical Engineering and Imaging Institute, Icahn School of Medicine at Mount Sinai, New York, NY, USA
Correspondence: Vaishnavi Kundel
Assistant Professor of Medicine, Department of Medicine, Division of Pulmonary, Critical Care and Sleep Medicine, Icahn School of Medicine at Mount Sinai, One Gustave L Levy Place, Box 1232, New York, NY, 10029, USA
Tel +1 212-241-6564
Email [email protected]
Purpose: Visceral adipose tissue (VAT) is proinflammatory and is associated with cardiovascular (CV) disease. We investigated the relationship between obstructive sleep apnea (OSA) and visceral adipose tissue (VAT) metabolic activity in a pilot group of patients using positron-emission tomography/magnetic resonance imaging (PET/MRI) with 18F-fluorodeoxyglucose (FDG) tracer as a novel marker of adipose tissue inflammation.
Patients and Methods: We analyzed patients from an ongoing study, recruiting those with newly diagnosed, untreated OSA (Respiratory Disturbance Index [RDI] ≥ 5), using home sleep apnea testing (WatchPAT-200 Central-Plus). PET/MRI scans were acquired before continuous positive airway pressure (CPAP)-initiation, and after 3 months of CPAP therapy. Adipose tissue metabolic activity (18F-FDG-uptake) was measured using standardized uptake values (SUV) within the adipose tissue depots. The primary outcome was VAT SUVmean, and secondary outcomes included VAT volume, and subcutaneous adipose tissue (SAT) volume/SUVmean. Reproducibility and reliability of outcome measures were analyzed using intraclass correlation coefficients (ICC). Multivariable linear regression was used to evaluate the association between OSA and primary/secondary outcomes.
Results: Our analytical sample (n = 16) was 81% male (mean age 47 ± 15 years, mean BMI of 29.9 ± 4.8kg/m2). About 56% had moderate to severe OSA (mean RDI 23 ± 6 events/hour), and 50% were adherent to CPAP. We demonstrated excellent inter/intra-rater reliability and reproducibility for the primary and secondary outcomes. Patients with moderate-to-severe OSA had a higher VAT SUV mean compared to those with mild OSA (0.795 ± 0.154 vs 0.602 ± 0.19, p = 0.04). OSA severity was positively associated with VAT SUVmean (primary outcome), adjusted for age and BMI (B [SE] = 0.013 ± 0.005, p = 0.03). Change in VAT volume was inversely correlated with CPAP adherence in unadjusted analysis (B [SE] = − 48.4 ± 18.7, p = 0.02).
Conclusion: Derangements in VAT metabolic activity are implicated in adverse cardiometabolic outcomes and may be one of the key drivers of CV risk in OSA. Our results are hypothesis-generating, and suggest that VAT should be investigated in future studies using multi-modal imaging to understand its role as a potential mediator of adverse cardiometabolic risk in OSA.
Keywords: sleep apnea, OSA, PET, MRI, visceral adipose tissue
Introduction
Obstructive sleep apnea (OSA) affects more than 18 million Americans,1 with substantial increases in its prevalence over the last two decades.2 It is characterized by repetitive collapse of the upper airway during sleep, exerting its deleterious cardiometabolic effects through a combination of intermittent hypoxia (IH), and recurrent sympathetic activation due to sleep fragmentation. Moreover, OSA is associated with metabolic syndrome and cardiovascular diseases (CVD), including hypertension (HTN),3–5 atrial fibrillation,6,7 atherosclerosis,8,9 and stroke.10
Obesity often coexists with OSA, and central obesity in particular is highly comorbid with OSA.11–13 Central abdominal adipose tissue is classified into visceral adipose tissue (VAT) and subcutaneous adipose tissue (SAT). Pathologic adipose tissue contributing to metabolic disease is present predominantly in the visceral abdominal compartment (Figure 1).14 VAT acts as a highly functional endocrine organ, upregulating pro-inflammatory adipokines that play an important role in the development of chronic inflammatory disease.15,16 Increased VAT is independently associated with metabolic syndrome, including HTN, diabetes mellitus (DM)15,17,18(even after adjustment for age and BMI),19 and atherosclerosis/CVD outcomes.20–23 Blunt anthropomorphic indices of obesity such as body mass index (BMI) and waist circumference fail to capture the variation in intra-abdominal (visceral) fat distribution24 between individuals, which may have an impact on OSA-associated cardiometabolic disease.
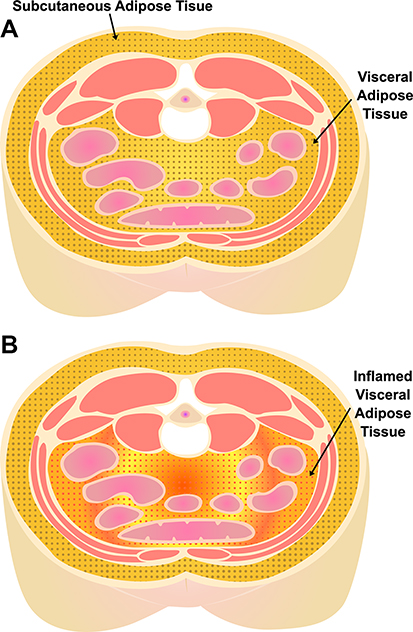 |
Figure 1 Visceral (VAT) and subcutaneous (SAT) adipose tissue depots. (A) Subcutaneous and visceral adipose tissue depots in the abdomen. (B) Pathologic/inflamed visceral adipose tissue. |
In 2019, the International Atherosclerosis Society and Cardiometabolic Risk Working Group released a position paper on the importance of visceral adiposity as an emerging risk factor for premature atherosclerosis and CVD.20 Therefore, increased VAT may serve as an essential mediator for cardiometabolic disorders in patients with OSA.25,26 Indeed, higher volumes of visceral fat (measured on computed tomography [CT]) have been observed in men with and without obesity who have OSA, compared to age and body mass index (BMI) matched controls.27–29
While studies have demonstrated increased VAT volume in patients with OSA, no studies have investigated VAT-specific metabolic or inflammatory activity in OSA patients. Adipose tissue (especially VAT)30 in individuals with obesity is infiltrated by macrophages, where dysfunctional adipocytes adopt a higher rate of glucose uptake,30 contributing to inflammation.31–33 18F-fluorodeoxyglucose (18F-FDG) radiotracer is a glucose analog, and accumulates in metabolically active cells. In inflammatory foci, 18F-FDG accumulates in greater concentrations than surrounding tissue primarily due to recruited macrophages.34 A recent study demonstrated that 18F-FDG uptake by VAT measured using 18F-FDG positron emission tomography (PET)/CT was positively associated with severity of coronary artery disease (CAD) and carotid artery atherosclerosis.35 Therefore, assessing the metabolic and inflammatory properties of VAT in association with OSA is novel, and may serve as a unique imaging biomarker to quantify the inflammatory burden in VAT, potentially informing differential cardiometabolic risk profiles in subgroups of OSA patients. Hybrid 18F-FDG PET/magnetic resonance imaging (MRI) can be utilized as a novel method for both volumetric and metabolic assessment of abdominal adipose tissue depots.36
We conducted a pilot study to demonstrate reproducibility and reliability of VAT volume/metabolic activity measurements using multi-modal imaging (hybrid PET/MRI) in OSA patients. Additionally, we investigated the link between OSA severity and VAT metabolic activity utilizing hybrid 18F-FDG PET/MRI, and assessed the change in these outcomes before and after continuous positive airway pressure (CPAP) therapy in a pilot group of patients with OSA. We hypothesize that OSA severity is positively associated with increased abdominal VAT metabolic activity, and that CPAP can potentially modulate these signals.
Methods
Patient Recruitment
This proposal was carried out as part of an ongoing NIH study (R01HL143221, 2018–2023). The study was approved by the Mount Sinai institutional review board (IRB 18–00543), and conducted in accordance with the Declaration of Helsinki, and the participants provided written informed consent. The study recruited patients age >21 and <80 years with newly diagnosed, untreated OSA to measure various vascular inflammation and inflammatory imaging biomarkers using PET/MRI, both before and after short-term (3–4 months) continuous positive airway pressure (CPAP) therapy. Patients were recruited via screening of electronic health records from the ambulatory sleep medicine clinics. Exclusion criteria for the parent study included any history of coronary or cerebrovascular disease such as myocardial infarction (MI) or stroke (as existing CVD is a significant confounder for vascular inflammation), insulin-dependent diabetes or a pre-scan glucose level of >200mg/dl (due to interference with 18F-FDG signal), New York Heart Association Class III or IV heart failure (inability to lay flat for prolonged imaging studies), sleep hypoventilation, central sleep apnea, presence of ferromagnetic implants, pregnancy or breastfeeding, or a cancer diagnosis.
Anthropometrics and Medical History
Anthropometric data, medical history, and medications were collected and verified in the medical chart and by the patient before the baseline and follow-up scans. Weight and BMI were recorded to account for any changes during the study period. Diet and exercise questionnaires were provided at baseline and follow-up visits to assess any significant modifications in the subject’s diet or activity during the study period. We used the international physical activity questionnaire (IPAQ),37 and the Mediterranean diet questionnaire38 (ranging from a score of 0–9).
Procedures
Sleep Testing
Consented patients with confirmed OSA were recruited from the ambulatory sleep clinic between November 2018 to September 2019. These patients underwent repeat OSA testing as part of a standardized research protocol using a portable home sleep apnea test (HSAT) device, WatchPAT 200 Central Plus (Itamar Medical Ltd, Caesarea, Israel), which has the ability to distinguish between obstructive and central events.39 The WatchPAT is an FDA-approved device that identifies respiratory events by monitoring changes in the peripheral artery tone (PAT) using a finger probe, oximeter, pulse variability, respiratory effort, and a watch (using actigraphy as a surrogate for electroencephalogram arousal). The WatchPAT has been validated against in-lab polysomnography (PSG) in multiple studies and is highly reproducible.39–42 Scoring of data is conducted via WatchPAT’s automatic software algorithm. OSA was defined using the respiratory disturbance index (RDI) as defined by the American Academy of Sleep Medicine (AASM) criteria to define respiratory events.43 The RDI is the sum of all apneas and hypopneas (associated with an oxygen desaturation or arousal) divided by the total sleep time. Patients with OSA diagnosed by an RDI > 5 events/hour, with a 3% oxygen desaturation or associated arousal per event were eligible for the study. Mild OSA was defined as 5 ≤ RDI < 15 events/hour, moderate-to-severe OSA was defined as an RDI ≥ 15 events/hour.
PET/MRI
The patients underwent a baseline PET/MRI scan within one week of the HSAT. Image acquisition and analysis were conducted at the Biomedical Engineering and Imaging Institute (BMEII) at Mount Sinai. PET/MRI scans were performed using a 3T PET/MRI system (BiographTM mMR, Siemens Healthineers, Erlangen, Germany) that simultaneously acquires PET and MR images. Upon patient arrival, 18F-FDG (10mCi [milliecurie]) radiotracer was injected 90 minutes before the PET scan. PET data were obtained in three scan beds, from the base of the skull to the L4-L5 spinal level. The PET imaging protocol lasted 45 minutes (15 minutes per bed position). MR imaging acquired simultaneously included a 3D, coronal-oriented, two-point Dixon acquisition (TR = 3.85 ms, TE = 1.23 ms/2.46 ms, acquired spatial resolution of 1.3 × 1.3 × 3 mm3, interpolated to 2.08 × 2.08 × 2.6 mm3, with an axial field of view of 500 mm [left-to-right] × 406 mm [anterior-to-posterior], scan time 13 seconds per image volume, acquired during breath-hold). A separate MR image was acquired for each PET bed and automatically composed by the scanner into a single image spanning 633 mm from head-to-foot. A standard in-line reconstruction on the scanner was used to decompose multi-echo data into fat-only and water-only images. Each patient underwent two imaging studies, one at baseline and the second after three months of CPAP use.
CPAP
On the day of the baseline imaging visit, all OSA patients recruited into the study received an auto-titrating CPAP device ranging from 4cm to 20cm of water pressure, capable of remote compliance monitoring. Machine-based CPAP adherence data (defined based on CMS [Center for Medicare and Medicaid] criteria of >4 hours usage per night for 70% of the nights over 30 days) was collected.44 CPAP efficacy was defined as post-treatment RDI of <5 events/hour. Patients returned for imaging approximately 3–4 months after CPAP use for the follow-up PET/MRI scan. All follow-up visits were completed by December 2019.
Image Acquisition and Analysis Protocol
Once the images were acquired, they were analyzed for the outcome variables of interest (adipose tissue metabolic activity and volume).
Fat Segmentation on the MR Images
Manual tracing was used to segment SAT and VAT volumes (Figure 2) based on the fat-only images from the two-point DIXON fat/water decomposition. Anatomically, the region of VAT was defined as the area within the muscular borders of the abdomen and pelvis and located between the pelvic floor and the diaphragm. The segmentation volume was defined using anatomical landmarks for consistency. The most inferior slice was at the L4-L5 interspace (or the top of the sacrum). The most superior slice was chosen below the diaphragm level to minimize the inclusion of epicardial fat. Contours lining the inner and outer margin of the SAT were manually traced using OsiriX MD (Pixmeo SARL, Switzerland) in the axial images to encapsulate the subcutaneous adipose tissue depot of each analyzed slice (Figure 2A). Inter-muscular adipose tissue was included in SAT analysis. A custom-made MATLAB script (MathWorks, Natick, MA, USA) then performed an automated analysis of pixel intensity to discriminate tissue class – abdominal VAT from other organs (Figure 2A). The adipose areas from each slice were then summed across the entire abdominal compartment, and total SAT and VAT volumes were calculated (Figure 2B). These methods for volumetric assessment of visceral and subcutaneous fat on MRI have been validated in prior studies.45–47
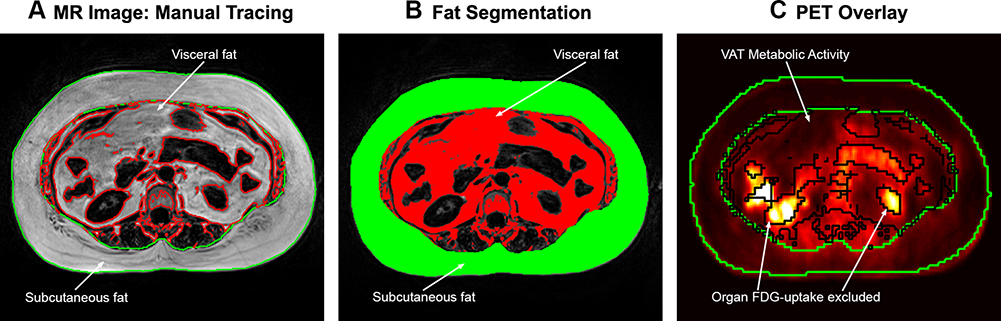 |
Figure 2 Adipose tissue manual tracing and segmentation. (A) Axial MR slice, with manual tracing of the outer contours of subcutaneous adipose tissue (SAT), performed for each slice from the pelvic floor to the level of the diaphragm. (B) Fat segmentation using a custom-made MATLAB script to perform automated analysis of pixel intensity to discriminate tissue class (visceral adipose tissue [VAT] in the abdomen from other organs). Adipose tissue areas from each slice were then summed across the abdomen for total SAT and VAT volumes. (C) Adipose tissue FDG uptake was measured using standardized uptake values (SUV) within the segmented VAT and SAT compartments of each analyzed slice, excluding organ (renal) FDG uptake. Abbreviations: FDG, fluorodeoxyglucose; MR, magnetic resonance; PET, positron emission tomography; VAT, visceral adipose tissue. |
Measurement of Adipose Tissue Metabolic Activity
The SAT and VAT regions of interest computed from the MR images were resampled to overlay on the PET images. Adipose tissue 18F-FDG uptake was measured using standardized uptake values (SUV) within each analyzed slice for the segmented VAT and SAT compartments. Organ 18F-FDG uptake (such as liver, intestinal and renal uptake) was excluded from analysis (Figure 2C). SUV metrics for 18F-FDG were calculated for every voxel of the PET images as decay-corrected tissue radioactivity divided by the ratio of administered 18F-FDG dose to the body weight. The mean SUV (SUVmean) was recorded for each adipose tissue depot on each individual axial slice. Values obtained for each slice were averaged for each patient. The result was a total mean SUV of VAT and SAT.
Statistical Analysis
We first conducted reproducibility and reliability of adipose tissue volume and metabolic activity measurements using inter-reader and intra-reader reliability and agreement for the proposed outcome variables using intraclass correlation coefficients (ICC). Two trained image analysts independently performed the manual tracing for fat segmentation in the regions of interest as outlined in the image analysis protocol for six scans in randomly selected subjects. Each scan consisted of approximately 70 to 80 slices. Adipose tissue SUVmean and volume measurements were compared across the two readers (for each MR slice) for inter-reader reliability using a two-way, absolute agreement intraclass correlation coefficient (ICC), taking into account that measures taken within each patient and time were not independent. As such, each variable was modeled using a mixed-effect model with time as a fixed effect, and a random intercept and slope for each patient and slice nested. From this model, the variances of the random effect were estimated and agreement between readers was derived using the ICC function, with 95% confidence intervals. Sensitivity analyses were conducted using data from baseline and post-CPAP scans for each patient. These analyses were repeated for intra-reader ICC for measurements performed by our first reader on two separate occasions. Excellent reliability was defined as an ICC ≥ 0.90.
Next, we determined the association between OSA and VAT metabolic activity and volume. All analyses were conducted at the 0.05 two-sided significance level. The primary outcome variable was VAT SUVmean. Secondary outcome variables were total VAT volume, SAT volume, and SAT SUVmean. Baseline characteristics and outcome measures were summarized using descriptive statistics by OSA severity (mild: 5 ≤ RDI < 15, and moderate to severe: RDI ≥ 15). Continuous variables were compared using t-tests or Wilcoxon ranked sum tests, and categorical variables compared using chi-square or Fisher’s exact test as appropriate. Multivariable linear regression was used to evaluate the association of RDI (continuous) with primary and secondary outcome variables, adjusting for age and BMI. Change in BMI and primary and secondary outcomes were measured post-CPAP, compared by CPAP adherence category using paired t-tests or Wilcoxon Signed-rank test depending on the form of the distributions.
Results
Reproducibility and Baseline Characteristics
We analyzed an average of 71 MR slices (SD 5.6) and 103 PET slices (SD 8.2) per patient. Measurements of the primary and secondary outcome variables demonstrated excellent ICC (≥0.90) (Table S1) for six scans in randomly selected subjects, suggesting excellent inter/intra-rater reliability and reproducibility. Sensitivity analyses were conducted using data from baseline and post-CPAP for each patient, leading to similar results.
Baseline characteristics are outlined in Table 1. Our analytical sample was (n = 16) was 81% male. The mean age was 47.3 ± 15 years, and the mean BMI was 29.9 ± 4.8 kg/m2. Fifty-six percent of patients had moderate to severe OSA, with a mean RDI (with 4% desaturations or arousals per event) of 22.6 ± 5.7 events per hour. There were no statistically significant differences in the baseline characteristics between the two groups. The average nightly use of CPAP was 5.6 hours (SD 1.9).
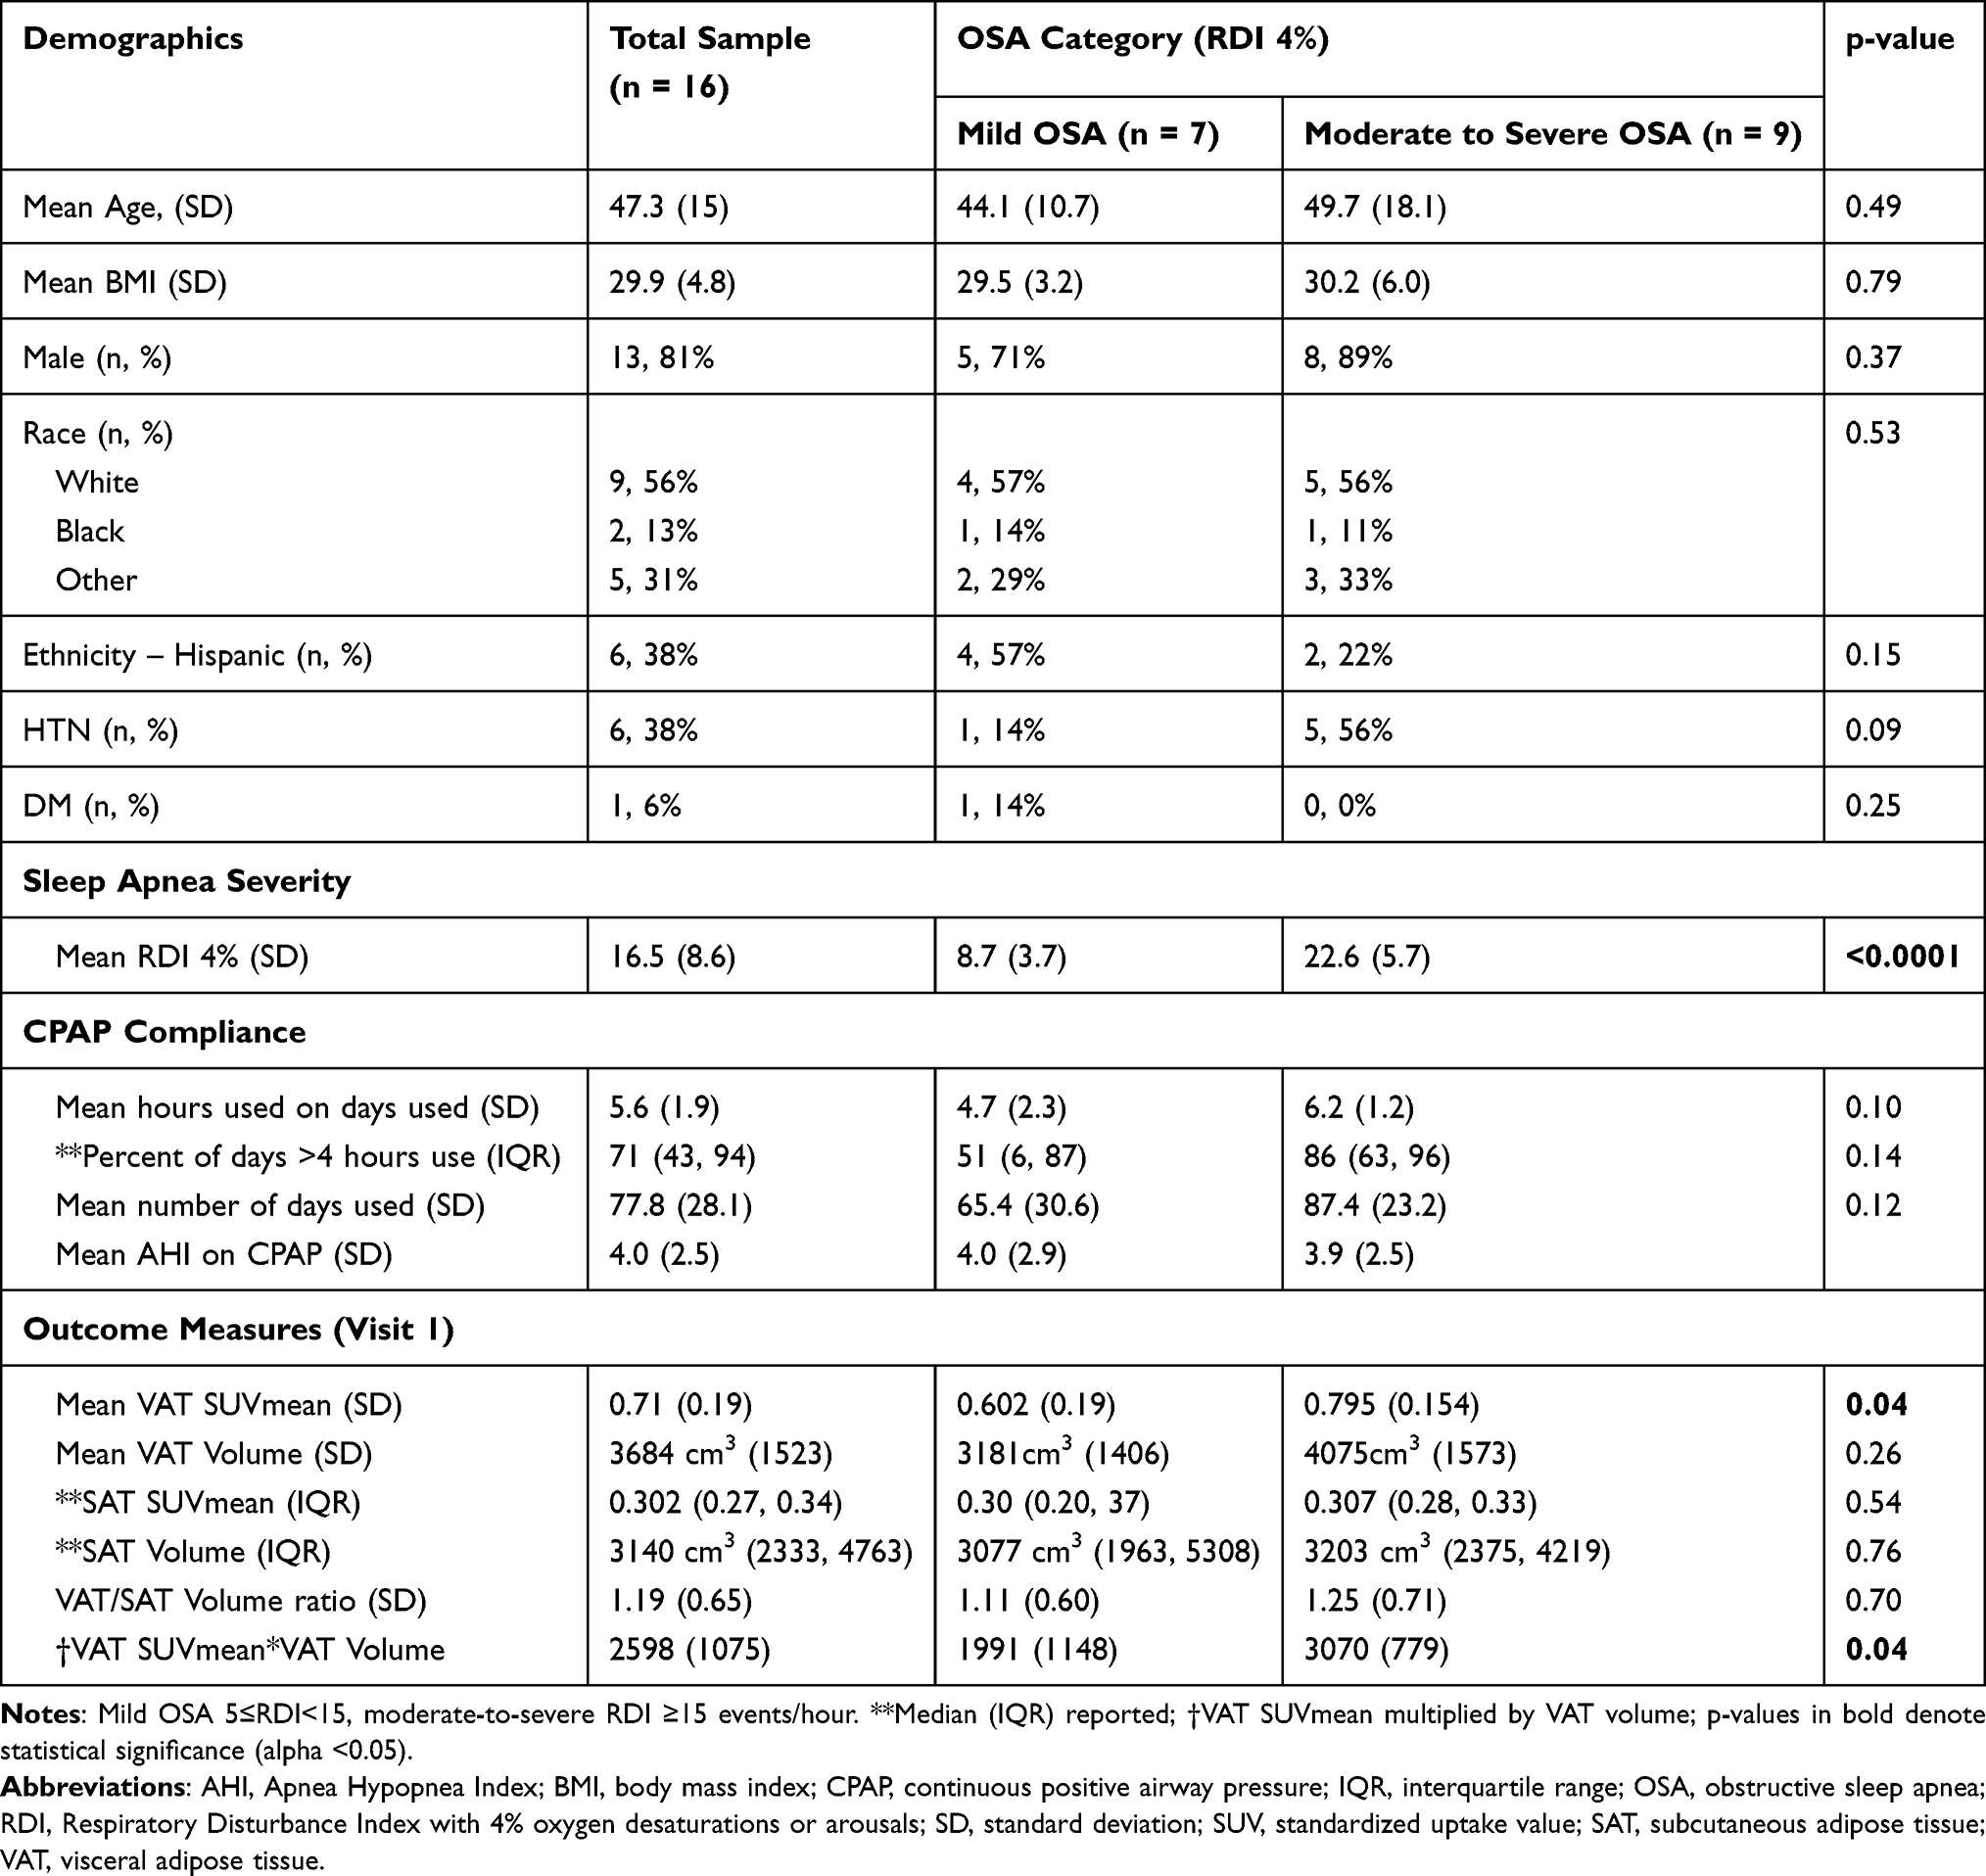 |
Table 1 Patient Demographics and Outcome Measures by Sleep Apnea Severity |
Adipose Tissue Outcome Measures by OSA Severity
Patients with moderate to severe OSA (defined using RDI with 4% desaturations or arousals) had a higher VAT SUVmean compared to those with mild OSA (0.795 [SD 0.154], vs 0.602 (SD 0.19); p = 0.04; Table 1). There was no statistically significant difference in the secondary outcome measures between the two groups. Results from the multivariable linear regression analysis are found in Table 2. OSA severity was positively associated with VAT SUVmean (primary outcome) in both un-adjusted (Model 1, B [SE] = 0.012 [0.005], p = 0.03) and adjusted analyses (Model 2, B [SE] = 0.013 [0.005], p = 0.03). There was no significant association between OSA severity, VAT volume (Table 2), and SAT Volume/SUVmean (data not shown), in both unadjusted and adjusted models. BMI was positively associated with SAT volume (with a 316.3cm3 [±102.1] (B [±SE]) increase in SAT volume per one-unit increase in BMI, p = 0.008), and VAT volume (with a 147.6 cm3 [±74.25] (B [±SE]) increase in VAT volume per one-unit increase in BMI, p = 0.07, Table S2).
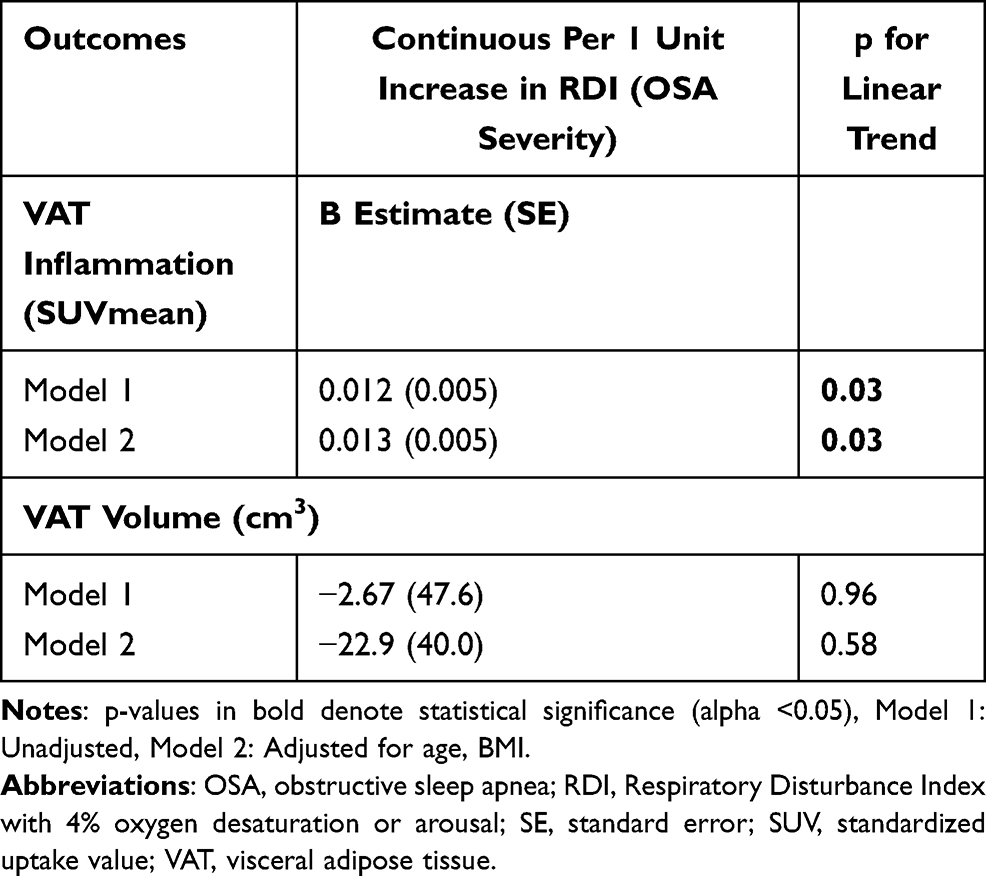 |
Table 2 Multivariable Linear Regression – VAT Inflammation and Sleep Apnea Severity (Continuous) |
Change in Adipose Tissue Outcome Measures Post-CPAP
Fifty percent of the cohort was adherent to CPAP, defined based on >4 hours usage per night for 70% of the nights over a 30-day period (Table 3). There were no statistically significant differences in baseline characteristics (age, sex, BMI, race) between those that were adherent and non-adherent to CPAP. There was a slight increase in BMI during the follow-up period in those non-adherent to CPAP (in comparison to those adherent to CPAP), although this was not statistically significant. Those adherent to CPAP had a reduction in VAT volume (−52.6cm3, IQR [−179.8, −14.8]) compared to those non-adherent to CPAP (87.5cm3 IQR [−13.5, 118.4]), with a trend toward significance (p = 0.07, Table 3). There were no significant differences in the median change in VAT SUVmean, SAT SUV mean, or SAT Volume/SUVmean by CPAP adherence. Linear regression (unadjusted) demonstrated no significant association between change in VAT SUVmean and CPAP adherence (Table S3). However, change in VAT volume was inversely correlated with CPAP adherence, defined as average hours used on days used (B [SE]= −48.4 [18.7], 95% CI −88.5, −8.3, p = 0.02; Figure 3, Table S3).
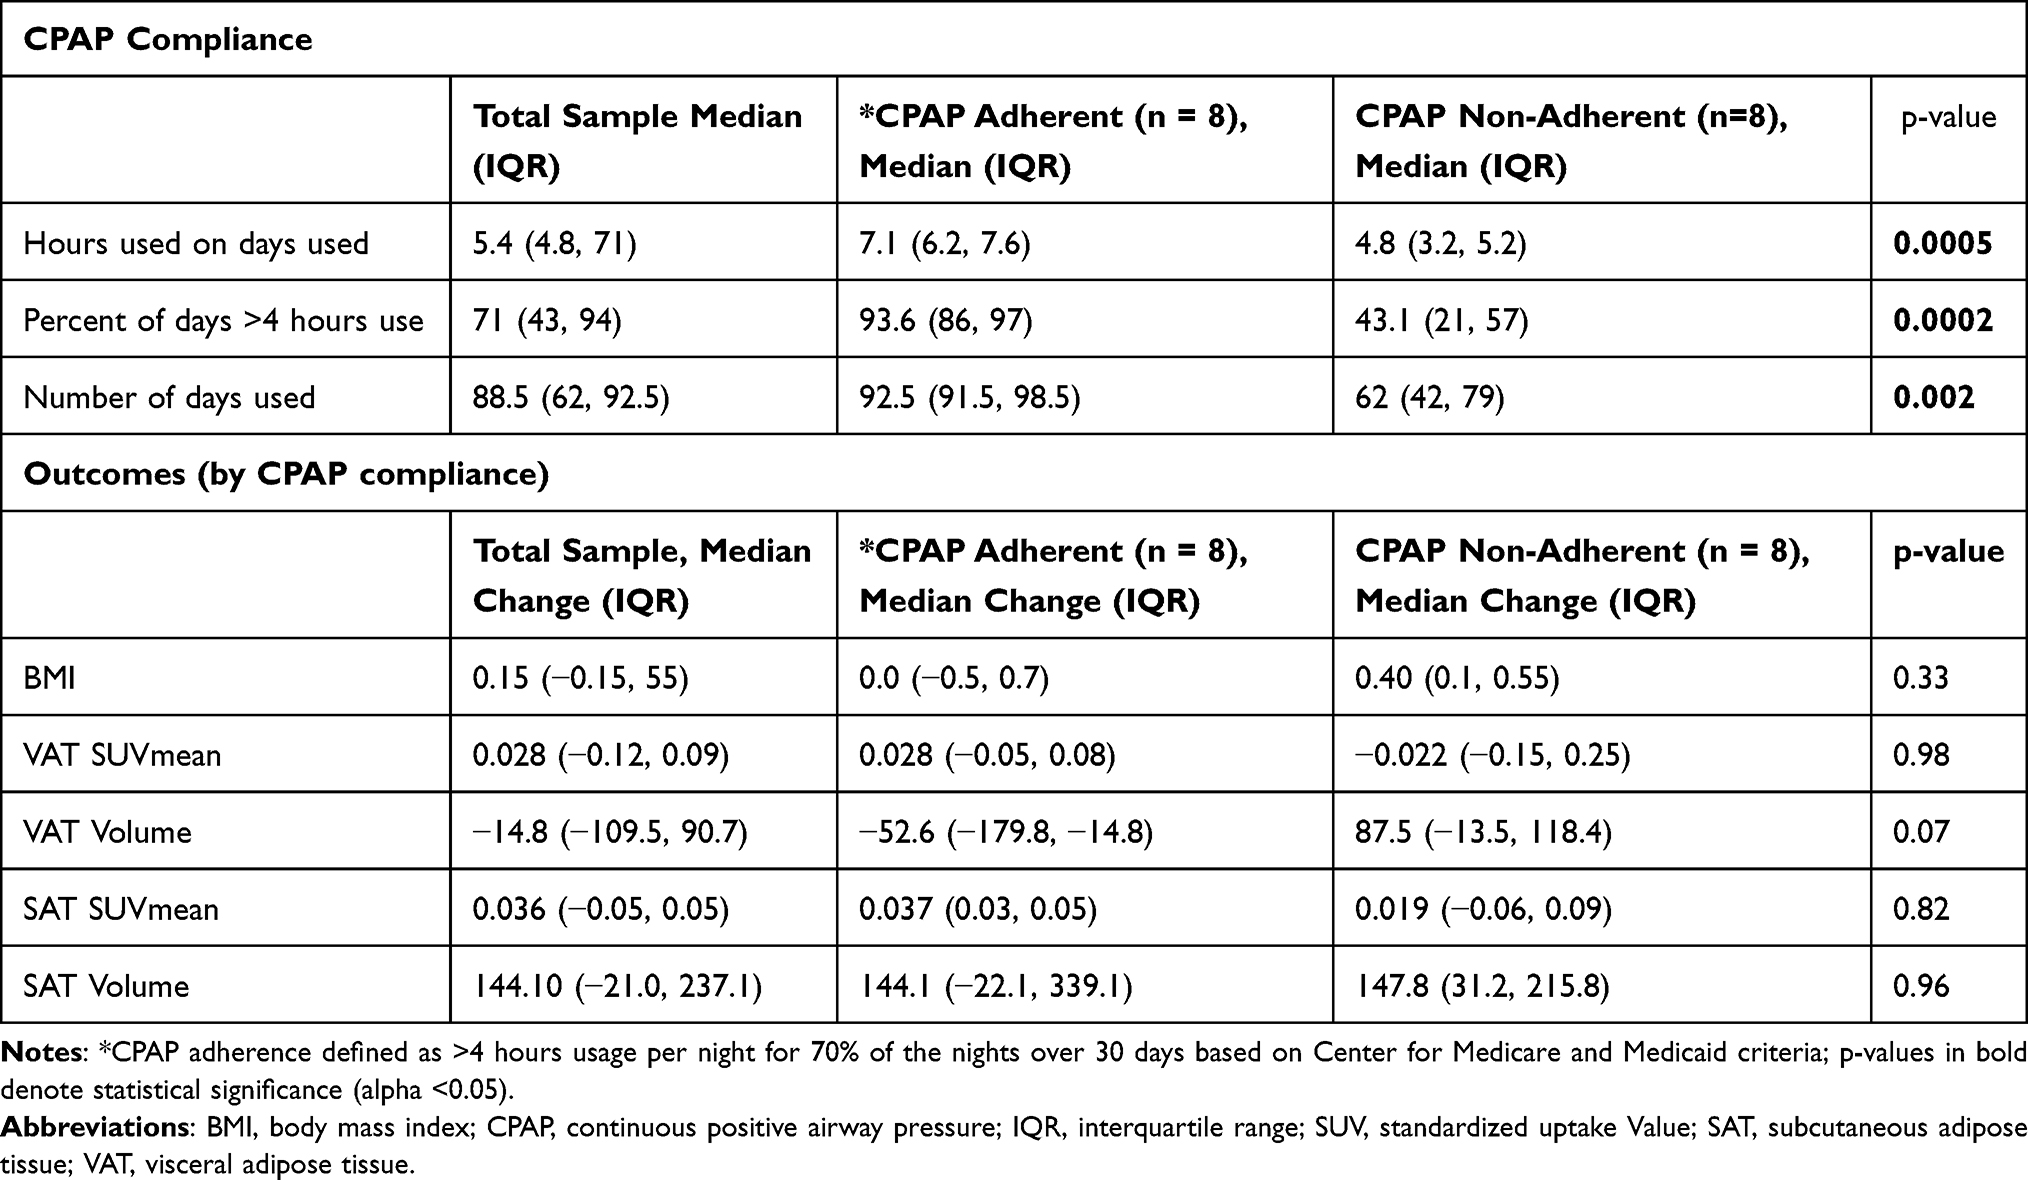 |
Table 3 Change in Outcomes by CPAP Adherence |
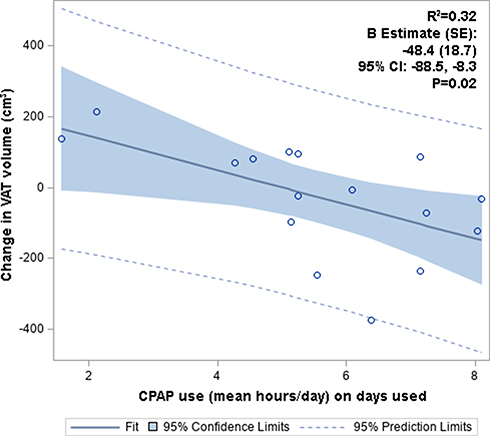 |
Figure 3 Change in VAT volume vs CPAP adherence (mean hours/day). Change in VAT volume was inversely correlated with CPAP adherence. Abbreviations: CPAP, continuous positive airway pressure; CI, confidence intervals; SE, standard error; VAT, visceral adipose tissue. |
Discussion
Our novel study utilized multi-modal imaging (18F-FDG-PET/MRI) as an imaging biomarker of adipose tissue inflammation, to investigate metabolic and volumetric components of VAT in a pilot group of patients with OSA. We demonstrate excellent reproducibility and reliability of our measurement techniques for adipose tissue volume and metabolic activity measures. Our preliminary results demonstrated that OSA severity was positively associated with VAT metabolic activity after adjusting for age and BMI, such that those with moderate to severe OSA had a significantly higher VAT metabolic activity compared to those with mild OSA. Additionally, change in VAT volume was inversely correlated with CPAP adherence, suggesting a reduction in VAT volume with increasing CPAP adherence. Our results are hypothesis-generating, and suggest increased VAT inflammation in those with severe OSA, which may serve as a potential mediator of adverse CVD risk in this group of patients, and should be investigated in future studies using multi-modality imaging.
Visceral adiposity is independently associated with markers of cardiac and metabolic risk,15 metabolic syndrome,19 as well as HTN and diabetes.18 Further, studies have demonstrated an association between VAT and subclinical atherosclerosis, including coronary artery calcium scores,21 aortic arterial inflammation23 (measured using 18F-FDG PET), carotid intima-media thickness (CIMT),22 and CVD.23 The adverse cardiometabolic effects of VAT may be attributed to its pro-inflammatory properties.15,16 As visceral adipocytes hypertrophy, they secrete low levels of tumor necrosis factor-alpha, stimulating surrounding pre-adipocytes and endothelial cells to produce monocyte chemoattractant protein-1 (MCP-1), promoting macrophage recruitment and secretion of other proinflammatory cytokines.25,32,33 There are also corresponding changes in circulating levels of adipose tissue-derived hormones (leptin and adiponectin). There is a decrease in adiponectin levels in obesity – an insulin-sensitizing hormone with anti-atherogenic and anti-inflammatory properties48 – that negatively correlates with visceral fat accumulation,49 diabetes, and metabolic syndrome.50 Taken together, visceral obesity creates a proinflammatory state25 that perpetuates macrophage recruitment, and impaired adipocyte functioning. Therefore, comorbid central adiposity and increased VAT inflammation and volume may serve as an important mediator in contributing to cardiometabolic disorders in OSA.25,26
There is emerging appreciation that VAT is a critical under-investigated confounder of cardiovascular risk in OSA and metabolic syndrome.25,51 However, while studies have demonstrated increased VAT volume in patients with OSA,27–29 no studies have assessed the metabolic and inflammatory properties of VAT in OSA patients using imaging. Quantifying VAT metabolic activity in OSA allows us to measure properties of abdominal adipose tissue which reflect adipose tissue biology. Our study is innovative in methodology as we used hybrid 18F-FDG PET/MRI as a novel method for simultaneous volumetric and metabolic assessment of the VAT depot.36 Hybrid PET/MRI offers several advantages over PET/CT including (1) lower radiation dose (important for serial imaging) and (2) superior soft-tissue contrast in the anatomical images, which may be advantageous compared to PET/CT for discrimination of intestinal 18F-FDG uptake (from that of adipose tissue). In addition, simultaneous acquisition of the anatomical MR and PET images may also allow for improved co-registration and accuracy in measuring VAT metabolic activity.36
We observed several novel findings in our study. VAT metabolic activity (as measured by 18F-FDG uptake/SUVmean) was positively and significantly associated with OSA severity, even after adjusting for age and BMI. This may be in part due to interactions of OSA-induced intermittent hypoxia (IH) and visceral adiposity.52 As a glucose analog, 18F-FDG is taken up by cellular glucose transporters on activated macrophages upregulated during tissue hypoxia, and accumulates in inflammatory foci.34 In particular, IH induces polarization of macrophages towards an M1 (pro-inflammatory) subtype in VAT, resulting in upregulation and secretion of numerous pro-inflammatory adipokines.51 Compared to SAT, VAT is infiltrated by macrophages contributing to inflammation,31–33 especially in individuals with obesity.30 Aligned with this, studies have demonstrated increased 18F-FDG uptake in VAT compared to SAT in humans (indicating proinflammatory macrophage activity), even after adjustment for potential confounders, including age, sex, BMI, and cardiovascular risk factors.36,53 Pahk et al demonstrated that glucose uptake of VAT assessed by 18F-FDG PET/CT was associated with severity of CAD and carotid artery atherosclerosis.35 Therefore, increased VAT inflammation and metabolic activity (as demonstrated in our preliminary results) may act as a mediator for cardiovascular risk in patients with OSA.
In addition, we also found that change in VAT volume was inversely associated with CPAP adherence. Prior studies evaluating the use of CPAP in OSA have shown conflicting results regarding VAT volume. While two studies demonstrated a reduction in VAT following 3–6 months of CPAP,54,55 more recent studies demonstrated no change in adipose tissue distribution and volume following short-term CPAP use (8–12 weeks) as measured on MRI.47,56 Moreover, a meta-analysis evaluating the effects of CPAP on VAT volume did not demonstrate any significant changes in total VAT volume post-CPAP.57 However, there was significant heterogeneity (I2= 95%, p < 0.01) amongst the four RCTs, therefore pooling these data may not be ideal due to differences in methods and study design. Further, we manually analyzed an average of 71 axial MR slices per patient to determine total abdominal visceral and subcutaneous adipose tissue volume compared to prior studies, which examined an average of only 10–16 axial CT/MRI slices (slice thickness 3–8mm).28,47,56 Thus, our analytic methodology may provide a more thorough and comprehensive assessment of total abdominal adipose tissue volume as compared to others. Taken together, further investigation of the effect of CPAP on VAT metabolic activity and volume in OSA is warranted.
Limitations
Several methodological limitations should be considered in the interpretation of our study results. First, we conducted our analysis in a pilot sample of OSA patients (n = 16). The small sample size limited the statistical power for associations for secondary outcomes and changes post-CPAP, and we were unable to adjust for additional variables, including sex and race/ethnicity in our analysis. We also did not account for total body fat in our analysis, which can often attenuate these relationships.58 However, our study is the first of its kind in utilizing multi-modality imaging to investigate an association between OSA severity and VAT metabolic activity and the effect of CPAP in modulating these signals, and provides results that are hypothesis-generating in designing larger studies. Second, we did not have histopathological correlation or adipose tissue-specific circulating inflammatory biomarkers for our primary and secondary imaging outcomes. However, the primary focus of our study was to establish the methodology and evaluate multi-modal imaging biomarkers for VAT inflammation in association with OSA metrics. Future studies should incorporate circulating biomarkers in correlation with imaging biomarkers. Third, we evaluated the change in outcomes following three months of CPAP. Although this relatively short timeframe for follow-up may limit the detection of differences in outcomes, using this timeframe reduces the influence of external factors such as significant changes in lifestyle, dietary habits, and physical activity on imaging biomarkers, that may occur over a more extended period. Additionally, our pilot work demonstrated a reduction in plaque inflammation in patients after short-term CPAP use (3 months).59 Therefore, this timeframe may be adequate for VAT outcomes. Last, changes in diet, activity, or weight during the study period may be likely to affect the difference in outcome variables post-CPAP, but were not controlled for in the multivariable analysis owing to the small sample size. Moreover, prior studies have demonstrated the observation that CPAP therapy may lead to a modest weight gain.60,61 However, there was no significant change in BMI during the study period (Table 3) or changes in diet based on our dietary questionnaires. Future studies should adjust for BMI, diet, and physical activity changes in the analyses assessing differences in outcomes post-CPAP in a larger sample size.
Conclusion
We utilized hybrid 18F-FDG-PET/MRI to measure VAT metabolic activity in patients with OSA, demonstrating excellent reproducibility and reliability of our measurements using multi-modal imaging. Our preliminary findings indicate that VAT metabolic activity was positively associated with OSA severity after adjusting for age and BMI, such that those with moderate to severe OSA had a significantly higher VAT metabolic activity than those with mild OSA. Additionally, change in VAT volume was inversely correlated with CPAP adherence, suggesting a reduction in VAT volume with increasing CPAP adherence. Our results are hypothesis-generating and highlight that VAT metabolic activity measured using hybrid PET/MRI may serve as a useful surrogate biomarker for VAT inflammation – a potential mediator of adverse CV risk in OSA. We anticipate that using this modality may lead to identification of key OSA endophenotypes with increased VAT inflammation and inform our understanding of the differential CV risk in these patients. Further, investigating the impact of CPAP on VAT may allow for identification of OSA subgroups that are “CPAP responsive”, partially explaining the lack of CV benefit from CPAP in “all-comers”,62 with a vision of informing personalized approaches to the treatment of OSA in future studies.
Acknowledgment
For the current project, Dr. Neomi A. Shah has funding from the NHLBI (R01HL143221). Dr. Vaishnavi Kundel has funding from the American Academy of Sleep Foundation (AASM) Physician Scientist Training Award (210-PA-19). Dr. Mayte Suarez-Farinas assisted with statistical analysis for the reproducibility and reliability analysis.
Disclosure
Dr Philip Robson reports grants from NIH, during the conduct of the study. The authors report no conflicts of interest in this work.
References
1. Peppard PE, Young T, Barnet JH, Palta M, Hagen EW, Hla KM. Increased prevalence of sleep-disordered breathing in adults. Am J Epidemiol. 2013;177(9):1006–1014. doi:10.1093/aje/kws342
2. Heinzer R, Vat S, Marques-Vidal P, et al. Prevalence of sleep-disordered breathing in the general population: the HypnoLaus study. Lancet Respir Med. 2015;3(4):310–318. doi:10.1016/S2213-2600(15)00043-0
3. Peppard PE, Young T, Palta M, Skatrud J. Prospective study of the association between sleep-disordered breathing and hypertension. N Engl J Med. 2000;342(19):1378–1384. doi:10.1056/NEJM200005113421901
4. O’Connor GT, Caffo B, Newman AB, et al. Prospective study of sleep-disordered breathing and hypertension: the Sleep Heart Health Study. Am J Respir Crit Care Med. 2009;179(12):1159–1164. doi:10.1164/rccm.200712-1809OC
5. Marin JM, Agusti A, Villar I, et al. Association between treated and untreated obstructive sleep apnea and risk of hypertension. JAMA. 2012;307(20):2169–2176. doi:10.1001/jama.2012.3418
6. Mehra R, Benjamin EJ, Shahar E, et al. Association of nocturnal arrhythmias with sleep-disordered breathing: the Sleep Heart Health Study. Am J Respir Crit Care Med. 2006;173(8):910–916. doi:10.1164/rccm.200509-1442OC
7. Fein AS, Shvilkin A, Shah D, et al. Treatment of obstructive sleep apnea reduces the risk of atrial fibrillation recurrence after catheter ablation. J Am Coll Cardiol. 2013;62(4):300–305. doi:10.1016/j.jacc.2013.03.052
8. Drager LF, Polotsky VY, Lorenzi-Filho G. Obstructive sleep apnea: an emerging risk factor for atherosclerosis. Chest. 2011;140(2):534–542. doi:10.1378/chest.10-2223
9. Kylintireas I, Craig S, Nethononda R, et al. Atherosclerosis and arterial stiffness in obstructive sleep apnea–a cardiovascular magnetic resonance study. Atherosclerosis. 2012;222(2):483–489. doi:10.1016/j.atherosclerosis.2012.03.036
10. Yaggi HK, Concato J, Kernan WN, Lichtman JH, Brass LM, Mohsenin V. Obstructive sleep apnea as a risk factor for stroke and death. N Engl J Med. 2005;353(19):2034–2041. doi:10.1056/NEJMoa043104
11. Young T, Peppard PE, Taheri S. Excess weight and sleep-disordered breathing. J Appl Physiol. 2005;99(4):1592–1599. doi:10.1152/japplphysiol.00587.2005
12. Young T, Palta M, Dempsey J, Skatrud J, Weber S, Badr S. The occurrence of sleep-disordered breathing among middle-aged adults. N Engl J Med. 1993;328(17):1230–1235. doi:10.1056/NEJM199304293281704
13. Stadler DL, McEvoy RD, Sprecher KE, et al. Abdominal compression increases upper airway collapsibility during sleep in obese male obstructive sleep apnea patients. Sleep. 2009;32(12):1579–1587. doi:10.1093/sleep/32.12.1579
14. Bays HE, Gonzalez-Campoy JM, Bray GA, et al. Pathogenic potential of adipose tissue and metabolic consequences of adipocyte hypertrophy and increased visceral adiposity. Expert Rev Cardiovasc Ther. 2008;6(3):343–368. doi:10.1586/14779072.6.3.343
15. Neeland IJ, Ayers CR, Rohatgi AK, et al. Associations of visceral and abdominal subcutaneous adipose tissue with markers of cardiac and metabolic risk in obese adults. Obesity. 2013;21(9):E439–447. doi:10.1002/oby.20135
16. McGown C, Birerdinc A, Younossi ZM. Adipose tissue as an endocrine organ. Clin Liver Dis. 2014;18(1):41–58. doi:10.1016/j.cld.2013.09.012
17. Elffers TW, de Mutsert R, Lamb HJ, et al. Body fat distribution, in particular visceral fat, is associated with cardiometabolic risk factors in obese women. PLoS One. 2017;12(9):e0185403. doi:10.1371/journal.pone.0185403
18. Fox CS, Massaro JM, Hoffmann U, et al. Abdominal visceral and subcutaneous adipose tissue compartments: association with metabolic risk factors in the Framingham Heart Study. Circulation. 2007;116(1):39–48. doi:10.1161/CIRCULATIONAHA.106.675355
19. Shah RV, Murthy VL, Abbasi SA, et al. Visceral adiposity and the risk of metabolic syndrome across body mass index: the Mesa Study. JACC Cardiovasc Imaging. 2014;7(12):1221–1235. doi:10.1016/j.jcmg.2014.07.017
20. Neeland IJ, Ross R, Despres JP, et al. Visceral and ectopic fat, atherosclerosis, and cardiometabolic disease: a position statement. Lancet Diabetes Endocrinol. 2019;7(9):715–725. doi:10.1016/S2213-8587(19)30084-1
21. Bagyura Z, Kiss L, Lux A, et al. Association between coronary atherosclerosis and visceral adiposity index. Nutr Metab Cardiovasc Dis. 2020;30(5):796–803. doi:10.1016/j.numecd.2020.01.013
22. Randrianarisoa E, Lehn-Stefan A, Hieronimus A, et al. Visceral Adiposity Index as an Independent Marker of Subclinical Atherosclerosis in Individuals Prone to Diabetes Mellitus. J Atheroscler Thromb. 2019;26(9):821–834. doi:10.5551/jat.47274
23. Figueroa AL, Takx RA, MacNabb MH, et al. Relationship between measures of adiposity, arterial inflammation, and subsequent cardiovascular events. Circ Cardiovasc Imaging. 2016;9(4):e004043. doi:10.1161/CIRCIMAGING.115.004043
24. Neeland IJ, Poirier P, Despres JP. Cardiovascular and metabolic heterogeneity of obesity: clinical challenges and implications for management. Circulation. 2018;137(13):1391–1406. doi:10.1161/CIRCULATIONAHA.117.029617
25. Gaines J, Vgontzas AN, Fernandez-Mendoza J, Bixler EO. Obstructive sleep apnea and the metabolic syndrome: the road to clinically-meaningful phenotyping, improved prognosis, and personalized treatment. Sleep Med Rev. 2018;42:211–219. doi:10.1016/j.smrv.2018.08.009
26. Despres JP, Lemieux I. Abdominal obesity and metabolic syndrome. Nature. 2006;444(7121):881–887. doi:10.1038/nature05488
27. Vgontzas AN, Papanicolaou DA, Bixler EO, et al. Sleep apnea and daytime sleepiness and fatigue: relation to visceral obesity, insulin resistance, and hypercytokinemia. J Clin Endocrinol Metab. 2000;85(3):1151–1158. doi:10.1210/jcem.85.3.6484
28. Kritikou I, Basta M, Tappouni R, et al. Sleep apnoea and visceral adiposity in middle-aged male and female subjects. Eur Respir J. 2013;41(3):601–609. doi:10.1183/09031936.00183411
29. Vgontzas AN, Zoumakis E, Bixler EO, et al. Selective effects of CPAP on sleep apnoea-associated manifestations. Eur J Clin Invest. 2008;38(8):585–595. doi:10.1111/j.1365-2362.2008.01984.x
30. Bruun JM, Lihn AS, Pedersen SB, Richelsen B. Monocyte chemoattractant protein-1 release is higher in visceral than subcutaneous human adipose tissue (AT): implication of macrophages resident in the AT. J Clin Endocrinol Metab. 2005;90(4):2282–2289. doi:10.1210/jc.2004-1696
31. Weisberg SP, McCann D, Desai M, Rosenbaum M, Leibel RL, Ferrante AW
32. Wellen KE, Hotamisligil GS. Obesity-induced inflammatory changes in adipose tissue. J Clin Invest. 2003;112(12):1785–1788. doi:10.1172/JCI20514
33. Xu H, Barnes GT, Yang Q, et al. Chronic inflammation in fat plays a crucial role in the development of obesity-related insulin resistance. J Clin Invest. 2003;112(12):1821–1830. doi:10.1172/JCI200319451
34. Love C, Tomas MB, Tronco GG, Palestro CJ. FDG PET of infection and inflammation. Radiographics. 2005;25(5):1357–1368. doi:10.1148/rg.255045122
35. Pahk K, Kim EJ, Joung C, Seo HS, Kim S. Association of glucose uptake of visceral fat and acute myocardial infarction: a pilot (18) F-FDGPET/CT study. Cardiovasc Diabetol. 2020;19(1):145. doi:10.1186/s12933-020-01115-3
36. Im HJ, Paeng JC, Cheon GJ, et al. Feasibility of simultaneous 18F-FDG PET/MRI for the quantitative volumetric and metabolic measurements of abdominal fat tissues using fat segmentation. Nucl Med Commun. 2016;37(6):616–622. doi:10.1097/MNM.0000000000000488
37. Craig CL, Marshall AL, Sjostrom M, et al. International physical activity questionnaire: 12-country reliability and validity. Med Sci Sports Exerc. 2003;35(8):1381–1395. doi:10.1249/01.MSS.0000078924.61453.FB
38. Martínez-González MA, Fernández-Jarne E, Serrano-Martínez M, Wright M, Gomez-Gracia E. Development of a short dietary intake questionnaire for the quantitative estimation of adherence to a cardioprotective Mediterranean diet. Eur J Clin Nutr. 2004;58(11):1550–1552. doi:10.1038/sj.ejcn.1602004
39. Pillar G, Berall M, Berry R, et al. Detecting central sleep apnea in adult patients using WatchPAT-a multicenter validation study. Sleep Breath. 2020;24(1):387–398. doi:10.1007/s11325-019-01904-5
40. Bar A, Pillar G, Dvir I, Sheffy J, Schnall RP, Lavie P. Evaluation of a portable device based on peripheral arterial tone for unattended home sleep studies. Chest. 2003;123(3):695–703. doi:10.1378/chest.123.3.695
41. Pittman SD, Ayas NT, MacDonald MM, Malhotra A, Fogel RB, White DP. Using a wrist-worn device based on peripheral arterial tonometry to diagnose obstructive sleep apnea: in-laboratory and ambulatory validation. Sleep. 2004;27(5):923–933. doi:10.1093/sleep/27.5.923
42. Choi JH, Kim EJ, Kim YS, et al. Validation study of portable device for the diagnosis of obstructive sleep apnea according to the new AASM scoring criteria: watch-PAT 100. Acta Otolaryngol. 2010;130(7):838–843. doi:10.3109/00016480903431139
43. Berry RB, Brooks R, Gamaldo C, et al. AASM Scoring Manual Updates for 2017 (Version 2.4). J Clin Sleep Med. 2017;13(5):665–666. doi:10.5664/jcsm.6576
44. Naik S, Al-Halawani M, Kreinin I, Kryger M. Centers for medicare and medicaid services positive airway pressure adherence criteria may limit treatment to many medicare beneficiaries. J Clin Sleep Med. 2019;15(2):245–251. doi:10.5664/jcsm.7626
45. Maislin G, Ahmed MM, Gooneratne N, et al. Single slice vs. volumetric MR assessment of visceral adipose tissue: reliability and validity among the overweight and obese. Obesity. 2012;20(10):2124–2132. doi:10.1038/oby.2012.53
46. Poonawalla AH, Sjoberg BP, Rehm JL, et al. Adipose tissue MRI for quantitative measurement of central obesity. J Magn Reson Imaging. 2013;37(3):707–716. doi:10.1002/jmri.23846
47. Sivam S, Phillips CL, Trenell MI, et al. Effects of 8 weeks of continuous positive airway pressure on abdominal adiposity in obstructive sleep apnoea. Eur Respir J. 2012;40(4):913–918. doi:10.1183/09031936.00177011
48. Han SH, Sakuma I, Shin EK, Koh KK. Antiatherosclerotic and anti-insulin resistance effects of adiponectin: basic and clinical studies. Prog Cardiovasc Dis. 2009;52(2):126–140. doi:10.1016/j.pcad.2009.06.004
49. Ryo M, Nakamura T, Kihara S, et al. Adiponectin as a biomarker of the metabolic syndrome. Circ J. 2004;68(11):975–981. doi:10.1253/circj.68.975
50. Li S, Shin HJ, Ding EL, van Dam RM. Adiponectin levels and risk of type 2 diabetes: a systematic review and meta-analysis. JAMA. 2009;302(2):179–188. doi:10.1001/jama.2009.976
51. Ryan S. Adipose tissue inflammation by intermittent hypoxia: mechanistic link between obstructive sleep apnoea and metabolic dysfunction. J Physiol. 2017;595(8):2423–2430. doi:10.1113/JP273312
52. Reinke C, Bevans-Fonti S, Drager LF, Shin MK, Polotsky VY. Effects of different acute hypoxic regimens on tissue oxygen profiles and metabolic outcomes. J Appl Physiol. 2011;111(3):881–890. doi:10.1152/japplphysiol.00492.2011
53. Christen T, Sheikine Y, Rocha VZ, et al. Increased glucose uptake in visceral versus subcutaneous adipose tissue revealed by PET imaging. JACC Cardiovasc Imaging. 2010;3(8):843–851. doi:10.1016/j.jcmg.2010.06.004
54. Chin K, Shimizu K, Nakamura T, et al. Changes in intra-abdominal visceral fat and serum leptin levels in patients with obstructive sleep apnea syndrome following nasal continuous positive airway pressure therapy. Circulation. 1999;100(7):706–712. doi:10.1161/01.CIR.100.7.706
55. Trenell MI, Ward JA, Yee BJ, et al. Influence of constant positive airway pressure therapy on lipid storage, muscle metabolism and insulin action in obese patients with severe obstructive sleep apnoea syndrome. Diabetes Obes Metab. 2007;9(5):679–687. doi:10.1111/j.1463-1326.2006.00649.x
56. Hoyos CM, Killick R, Yee BJ, Phillips CL, Grunstein RR, Liu PY. Cardiometabolic changes after continuous positive airway pressure for obstructive sleep apnoea: a randomised sham-controlled study. Thorax. 2012;67(12):1081–1089. doi:10.1136/thoraxjnl-2011-201420
57. Iftikhar IH, Hoyos CM, Phillips CL, Magalang UJ. Meta-analyses of the Association of Sleep Apnea with Insulin Resistance, and the Effects of CPAP on HOMA-IR, Adiponectin, and Visceral Adipose Fat. J Clin Sleep Med. 2015;11(4):475–485. doi:10.5664/jcsm.4610
58. Dekker SA, Noordam R, Biermasz NR, et al. Habitual sleep measures are associated with overall body fat, and not specifically with visceral fat, in men and women. Obesity. 2018;26(10):1651–1658. doi:10.1002/oby.22289
59. Kundel V, Trivieri MG, Karakatsanis NA, et al. Assessment of atherosclerotic plaque activity in patients with sleep apnea using hybrid positron emission tomography/magnetic resonance imaging (PET/MRI): a feasibility study. Sleep Breath. 2018;22(4):1125–1135. doi:10.1007/s11325-018-1646-2
60. Drager LF, Brunoni AR, Jenner R, Lorenzi-Filho G, Bensenor IM, Lotufo PA. Effects of CPAP on body weight in patients with obstructive sleep apnoea: a meta-analysis of randomised trials. Thorax. 2015;70(3):258–264. doi:10.1136/thoraxjnl-2014-205361
61. Tachikawa R, Ikeda K, Minami T, et al. Changes in energy metabolism after continuous positive airway pressure for obstructive sleep apnea. Am J Respir Crit Care Med. 2016;194(6):729–738. doi:10.1164/rccm.201511-2314OC
62. McEvoy RD, Antic NA, Heeley E, et al. CPAP for prevention of cardiovascular events in obstructive sleep apnea. N Engl J Med. 2016;375(10):919–931. doi:10.1056/NEJMoa1606599
 © 2021 The Author(s). This work is published and licensed by Dove Medical Press Limited. The
full terms of this license are available at https://www.dovepress.com/terms
and incorporate the Creative Commons Attribution
- Non Commercial (unported, 3.0) License.
By accessing the work you hereby accept the Terms. Non-commercial uses of the work are permitted
without any further permission from Dove Medical Press Limited, provided the work is properly
attributed. For permission for commercial use of this work, please see paragraphs 4.2 and 5 of our Terms.
© 2021 The Author(s). This work is published and licensed by Dove Medical Press Limited. The
full terms of this license are available at https://www.dovepress.com/terms
and incorporate the Creative Commons Attribution
- Non Commercial (unported, 3.0) License.
By accessing the work you hereby accept the Terms. Non-commercial uses of the work are permitted
without any further permission from Dove Medical Press Limited, provided the work is properly
attributed. For permission for commercial use of this work, please see paragraphs 4.2 and 5 of our Terms.