")
Back to Archived Journals » Hypoxia » Volume 3
Measuring oxygen levels in Caco-2 cultures
Authors Zeitouni N, Fandrey J, Naim HY , von Köckritz-Blickwede M
Received 28 March 2015
Accepted for publication 9 July 2015
Published 9 October 2015 Volume 2015:3 Pages 53—66
DOI https://doi.org/10.2147/HP.S85625
Checked for plagiarism Yes
Review by Single anonymous peer review
Peer reviewer comments 5
Editor who approved publication: Prof. Dr. Dörthe Katschinski
Nathalie E Zeitouni,1 Joachim Fandrey,2 Hassan Y Naim,1 Maren von Köckritz-Blickwede1,3
1Department of Physiological Chemistry, University of Veterinary Medicine Hannover; 2Institute of Physiology, University Clinics Essen, University of Duisburg-Essen, Essen; 3Research Center for Emerging Infections and Zoonoses (RIZ), University of Veterinary Medicine, Hannover, Germany
Purpose: Measuring oxygen levels in three different systems of Caco-2 cell culture.
Methods: Caco-2 cells were cultured in three different systems, using conventional polystyrene 24-well plates, special 24-well gas permeable plates, or on membrane inserts in conventional plates. Optical sensor spots were used to measure dissolved O2 levels in these cultured cells over the course of 6 days under normoxia (143 mmHg) and for 6 hours under hypoxia (7 mmHg). Western blot analysis was used to determine the protein levels of hypoxia-inducible factor 1α (HIF-1α) in the different cultures.
Results: All culture systems displayed lower O2 levels over time than expected when cultured under normoxia conditions. On average, O2 levels reached as low as 25 mmHg in 24-well plates but remained at 97 and 117 mmHg in gas permeable plates and membrane inserts, respectively. Under hypoxia, 1 mL cell cultures equilibrated to 7 mmHg O2 within the first 60 minutes and dropped to 0.39 and 0.61 mmHg O2 in 24-well and gas permeable plates, respectively, after the 6-hour incubation period. Cultures in membrane inserts did not equilibrate to 7 mmHg by the end of the 6-hour incubation period, where the lowest O2 measurements reached 23.12 mmHg. Western blots of HIF-1α protein level in the whole cell lysates of the different Caco-2 cultures revealed distinct stabilization of HIF-1α after hypoxic incubation for 1, 2, and 4 hours in 24-well plates as well as gas permeable plates. For membrane inserts, notable HIF-1α was seen after 4 hours of hypoxic incubation.
Conclusion: Cellular oxygen depletion was achieved in different hypoxic Caco-2 culture systems. However, different oxygen levels comparing different culture systems indicate that O2 level should be carefully considered in oxygen-dependent experiments.
Keywords: hypoxia, normoxia, epithelial cell culture, hypoxia-inducible factor 1α
Introduction
Oxygen is essential for the survival of most living organisms, since it serves as a key player in aerobic respiration. The maintenance of homeostatic levels of cellular oxygen is crucial in order to avoid respiratory distress and oxidative stress.
While the atmospheric oxygen fraction in dry air generally is around 20.9% corresponding to 159 mmHg under normal atmospheric pressure, the partial pressure of oxygen in the body is often much lower, with variations depending on the specific tissue type and developmental stage.1 Carreau et al have aptly described three terms that characterize the different oxygen levels: normoxia that denotes atmospheric oxygen content, physioxia that signifies biologically sufficient oxygen concentration in tissues, and “hypoxia” that represents oxygen concentration less than normal, indicating an oxygen deficit.2 In general, hypoxia has a significant effect on human body functions, but furthermore it is also involved in the development of several diseases. For example, it has been shown to modulate many conditions including inflammatory bowel disease, tumors, and cardiovascular diseases.3–5
In order to correctly analyze the effect of oxygen availability on cell function and health, it is imperative to properly represent the conditions prevailing in vivo. When performing in vitro experiments, many consider that typical cell culture conditions, where incubators are provided with 95% air and 5% CO2, yield approximately a fraction of O2 of 19.9% in the incubator.2 But it is important to mention that this calculation does not yet consider the effect of water vapor saturation with the respective partial pressure, thus, eventually resulting in oxygen partial pressure (pO2) around 143 mmHg for O2.6 Still, these pO2 values do not correspond to the physiological pO2 values in tissues. Moreover, in cell culture systems, cell density and O2 consumption of the cells determine the pO2 on the pericellular level.7 In this respect the significance of oxygen measurement in experimental cell culture protocols becomes clear. For these reasons, we believe that it is imperative to measure the pO2 in classical cell culture systems. We chose to utilize a technique that measures pO2 by non-invasive oxygen sensors and optical probes, allowing us to quantify and compare oxygen content in different experimental settings.
Optical methods for measuring oxygen concentrations in aqueous solutions, or dissolved oxygen, based on the oxygen-dependent quenching of phosphorescent probes have long been described and used.8 Nowadays, advances in fiber optics and sensor technologies have enabled scientists to measure dissolved oxygen using stable phosphorescent dyes, such as ruthenium chloride, whose quenching is proportional to the oxygen level in the immediate surroundings.2,9 Optical oxygen sensor spots can be attached to the inside of clear vesicles, and when measurements are needed, a polymer optical fiber connected to a fiber optic oxygen transmitter reads the emitted light and transmits it to a microprocessor. In this manner, oxygen is measured non-invasively and is not consumed in the process (PreSens Precision Sensing GmbH, Regensburg, Germany). Here we describe the measurement of dissolved oxygen of cultured Caco-2 cells using the Fibox4 transmitter and immobilized PSt3 sensor spots (PreSens Precision Sensing GmbH) in different types of cell culture systems comparing normoxic vs hypoxic conditions. We chose three types of culture systems: commonly used 24-well plates, film-bottomed gas permeable 24-well plates, and membrane inserts suspended over common 24-well plates (see Materials and methods).
The human intestinal Caco-2 cell line has been extensively used as a cell culture model for the intestinal epithelium since these cells show a spontaneous differentiation into small intestinal enterocytes.10 This differentiation process, which begins after 7 days in culture and continues for over 20 days, involves the development of brush-border microvilli, tight junctions, and the expression of brush-border enzymes such as sucrase-isomaltase, whose enzyme activities reach levels observed in the normal small intestine.10,11
Another factor to consider when culturing cells in different oxygen conditions is the accumulation of hypoxia-inducible factor 1 (HIF-1). HIF-1 is a transcription factor consisting of two subunits: the oxygen regulated α- and a constitutively expressed ²-subunits.12,13 HIF-1α protein is a global regulator of the energy homeostasis, and cellular adaptation to hypoxia and its stability are tightly regulated by the cellular oxygen concentration. It accumulates under hypoxic conditions and is quickly degraded by ubiquitination and subsequent proteasomal degradation under normoxia.14 The degradation of HIF-1α under normoxic conditions is regulated by oxygen- and iron-dependent prolyl hydroxylases.14,15 Under hypoxic conditions, HIF-1α rapidly accumulates due to the interruption of its degradation pathway by inhibition of the oxygen- and iron-dependent hydroxylation.16 The heterodimeric transcription factor (HIF-1) is then formed subsequently leading to binding of HIF to specific HIF binding sites within DNA regulatory hypoxia responsive elements.17 HIF binding regulates the transcription of target genes that encode erythropoietin, glucose transporters (Glut), glycolytic enzymes, antimicrobial factors, and the angiogenic vascular endothelial growth factor, among many others.17,18 Therefore, oxygen depletion at the cellular level can be accurately sensed and a subsequent response is initiated, leading to various transcriptional and posttranslational changes.19 Furthermore, HIF-1α accumulation can be used as marker for the cellular molecular response in situations of oxygen limitation within the cells. This study aims to determine oxygen levels and protein levels of HIF-1α in three different systems of Caco-2 cell culture: conventional polystyrene 24-well plates dishes, special 24-well gas permeable plates, or membrane inserts in conventional plates.
Materials and methods
Cell lines
Ethics approval was not sought since in the project a commercially available human epithelial colorectal adenocarcinoma, Caco-2, cell line (ATCC® HTB-37™) was used in this study.20 Cells were maintained in high glucose (4.5 g/L) Dulbecco’s Modified Eagle’s Medium (Sigma- Aldrich Co, St Louis, MO, USA), supplemented with 10% heat-inactivated fetal calf serum (Thermo Fisher Scientific, Waltham, MA, USA), and 50 U/mL penicillin, and 50 μg/mL streptomycin (Sigma-Aldrich Co). The culture medium was changed in all experiments on days 2, 4, and 5 postconfluency, 1 mL in 24-well and gas permeable plates, 0.2 mL in the upper chamber of membrane inserts, and 0.5 mL in the lower one. Caco-2 cells were seeded at 1.54×10⁴ cells in 1 mL medium per well in both 24-well plates (growth area 1.82 cm2, Sarstedt AG and Co, Nümbrecht, Germany) and 24-well fluorocarbon film-bottom gas permeable plates (growth area 1.37 cm2, Coy Laboratory Products, Grass Lake, MI, USA). Alternatively, Caco-2 cells were seeded at 8×10³ cells in 0.2 mL media on 0.4 μm pore polyethylene terephthalate membrane inserts (growth area 0.33 cm2, Greiner Bio-One GmbH, Frickenhausen, Germany) suspended over 24-well plates (Sarstedt AG and Co) filled with 0.5 mL media. In order to minimize the edge effect, cells were seeded in only four wells per plate, positioned in the center of the plate, as shown in Figure S1.
The passages of Caco-2 cell line ranged from 20 to 33. Final cell concentration was determined using a Neubauer hemocytometer, and cell viability was evaluated using 0.4% trypan blue exclusion dye.
Fibox4-PSt3 measurement system
The optical oxygen sensor spots, PSt3, with an area of 3.14 mm2 (PreSens Precision Sensing GmbH) were affixed to the inner surface of the well bottoms in 24-well clear plastic plates or of clear bottomed gas permeable plates using the manufacturer-provided silicone gel SG1 (RS Components Ltd, Corby, UK). The PSt3 sensor spot has a red side (back) and a black side (front), with the red side facing the vessel wall. A conventional two-point calibration of sensor spots, using atmospheric and 0% oxygen conditions as calibration points, was performed, per the manufacturer’s instructions. For measurements, a coaster dual for shaking and spinner flasks (CFG-Dual-L 2.5; PreSens Precision Sensing GmbH) connected to the fiber optic oxygen transmitter, Fibox4 (PreSens Precision Sensing GmbH), was placed under the culture plates, directly underneath the sensor spot, with no air gap. The coaster was moved from one well to another in order to collect the corresponding readings. Collected data points were analyzed using Excel (Microsoft Corporation, Redmond, WA, USA) and GraphPad Prism (6.0d; GraphPad Software, Inc., La Jolla, CA, USA).
Real-time oxygen measurements
Dissolved oxygen levels were measured in media in 24-well plates, gas permeable plates, as well as in the membrane inserts as follows: 1 mL Dulbecco’s Modified Eagle’s Medium in wells of 24- and gas permeable plates, 0.5 mL in bottom chamber, and 0.2 mL in top chamber of inserts. Medium was measured for 6 hours at 30-minute intervals at normoxia in a CO2 incubator with the conditions of 37°C, 5% CO2 in water saturated air or at hypoxia in an oxygen control hypoxia glove box (Coy Laboratory Products) at 37°C, 1% O2, and 5% CO2 in a humidified (100%) incubation chamber within the glove box. All hypoxic measurements were performed inside the hypoxia glove box.
Caco-2 cells were grown at normoxia until day 6 postconfluency. Monolayers developed around the affixed sensor spots in the wells. Real-time O2 measurements were performed daily using Fibox4 transmitter, and triplicate readings were taken for each well. The first measurements were taken when cell cultures reached 100% confluency, designated as day 0. All subsequent measurements were taken on day 1 until day 6 postconfluency. At day 6, medium was changed under normoxia, and cells were either left at normoxia or transferred to hypoxia. Subsequent measurements were taken for 6 hours every 30 minutes, under normoxia and hypoxia, using equilibrated or non-equilibrated media for the latter incubation. All displayed measurements are of pO2 are given in mmHg.
Data collection
The following procedure for sensor readings was applied: At every reading point, each well was measured three times, by moving the CFG away from the sensor then moving back beneath the well. For all media-only measurements, four separate wells each were used for each of the culture systems, resulting in 12 values (for each plate type) that were averaged.
For the normoxic 6-day measurements, 12 separate wells each were used for conventional 24-well plates, resulting in 36 values that were averaged. For gas permeable plates, four separate wells each were used, resulting in 12 values that were averaged. For membrane inserts, six separate wells were used, resulting in 18 values that were averaged. These were all performed in two independent experiments, referred to as samples 1 and 2.
The normoxic vs hypoxic 6-hour measurements for 24-well plates were obtained from the mean of triplicate readings from each of eight separate wells at normoxia (n=24, mean ± SEM) and 12 separate wells at hypoxia with non-equilibrated media (n=36, mean ± SEM) and four separate wells at hypoxia with equilibrated media (n=12, mean ± SEM). Measurements for gas permeable plates and membrane inserts were obtained from the mean of triplicate readings from each of four separate wells at normoxia (n=12, mean ± SEM) and eight separate wells for hypoxia with non-equilibrated media (n=24, mean ± SEM) and four separate wells at hypoxia with equilibrated media (n=12, mean ± SEM).
Whole cell lysis and HIF-1α Western blots
Whole-cell extracts were obtained from Caco-2 cells grown in the conventional 24-well plates or in the gas permeable plates for 7 days postconfluency. At day 7, they were either left under normoxia or placed under hypoxia, and lysates were obtained at time points 1, 2, and 4 hours postincubation. Cell supernatants were removed from the wells, and cells were scraped into 200 μL of lysis buffer (0.1% Nonidet P40, 300 mM NaCl, 10 mM Tris pH 7.9, 1 mM ethylenediaminetetraacetic acid in phosphate-buffered saline) with protease inhibitor cocktail (antipain dihydrochloride 1.48 μM, pepstatin A 1.46 μM, leupeptin 10.51 μM, aprotinin 0.768 μM, trypsin inhibitors 50 μg/mL, and phenylmethanesulfonyl fluoride 1 mM; Sigma-Aldrich Co) and were then centrifuged at 17,000× g at 4°C for 10 minutes in a microcentrifuge and supernatants including cellular proteins were collected and frozen at −20°C until use. Hypoxic samples were lysed inside the hypoxia chamber.
Equal protein amounts (30 μg for 24-well and gas permeable samples, 12 μg for membrane inserts) of total cell lysates from each sample were denatured in boiling Laemmli buffer + 50 mM dithiothreitol for 5 minutes. Samples were then subjected to 7.5% sodium dodecyl sulfate polyacrylamide gel electrophoresis and transferred onto a nitrocellulose membrane (Bio Trace NT Membrane, Pall Gelman Laboratory, Ann Arbor, MI, USA). HIF-1α was detected with a purified mouse anti-human HIF-1α antibody (BD Transduction Laboratories, BD, Franklin Lakes, NJ, USA). Alpha-tubulin (Santa Cruz Biotechnology Inc., Dallas, TX, USA) served as loading control.
Results
Measuring dissolved oxygen in media alone
Dissolved oxygen levels were measured in media in 24-well plates, gas permeable plates, as well as in the membrane inserts over the course of 6 hours at 30-minute intervals at one of two conditions: normoxia (143 mmHg O2) or hypoxia (7 mmHg O2). As can be seen in Figure 1, measurements of media under normoxia are relatively similar in the three culture systems. The pO2 of the media starts at 151, 151, and 152 mmHg, then drops within the first 30 minutes to 140, 134, and 139 mmHg in 24-well plates, gas permeable plates, and membrane inserts, respectively (Figure 1). The pO2 then shows a slight drop but remains relatively stable for 24 hours in all systems under normoxia, ranging between 125 and 132 mmHg. Under hypoxia, the pO2 of the media starts similarly at 153, 151, and 154 mmHg. After 30 minutes, a distinct difference is seen in the culture systems with pO2 values of 86, 21, and 102 mmHg in 24-well plates, gas permeable plates, and membrane inserts, respectively. The medium does not reach 7 mmHg by 6 hours in any of the culture systems, with pO2 values of 14, 9, and 23 mmHg in 24-well plates, gas permeable plates, and membrane inserts, respectively. After 24 hours under hypoxia, the medium reached the following pO2 values 7.9, 7.8, and 8.2 mmHg in 24-well plates, gas permeable plates, and membrane inserts, respectively.
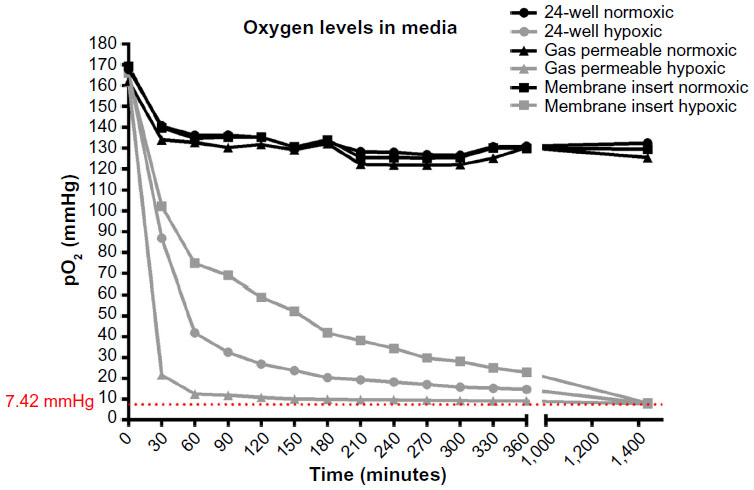 | Figure 1 Oxygen levels in media. |
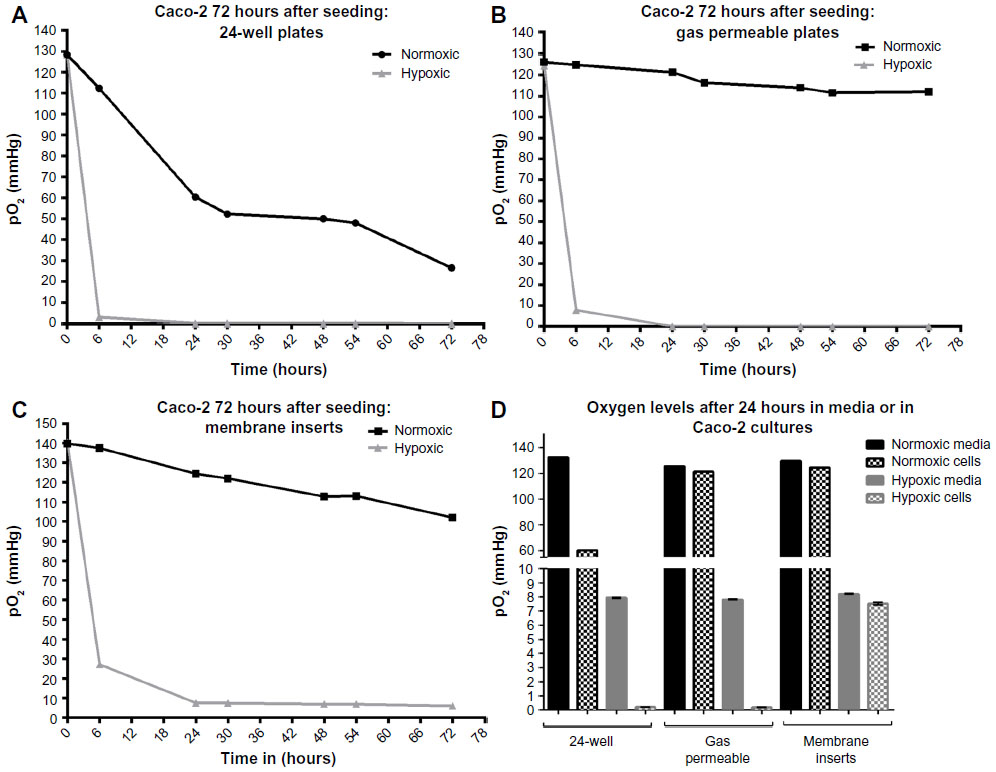
Oxygen levels during 6 days of Caco-2 culture
Caco-2 cells were seeded and incubated under normal cell culture conditions until 100% confluency was reached, designated as day 0. Then, we measured dissolved oxygen levels in Caco-2 cell cultures over the course of the next 6 days. Measurements were taken every morning for each well. The culture medium was replaced on days 2, 4, and 5 postconfluency, and oxygen was measured before and after medium change. Thus, peaks in oxygen levels coincide with these media changes. Figure 2 shows the oxygen levels during 6 days of Caco-2 culture in tissue culture incubator conditions, ie, at 143 mmHg O2. We found that pO2 levels in regular 24-well plates, under normoxic conditions, diminished substantially over the course of 6 days and reached as low as 22 mmHg at day 6 in culture (Figure 2A and B). Caco-2 cells cultured in gas permeable plates show a slight decrease in oxygen levels over the culture period at 143 mmHg O2 exposure, not dropping below 86 mmHg (Figure 2C and D). Finally, cells grown on membrane inserts showed an initial drop in oxygen levels in the first days; however, levels were somewhat sustained at around 113 mmHg for the remainder of the culture period (Figure 2E and F).
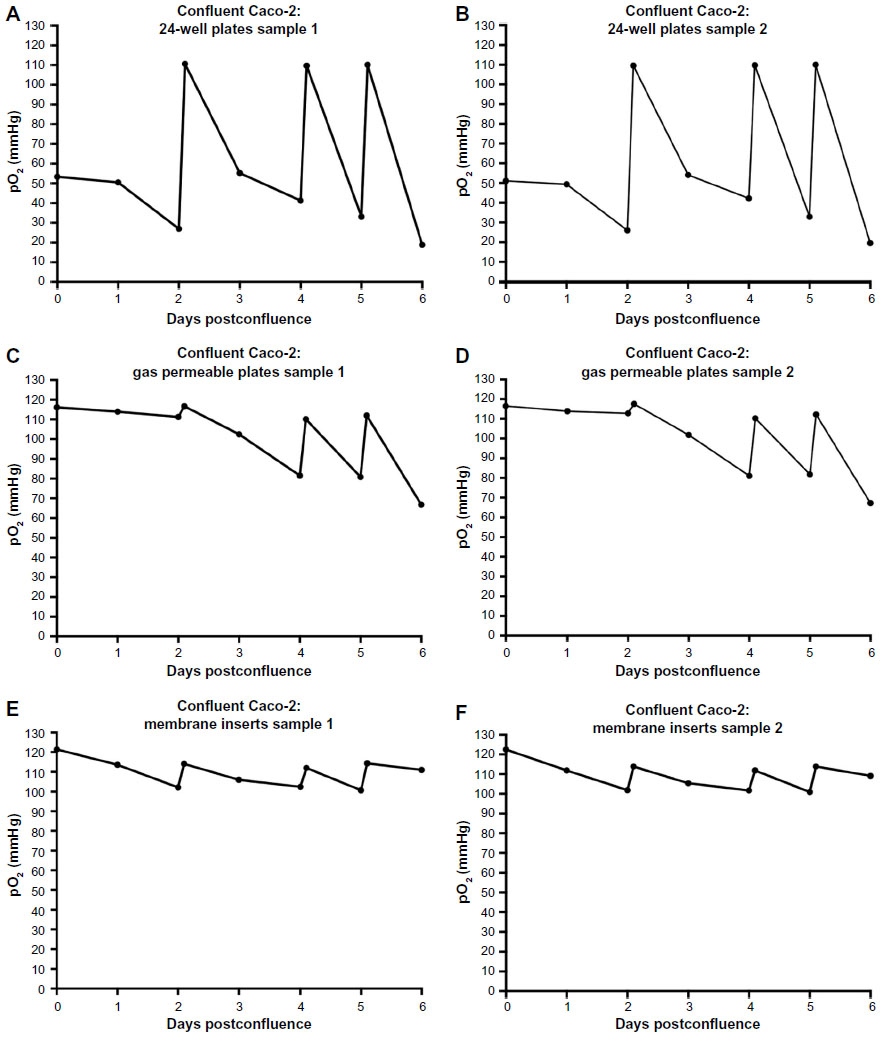 | Figure 2 Oxygen levels during 6 days of Caco-2 culture. |
By day 6-postconfluency, oxygen levels had already reached 22 and 27 mmHg, respectively, in regular 24-well plates. While confluent cells do not actively proliferate, it is known that after reaching confluency, Caco-2 cells begin to exhibit, besides morphological differentiation, functional differentiation in the form of domed structures that form quite rapidly and persist for a number of days before decreasing in size.21 These domes, or hemicysts, are involved in vectorial ion transport and result in an uneven, dense topography.10,21 The presence of these domes on top of the monolayer may limit adequate oxygen supply; however, the extent of oxygen deprivation that resulted after 6 days in culture is quite substantial. This means that when cells are grown in conventional cell culture conditions, within 1 day after seeding, they are being inadvertently subjected to a hypoxic environment. Measurements of oxygen levels in Caco-2 for 72 hours after seeding are provided in Figure S2. These results are in accordance with what has been previously published in other cell cultures.7,22 If we take a look at the cells cultured in gas permeable plates that, as their name suggests, allow the gasses to diffuse into the wells, we see that at day 6, even with the slight restriction of gas diffusion at the site of the sensor, the dissolved oxygen levels are 86 and 108 mmHg, respectively. While this is still lower than the atmospheric conditions, the level of oxygenation can still be considered high as compared with the normal plates traditionally used in culture. Finally, cells cultured on membrane inserts show rather constant and relatively high oxygen levels, even after 6 days in culture (113 and 114 mmHg, respectively). It is important to reiterate here that the oxygen sensor is placed at the bottom of the well and not on the membrane insert itself, since that is technically not feasible. Therefore, a direct correlation between the O2 levels in the suspended inserts and the measured O2 levels in the well cannot be made. However, culturing Caco-2 cells as monolayers on membrane inserts is a frequently used method, especially when measuring transepithelial electric resistance. Therefore, considerations need to be made when performing oxygen-related experiments with each of those culture systems.
Oxygen levels within a period of 6 hours under normoxic condition compared with hypoxic condition
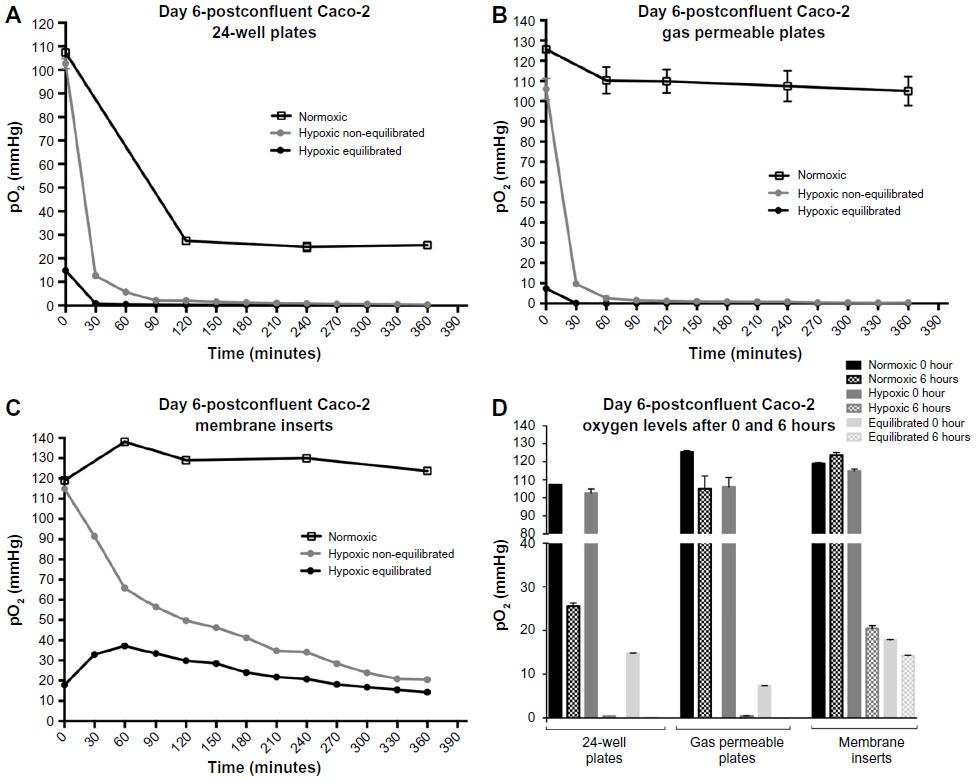
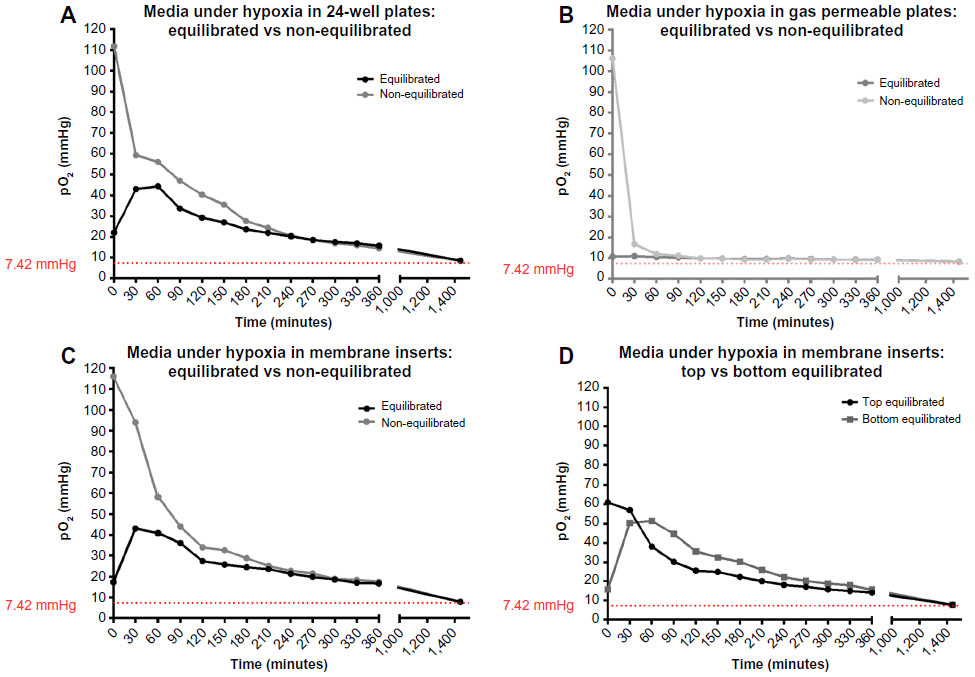
In a further step, Caco-2 cells after 6 days in culture were placed under one of two conditions: normoxia or hypoxia. And measurements were taken at several time points over 6 hours. Medium was changed directly before returning to normoxia or transfer into the hypoxia chamber. As an additional condition under hypoxia, either fresh, non-equilibrated media or hypoxic equilibrated media were added to the cells and measured over the course of 6 hours in the three culture systems. The dissolved oxygen levels in equilibrated media in the different culture systems were measured and are displayed in Figure S3. The pO2 of the media in the flask was measured as 7.8 mmHg after 48-hours incubation in the hypoxia chamber. For all systems, pO2 was measured before and after the media change (all hypoxic readings were performed in the hypoxia chamber).
Oxygen levels in 24-well plate cultures in normoxia show a drastic drop between time point 0 minute, when fresh medium was added (107 mmHg), and time point 360 minutes (25 mmHg). Cells cultured under hypoxia with non-equilibrated media reached 5.6 mmHg O2 within the first 60 minutes and finally reached 0.38 mmHg at the end of the culture period (Figure 3A). Furthermore, cells with equilibrated media showed a pO2 of less than 1 mmHg only after 30 minutes and finally reached a value of 0 mmHg at the end of the 6-hour incubation (Figure 3A). Cells cultured in gas permeable plates under normoxia showed relatively stable levels of dissolved oxygen, with only a slight initial drop after the first 60 minutes (Figure 3B). Cells cultured under hypoxia with non-equilibrated media reached 2.5 mmHg O2 within the first 60 minutes and finally reached 0.4 mmHg at the end of the culture period (Figure 3B). Furthermore, cells with equilibrated media showed a pO2 of 0.14 mmHg only after 30 minutes and finally reached a value of 0 mmHg at the end of the 6-hour incubation. Finally, cells cultured on membrane inserts showed relatively stable levels of oxygen throughout the 6-hour period under normoxia, not dropping below 123 mmHg O2. Under hypoxia, the oxygen levels in non-equilibrated media showed a slow decline without equilibrating to the 7 mmHg O2 condition found within the chamber (Figure 3C). Even by the end of the 6-hour incubation period, the lowest measurements barely reached 20 mmHg. Hypoxic cells treated with equilibrated media (in both top and bottom chambers) show an initial increase in pO2, comparable to that seen in media alone, that reached 37 mmHg after 60 minutes (Figure 3C). A steady decrease followed, finally reaching a pO2 of 14 mmHg. Equilibrated media did not reflect the actual pO2 of 7.8 mmHg when placed in 24-well plates or membrane inserts, a fact also observed in media-only readings (Figure S3).
 | Figure 3 Oxygen levels within 6 hours under normoxic or hypoxic conditions. |
Figure 3D summarizes the oxygen levels at normoxia or hypoxia at the start (t0) and end (t360) time points for each culture condition, respectively. The measurement taken at 0 minute, immediately after change of the medium and upon placement at the corresponding oxygen condition, revealed expectedly normoxic oxygen levels. However, at the end of incubation time after 360 minutes, the oxygen levels in the different culture systems distinctly differed. Under normoxia, the 24-well plate cultures show very low levels, whereas the gas permeable and membrane insert cultures both exhibited relatively high and reasonably physiological oxygen levels. Under hypoxia, the 24-well plate culture as well as the gas permeable culture show precariously low oxygen levels that most likely take into account the surrounding oxygen environment as well the cellular oxygen consumption. The membrane insert cultures show endpoint oxygen levels that do not even convey the actual hypoxic condition established in the hypoxia chamber. In addition, it is apparent that while equilibrated media reflects lower pO2 values in 24-well and gas permeable plate cultures, it does not affect the cultures grown on membrane inserts substantially.
Cellular hypoxia and HIF-1α accumulation
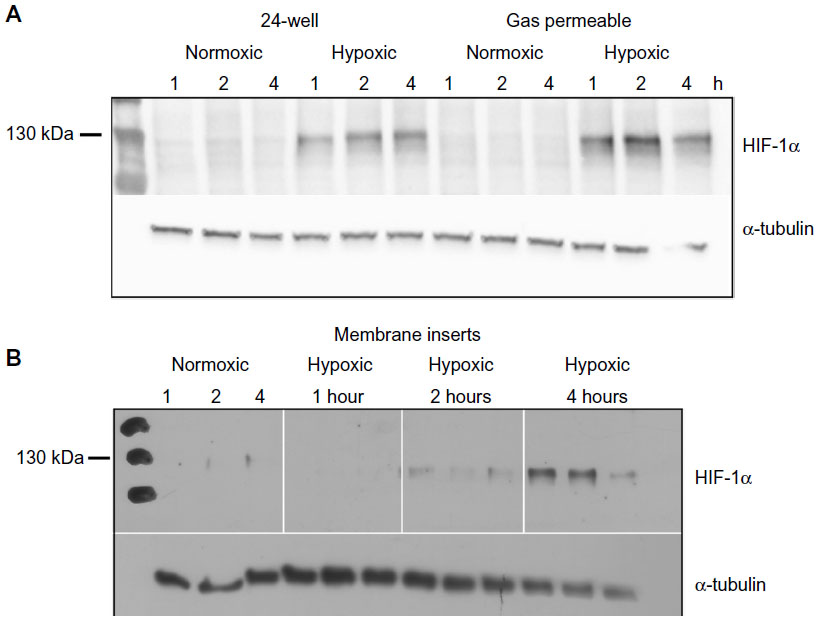
In order to assess whether the measured pO2 reflected actual cellular conditions, we performed Western blots to detect protein levels of HIF-1α in whole cell lysates. Caco-2 cells were grown in the exact manner as for the oxygen measurements, including the sensor spot at the bottom of the wells. Lysates were collected after 1, 2, and 4 hours under normoxia (143 mmHg O2) or hypoxia (7 mmHg O2). In all normoxic samples, no HIF-1α protein was detectable in any of the culture systems (Figure 4). Under hypoxia, HIF-1α bands were visible in lysates obtained from 24-well plates as well as lysates from gas permeable plates, at all three time points. Western blots of membrane inserts show a slight accumulation of HIF-1α protein in cells after 2 hours under hypoxia and a more substantial accumulation after 4 hours (Figure 4). We showed in Figure 3 that after 2 and 4 hours under hypoxia, the pO2 values in membrane inserts are 50 and 34 mmHg, respectively. A cell-specific time- and severity-dependent HIF activation has been shown in previous studies, and protein stabilization of HIF-1α can occur after exposure of cells to pO2 of up to 45 mmHg with maximal protein accumulation at 7 mmHg.23,24 This indicates a degree of cellular hypoxia that allows for a cessation of HIF-1α proteasomal degradation and its subsequent accumulation within the cells.
 | Figure 4 Detection of HIF-1α protein levels at time points 1, 2, and 4 hours under normoxia or hypoxia. |
Discussion
Performing in vitro experiments under typical cell culture conditions yields approximately 139.5 mmHg (18.8%) O2 in an incubator. However, this may not accurately represent the physiological oxygen content as found in tissues. Therefore, we performed measurements on Caco-2 cells cultured in the different culture systems, primarily to quantify the oxygen levels found at different phases of cell culture and to identify the degree of hypoxia that is found in commonly used cell culture conditions. Furthermore, these measurements shed some light on the different culture systems and the degree at which the culture medium reflected the conditions set in the external incubation environment. We chose to utilize a technique that measures pO2 by non-invasive oxygen sensors and optical probes, the Fibox4-PSt3 measurement system, which was allowing us to quantify and compare oxygen content in different experimental settings by minimizing inherent sensor geometry and/or sensor diffusion limitations.
Daily measurements enabled us to determine the actual oxygen concentration in the media over the course of culture. Additionally, the readings allowed us to compare the different systems used to culture these cells. Our results indicate that cells cultured in commonly used 24-well culture plates show decreased levels of dissolved oxygen, mostly due to cell proliferation in the early time points, or due to overcrowding and dome formation at the later time points. On the other hand, film-bottomed, gas permeable plates seem to most closely reflect the oxygen environment in which they were incubated and took the shortest time to adjust to the oxygen content in the hypoxia chamber. Finally, membrane inserts certainly provide a good framework for studying epithelial monolayers and epithelial barrier function; however, according to our method of measurement, they do not seem to equilibrate to the administered oxygen conditions. As explained above, it has to be mentioned again that the oxygen sensors were not placed into the same chamber as the cells, but well below them. Therefore, these measurements may not reflect an accurate portrayal of the pericellular conditions.
This comparison of the different culture systems under hypoxia vs normoxia allows us to summarize the following facts: while regular 24-well culture plates are cheaper and more easily commercially available, gas permeable plates provide a more advantageous method for culturing cells during oxygen-dependent experiments by enabling efficient gas exchange. When working under normal cell culture conditions, this observation can be viewed from two perspectives. On one hand, the resulting lower oxygen levels in conventional 24-well plates can more closely reflect the physiological conditions that actually exist in vivo. On the other hand, when performing oxygen-related experiments, the normoxic control should preferably reflect the defined oxygen conditions in the surroundings as seen with gas permeable plates. Furthermore, incubation of the cells under 7 mmHg O2 also gave us an indication that cells in culture possibly adapt to some extent to the lower levels and that dissolved oxygen levels showed a relatively mild drop as compared with those levels analyzed under normal culture conditions. These results correlate well with various studies showing that cellular energy metabolism is not solely dependent on the oxygen tension. The work of Warburg and Kubowitz25 laid the foundation for the independence of microbial cell respiration from the surrounding oxygen concentration until very low values were reached. This was later relegated to cells of higher organisms by suggesting that several mitochondrial regulatory parameters adjust to maintain a constant rate of adenosine triphosphate synthesis, regardless of the concentration of available oxygen.26 Furthermore, the phenomenon of aerobic glycolysis (Warburg effect) is described as the ability of tumor cells to repress oxidative metabolism even in the availability of oxygen.27 This ability for enhanced tumor survival in adverse conditions was also attributed to non-tumor cells.28 Nowadays, it is believed that cells have the ability to switch between metabolic pathways in order to regulate their energy generation.29 A short-term adaptation mechanism, known as the Crabtree effect, is the reversible glucose-induced suppression of cellular respiration and oxidative phosphorylation.30 Eventually, regardless of the bioenergetic pathway used, a correlation exists between dissolved oxygen levels and cellular utilization rates. In fact, several studies have been performed in order to correlate pericellular oxygen levels with the oxygen consumption rate of cells. It has been recognized that under static culture conditions, where the oxygenation of a cell monolayer occurs purely by diffusion, Fick’s law can be used to draw a relationship between oxygen consumption rate and the dissolved oxygen concentration.22,31 This relationship relies heavily on several factors, including the oxygen consumption rate, the depth of the media above the cells, the diffusion rate of the gas in question, and the oxygen concentration gradient.7,22,31 In fact, there have been attempts to develop mathematical algorithms in order to simplify calculation of oxygen utilization rate at a single cell basis, which takes into account the oxygen consumption rate as well as the cell number and cell type.32 Thus, is it logical to expect differences in dissolved pericellular oxygen levels and therefore oxygen consumption rates in different cell types, between adherent and suspension cells as well as between and primary and immortalized, cancer cell lines. We understand that while our data are not the first of their kind to be reported, we find that Caco-2 cell specific information is fundamental to our work as well as to others, especially in the scope of hypoxic experimentation.
The cellular response to oxygen is a central process in animal cells and figures prominently in the pathophysiology of several diseases, including cancer, cardiovascular disease, and stroke.5,33,34 Several genes involved in cellular differentiation are directly or indirectly regulated by hypoxia, and this process is coordinated by the hypoxia-inducible factor, HIF-1, a transcription factor that activates genes encoding proteins that participate in homeostatic responses to lack of oxygenation.14,17 We were able to show, through Western blots, that HIF-1α accumulated in the hypoxic incubated wells after 1, 2, and 4 hours for 24-well and gas permeable plates and after 4 hours for membrane inserts. HIF is commonly expressed at high levels in cancer cells and leads to the induction of, among many other target genes, those involved in anaerobic metabolism such as the Glut-1 and 3 and genes encoding glycolytic enzymes.13,35,36 Hypoxia and the ensuing stabilization of HIF-1α will have a critical effect on the rate of glucose utilization and also influence oxygen consumption by decreasing mitochondrial oxygen consumption, resulting in an increase in intracellular oxygen levels.37 Commonly used tissue culture media, such as the media recommended for Caco-2 cells, contain 25 mM glucose. Caco-2 cells will display typical enterocytic differentiation characteristics in the presence of such a high amount of glucose.10,38 In comparison to other cell types, differentiated Caco-2 cells exhibit relatively low glucose consumption rates and rather high glycogen content.39 In light of the previous points of discussion, it is crucial to consider that there exists a cycle where low levels of dissolved oxygen are responsible for altered oxygen consumption rates and alternative metabolic pathways as well as the stabilization of HIF-1α that increases glucose transport and somewhat recovers the intracellular oxygen.
Therefore, when studying the effects of hypoxia on cellular mechanisms in an in vitro model, it is especially important to differentiate between the experimentally induced hypoxia and the inadvertently caused lack of oxygenation based on oxygen consumption in a cell culture system that is considered as a normoxic control.
Acknowledgments
Many thanks to Karen Studer-Rabeler (Coy Laboratory Products, Grass Lake, MI, USA) for her technical assistance and manuscript review and to Buena Delos Reyes (University of Duisburg-Essen, Essen, Germany) for her technical assistance with Western blots. This work was partially supported by the German research foundation, Deutsche Forschungsgemeinschaft (DFG) grant KO 3552/4-1 (to MvK-B); NEZ was funded by the German Academic Exchange Service (DAAD).
Author contributions
NEZ designed, performed, and analyzed the experiments and wrote the manuscript; JF advised on oxygen measurements, designed the experiments, and read the manuscript critically; HYN and MvK-B supervised, designed the experiments, and critically revised the manuscript. All authors contributed toward data analysis, drafting and revising the paper and agree to be accountable for all aspects of the work.
Disclosure
The authors report no conflicts of interest in this work.
References
Ward J. Oxygen sensors in context. Biochim Biophys Acta. 2008; 1777(1):1–14. doi:10.1016/j.bbabio.2007.10.010. | |
Carreau A, Hafny-Rahbi B, Matejuk A, Grillon C, Kieda C. Why is the partial oxygen pressure of human tissues a crucial parameter? Small molecules and hypoxia. J Cell Mol Med. 2011;15(6):1239–1253. doi:10.1111/j.1582-4934.2011.01258.x. | |
Kokura S, Yoshida N, Yoshikawa T. Anoxia/reoxygenation-induced leukocyte-endothelial cell interactions. Free Radic Biol Med. 2002; 33(4):427–432. | |
Sundfør K, Lyng HH, Rofstad EK. Tumour hypoxia and vascular density as predictors of metastasis in squamous cell carcinoma of the uterine cervix. Br J Cancer. 1998;78(6):822–827. doi:10.1038/bjc.1998.586. | |
Semenza GL. Hypoxia-inducible factors in physiology and medicine. Cell. 2012;148(3):399–408. doi:10.1016/j.cell.2012.01.021. | |
Allen CB, Schneider BK, White CW. Limitations to oxygen diffusion and equilibration in in vitro cell exposure systems in hyperoxia and hypoxia. Am J Physiol Lung Cell Mol Physiol. 2001;281(4):L1021–L1027. | |
Metzen E, Wolff M, Fandrey J, Jelkmann W. Pericellular PO2 and O2 consumption in monolayer cell cultures. Respir Physiol. 1995;100(2):101–106. doi:10.1016/0034-5687(94)00125-J. | |
Vanderkooi JM, Maniara G, Green TJ, Wilson DF. An optical method for measurement of dioxygen concentration based upon quenching of phosphorescence. J Biol Chem. 1987;262(12):5476–5482. | |
Abaci H, Truitt R, Luong E, Drazer G, Gerecht S. Adaptation to oxygen deprivation in cultures of human pluripotent stem cells, endothelial progenitor cells, and umbilical vein endothelial cells. Am J Physiol Cell Physiol. 2010;298(6):C1527–C1537. doi:10.1152/ajpcell.00484.2009. | |
Pinto M, Robine-Leon S, Appay M-DC, et al. Enterocyte-like differentiation and polarization of the human colon carcinoma cell line Caco-2 in culture. Biol Cell. 1983;47:323–330. | |
Zweibaum A, Triadou N, Kedinger M, et al. Sucrase-isomaltase: a marker of foetal and malignant epithelial cells of the human colon. Int J Cancer. 1983;32(4):407–412. doi:10.1002/ijc.2910320403. | |
Semenza G, Wang G. A nuclear factor induced by hypoxia via de novo protein synthesis binds to the human erythropoietin gene enhancer at a site required for transcriptional activation. Mol Cell Biol. 1992; 12(12):5447–5454. | |
Wang GL, Jiang BH, Rue EA, Semenza GL. Hypoxia-inducible factor 1 is a basic-helix-loop-helix-PAS heterodimer regulated by cellular O2 tension. Proc Natl Acad Sci U S A. 1995;92(12):5510–5514. doi:10.1073/pnas.92.12.5510. | |
Lee J-W, Bae S-H, Jeong J-W, Kim S-H, Kim K-W. Hypoxia-inducible factor (HIF-1)α: its protein stability and biological functions. Exp Mol Med. 2004;36(1):112. doi:10.1038/emm.2004.1. | |
Kallio P, Pongratz I, Gradin K, McGuire J, Poellinger L. Activation of hypoxia-inducible factor 1α: posttranscriptional regulation and conformational change by recruitment of the Arnt transcription factor. Proc Natl Acad Sci U S A. 1997;94(11):5667–5672. doi:10.1073/pnas.94.11.5667. | |
Maxwell P, Wiesener M, Chang G-W, et al. The tumour suppressor protein VHL targets hypoxia-inducible factors for oxygen-dependent proteolysis. Nature. 1999;399(6733):271–275. doi:10.1038/20459. | |
Zinkernagel AS, Johnson RS, Nizet V. Hypoxia inducible factor (HIF) function in innate immunity and infection. J Mol Med. 2007;85: 1339–1346. doi:10.1007/s00109-007-0282-2. | |
Wang GL, Semenza GL. General involvement of hypoxia-inducible factor 1 in transcriptional response to hypoxia. Proc Natl Acad Sci U S A. 1993;90(9):4304–4308. doi:10.1073/pnas.90.9.4304. | |
Csete M. Oxygen in the cultivation of stem cells. Ann N Y Acad Sci. 2005;1049(1):1–8. doi:10.1196/annals.1334.001. | |
Fogh J, Fogh JM, Orfeo T. One hundred and twenty-seven cultured human tumor cell lines producing tumors in nude mice. J Natl Cancer Inst. 1977;59(1):221–226. | |
Ramond, MJ, Martinot-Peignoux M, Erlinger S. Dome formation in the human colon carcinoma cell line Caco-2 in culture. Influence of ouabain and permeable supports. Biol Cell. 1985;54:89–92. | |
Wolff M, Fandrey J, Jelkmann W. Microelectrode measurements of pericellular PO2 in erythropoietin-producing human hepatoma cell cultures. Am J Physiol. 1993;265(5 Pt 1):C1266–C1270. | |
Jiang BH, Semenza GL, Bauer C, Marti HH. Hypoxia-inducible factor 1 levels vary exponentially over a physiologically relevant range of O2 tension. Am J Physiol. 1996;271(4 Pt 1):C1172–C1180. | |
Bracken CP, Fedele AO, Linke S, et al. Cell-specific regulation of hypoxia-inducible factor (HIF)-1alpha and HIF-2alpha stabilization and transactivation in a graded oxygen environment. J Biol Chem. 2006;281(32):22575–22585. doi:10.1074/jbc.M600288200. | |
Warburg O, Kubowitz F. Atmung bei sehr kleinen sauerstoffdrucken. [Breathing at very low oxygen pressures]. Biochem Z. 1929;214:5–18. German. | |
Wilson DF, Erecifiska M, Drown CY, Silver IA. The oxygen dependence of cellular energy metabolism. Arch Biochem Biophys. 1979;195(2):485–493. | |
Warburg O. On the origin of cancer cells. Science. 1956;123(3191):309–314. | |
Crabtree HG. The carbohydrate metabolism of certain pathological overgrowths. Biochem J. 1928;22(5):1289–1298. | |
Rossignol R, Gilkerson R, Aggeler R, Yamagata K, Remington J, Capaldi R. Energy substrate modulates mitochondrial structure and oxidative capacity in cancer cells. Cancer Res. 2004;64(3):985–993. doi:10.1158/0008-5472.CAN-03-1101. | |
Diaz-Ruiz R, Rigoulet M, Devin A. The Warburg and Crabtree effects: on the origin of cancer cell energy metabolism and of yeast glucose repression. Biochim Biophys Acta. 2011;1807(6):568–576. doi:10.1016/j.bbabio.2010.08.010. | |
McLimans W, Blumenson L, Tunnah K. Kinetics of gas diffusion in mammalian cell culture systems. II. Theory. Biotechnol Bioeng. 1968; 10(6):741–763. doi:10.1002/bit.260100604. | |
Guarino R, Dike L, Haq T, Rowley J, Pitner, Timmins M. Method for determining oxygen consumption rates of static cultures from microplate measurements of pericellular dissolved oxygen concentration. Biotechnol Bioeng. 2004;86(7):775–787. doi:10.1002/bit.20072. | |
Colgan S, Curtis V, Campbell E. The inflammatory tissue microenvironment in IBD. Inflamm Bowel Dis. 2013;19(10):2238–2244. doi:10.1097/MIB.0b013e31828dcaaf. | |
Taylor CT, Colgan SP. Hypoxia and gastrointestinal disease. J Mol Med. 2007;85:1295–1300. doi:10.1007/s00109-007-0277-z. | |
Dang C, Semenza G. Oncogenic alterations of metabolism. Trends Biochem Sci. 1999;24(2):68–72. doi:10.1016/S0968-0004(98)01344-9. | |
Minchenko A, Leshchinsky I, Opentanova I, et al. Hypoxia-inducible factor-1-mediated expression of the 6-phosphofructo-2-kinase/fructose-2,6-bisphosphatase-3 (PFKFB3) gene. Its possible role in the Warburg effect. J Biol Chem. 2002;277(8):6183–6187. doi:10.1074/jbc.M110978200. | |
Papandreou I, Cairns R, Fontana L, Lim A, Denko N. HIF-1 mediates adaptation to hypoxia by actively downregulating mitochondrial oxygen consumption. Cell Metab. 2006;3(3):187–197. doi:10.1016/j.cmet.2006.01.012. | |
Grasset E, Pinto M, Dussaulx E, Zweibaum A, Desjeux JF. Epithelial properties of human colonic carcinoma cell line Caco-2: electrical parameters. American J Physiol. 1984;247(3 Pt 1):C260–C267. | |
Rousset M, Chevalier G, Rousset JP, Dussaulx E, Zweibaum A. Presence and cell growth-related variations of glycogen in human colorectal adenocarcinoma cell lines in culture. Cancer Res. 1979;39(2 Pt 1):531–534. |
Supplementary materials
Real-time oxygen measurements
Under hypoxia, fresh, non-equilibrated media as well as hypoxic equilibrated media were measured. As an additional control, we measured oxygen levels in membrane inserts with equilibrated media added to the “apical” side, in the top chamber vs equilibrated media added to the “basal” side, in the well, beneath the insert. To equilibrate media, 50 mL Dulbecco’s Modified Eagle’s Medium were placed in a 500 mL Erlenmeyer flask and stirred constantly for 48 hours. Final pO2 of the media was measured using a sensor spot placed in the flask. All hypoxic measurements were performed inside the hypoxia glove box. For oxygen measurements in sub-confluent Caco-2 cultures, cells were seeded and placed under normoxia or hypoxia, and readings were performed at time of seeding and the following time points: 6, 24, 30, 48, 54, and 72 hours later.
Data collection
For equilibrated media measurements, four separate wells each were used for each of the culture systems, resulting in 12 values (for each plate type) that were averaged. For 72-hour Caco-2 measurements, four separate wells were used for each of the normoxic and hypoxic readings in the conventional 24-well plates, gas permeable plates, and membrane inserts. This resulted in 12 values (for each plate type) that were averaged.
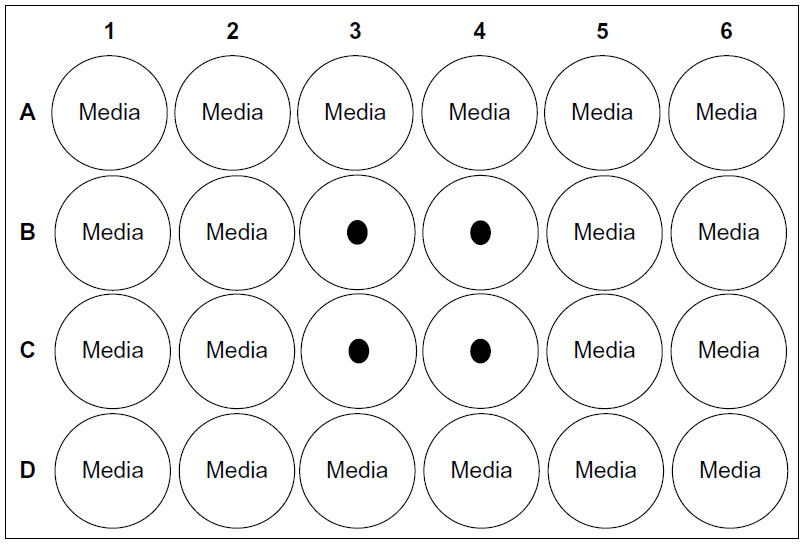 | Figure S1 Caco-2 culture schematic. |
 | Figure S2 Oxygen levels in Caco-2 cells over 72 hours after seeding. |
 | Figure S3 Oxygen levels in equilibrated and non-equilibrated media under hypoxia. |
 © 2015 The Author(s). This work is published and licensed by Dove Medical Press Limited. The full terms of this license are available at https://www.dovepress.com/terms.php and incorporate the Creative Commons Attribution - Non Commercial (unported, v3.0) License.
By accessing the work you hereby accept the Terms. Non-commercial uses of the work are permitted without any further permission from Dove Medical Press Limited, provided the work is properly attributed. For permission for commercial use of this work, please see paragraphs 4.2 and 5 of our Terms.
© 2015 The Author(s). This work is published and licensed by Dove Medical Press Limited. The full terms of this license are available at https://www.dovepress.com/terms.php and incorporate the Creative Commons Attribution - Non Commercial (unported, v3.0) License.
By accessing the work you hereby accept the Terms. Non-commercial uses of the work are permitted without any further permission from Dove Medical Press Limited, provided the work is properly attributed. For permission for commercial use of this work, please see paragraphs 4.2 and 5 of our Terms.