Back to Journals » International Journal of Nanomedicine » Volume 16
Measuring Nanoparticle Penetration Through Bio-Mimetic Gels
Authors McCormick SC ![]() , Stillman N, Hockley M, Perriman AW, Hauert S
, Stillman N, Hockley M, Perriman AW, Hauert S
Received 21 November 2020
Accepted for publication 13 January 2021
Published 30 March 2021 Volume 2021:16 Pages 2585—2595
DOI https://doi.org/10.2147/IJN.S292131
Checked for plagiarism Yes
Review by Single anonymous peer review
Peer reviewer comments 2
Editor who approved publication: Dr Thomas Webster
Scott C McCormick,1,* Namid Stillman,1,* Matthew Hockley,1 Adam W Perriman,2 Sabine Hauert1
1Engineering Mathematics, University of Bristol, Bristol, BS8 1UB, UK; 2Biomedical Sciences, University of Bristol, Bristol, BS8 1TD, UK
*These authors contributed equally to this work
Correspondence: Sabine Hauert
Engineering Mathematics, University of Bristol, Bristol, BS8 1UB, UK
Email [email protected]
Background: In cancer nanomedicine, drugs are transported by nanocarriers through a biological system to produce a therapeutic effect. The efficacy of the treatment is affected by the ability of the nanocarriers to overcome biological transport barriers to reach their target. In this work, we focus on the process of nanocarrier penetration through tumour tissue after extravasation. Visualising the dynamics of nanocarriers in tissue is difficult in vivo, and in vitro assays often do not capture the spatial and physical constraints relevant to model tissue penetration.
Methods: We propose a new simple, low-cost method to observe the transport dynamics of nanoparticles through a tissue-mimetic microfluidic chip. After loading a chip with triplicate conditions of gel type and loading with microparticles, microscopic analysis allows for tracking of fluorescent nanoparticles as they move through hydrogels (Matrigel and Collagen I) with and without cell-sized microparticles. A bespoke image-processing codebase written in MATLAB allows for statistical analysis of this tracking, and time-dependent dynamics can be determined.
Results: To demonstrate the method, we show size-dependence of transport mechanics can be observed, with diffusion of fluorescein dye throughout the channel in 8 h, while 20 nm carboxylate FluoSphere diffusion was hindered through both Collagen I and Matrigel™. Statistical measurements of the results are generated through the software package and show the significance of both size and presence of microparticles on penetration depth.
Conclusion: This provides an easy-to-understand output for the end user to measure nanoparticle tissue penetration, enabling the first steps towards future automated experimentation of transport dynamics for rational nanocarrier design.
Keywords: nanomedicine, microfluidics, transport barriers, tissue penetration, image processing, fast-prototyping
Introduction
Nanocarriers can transport chemotherapies through the body, shielding them from healthy tissue and specifically targeting tumours. One of nanomedicine’s advantages is the ability to fine-tune the surface chemistry and size of the nanocarriers to optimize their transport across biological barriers, such as blood vessel walls, extracellular matrix (ECM) and through cell membranes.1,2 Small nanocarrier modifications, however, can lead to extreme differences in their behaviour3–6 and their ability to traverse biological barriers to reach the intended target.7–9
Given the complexity of nanomedicine design and its impact on complex spatiotemporal behaviour in the body, new methods are needed for high-throughput screening of suitable transport dynamics.10,11 Furthermore, evaluating the performance of a therapy within a specific scenario, and the interactions it would encounter, allows for more effective rational nanoparticle design as well as a route to limiting toxic off-target effects.12,13
Tumour-specific uptake models are of immediate importance to the development of new nanotherapies for treating cancer, with almost two-thirds of nanomedicine research currently focused on oncology.14,15 However, solid tumour microenvironments are extremely complex and exhibit a wide range of diffusive and convective matrices.16 The tumour microenvironment, due to its necrotic core and constantly expanding mass, will produce a positive outwards pressure at the edge of the tumour towards the surrounding tissue,17,18 and extravasating nanoparticles nearer the centre must rely on diffusion to penetrate.19 Factors such as the density and orientation of the nano-porous protein network also impact the transport properties of the drug.20–22
Microfluidic models are beginning to emerge in nanomedicine screening, whereby fluid flow is directed through a region of ECM hydrogels that contain tumour cells. Automatic image processing is then used to allow researchers to analyse results in bulk, allowing for customization of the analysis framework to achieve specific results.
In recent years, microfluidic 3D tissue scaffolds have been investigated for their beneficial properties of low reagent usage, ability to scale up to high-throughput systems, and flexibility in spatial control.23 The significant improvement on the previous paradigm of 2D cell culture is to include a three-dimensional environment for cells to proliferate, preventing morphological differences in binding properties. The resulting 3D tissue structures are commonly grown in hydrogel matrices comprising natural ECM proteins, which allow the cells to propagate to form biologically mimetic cellular structures, such as spheroids or organoids.24 These rudimentary biological structures are produced to emulate in vivo conditions, such that the natural mechanisms of nanomedicine uptake can be studied in vitro.
Ho et al25 produced microfluidic channels that were sandwiched either side of a region of gelled fibrin solution that was covered with human umbilical vein endothelial cells, allowing them to study how fluorescent polystyrene nanoparticles extravasated under flow through the hydrogel. They also extracted fluorescence data in regions of interest and utilized MATLAB to examine the diffusional permeability.
Carvalho et al26 used a microfluidic methodology to assemble a colorectal tumour-on-a-chip model by embedding cancer cell lines in Matrigel in a 5 mm chamber and having parallel perfusion channels coated in human colonic microvascular endothelial cells. They produced dendrimer nanoparticles containing a colorectal cancer drug and observed fluorescently labelled dendrimers penetrating the hydrogel. Instead of a scripted analysis, they took microscopy image processing directly into a graphic software for statistical measurements, without mention of an automated solution.
Albanese et al27 produced a melanoma spheroid-on-a-chip device where spheroids harvested from culture in a poly-hydroxyethyl methacrylate gel supplemented with Matrigel™ were embedded inside a soft microfluidic chip, with the PDMS microchannel gently compressing the tumour against the glass substrate. Instead of being encased in a solid hydrogel, the spheroid was contained in a small coating of Matrigel and laminin and was subjected to convective flow, which may have contributed to their measured uptake of gold nanoparticles in a manner that does not match normal tumour diffusion conditions.
Although the number of exciting new complex 3D testbeds is rapidly growing, there still is not a standardized, easy-to-produce microfluidic testbed, with open-source image processing and diffusion calculation for tissue penetration dynamics. In this paper, we present a novel framework for investigating the diffusive profile of nanoparticles within a model of human tissue. To achieve a diffusive environment, we utilize a completely open channel in a custom-made polymer chip loaded with a tissue scaffold gel containing mammalian-cell-sized microparticles with no applied pressure beyond the initial pipetting motion to introduce the nanoparticle solution (Figure 1). We then investigate how automated fluorescent image processing can be used to track nanoparticles as they move through our tissue-mimetic chip.
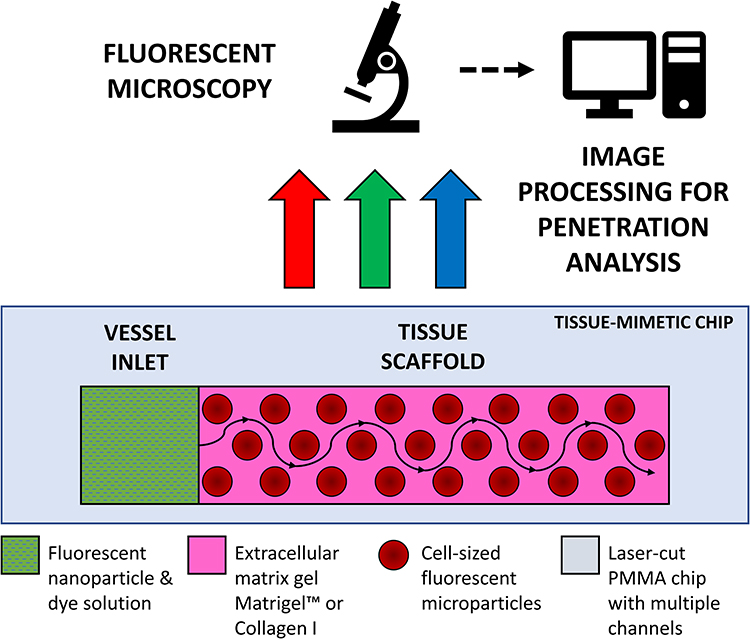 |
Figure 1 Schematic diagram of channel in polymethylmethacrylate chip – containing tissue-mimetic gel scaffold with an adjacent vessel inlet well, where nanoparticle solutions are loaded for imaging under fluorescent microscopy; fluorescent microparticles are substituted for the physical barriers of live cells. Imaging allows for time-lapse tracking of diffusive nanocarrier flow profiles from the vessel inlet through the tissue scaffold. |
Our framework allows for the evaluation of particle dynamics over a range of sizes and within various realistic biomimetic environmental parameters. We test our framework using spherical nanoparticles and track these nanoparticles through an environment of well-characterized commercially available ECM: Matrigel™ and bovine Collagen I. The resulting datasets are analysed using a custom-written automated routine, where the primary objective is to establish a high-throughput testing suite to quantify nanoparticle spatiotemporal dynamics in tissue environments.
Materials and Methods
Chip Preparation
Microfluidic devices were fabricated by laser-cutting transparent polymethylmethacrylate (PMMA) 2 mm acrylic sheets on a CO2 laser cutter (Trotec). Three types of cuts of equal surface area were made from the same sheet – A) a plate with multiple channels cut through the acrylic, B) a solid backing plate, and C) a plate of “plugs” that would create a removable physical barrier inside the channel for a liquid reservoir.
Each channel was formed by making a cut of 2x10 mm, and the plugs were formed by making cuts of 2.1x2 mm, creating a snug fit when the plug was inserted into the channel. The two halves A and B were then sealed using double-sided polyurethane tape of 2 mm thickness, providing a watertight and optically transparent chip that could be used to contain the biological gels. The plugs from C were inserted at the left-most point of each channel. The chips were then stored at −20 °C for at least 24 h as a rudimentary antibacterial measure while live cells were not in use.
Tissue Scaffold and Nanoparticle Preparation
Matrigel
Matrigel™ (Thermo Fisher) was aliquoted to volumes of 2mL and kept at −20 °C until used. The gel was thawed overnight at 4 °C before use.
For gels containing microparticles, 250 μL of red 10 μm FluoSpheres™ (Thermo Fisher) was added to an Eppendorf vial containing 750 μL of Matrigel™. This was mixed via pipetting up and down with a stirring motion before every use.
Collagen I
A collagen gel of 2 mg/mL and pH 7.4 was prepared as follows: for each mL of gel, 400 μL of 5 mg/mL bovine Collagen I (Thermo Fisher) was added to an Eppendorf tube, and combined with 40 μL of 0.5 M sodium hydroxide (Sigma Aldrich), 100 μL of phosphate-buffered saline (PBS) (Thermo Fisher) and 460 μL of deionised water. This mixture was kept at 4 °C until used.
For gels containing microparticles, 250 μL of red 10 μm FluoSpheres™ (Thermo Fisher) was added to an Eppendorf vial containing 750 μL of bovine Collagen I gel. This was mixed via pipetting up and down with a stirring motion before every use.
Gel Loading
When adding gels to the chip, 40 μL of gel was added per channel, beginning at the plugged end, and gradually moving the pipette tip along the channel. This eventually caused the meniscus of the gel to stick to the channel walls and create a contiguous block. If the meniscus did not reach the end of the channel naturally, the gel was gently pushed with the pipette tip until it contacted and stuck to the end (Figure 2A–C).
 |
Figure 2 Schematic overview of gel loading steps: (A) assembled device prior to gel loading, (B) empty channel with plug, (C) pipetting ECM gel into channel, (D) gelation under incubation, (E) removal of the PMMA plug to form an empty inlet, and (F) loading of the nanoparticle solution (NPs). |
Gelation and Culture Conditions
Given that the eventual goal of such a device would be to include live cells, the chips were placed in an incubator at 37 °C and 5% CO2 for 1 h before moving them to a heated microscope environment at the same temperature. This also allowed adequate time for complete gelation, such that the plug could be removed to form an inlet for nanoparticle injection (Figure 2D and E).
Nanoparticle Solution Preparation
A stock solution of fluorescein-free acid (Sigma) was made up to 100 ug/mL by serial dilution in Milli-Q water. A solution containing both dye and nanoparticles was created for this experiment, formed of 50% 100 µg/mL green fluorescein stock solution, and 50% 20 nm blue FluoSpheres™ in water. 8 μL of this solution was pipetted into each inlet at the start of the experiment before starting the time-lapse acquisition (Figure 2E and F).
The excitation wavelength for the red 10 μm polystyrene nanoparticles was 580 nm and the emission wavelength was 605 nm.
The excitation wavelength for the green fluorescein dye was 490 nm and the emission wavelength was 514 nm.
The excitation wavelength for the blue 20 nm polystyrene nanoparticles was 365 nm and the emission wavelength was 415 nm.
Fluorescent Microscopy
Fluorescent images were taken of the loaded chip at 10x magnification on a Leica microscope using their proprietary LAS X capture software. A time-lapse of each channel was acquired automatically by marking the channels as regions of interest in the software and taking images over 8 h at 30 min intervals.
The red filter used had an excitation filter wavelength of 560/40 nm and an emission filter wavelength of 645/76 nm.
The green filter used had an excitation filter wavelength of 480/40 nm and an emission filter wavelength of 527/30 nm.
The blue filter used had an excitation filter wavelength of 350/50 nm and an emission filter wavelength of 460/76 nm.
Image Analysis
Fluorescent image data were captured in a rectangular region of interest across the channel width (Figure 3A). The intensity of the fluorescent signal was averaged across the total width of the channel to create a 1D mean intensity profile spanning the length of the channel (data dimensions 1x10,000) for each time point and mixture). A moving window average was then applied to the 1D data, with window size of 1000.
 |
Figure 3 Graphical output of automated image analysis, showing (A) initial fluorescent image, (B) data preparation including conversion to 1D intensity profile, (C) averaging, selection of region of interest, and re-scaling (D) the final thresholding procedure. Both the region of interest (white dashed lines) and threshold intensity positions (red dashed lines) are marked on the fluorescent image. |
For all data, the section of the chamber containing the channel was removed. Additionally, data were seen to finish before the absolute end of the chamber with low amplitude values observed in the same spatial position for all experiment time points and mixtures and were also removed to avoid over-calculation of the penetration depth. The data, truncated to fall between the end of the channel and the end of the chamber, were then normalised by subtracting the minimum intensity value and normalising by the maximum amplitude, such that all intensity values fell between 0 and 1. A schematic of the initial data preparation stage is shown in Figure 3B and C.
The normalised and truncated intensity profile was then used to calculate the penetration depth. As the focus is on matching a qualitative difference between mixtures, a simple thresholding method was first used to compare penetration depths. We calculated the point within the chamber at which the intensity met a certain percentage of the maximum intensity (which is 1, given the normalisation procedure described above) with multiple threshold percentages considered (5/10/20/30/40/50%), shown in Figure 3D).
All data analyses were performed using custom-written MATLAB scripts (Mathworks, v.2019b). The codebase has been named the Tissue Penetration Analysis Codebase (TPAC) and is hosted at the following address: https://bitbucket.org/hauertlab/tpac/src/master/.
LAS X software (Leica) was used to automatically stitch the individual images together using the statistical alignment option and export the data as .tiff format images.
Diffusion Equations
The above procedure for calculating normalised penetration distance allowed for comparison of the diffusive profile of fluorescein dye and nanoparticles in different environments.
To verify that nanoparticle transport is mostly driven by diffusion and to quantify the diffusion coefficient, we also fitted a model of diffusion, with the assumption that diffusion along the length of the chamber will dominate. We model the green dye concentration, C(x, t), with constant and isotropic diffusion coefficient, D, using the standard equation,28
For the concentration of fluorescein dye, we observe that immediately after the channel position (marked as “Start” in Figure 3), the concentration monotonically decreases for all time observations and across all mediums. Hence, we assume an instantaneous point release of concentration  from the channel and at the first timepoint, such that
  , and that there is an impermeable boundary at x=0. The solution to Equation (2) is given by.28
where  is the maximum initial concentration rescaled to a value of 1. We fit this equation to the truncated and rescaled fluorescent intensity, normalising only with the maximum amplitude at the initial observation (timepoint 0).
For Equation (2), the diffusion coefficient, D, was fitted to data using the MATLAB Curve Fitting Toolbox. We consider only those fits that have an R2 higher than 0.9.
For our automated image analysis, we tested 5/10/20/30/40/50% intensity thresholds and found that the results were qualitatively the same across all thresholds. To match the visual inspection, described above, we selected an intensity threshold of 10% to match the observed ~100% penetration of green and ~40% penetration of blue, as shown in Figure 4. All subsequent results are with this 10% threshold, unless otherwise stated. After removing the inlet and chamber end, the total chamber length was 7.5 mm.
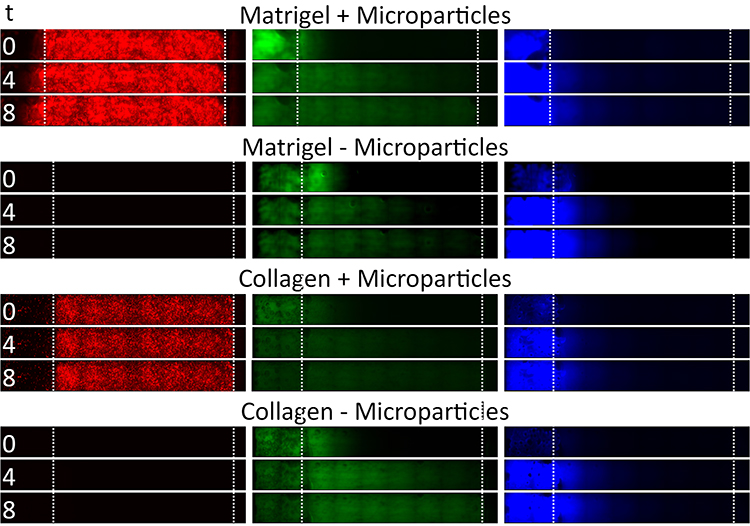 |
Figure 4 Time series data from example channels, showing tissue penetration of fluorescein dye and 20 nm particles in different tissue scaffold conditions (gel type vs presence of microparticles). Images represent penetration at time = 0 h, 4 h and 8 h. Boundaries of tissue scaffold location and channel end is denoted between dotted white lines. |
Results
In Figure 4, we show example image data from red, green, and blue channels within Matrigel™ or Collagen I, as well as with and without microparticles. We observe that the 20 nm FluoSpheres do not flow to the end of the channel through either Matrigel™ or Collagen I, but that there is a diffusion over the course of 8 h that reaches approximately one-third to one-half of the way through the gel (with low intensity), after accounting for the channel position.
The green fluorescein dye is instead able to diffuse through the entire tissue scaffold gels within 8 h, as expected from the smaller hydrodynamic radius of the dye particulates. Images taken over the duration of the experiment can be compiled into a video and analysed to show the spatiotemporal dynamics of the tracked nanoparticles within the tissue, as seen in Figure 5.
 |
Figure 5 Timescale data for all conditions, showing green dye reaching end of channel at ~4–5 h, and blue 20 nm particles not exceeding ~50% over entire 8 h experiment. Total timepoints = 16, total chamber length after removing data is 7.5 mm. |
The blue 20 nm FluoSpheres were observed to have a larger scatter in the Collagen I with microparticles than any other condition, which we attribute to differences in the porous matrix due to dilution with the microparticles. The 10 μm red microparticles have carboxylate groups on the surface, which may lead to electrostatic charge interaction with the collagen fibrils. We hypothesize that Matrigel does not follow the same trend due to it being a more complex protein matrix, which may prevent it from being so widely affected by the presence of microparticles. Future work would expand upon this by analysing the gel porosity with electron microscopy.
In Figure 6, we show the penetration distance for various tissue scaffold conditions for the blue nanoparticles and green dye, averaged across all 36 datasets (triplicate data for all four conditions and three individual chips) and where error bars denote the standard deviation, for the final time point (t = 8 h). A two-sample t-test analysis was performed on the data and confirmed several key differences.
 |
Figure 6 Results from automated analysis of fluorescent imaging data with a 10% threshold at t = 8 h, showing that green dye can be tracked to its ~100% penetration, and blue 20 nm particles can be tracked to ~40% penetration with the same threshold. The total chamber length after removing data is 7.5 mm. |
In Figure 7, first, we observe that blue 20 nm nanoparticles consistently diffuse less deep than the green dye under all conditions, as described above. Further, we observe that the average penetration distance of the green dye is higher without microparticles but broadly similar across gel type, whereas the blue 20 nm penetrated deeper in Matrigel™ than Collagen I. There was no significant difference for 20 nm nanoparticle with or without microparticles.
 |
Figure 7 Two significant results found in overall analysis, showing green dye is affected by presence or absence of microparticles, and blue nanoparticles are affected by gel type. The total chamber length after removing data is 7.5mm. (***) denotes p<0.005. |
Second, there was a significant difference (***, p<0.005) between the gel types for the blue nanoparticle diffusion. Collagen I proved to be more permeable to the nanoparticle diffusion than Matrigel™, with blue nanoparticles penetrating to a total distance (after 8 h) of 3.51 mm compared to 2.96 mm for Collagen I and Matrigel™, respectively. SEM images of Matrigel™ and a similar bovine Collagen I gel from the literature bear out that Matrigel™ (0.5–1 5 μm) has a smaller porosity than 2 mg/mL Collagen I (~2–5 μm), and this aligns with our analysis of Collagen I as being more permeable.29,30
Third, we observed a significant difference (***, p<0.005) between conditions with and without microparticles for the green fluorescein dye diffusion. The fluorescein dye permeated more in gels without microparticles (7.22 mm compared to 7.1 mm of the total truncated chamber length); although the data had higher variation (standard deviation of 0.65 mm compared to 0.01 mm). From this, we consider that the presence of microparticles provides obstacles to permeation, which may lead to longer trajectories due to collisions between the dye and microparticles. This would lead to the dye having more variation in how it flows, leading to an overall decrease in diffusion speed.
Finally, there was no significant difference between the gel types for the green fluorescein dye diffusion. Neither one of the gels appeared to affect the permeation of the dye, which leads to the conclusion that the fluorescein dye was small enough to penetrate the smaller nanostructure of Matrigel™.
Discussion
Having observed significant differences within the penetration distances, we consider whether the diffusion coefficient for the particles can be quantified using the model of diffusion described in Section 5.5. Here, we focus on the diffusion coefficient of the green fluorescein dye. We also include the diffusion coefficient, as calculated using the Stokes–Einstein equation:

where  is the Boltzmann constant,
  is the absolute temperature, r, is the hydrodynamic radius and
  is the dynamic viscosity of the medium with we assume to be 0.768 x10⁻³ kg/ms for Collagen I at 37°C.20 The dynamic viscosity of Matrigel™ was unknown and is not included for reference.
We observe that the diffusion coefficients for the green fluorescein dye (575±72.4 μm2/sec averaged across all experiments) are within the expected reference value for the diffusion coefficient (591.6 μm2/sec, as calculated using Stokes–Einstein equation and viscosity of Collagen I given in20). We chose to analyse the fluorescein dye as it fully penetrated the channel within the experimental timeframe and thus gave the best timescale dynamics. This matching of values to the literature shows that our device’s environment is useful for capturing the dynamics of diffusion throughout biomimetic tissue.
Furthermore, we observe that the diffusion coefficient is higher within Collagen I than within Matrigel™, as expected from the literature images of the porosity. Interestingly, we find that the averaged diffusion coefficient is higher when microparticles are present, counter to what is observed from the analysis of the penetration distance. The most logical conclusion is that the gel’s micron-scale mesh structure is disrupted and enlarged by the presence of the 10 μm particles, providing an easier pathway for the dye to migrate along the channel. To prove this, electron microscopy of the gel porosity with and without microparticles will be required in the future.
While we observe that the diffusion coefficient is slightly higher under the presence of microparticles, the change in the diffusion coefficient is small and within the standard deviation.
The mean squared displacement was calculated for all experiments across the three chips analysed in this experiment (Supplemental Table 1). All values for the exponent are below 1, indicating that the diffusion regime is sub-diffusive, as to be expected in porous media. The graphs for the fluorescein MSD curves are shown in Supplemental Figures 1, 3 and 5; while the 20 nm nanoparticle MSD curves are shown in Supplemental Figures 2, 4 and 6.
Conclusion
We have developed a low-cost device that is capable of tracking nanoparticles through tissue-mimetic environments. Here, we use microparticles as proxies for cell-like structures, with future work introducing cells to investigate the influence of cell-binding and internalisation on nanoparticle flow profiles. The images generated allow us to monitor nanoparticle penetration over time, where all analysis is performed automatically with a custom-built framework for penetration detection, here made open source. This demonstrates a device with the potential for high throughput testing of nanoparticle flow properties under a range of tumour-like conditions.
Monitoring the dynamics of nanocarriers as they move through tissue-like environments could help optimise their design to overcome transport barriers, leading to better distribution within tumours and reduced off-target effects.
In future work, we will refine the workflow to produce a high-throughput screening system whereby this custom chip can be used as a low-cost, modular analysis platform for testing nanomedicine flow through a biological microenvironment (such as a cancerous tumour) – the output of which can then be processed with the press of a button to provide detailed statistical information about the permeation and diffusion characteristics of numerous different conditions at once. Such a testing suite could then interface with machine learning routines to allow for the automatic characterisation and design of nanoparticle-based drug therapies.31
As a demonstration, we compare tissue penetration of two fluorescent nanoparticles of different sizes. As expected, the larger particles clearly have a harder time penetrating through both types of gel. Our next work intends to add multiple types of other fluorescent particles into the mixture, including larger and smaller particles with different charges and targeting moieties.
We also seek to investigate whether mathematical analysis can be applied in the reverse manner in this system – whether we can utilize pre-characterized particles of known properties to gather information about the gels themselves. Both approaches would allow for the effective calibration of tissue-scale models of nanoparticle transport, further improving our understanding of the main obstacles for effective penetration into the tumour tissue.32–34
Abbreviations
ECM, extra-cellular matrix; SEM, scanning electron microscopy; PDMS, poly-dimethyl siloxane; PMMA, polymethylmethacrylate.
Acknowledgments
This project has received funding from the European Union’s Horizon 2020 FET Open programme under grant agreement #800983. The authors wish to acknowledge the Wolfson Bioimaging Facility at the University of Bristol for their support and assistance in this work.
Disclosure
Dr Scott McCormick reports grants from European Union, during the conduct of the study. The authors report no other conflicts of interest in this work.
References
1. Barua S, Mitragotri S. Challenges associated with penetration of nanoparticles across cell and tissue barriers: a review of current status and future prospects. Nano Today. 2014;9(2):223–243. doi:10.1016/j.nantod.2014.04.008
2. Stillman NR, Kovacevic M, Balaz I, Hauert S. In silico modelling of cancer nanomedicine, across scales and transport barriers. NPJ Comput Mater. 2020;6(1):92. doi:10.1038/s41524-020-00366-8
3. Gou J, Liang Y, Miao L, et al. Improved tumor tissue penetration and tumor cell uptake achieved by delayed charge reversal nanoparticles. Acta Biomater. 2017;62:157–166. doi:10.1016/j.actbio.2017.08.025
4. Goodman TT, Olive PL, Pun SH. Increased nanoparticle penetration in collagenase-treated multicellular spheroids. Int J Nanomedicine. 2007;2(2):265–274.
5. Nance EA, Woodworth GF, Sailor KA, et al. A dense poly(ethylene glycol) coating improves penetration of large polymeric nanoparticles within brain tissue. Sci Transl Med. 2012;4(149):149ra119. doi:10.1126/scitranslmed.3003594
6. Hauert S, Berman S, Nagpal R, Bhatia SN. A computational framework for identifying design guidelines to increase the penetration of targeted nanoparticles into tumors. Nano Today. 2013;8(6):566–576. doi:10.1016/j.nantod.2013.11.001
7. Lai SK, Wang -Y-Y, Hanes J. Mucus-penetrating nanoparticles for drug and gene delivery to mucosal tissues. Adv Drug Deliv Rev. 2009;61(2):158–171.
8. Wong C, Stylianopoulos T, Cui J, et al. Multistage nanoparticle delivery system for deep penetration into tumor tissue. Proc Natl Acad Sci. 2011;108(6):2426–2431.
9. Ruoslahti E. Peptides as targeting elements and tissue penetration devices for nanoparticles. Adv Mater. 2012;24(28):3747–3756. doi:10.1002/adma.201200454
10. Moore TL, Urban DA, Rodriguez-Lorenzo L, et al. Nanoparticle administration method in cell culture alters particle-cell interaction. Sci Rep. 2019;9(1). doi:10.1038/s41598-018-36954-4.
11. Hauert S, Bhatia SN. Mechanisms of cooperation in cancer nanomedicine: towards systems nanotechnology. Trends Biotechnol. 2014;32(9):448–455. doi:10.1016/j.tibtech.2014.06.010
12. Ai J, Biazar E, Jafarpour M, et al. Nanotoxicology and nanoparticle safety in biomedical designs. Int J Nanomedicine. 2011;6:1117–1127. doi:10.2147/IJN.S16603
13. Eifler AC, Thaxton CS. Nanoparticle therapeutics: FDA Approval, Clinical Trials, Regulatory Pathways, and Case Study. In: Hurst SJ, editor. Biomedical Nanotechnology: Methods and Protocols. Totowa, NJ: Humana Press; 2011:325–338.
14. Etheridge ML, Campbell SA, Erdman AG, Haynes CL, Wolf SM, McCullough J. The big picture on nanomedicine: the state of investigational and approved nanomedicine products. Nanomedicine. 2013;9(1):1–4.
15. Tran S, DeGiovanni P-J, Piel B, Rai P. Cancer nanomedicine: a review of recent success in drug delivery. Clin Transl Med. 2017;6(1). doi:10.1186/s40169-017-0175-0
16. Sindhwani S, Syed AM, Ngai J, et al. The entry of nanoparticles into solid tumours. Nat Mater. 2020;19(5):566–575. doi:10.1038/s41563-019-0566-2
17. Fernández-Sánchez ME, Barbier S, Whitehead J, et al. Mechanical induction of the tumorigenic β-catenin pathway by tumour growth pressure. Nature. 2015;523(7558):92–95. doi:10.1038/nature14329
18. Macklin P, McDougall S, Anderson ARA, Chaplain MAJ, Cristini V, Lowengrub J. Multiscale modelling and nonlinear simulation of vascular tumour growth. J Math Biol. 2009;58(4):765–798. doi:10.1007/s00285-008-0216-9
19. Lusi V, Moore TL, Laurino F, et al. A tissue chamber chip for assessing nanoparticle mobility in the extravascular space. Biomed Microdevices. 2019;21(2). doi:10.1007/s10544-019-0398-5.
20. Kihara T, Ito J, Miyake J. Measurement of biomolecular diffusion in extracellular matrix condensed by fibroblasts using fluorescence correlation spectroscopy. PLoS One. 2013;8(11):e82382. doi:10.1371/journal.pone.0082382
21. Raeesi V, Chan WCW. Improving nanoparticle diffusion through tumor collagen matrix by photo-thermal gold nanorods. Nanoscale. 2016;8(25):12524–12530. doi:10.1039/C5NR08463F
22. Stylianopoulos T, Diop-Frimpong B, Munn LL, Jain RK. Diffusion anisotropy in collagen gels and tumors: the effect of fiber network orientation. Biophys J. 2010;99(10):3119–3128. doi:10.1016/j.bpj.2010.08.065
23. Liu D, Zhang H, Fontana F, Hirvonen JT, Santos HA. Current developments and applications of microfluidic technology toward clinical translation of nanomedicines. Adv Drug Deliv Rev. 2018;128:54–83. doi:10.1016/j.addr.2017.08.003
24. Hou X, Liu S, Wang M, et al. Layer-by-layer 3D constructs of fibroblasts in hydrogel for examining transdermal penetration capability of nanoparticles. SLAS Technol. 2017;22(4):447–453.
25. Ho YT, Adriani G, Beyer S, et al. Method to probe the vascular permeability of nanoparticles in nanomedicine applications. Sci Rep. 2017;7(1):707. doi:10.1038/s41598-017-00750-3
26. Carvalho MR, Barata D, Teixeira LM, et al. Colorectal tumor-on-a-chip system: a 3D tool for precision onco-nanomedicine. Sci Adv. 2019;5(5):eaaw1317. doi:10.1126/sciadv.aaw1317
27. Albanese A, Lam AK, Sykes EA, Rocheleau JV, Chan WCW. Tumour-on-a-chip provides an optical window into nanoparticle tissue transport. Nat Commun. 2013;4(1):2718. doi:10.1038/ncomms3718
28. Crank J. The Mathematics of Diffusion.
29. Gelain F, Bottai D, Vescovi A, Zhang S. Designer self-assembling peptide nanofiber scaffolds for adult mouse neural stem cell 3-dimensional cultures. PLoS One. 2006;1:e119. doi:10.1371/journal.pone.0000119
30. Knapp D, Barocas V, Moon A, Yoo K, Petzold L, Tranquillo R. Rheology of reconstituted type I collagen gel in confined compression. J Rheol. 1997;415.
31. Murphy RF. An active role for machine learning in drug development. Nat Chem Biol. 2011;7(6):327–330.
32. Islam MA, Barua S, Barua D. A multiscale modeling study of particle size effects on the tissue penetration efficacy of drug-delivery nanoparticles. BMC Syst Biol. 2017;11(1). doi:10.1186/s12918-017-0491-4
33. Li S, Zhang Y, Wang J, et al. Nanoparticle-mediated local depletion of tumour-associated platelets disrupts vascular barriers and augments drug accumulation in tumours. Nat Biomed Eng. 2017.
34. Rejniak KA, Estrella V, Chen T, Cohen AS, Lloyd MC, Morse DL. The role of tumor tissue architecture in treatment penetration and efficacy: an integrative study. Front Oncol. 2013;3. doi:10.3389/fonc.2013.00111
 © 2021 The Author(s). This work is published and licensed by Dove Medical Press Limited. The
full terms of this license are available at https://www.dovepress.com/terms
and incorporate the Creative Commons Attribution
- Non Commercial (unported, 3.0) License.
By accessing the work you hereby accept the Terms. Non-commercial uses of the work are permitted
without any further permission from Dove Medical Press Limited, provided the work is properly
attributed. For permission for commercial use of this work, please see paragraphs 4.2 and 5 of our Terms.
© 2021 The Author(s). This work is published and licensed by Dove Medical Press Limited. The
full terms of this license are available at https://www.dovepress.com/terms
and incorporate the Creative Commons Attribution
- Non Commercial (unported, 3.0) License.
By accessing the work you hereby accept the Terms. Non-commercial uses of the work are permitted
without any further permission from Dove Medical Press Limited, provided the work is properly
attributed. For permission for commercial use of this work, please see paragraphs 4.2 and 5 of our Terms.