Back to Journals » OncoTargets and Therapy » Volume 13
MCTS1 Directly Binds to TWF1 and Synergistically Modulate Cyclin D1 and C-Myc Translation in Luminal A/B Breast Cancer Cells
Received 26 March 2020
Accepted for publication 14 May 2020
Published 10 June 2020 Volume 2020:13 Pages 5353—5361
DOI https://doi.org/10.2147/OTT.S255675
Checked for plagiarism Yes
Review by Single anonymous peer review
Peer reviewer comments 2
Editor who approved publication: Dr Carlos E Vigil
Chao Tian,1,* Shiyan Zeng,1,* Jing Luo2
1Department of Breast Surgery, Sichuan Cancer Hospital & Institute, Sichuan Cancer Center, School of Medicine, University of Electronic Science and Technology of China, Chengdu 610041, Sichuan, People’s Republic of China; 2Department of Breast Surgery, Sichuan Academy of Medical Science & Sichuan Provincial People’s Hospital, Chengdu 610072, Sichuan, People’s Republic of China
*These authors contributed equally to this work
Correspondence: Jing Luo Email [email protected]
Purpose: MCTS1 re-initiation and release factor (MCTS1) is a ribosome-binding protein and shows multiple oncogenic properties in multiple cancers. This study aimed to investigate the expression, prognostic significance and transcription profile of MCTS1 in the PAM50 subtypes of breast cancer, as well as proteins with functional interactions with MCTS1 in luminal A/B breast cancer cells.
Materials and Methods: Data from The Cancer Genome Atlas (TCGA)-Breast Carcinoma (BRCA) and Gene Expression Omnibus (GEO) and normal breast epithelial tissue data from the Genotype-Tissue Expression (GTEx) project were extracted and integrated for bioinformatic analysis. BT-474 and MCF-7 cells were used for in-vitro studies.
Results: MCTS1 expression varied significantly among PAM50 subtypes. Its expression might independently predict unfavorable overall survival (OS) in luminal A and B cases, but not in other subtypes. ENST00000371317.9 is the dominant isoform of MCTS1 transcripts and showed a step increase from normal, adjacent normal to breast cancer tissues. The protein encoded by this isoform directly bound to TWF1 and synergistically modulated cyclin D1 and C-Myc translation in BT-474 and MCF-7 cells.
Conclusion: MCTS1 expression might serve as a potential prognostic biomarker of unfavorable OS in luminal A and luminal B cases. The novel direct interaction between MCTS1 and TWF1 might be necessary for the translation of some downstream genes in common in luminal A/B breast cancer cells.
Keywords: breast cancer, MCTS1, TWF1, cyclin D1, C-Myc
Introduction
MCTS1 re-initiation and release factor (MCTS1), which is also known as MCT-1, is a ribosome-binding protein and shows multiple oncogenic properties in various cancers.1,2 MCTS1 overexpression also participates in the malignant transformation of human mammary epithelial cells by reducing cell cycle checkpoint control.3 However, breast cancer is a highly heterogeneous disease in terms of genomic background, biological behaviors, and clinical prognosis.4 By a 50-gene qPCR assay (PAM50), breast cancers can be classified into five biologically and clinically distinct groups, including luminal A, luminal B, human epidermal growth factor receptor 2 (HER2)-enriched (HER2-E), basal-like, and normal-like subtypes.5
Available evidence showed that MCTS1 might exert diverse oncogenic effects in PAM50 subtypes. In MCF7 cell (a typical luminal A cell line) based models, MCTS1 promotes malignant behaviors by enhancing angiogenesis through decreasing thrombospondin 1 expression and inhibiting apoptosis.6 In models based on MDA-MB-468 and MDA-MB-231 (triple-negative breast cancer cell lines, mostly basal-like) and MCF-7 cells, MCTS1 activates the Src/p190B signaling pathway and subsequently inhibits RhoA activity.7 These alterations result in increased spindle multipolarity and cytokinesis failure.7 MCTS1 inhibits miR-34a expression and stimulates IL-6 secretion in MDA-MB-231 cells, thereby leading to enhanced EMT and cancer stem cell properties.8 Besides, it also promotes M2 polarization of macrophages in the tumor microenvironment.8 These findings suggested that MCTS1 might exert oncogenic effects via multiple signaling pathways in different PAM50 subtypes.
In this study, using data from multiple large databases, we analyzed the expression, prognostic significance and transcription profile of MCTS1 in the PAM50 subtypes of breast cancer. Then, we explored the proteins with functional interactions with MCTS1 in luminal A/B breast cancer cells.
Materials and Methods
Data Extraction from the Cancer Genome Atlas-Breast Cancer (TCGA-BRCA)
The data from primary tumor cases and adjacent normal tissues in TCGA-BRCA were acquired using the UCSC Xena (http://xena.ucsc.edu/). The following data, including PAM50 subtypes determined by RNA-seq data, RNA-seq data of gene and transcript expression (calculated by TPM), age at initial pathological diagnosis, pathological stages, radiation therapy, and overall survival (OS) times were extracted.
A total of 1092 primary breast cancer cases and 113 adjacent normal tissues were included. Among the primary tumor cases, 838 cases with PAM50 classification data, including 420 luminal A (419 had OS data), 192 luminal B, 139 HER2-E, 66 basal-like and 22 normal basal-like cases.
Data Mining in Breast Cancer Gene-Expression Miner V4.4
This online tool (http://bcgenex.centregauducheau.fr/BC-GEM/GEM-Accueil.php) provides a strategy to extract published annotated breast cancer-relevant genomic data,9 including microarray data from Gene Expression Omnibus (GEO) and RNA-seq data from GEO. Data from over 9000 patients were collected from microarray data, while over 3500 patients were collected from GSE81540.10
Data Extraction from the Genotype-Tissue Expression (GTEx)
The RNA-seq data of normal breast epithelial tissues were obtained from the GTEx.11 Gene and transcript expression data were extracted.
Prediction of Protein Interaction
The proteins with physical interactions with MCTS1 were predicted using GeneMANIA,12 according to the tool instruction.
Cell Culture and Treatment
MCF-7 and BT-474 cell lines were obtained from American Type Culture Collection (Manassas, VA, USA). Cells were maintained in DMEM medium (Gibco, Grand Island, NY, USA), supplemented with 10% fetal bovine serum (FBS) (Atlanta Biologicals, Lawrenceville, GA, USA), 2 mM L-Glutamine (Gibco) and 50 U/mL Penicillin-50 μg/mL Streptomycin antibiotics (Gibco). Cell lines were cultured in a 37°C incubator with humidified atmosphere of 5% CO2.
Lentiviral MCTS1 expression plasmid (PLV-MCTS1), TWF1 expression plasmid (PLV- TWF1), Lentiviral MCTS1 expression plasmid with FLAG tag (MCTS1-FLAG), Lentiviral TWF1 expression plasmid with HA tag (TWF1-HA), MCTS1 shRNA plasmids (siRNA sequence: #1, sense, 5ʹ-CCCTAAGATTACTTCACAAAT-3ʹ; #2, sense, 5ʹ-GTCCGATGCCATGAACATATA-3ʹ), TWF1 shRNA plasmids (siRNA sequence: #1, sense, 5ʹ-CCAGGGATATGAATGGATATT-3ʹ and #2, sense, 5ʹ-GCCACATTAAAGATGAAGTAT-3ʹ) were constructed by GeneChem Co., Ltd. (Shanghai, China). Empty lentiviral plasmids (Vector) and lentiviral plasmids with scramble shRNA were used as controls, respectively.
Recombinant lentiviruses were produced by transfecting 293T cells with the recombinant lentiviral vector and packaging plasmids (pHelper 1.0 including gag/pol and pHelper 2.0 including VSVG) using Lipofectamine 2000 (Invitrogen, Carlsbad, CA, USA). The culture supernatants were harvested 48h after transfection, filtered with 0.45-µm filter and centrifuged. All supernatants were stored at −80 °C before infection. MCF-7 and BT-474 cells were infected with the lentiviral vectors at a multiplicity of infection (MOI) of 30.
Immunofluorescence Staining Confocal Microscopy
BT-474 and MCF-7 cells were grown on sterile coverslips placed in 24-well plates. Cells were then fixed with 4% paraformaldehyde for 15 minutes at room temperature and permeabilized with 0.5% Triton X-100 for 10 minutes. After blocking with 3% BSA for 30 minutes, cells were incubated with the primary antibodies (mouse anti-MCTS1, 1:250, SAB4100348, Sigma-Aldrich, St. Louis, MO, USA and rabbit anti-TWF1, 1:500, HPA018116, Sigma-Aldrich) for overnight at 4°C. Subsequently, the coverslips were rinsed and incubated with the secondary antibody conjugated to Alexa Fluor® 488 conjugated goat anti-mouse secondary antibody (ab150113, Abcam) and Alexa Fluor® 647 conjugated goat anti-rabbit secondary antibody (ab150083, Abcam) at 1:1000 dilution for 1h at room temperature in the dark. DNA was counterstained with DAPI. Coverslips were then mounted with Fluoromount-G. Fluorescence images were acquired using appropriate optical filters on an AxioImager Z1 ApoTome microscope system (Carl Zeiss, Jena, Germany) equipped with a × 100 or a × 63 lens (both PlanApo N.A.1.4) and an AxioCam MRm camera.
Western Blot Analysis
Total proteins were extracted with cell lysis buffer with protease inhibitors (Beyotime, Wuhan, China) from MCF-7 and BT-474 cells 48h after indicating treatment and were separated using 10% sodium dodecyl sulfate-polyacrylamide gel electrophoresis (SDS-PAGE) and electrotransferred onto polyvinylidene difluoride membranes (Millipore, Billerica, MA, USA). Membranes were blocked with 5% nonfat milk in Tris(hydroxymethyl)aminomethane-buffered saline Tween-20 and incubated with the primary antibody (anti-Cyclin D1, SAB4502603, 1:500, Sigma-Aldrich; anti-C-Myc, ab32072, 1:1000, Abcam, Cambridge, MA, USA). Then, the membranes were incubated with HRP-conjugated secondary antibodies for 1h at room temperature. The blots were then visualized with BeyoECL Star reagent (Beyotime) and an ImageQuant LAS-4000 imaging system (GE Healthcare, Piscataway, NJ, USA).
Quantitative RT-PCR (qRT-PCR) Analysis
Total RNA was isolated from MCF-7 and BT-474 cells 48h after indicating treatment. Complementary DNA synthesis was performed using PrimeScript reverse transcriptase.
Master Mix (TaKaRa, Shiga, Japan) according to the manufacturer’s instructions. Reverse-transcribed products were amplified using SYBR Premix Ex Taq (TaKaRa), with the ABI PRISM 7900HT Sequence Detection System (Applied Biosystems). The following primers were used: human CCND1, 5ʹ-GGGGGCGTAGCATCATAGTA-3ʹ (forward) and 5ʹ-TGTGAGCTGGCTTCATTGAG-3 (reverse); human C-MYC, 5ʹ-CTCCTGGCAAAAGGTCAGAG-3ʹ (forward) and 5ʹ-TCGGTTGTTGCTGATCTGTC-3ʹ (reverse); human ACTB, 5ʹ-CACCATTGGCAATGAGCGGTTCʹ-3 (forward) and 5ʹ-AGGTCTTTGCGGATGTCCACGT-3ʹ (reverse). Relative mRNA levels were normalized to ACTB, and the relative expression of CCND1 and C-MYC transcripts were analyzed using the 2−ΔΔCT method.
Co-Immunoprecipitation (Co-IP) Assay
MCF-7 and BT-474 cells were co-infected with MCTS1-FLAG and TWF1-HA vectors for overexpression. 48h later, cells were lysed in ice-cold Co-IP lysis buffer (Beyotime, Wuhan, China), and were then incubated on ice for 10 min. The insoluble material was pelleted at 13,000×g for 10 min at 4°C. The supernatant was pre-cleaned by protein A/G PLUS-Agarose (Santa Cruz Biotechnology, Santa Cruz, CA, USA) and the aliquots were immunoprecipitated with a specific antibody against FLAG tag (ab1162, Abcam), followed by incubation with protein A/G PLUS-Agarose beads for a further 1h at 4°C. The immunoprecipitated complexes were washed and the precipitated proteins were then analyzed by Western blot analysis (anti-HA, ab18181, Abcam). The input was used as a positive control.
CCK-8 Assay of Cell Proliferation
The proliferation of BT-474 and MCF-7 cells with or without TWF1 overexpression was examined using the CCK-8 assay (Beyotime), according to the manufacturer’s instruction. Briefly, cells were seeded in a 96-well culture plate at 2×10³/well and were further incubated for 24, 48, and 72 or 96 h. To examine cell viability, 10 µL of CCK-8 solution was added to each well and further incubated for 4h. Then, absorbance was measured at 450 nm wavelength using the ELX 800 Microplate Reader (BioTek Instruments, Winooski, VT, USA).
Statistical Analysis
One-way ANOVA with post hoc Tukey’s multiple comparisons test was performed for multiple group comparisons. Welch’s unequal variances t-test was performed for two-group comparison. Kaplan-Meier OS curves were generated by setting the last quartile of gene expression as the cutoff. The Log rank test was applied for statistical comparison. Univariate and multivariate analysis was performed for prognostic analysis, by setting gene or transcript expression as a continuous variable. Hazard ratio (HR) and corresponding 95% confidence interval (CI) were calculated. p<0.05 was considered statistically significant.
Results
MCTS1 Expression Was Upregulated in Breast Cancer but Showed Significant Variations in PAM50 Subtypes
Using RNA-seq data from TCGA-BRCA, we confirmed the upregulation of MCTS1 in breast cancer cases compared to adjacent normal tissues (p<0.001, Figure 1A). One-way ANOVA study showed that MCTS1 expression varied significantly in PAM50 subtypes. Among the subtypes, luminal B cases had significantly higher MCTS1 expression compared to luminal A, normal-like and basal-like cases (p<0.01, Figure 1B). To validate the variations, we checked data in Breast cancer Gene-Expression Miner v4.4. Using integrated microarray data from GEO (Figure 1C and D) and RNA-seq data from GSE81540,10 we confirmed significantly different MCTS1 expression in the PAM50 subtypes. Integrated microarray data suggested that the luminal B cases had significantly higher MCTS1 expression compared to the other four subtypes (Figure 1C and D), while data in GSE81540 showed that the luminal B cases had significantly higher MCTS1 expression than basal-like, luminal A and normal-like cases (Figure 1E and F).
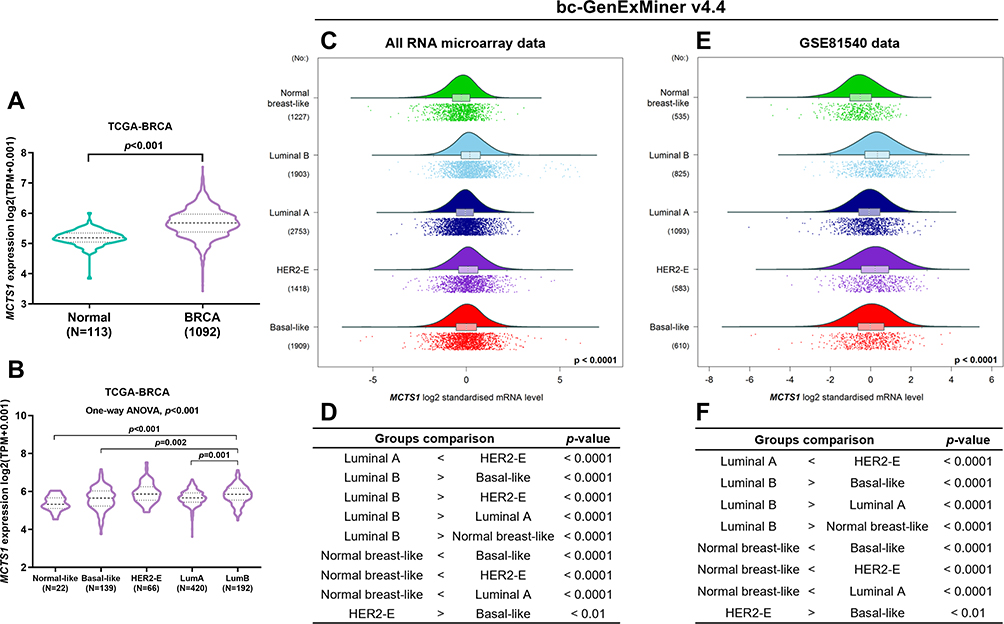 |
Figure 1 MCTS1 expression was upregulated in breast cancer but showed significant variations in PAM50 subtypes. (A) A violin chart showing MCTS1 expression between breast cancer and adjacent normal cases in TCGA-BRCA. (B) MCTS1 expression among PAM50 subtypes in TCGA-BRCA. One-way ANOVA, with post hoc Tukey’s multiple comparisons test was conducted. (C–F) Data mining in Breast cancer Gene-Expression Miner v4.4 was performed to explore MCTS1 expression profile and to compare the difference between PAM50 subtypes in all microarray datasets in GEO (C, D) and in RNA-seq data from GSE81540 (E, F). |
MCTS1 Expression Was Independently Associated with Unfavorable OS in Luminal A and B Patients
Then, we compared the difference in OS between the patients with the highest MCTS1 expression (>75%) and the rest 75% cases, using survival data in GSE81540 and TCGA respectively. Comparisons were conducted in luminal A, luminal B, HER2-E and basal-like cases respectively. In GSE81540, the high MCTS1 expression group had significantly worse OS compared to the low MCTS1 group in luminal A (HR:2.07, 95% CI: 1.27–3.39, p=0.0037, Supplementary Figure 1A) and luminal B cases (HR:2.12, 95% CI: 1.34–3.36, p=0.0013, Supplementary Figure 1B). No significant difference was observed in HER2-E and basal-like patients (Supplementary Figure 1C-D). The significant OS difference was validated in luminal A and luminal B cases in TCGA-BRCA (Supplementary Figure 1E and F). Similarly, no significant difference was observed in HER2-E and basal-like cases (Supplementary Figure 1G and H).
Then, we assessed the prognostic significance of MCTS1 expression using univariate and multivariate analysis based on data from TCGA-BRCA. In luminal A patients, MCTS1 expression was an independent predictor of poor OS (HR:2.291, 95% CI: 1.080–4.860, p=0.031), after adjustment for age and pathological stages (Table 1). In luminal B patients, only MCTS1 expression has prognostic value in terms of OS (HR:3.617, 95% CI: 1.739–7.521, p=0.001), among the four parameters (Table 2). However, univariate analysis failed to identify the potential prognostic value of MCTS1 expression in HER2-E and basal-like cases (p>0.05, Supplementary Table 1).
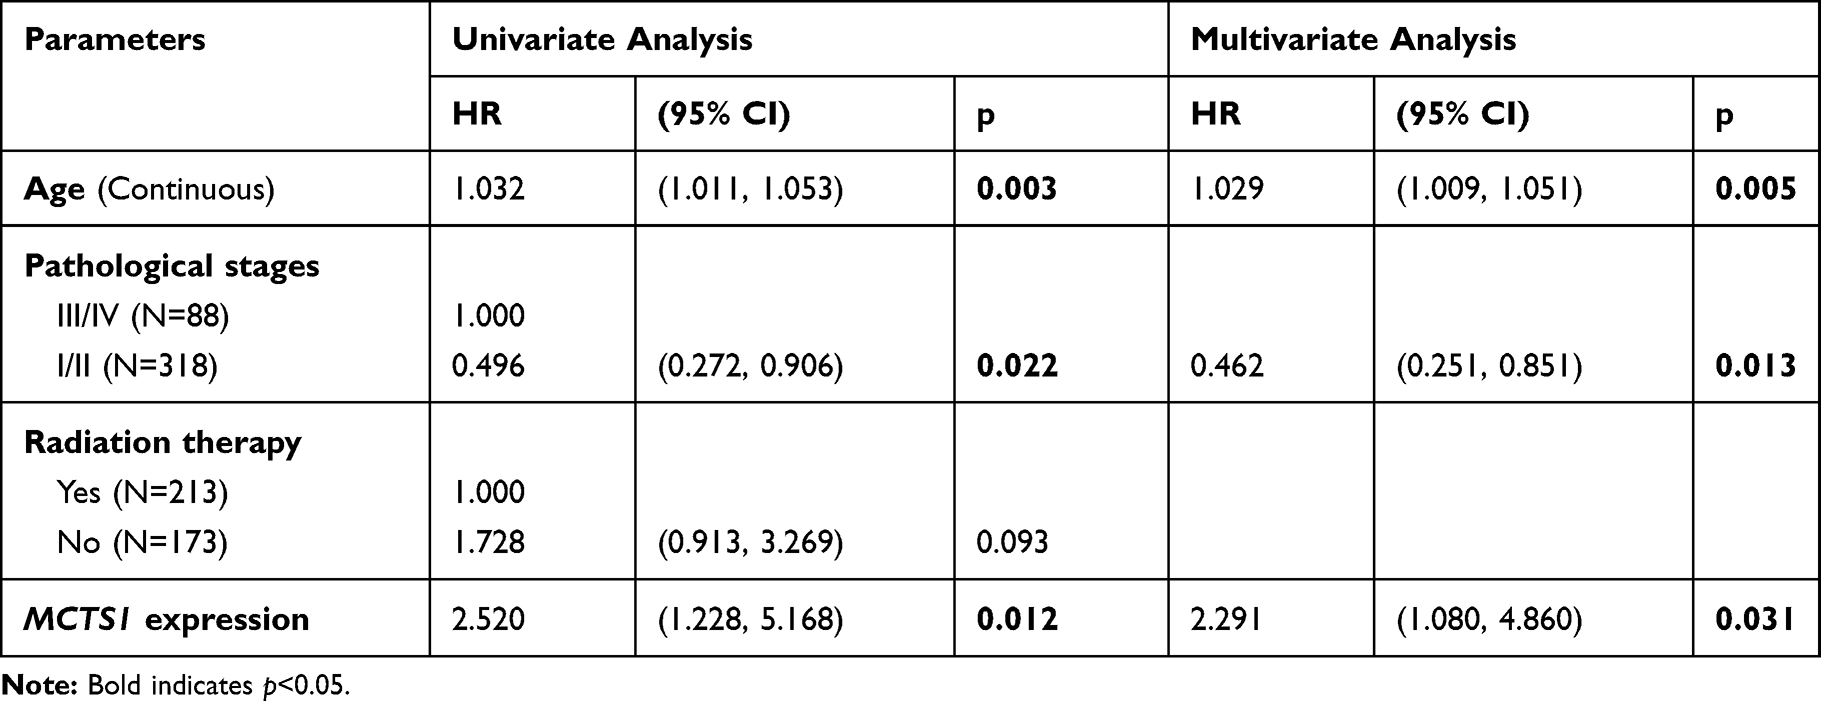 |
Table 1 Univariate and Multivariate Analyses of the Prognostic Value of MCTS1 Expression in Luminal a Patients |
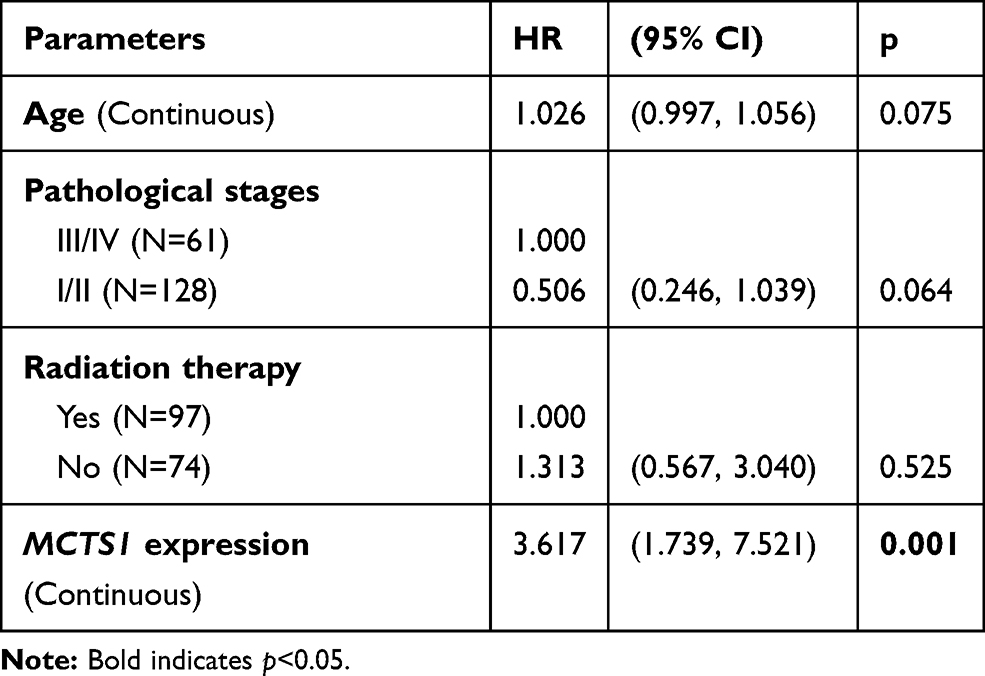 |
Table 2 Univariate Analysis of the Prognostic Value of MCTS1 Expression in Luminal B Patients |
ENST00000371317.9 Is the Dominant Transcript of MCTS1 with Enhanced Transcription in Terms of Absolute Expression and Proportion in Breast Cancer
To explore the mechanisms underlying the dysregulation of MCTS1, we checked its transcript profiles in normal and breast cancer cases. Results showed that in both normal and breast cancer tissues, multiple MCTS1 isoforms were expressed, in which ENST00000371317.9 was the dominant isoform (Figure 2A and B). The absolute ENST00000371317.9 expression and its proportion among all transcripts were significantly higher in breast cancer tissues than in normal tissues (Figure 2C and D). Interestingly, its expression and isoform proportion were also higher in adjacent normal tissues than in normal breast tissues (Figure 2C and D), suggesting that the morphologically normal adjacent tissues might harbor molecular alterations related to malignant transformation. Besides, the median ENST00000371317.9 isoform proportion increased to over 90% in all PAM50 subtypes, which was only around 80% in GTEx normal tissues (Figure 2D). These findings suggested this transcript was the most critical oncogenic isoform. Therefore, we decided to explore the function of the protein encoded by this transcript in luminal A/B breast cancer cells.
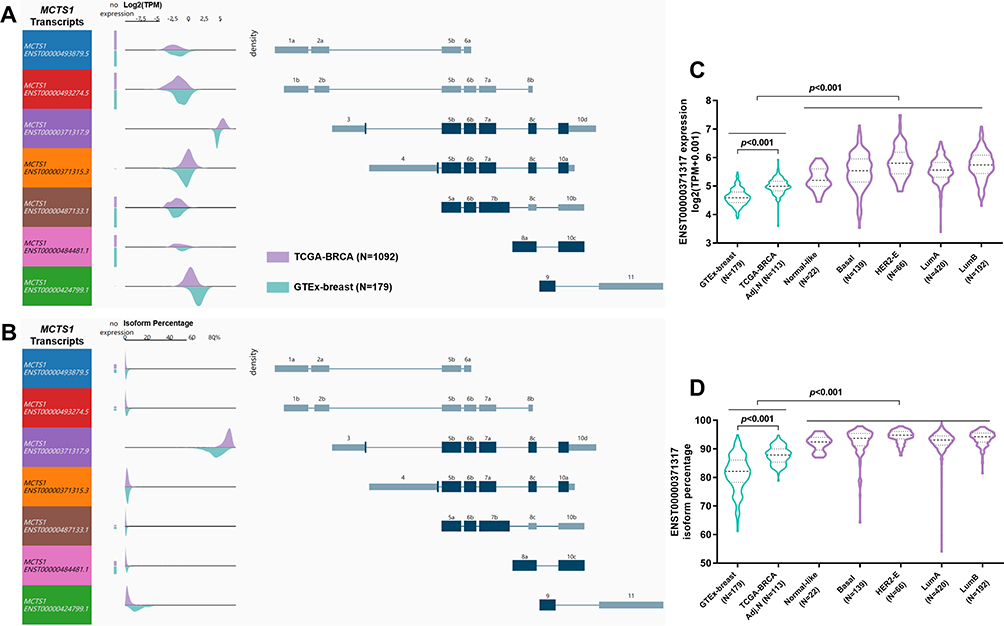 |
Figure 2 MCTS1 transcript profiles in normal and breast cancer tissues. (A, B) MCTS1 transcript expression (A) and isoform percentage (B) in normal breast tissues from GTEx-breast and cancer tissues from TCGA-BRCA. Each row in visualization shows the transcript and transcript structure. Density plots show the range of expression of the corresponding transcript. (C, D) Violin plot charts showing MCTS1 transcript expression (C) and isoform percentage (D) in normal breast tissues from GTEx-breast and in the PAM50 subtypes of breast cancer. |
MCTS1 Directly Bound with Twinfilin Actin Binding Protein 1 (TWF1) in Luminal A/B Breast Cancer Cells
By prediction in GeneMANIA, we found that MCTS1 might have interactions with multiple other proteins (Figure 3A), in which DNER was a verified one.2 Noticeably, among the predicted functional partners, TWF1 has been characterized as an oncoprotein in breast cancer.13 By checking its transcriptional profiles, we found that ENST00000395510.6 was the dominant isoform, with median isoform percentage higher than 80% in both normal and luminal A/B cases (Figure 3B). The expression of this isoform was significantly higher in both luminal A and B cases compared to normal mammary tissues and tumor-adjacent normal tissues (Figure 3C). Enforced expression of TWF1 elevated cyclin D1 and c-Myc protein expression in both BT-474 and MCF-7 cells, which were similar to the effects of MCTS1 overexpression (Figure 3D and F). However, there were no mutual regulatory effects between MCTS1 and TWF1 (Figure 3D–F). TWF1 overexpression significantly enhanced the proliferation of BT-474 and MCF-7 cells (Figure 3E and G). By performing immunofluorescence staining in MCF-7 and BT-474 cells, we found that MCTS1 and TWF1 were partly co-localized in the cytoplasm (Figure 3H). Therefore, we decided to verify whether there were direct interactions between them. Co-IP assay confirmed that MCTS1 directly bound with TWF1 in both BT-474 and MCF-7 cells (Figure 3I and J).
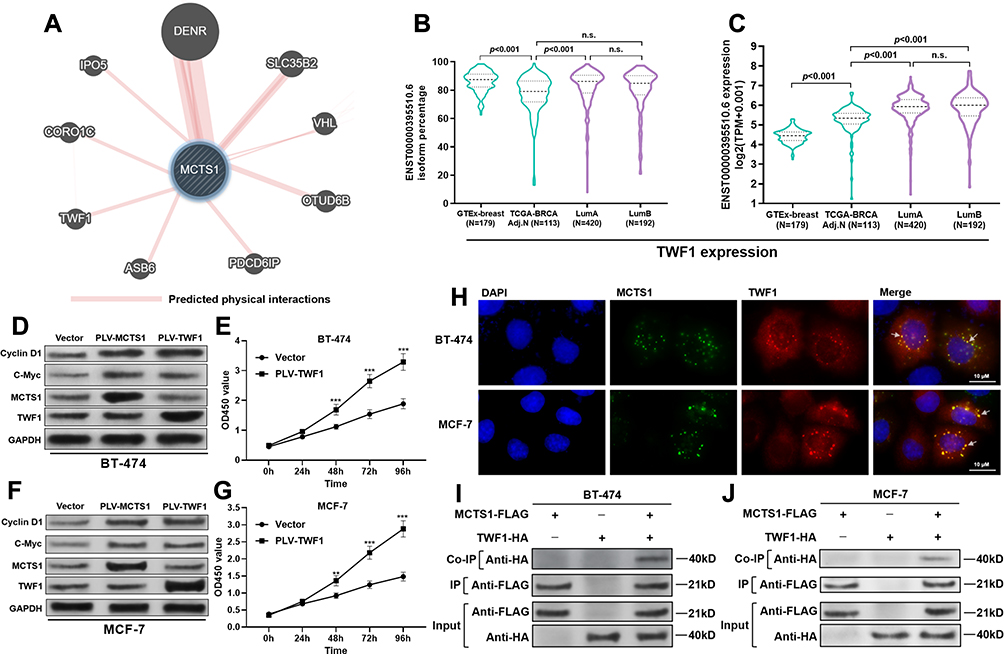 |
Figure 3 MCTS1 directly bound with TWF1 in luminal A/B breast cancer cells. (A) Proteins with predicted interactions with MCTS1. (B, C) Isoform percentage of the dominant TWF1 transcript (ENST00000395510.6) (B) and its absolute expression (C) in normal breast tissues from GTEx-breast and cancer tissues from TCGA-BRCA. (D and F) Western blot analysis of cyclin D1, C-Myc, MCTS1 and TWF1 expression in BT-474 (D) and MCF-7 (F) cells 48h after lentiviral infection for MCTS1 or TWF1 overexpression. (E and G) CCK-8 assay was performed to examine the proliferation of BT-474 (E) and MCF-7 (G) cells with or without TWF1 overexpression. (H) IF staining of MCTS1 (blue) and TWF1 (red) in BT-474 (up) and MCF-7 (down) cells. (I, J) Co-IP assay was performed to investigate the potential binding between MCTS1 (with DDDDK tag) and TWF1 (with HA tag) in BT-474 (I) and MCF-7 (J) cells. **p<0.01; ***p<0.001. (p≥0.05). Abbreviation: n.s., not significant. |
MCTS1 and TWF1 Synergistically Modulate Cyclin D1 and C-Myc Translation
By performing qRT-PCR analysis, we found that neither MCTS1 nor TWF1 had regulatory effects on CCND1 and C-MYC transcription (Figure 4A and B). Then, BT-474 cells were infected for MCTS1 (Figure 4C) or TWF1 (Figure 4D) knockdown, respectively. MCTS1 knockdown reduced TWF1 overexpression enhanced cyclin D1 and C-Myc translation, while TWF1 knockdown also impaired MCTS1 overexpression induced cyclin D1 and C-Myc translation (Figure 4E). Similar regulatory effects were also confirmed in MCF-7 cells (Figure 4F–H). These findings suggested that MCTS1 and TWF1 could synergistically modulate cyclin D1 and C-Myc translation in BT-474 and MCF-7 cells.
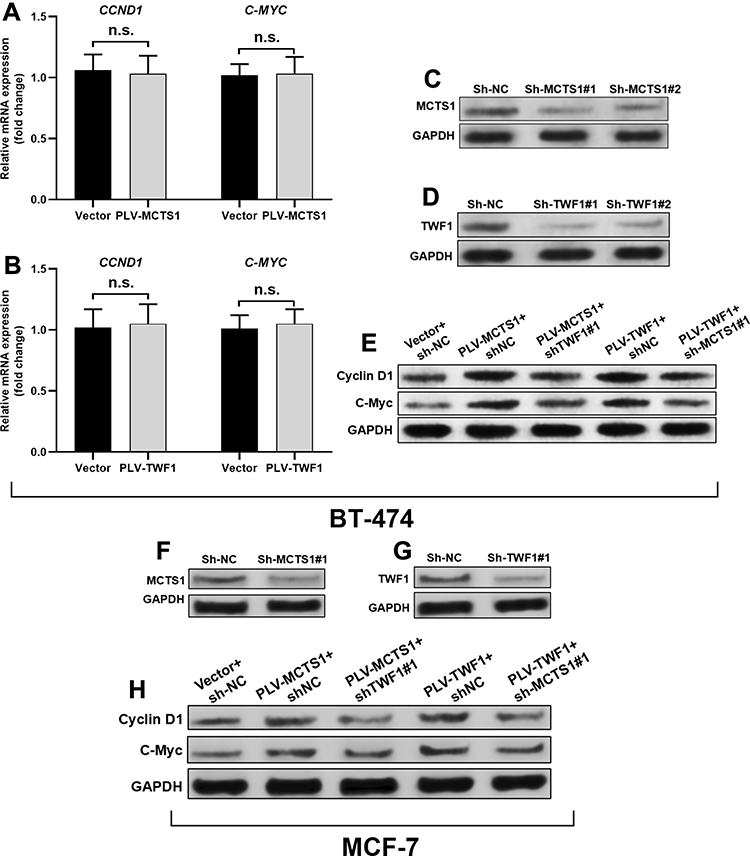 |
Figure 4 MCTS1 and TWF1 synergistically modulate cyclin D1 and C-Myc translation. (A, B) QRT-PCR analysis of CCND1 and C-MYC transcription in BT-474 cells 48h after lentivirus-mediated MCTS1 (A) or TWF1 (B) overexpression. (C, D), (F, G) Western blot analysis of MCTS1 and TWF1 expression in BT-474 (C, D) and MCF-7 (F, G) cells 48h after lentivirus-mediated MCTS1 (C and F) or TWF1 (D and G) knockdown. (E and H) Western blot analysis of cyclin D1 and C-Myc expression in BT-474 (E) and MCF-7 (H) cells 48h after lentiviral infection for MCTS1 or TWF1 overexpression alone, or in combination with simultaneous TWF1 or MCTS1 knockdown. (p≥0.05). Abbreviation: n.s., not significant. |
Discussion
Using expression data from multiple datasets with large sample sizes, we found that MCTS1 expression significantly varied among PAM50 subtypes. Besides, we also observed that the high MCTS1 expression group had significantly worse OS in luminal A and luminal B patients in both TCGA-BRCA and GSE81540. Besides, MCTS1 expression might independently predict unfavorable OS in luminal A and luminal B cases, but not in other subtypes. These findings suggest that MCTS1 expression might serve as an independent prognostic biomarker in certain PAM50 subtypes of breast cancer.
Alternative splicing has been considered an important epigenetic mechanism leading to the dysregulation and functional diversity of gene products.14 This mechanism also results in the functional divergencies of a gene among PAM50 breast cancers.15,16 However, whether this mechanism contributes to deregulated MCTS1 in breast cancer is not clear. In the current study, we analyzed MCTS1 transcript profiles in normal breast tissues and breast cancer. Interestingly, our analysis showed that ENST00000371317.9, which has 6 protein-coding exons was the dominant transcript isoform and showed a step-increase from normal, adjacent normal to breast cancer tissues. Besides, the median proportion of this isoform increased to over 90% in all PAM50 subtypes. Therefore, we inferred that this transcript was the most critical oncogenic isoform in breast cancer.
As a ribosome-binding protein that regulates the translation of multiple proteins, MCTS1 may interact with other partners for its functional roles.2,17 It interacts with the cap complex and acts as a translation enhancer that elevates the protein expression of BCL2L2, TFDP1, MRE11A, cyclin D1, and E2F1.18 It forms a heterodimer with the density regulated protein (DENR) and promotes the recruitment of aminoacetyled initiator tRNA to P site of 40S ribosomes, thereby regulating both translation initiation and re-initiation steps.2,19 In this study, we further explored other potential functional partners of MCTS1 and found a novel direct interaction between MCTS1 and TWF1. Previous studies showed that TWF1 is a regulator of cell cytoskeleton by direct interactions with actin filaments.20 Its overexpression also enhances the epithelial-to-mesenchymal transition of breast cancer cells by increasing cytoskeleton dynamics and activating mesenchymal lineage transcription factors, such as MKL1 and SRF.13 Its enhancing effects on cyclin D1 expression was also reported in bovine mammary epithelial cells.21
In the current study, we showed that similar to MCTS1, TWF1 overexpression could also enhance the expression of cyclin D1 and C-Myc proteins. Therefore, we hypothesized that there might be synergistic regulatory effects between MCTS1 and TWF1. In BT-474 cells, we demonstrated that TWF1 could enhance the translation, but not transcription of CCND1 and C-MYC, two critical driver genes in luminal A/B breast cancer.22,23 Via interrupting MCTS1 expression, CCND1 and C-MYC translation enhanced by TWF1 was impaired. TWF1 knockdown also partly canceled MCTS1-enhanced CCND1 and C-MYC translation. These findings suggested a mutually enhancing effect between MCTS1 and TWF1 on some downstream genes in common.
Conclusion
MCTS1 expression might serve as a potential prognostic biomarker of unfavorable OS in luminal A and luminal B cases. The direct interaction between MCTS1 and TWF1 might be necessary for the upregulated translation of some downstream genes in luminal A/B breast cancer cells.
Disclosure
The authors have no conflicts of interest.
References
1. Hachem A, Nandi S. The oncogene mcts1. Transl Oncogenomics. 2007;2:79–84.
2. Lomakin IB, Stolboushkina EA, Vaidya AT, et al. Crystal structure of the human ribosome in complex with DENR-MCT-1. Cell Rep. 2017;20(3):521–528. doi:10.1016/j.celrep.2017.06.025
3. Hsu HL, Shi B, Gartenhaus RB. The MCT-1 oncogene product impairs cell cycle checkpoint control and transforms human mammary epithelial cells. Oncogene. 2005;24(31):4956–4964. doi:10.1038/sj.onc.1208680
4. Chung W, Eum HH, Lee HO, et al. Single-cell RNA-seq enables comprehensive tumour and immune cell profiling in primary breast cancer. Nat Commun. 2017;8:15081. doi:10.1038/ncomms15081
5. Pu M, Messer K, Davies SR, et al. Research-based PAM50 signature and long-term breast cancer survival. Breast Cancer Res Treat. 2020;179(1):197–206.
6. Levenson AS, Thurn KE, Simons LA, et al. MCT-1 oncogene contributes to increased in vivo tumorigenicity of MCF7 cells by promotion of angiogenesis and inhibition of apoptosis. Cancer Res. 2005;65(23):10651–10656. doi:10.1158/0008-5472.CAN-05-0845
7. Wu MH, Chen YA, Chen HH, et al. MCT-1 expression and PTEN deficiency synergistically promote neoplastic multinucleation through the Src/p190B signaling activation. Oncogene. 2014;33(43):5109–5120. doi:10.1038/onc.2014.125
8. Weng YS, Tseng HY, Chen YA, et al. MCT-1/miR-34a/IL-6/IL-6R signaling axis promotes EMT progression, cancer stemness and M2 macrophage polarization in triple-negative breast cancer. Mol Cancer. 2019;18(1):42. doi:10.1186/s12943-019-0988-0
9. Jezequel P, Frenel JS, Campion L, et al. bc-GenExMiner 3.0: new mining module computes breast cancer gene expression correlation analyses. Database (Oxford). 2013;2013:bas060. doi:10.1093/database/bas060
10. Saal LH, Vallon-Christersson J, Hakkinen J, et al. The Sweden Cancerome Analysis Network - Breast (SCAN-B) initiative: a large-scale multicenter infrastructure towards implementation of breast cancer genomic analyses in the clinical routine. Genome Med. 2015;7(1):20. doi:10.1186/s13073-015-0131-9
11. Consortium GT. The Genotype-Tissue Expression (GTEx) project. Nat Genet. 2013;45(6):580–585. doi:10.1038/ng.2653
12. Warde-Farley D, Donaldson SL, Comesx O, et al. The GeneMANIA prediction server: biological network integration for gene prioritization and predicting gene function. Nucleic Acids Res. 2010;38(suppl_2):W214–W220. doi:10.1093/nar/gkq537
13. Samaeekia R, Adorno-Cruz V, Bockhorn J, et al. miR-206 inhibits stemness and metastasis of breast cancer by targeting MKL1/IL11 pathway. Clin Cancer Res. 2017;23(4):1091–1103. doi:10.1158/1078-0432.CCR-16-0943
14. Li J, Choi PS, Chaffer CL, et al. An alternative splicing switch in FLNB promotes the mesenchymal cell state in human breast cancer. Elife. 2018;7. doi:10.7554/eLife.37184
15. Singh R, Gupta SC, Peng WX, et al. Regulation of alternative splicing of Bcl-x by BC200 contributes to breast cancer pathogenesis. Cell Death Dis. 2016;7(6):e2262. doi:10.1038/cddis.2016.168
16. Gracio F, Burford B, Gazinska P, et al. Splicing imbalances in basal-like breast cancer underpin perturbation of cell surface and oncogenic pathways and are associated with patients’ survival. Sci Rep. 2017;7:40177. doi:10.1038/srep40177
17. Ahmed YL, Schleich S, Bohlen J, et al. DENR-MCTS1 heterodimerization and tRNA recruitment are required for translation reinitiation. PLoS Biol. 2018;16(6):e2005160. doi:10.1371/journal.pbio.2005160
18. Reinert LS, Shi B, Nandi S, et al. MCT-1 protein interacts with the cap complex and modulates messenger RNA translational profiles. Cancer Res. 2006;66(18):8994–9001. doi:10.1158/0008-5472.CAN-06-1999
19. Weisser M, Schafer T, Leibundgut M, Bohringer D, Aylett CHS, Ban N. Structural and functional insights into human re-initiation complexes. Mol Cell. 2017;67(3):447–456 e447. doi:10.1016/j.molcel.2017.06.032
20. Paavilainen VO, Hellman M, Helfer E, et al. Structural basis and evolutionary origin of actin filament capping by twinfilin. Proc Natl Acad Sci U S A. 2007;104(9):3113–3118. doi:10.1073/pnas.0608725104
21. Li L, Liu L, Qu B, Li X, Gao X, Zhang M. Twinfilin 1 enhances milk bio-synthesis and proliferation of bovine mammary epithelial cells via the mTOR signaling pathway. Biochem Biophys Res Commun. 2017;492(3):289–294. doi:10.1016/j.bbrc.2017.08.130
22. Verbeke S, Richard E, Monceau E, et al. Humanization of the mouse mammary gland by replacement of the luminal layer with genetically engineered preneoplastic human cells. Breast Cancer Res. 2014;16(6):504. doi:10.1186/s13058-014-0504-9
23. Jackson HW, Fischer JR, Zanotelli VRT, et al. The single-cell pathology landscape of breast cancer. Nature. 2020;578(7796):615–620. doi:10.1038/s41586-019-1876-x
 © 2020 The Author(s). This work is published and licensed by Dove Medical Press Limited. The
full terms of this license are available at https://www.dovepress.com/terms
and incorporate the Creative Commons Attribution
- Non Commercial (unported, 3.0) License.
By accessing the work you hereby accept the Terms. Non-commercial uses of the work are permitted
without any further permission from Dove Medical Press Limited, provided the work is properly
attributed. For permission for commercial use of this work, please see paragraphs 4.2 and 5 of our Terms.
© 2020 The Author(s). This work is published and licensed by Dove Medical Press Limited. The
full terms of this license are available at https://www.dovepress.com/terms
and incorporate the Creative Commons Attribution
- Non Commercial (unported, 3.0) License.
By accessing the work you hereby accept the Terms. Non-commercial uses of the work are permitted
without any further permission from Dove Medical Press Limited, provided the work is properly
attributed. For permission for commercial use of this work, please see paragraphs 4.2 and 5 of our Terms.