Back to Journals » OncoTargets and Therapy » Volume 17
MCM5 is a Novel Therapeutic Target for Glioblastoma
Authors Zhou J, Zheng H, Zhang H, Yu W, Li B, Ye L ![]() , Wang L
, Wang L
Received 18 March 2024
Accepted for publication 8 May 2024
Published 13 May 2024 Volume 2024:17 Pages 371—381
DOI https://doi.org/10.2147/OTT.S457600
Checked for plagiarism Yes
Review by Single anonymous peer review
Peer reviewer comments 3
Editor who approved publication: Dr Tohru Yamada
Jian Zhou,1,2,* Housheng Zheng,1,* Huiru Zhang,1 Wenqiang Yu,1 Baoer Li,1 Liang Ye,1 Lu Wang1
1Hyperbaric Oxygen Department, International Cancer Center, Shenzhen University General Hospital, Shenzhen University Medical School, Shenzhen, 518055, People’s Republic of China; 2Guangdong Key Laboratory for Biomedical Measurements and Ultrasound Imaging, National-Regional Key Technology Engineering Laboratory for Medical Ultrasound, School of Biomedical Engineering, Shenzhen University Medical School, Shenzhen, 518060, People’s Republic of China
*These authors contributed equally to this work
Correspondence: Lu Wang, Hyperbaric oxygen department, Shenzhen University General Hospital, Shenzhen University Medical School, Shenzhen, 518055, People’s Republic of China, Tel +86-0755-21839715, Email [email protected] Liang Ye, International Cancer Center, Shenzhen University Medical School, Shenzhen, 518055, People’s Republic of China, Tel +86-0755-26631420, Fax +86-0755-86671943, Email [email protected]
Objective: MCM5 is a DNA licensing factor involved in cell proliferation and has been previously established as an excellent biomarker in a number of malignancies. Nevertheless, the role of MCM5 in GBM has not been fully clarified. The present study aimed to investigate the potential roles of MCM5 in the treatment of GBM and to elucidate its underlying mechanism, which is beneficial for developing new therapeutic strategies and predicting prognosis.
Methods: Firstly, we obtained transcriptomic and proteomic data from the TCGA and CPTAC databases on glioma patients. Employing the DeSeq2 R package, we then identified genes with joint differential expression in GBM tissues subjected to chemotherapy. To develop a prognostic risk score model, we performed univariate and multivariate Cox regression analyses. In vitro knockdown and overexpression of MCM5 were used to further investigate the biological functions of GBM cells. Additionally, we also delved into the upstream regulation of MCM5, revealing associations with several transcription factors. Finally, we investigated differences in immune cell infiltration and drug sensitivity across diverse risk groups identified in the prognostic risk model.
Results: In this study, the chemotherapy-treated GBM samples exhibited consistent alterations in 46 upregulated and 94 downregulated genes at both the mRNA and protein levels. Notably, MCM5 emerged as a gene with prognostic significance as well as potential therapeutic relevance. In vitro experiments subsequently validated the role of increased MCM5 expression in promoting GBM cell proliferation and resistance to TMZ. Correlations with transcription factors such as CREB1, CTCF, NFYB, NRF1, PBX1, TEAD1, and USF1 were discovered during upstream regulatory analysis, enriching our understanding of MCM5 regulatory mechanisms. The study additionally delves into immune cell infiltration and drug sensitivity, providing valuable insights for personalized treatment approaches.
Conclusion: This study identifies MCM5 as a key player in GBM, demonstrating its prognostic significance and potential therapeutic relevance by elucidating its role in promoting cell proliferation and resistance to chemotherapy.
Keywords: glioblastoma, minichromosome maintenance protein 5, chemotherapeutic drug resistance
Introduction
Gliomas are categorized into four grades (Grade I, II, III, and IV) based on their malignant nature in pathologic diagnosis, with glioblastoma multiforme (GBM) identified as Grade IV gliomas. Complete surgical removal of the invasive GBM parenchyma is often unattainable due to the tumor’s rapid growth and infiltration into normal brain tissue.1–3 Consequently, chemotherapy plays a crucial role in GBM treatment. Temozolomide (TMZ) is considered a critical chemotherapeutic agent for GBM, exerting its cytotoxic effects through DNA methylation at the N7 and O6 positions of guanine. The drug targets nucleic acids, proteins, and peptide nucleophilic regions within tumor cells, impacting various stages of cell division.4 Its primary objective is to eliminate rapidly proliferating cells, alter the growth and division patterns of cancer cells, and potentially induce apoptosis.5,6 Despite its widespread use, GBM carries a bleak prognosis and demonstrates notable resistance to treatment.7
Previous studies have demonstrated that drug resistance mechanisms predominantly involve non-coding RNA,8,9 DNA damage repair mechanisms,10,11 aberrations in signaling pathways,11 the tumor microenvironment,12,13 the glioma stem cell theory,12 tumor cell autophagy,14 and other associated factors. Ultimately, GBM frequently develops drug resistance through these molecular mechanisms concurrently, resulting in accelerated proliferation of tumor cells during the advanced stages of treatment.4 Hence, it is imperative to comprehend the molecular mechanisms underlying the accelerated proliferation of tumors following drug resistance.
This study utilized proteomic analysis from the Clinical Proteomic Tumor Analysis Consortium (CPTAC) database in conjunction with transcriptomic analysis from the Cancer Genome Atlas (TCGA) database to examine alterations in GBM expression profiles. Our results indicate that increased levels of Mini chromosome Maintenance Protein 5 (MCM5) are correlated with chemotherapy resistance in patients with GBM. The MCM5 gene encodes a protein that functions as a constituent of the MCM2-7 complex, known as the MCM complex, which serves as the replicative helicase necessary for the initiation and elongation of DNA replication in eukaryotic cells.15 It is a critical component of the CDC45-MCM-GINS helicase, a molecular apparatus responsible for unwinding template DNA during replication and serving as the foundation for the replisome.16–18 Previous studies have found that MCM5 plays important roles in the progression of various cancers, including liver, lung, bladder, and colon cancers et al19–23 Meanwhile, Jiang et al previously reported that the ubiquitination and degradation of MCM5 protein might impede the repair of DNA damage caused by cisplatin.21 However, thus far, the expression, function and potential mechanisms of MCM5 in GBM chemotherapy resistance are still unclear. The current study aimed to investigate the involvement of MCM5 and its associated mechanisms in conferring chemotherapy resistance in GBM, potentially identifying a promising therapeutic target for the treatment of this disease.
Methods and Materials
Data Collection
The transcriptome data and clinical information for GBM were obtained from the Cancer Genome Atlas (TCGA) Data Portal (https://tcga-data.nci.nih.gov/tcga/). In the TCGA cohort, transcriptome data and clinical details were collected from 594 GBM patients and 5 normal individuals. For proteomic data and clinical information related to GBM, the source was the Clinical Proteomic Tumor Analysis Consortium (CPTAC) (https://proteomics.cancer.gov/programs/cptac) (S047 S048). This dataset comprised a total of 302 tissues, including 10 normal brain tissues and 292 GBM tissues. Within the GBM patient group, 144 individuals did not undergo chemotherapy, while 48 received chemotherapy. Additionally, the chemotherapy status of the remaining 100 GBM patients was not recorded, exclusively utilized for the analysis of differences compared to normal brain tissue. All data in this study were collected from public databases (TCGA and CPTAC), and approved by the medical ethics committee of Shenzhen University School of Medicine.
Chemotherapy-Related Genes with Prognostic Values Were Screened
Differential gene expression analyses were conducted between GBM tissues (n = 594) and normal brain tissues (n = 5) utilizing the DeSeq2 R package (v1.22.0). Subsequent differential protein expression analyses included comparisons between GBM tissues (n = 100) and normal brain tissues (n = 10), as well as between GBM patients with chemotherapy (n = 48) and those without chemotherapy (n = 144), all performed with the DeSeq2 R package (v1.22.0). Criteria for identifying differential genes included a logFC > 2 and P < 0.05. Univariate and multivariate Cox regression analyses were used to screen independent prognostic factors for GBM. The predictive accuracy of 1,3,5 year was determined by receiver operating characteristic (ROC) curve analysis using the area under the ROC curve (AUC).
Cell Culture and Cell Lentiviral Transduction
The human glioma cell lines, U87 and U251, were procured from Procell Life Sciences & Technology Co. Ltd (Wuhan, Hubei, China). These cells were cultured in Dulbecco modified Eagle medium (DMEM) supplemented with 10% fetal bovine serum (FBS) obtained from Gibco (CA, USA). The cell cultures were maintained at 37 °C in 5% CO2-humidified air incubators provided by Thermo Fisher Scientific (Waltham, MA, USA). To knock down MCM5 expression, lentiviral short hairpin RNAs (shRNAs) were employed. These shRNAs were constructed by inserting the respective shRNA sequences into the pHBLV-U6-MCS-CMV-ZsGreen-PGK-PURO vector, sourced from Hanbio (Shanghai, China). The specific shRNA sequence used for MCM5 knockdown is as follows: GAAACTGAAGAACCGCTACAT. For stable overexpression of MCM5, the MCM5 sequences were cloned into the pHBLV-CMV-MCS-3FLAG-EF1-ZsGreen-T2A-PURO vector. Lentiviral transfection experiments were conducted following the manufacturer’s instructions, and stable transfected cells were selected using puromycin for a period of 2 weeks.
Protein Extraction and Western Blotting Analysis
Total protein extraction was performed using a radioimmunoprecipitation assay (RIPA) buffer obtained from Beyotime Biotechnology (Shanghai, China). After quantification of the extracted proteins, 30 μg of total protein was separated using 10–12% SDS-PAGE gels and subsequently electrophoretically transferred onto either a 0.2μm or 0.45μm PVDF membrane sourced from Millipore Sigma (Burlington, MA, USA). The membranes were then blocked with 5% fat-free milk for 1 hour at room temperature, followed by overnight incubation at 4°C with primary antibodies acquired from Abcam (Cambridge, MA, USA): MCM5 (ab75975, 1:500) and Actin (ab115777, 1:2000). Appropriate secondary antibodies (Cell Signaling Technology, Dallas, TX, USA) were incubated with the membranes for 2 hours at room temperature. Subsequently, the protein bands were visualized using chemiluminescence and quantified using ImageJ software from Media Cybernetics (Silver Springs, MD, USA).
TMZ Chemosensitivity and Flow Cytometry Analysis
After stable transfection, exponentially growing GBM cells were seeded into 96-well plates overnight. Then, the medium was changed with different concentrations of TMZ (25, 50, 100, 200, 400, 800 μg/mL), and the sensitivities of GBM cells to TMZ were evaluated by IC50 values using the Cell Counting Kit-8 (CCK-8) (Dojindo, Japan). GBM cells after stable transfection were treated with 200 μg/mL TMZ for 48 h, and then apoptotic cells were assessed using the FITC Annexin-V Apoptosis Detection Kit (BD Biosciences, Franklin Lakes, NJ, USA) following the manufacturer’s recommendations. In brief, GBM cells were isolated and incubated with 300 μL of binding buffer containing 5 μL Annexin V-FITC for 10 min in darkness. Then, 5 μL of PI solution was added and incubated under dark conditions for 5 min. Cells were immediately analyzed by BD FACS Calibur (BD Biosciences, MA, USA). Based on the staining fluorescence, viable cells (FITC−PI−), early apoptotic cells (FITC+ PI−), and late apoptotic or necrotic cells (FITC+ PI+) were identified.
Cell Viability and Cell Cloning Assays
Cell viability was also assessed at different times (24, 48, 72, 96, and 120 h) using a CCK-8 kit according to manufacturer instructions. The ability of GBM cells to proliferate after different treatments was determined by a colony formation assay. In brief, GBM cells were seeded in six-well plates at a density of 300 cells/well and were treated with 25 μg/mL TMZ. After 14 days, the colonies were fixed with glutaraldehyde (6.0% v/v), stained with crystal violet (0.5% w/v), and counted using a stereomicroscope.
Statistical Analysis
We performed statistical analysis using SPSS 21.0 software (SPSS Inc., Chicago, IL, USA). Data are expressed as the mean ± standard deviation (SD). To assess differences between two or more groups, we employed an unpaired Student’s t-test or v2-test and a one-way analysis of variance, respectively. Tukey’s multiple comparison test was applied when necessary. Each experiment was conducted with a minimum of three biological replicates, and statistical significance was defined as p-levels < 0.05.
Results
Differential Chemotherapy-Related Gene Expression in GBM Patient Samples
To identify genes exhibiting consistent changes at both the mRNA and protein levels in GBM compared to normal brain tissue, a comprehensive analysis was conducted. Transcriptome and clinical data were obtained from the TCGA database, while proteome and clinical data were sourced from the CPTAC database. Differential expression mRNA analysis in GBM and normal brain tissue was performed using the DeSeq2 R package based on the TCGA database, revealing 6016 mRNAs with significant changes (Figure 1a, Table S1). Simultaneously, differential protein expression analysis was conducted using the DeSeq2 R package based on the CPTAC database, uncovering 3812 proteins with significant changes (Figure 1b, Table S2). To explore the impact of chemotherapy on proteins expression, a differential gene expression analysis was performed by comparing patients receiving chemotherapy against those without chemotherapy controls based on the CPTAC database, identifying 1415 significantly differentially expressed proteins (Figure 1c, Table S3).
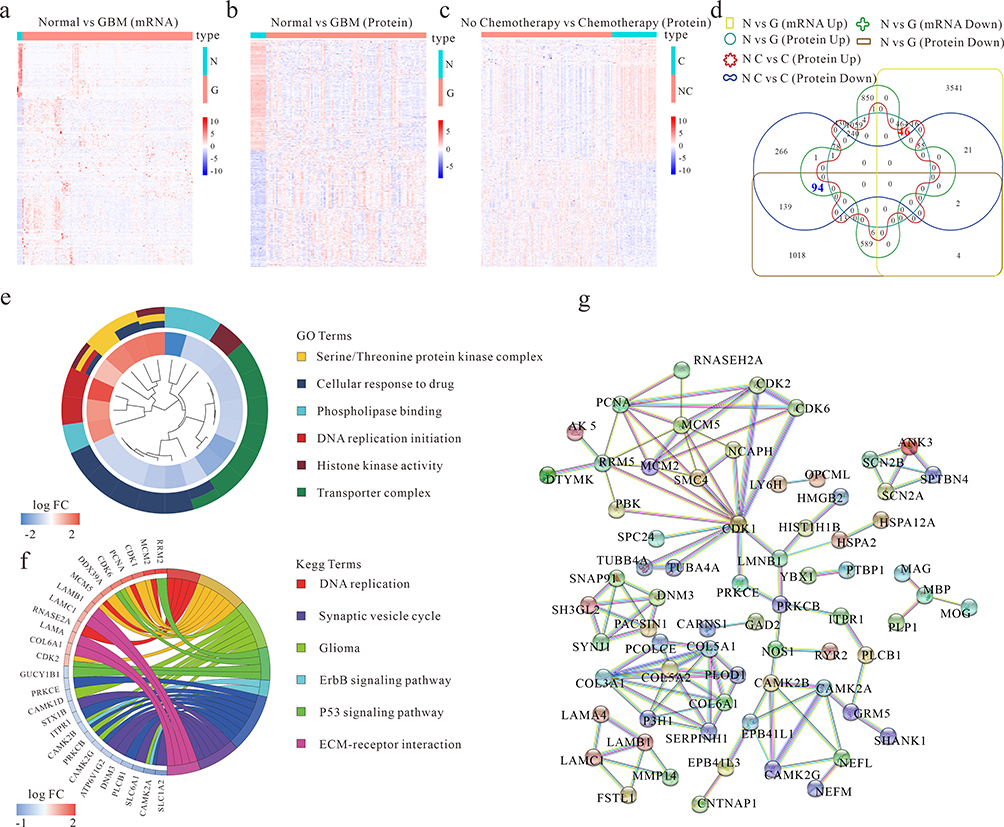 |
Figure 1 Differential chemotherapy-related gene expression in GBM patient samples. (a) Differential expression mRNA analysis of GBM and normal brain tissue (Normal) based on the TCGA database. (b) Differential expression protein analysis of GBM and normal brain tissue (Normal) based on CPTAC database. (c) Differential expression protein analysis of chemotherapy and non-chemotherapy GBM Patients based on the CPTAC database. (d) The Venn chart of the differential gene among figures (a-c). Normal (N), GBM (G), chemotherapy (C) and non-chemotherapy (NC). (e and f) GO and KEGG pathway analysis of the differentially chemotherapy-related genes. (g) Presentation of known interactions between differentially chemotherapy-related genes using String. |
To pinpoint the intersection of genes consistently altered at both the mRNA and protein levels between patients with and without chemotherapy and normal brain tissues, a Venn diagram was constructed. The overlapping gene set from Figures 1a-c revealed 46 upregulated and 94 downregulated genes (Figure 1d). Subsequent pathway enrichment analysis of these 140 annotated genes identified significant associations with cellular response to drug, DNA replication initiation, serine/threonine protein kinase complex, transporter complex, phospholipase binding, histone kinase activity, DNA replication, cell cycle, p53 signaling pathway, ErbB signaling pathway, ECM-receptor interaction, synaptic vesicle cycle, and glioma (Figure 1e-f). The interaction between these differential chemotherapy-related genes was further evaluated using the STRING database (https://string-db.org/) (Figure 1g). This integrative approach provides a comprehensive understanding of genes consistently altered at both the mRNA and protein levels in GBM, shedding light on potential pathways and interactions implicated in the disease and its response to chemotherapy.
Identification of Chemotherapy-Related Genes with Prognostic Value in the GBM
In our pursuit of potential therapeutic targets with clinical relevance, we conducted screening of chemotherapy-related genes through both univariate and multivariate analyses. The forest map displays 21 prognostic chemotherapy-related genes (Figure 2a). Further independent prognostic prediction analysis highlighted MCM5 as having an independent prognostic value for GBM patients (Figure 2b). For 1-, 3-, and 5-year survival, the area under the curve (AUC) of ROC curves was 0.861, 0.875, 0.619, and 0.826, respectively (Figure 2c). Kaplan-Meier survival analysis of the CPTAC glioma dataset underscored that elevated MCM5 expression is associated with poor patient prognosis (Figure 2d). Subsequent analysis revealed a positive correlation between MCM5 protein levels and glioma grade, indicating an increase in MCM5 expression with higher glioma grades (Figure 2e). Additionally, MCM5 exhibited high expression in GBM cases subjected to radiation and chemotherapy (Figure 2f and g). In summary, these findings strongly suggest that heightened MCM5 expression can serve as a predictive marker for poor prognosis in GBM patients, emphasizing its potential as a therapeutic target with clinical significance.
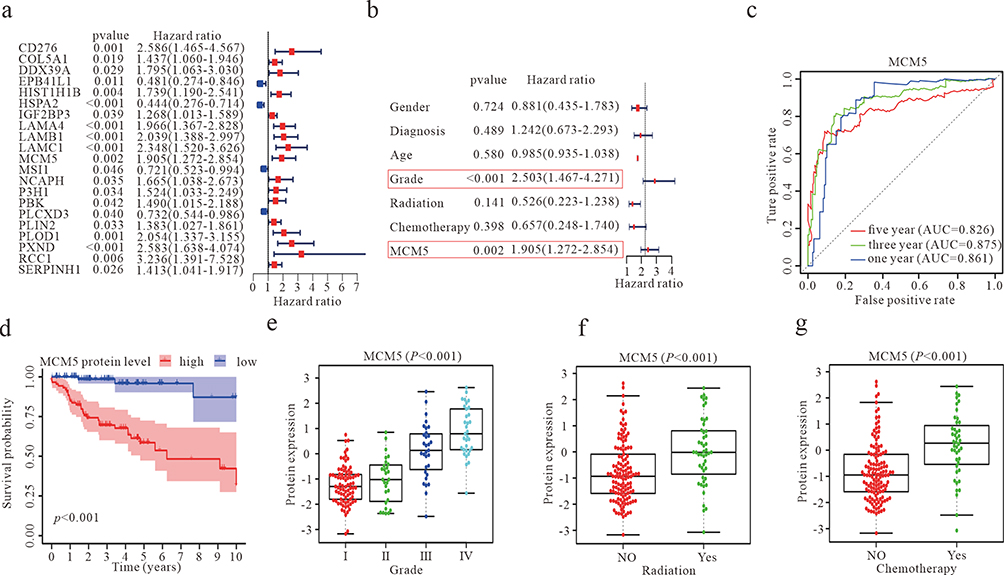 |
Figure 2 Identification of chemotherapy-related genes with prognostic value in the GBM. (a) A forest plot showing the results of a multivariate COX regression model for identifying potential risk factors for GBM. (b) Forest plots for the relationships of abnormal MCM5 protein expression with clinicopathological characteristics and the prognosis of patients with GBM. (c) ROC curve analysis according to the 1, 3, and 5-year survival of the area under the AUC value. P<0.05 (d) Kaplan-Meier survival curve analysis based on the CPTAC database suggested the prognosis of GBM patients with higher or lower MCM5 levels. (e) Expression of MCM5 protein levels in different grades of gliomas. (f) Expression of MCM5 protein level between radiation and non-radiation GBM patients. (g) Expression of MCM5 protein level between chemotherapy and non-chemotherapy GBM patients. |
Effect of MCM5 on GBM Cell Apoptosis, Proliferation, and Temozolomide Sensitivity
In the initial phase, we conducted lentiviral knockdown or overexpression of MCM5, and the transfection efficiency was verified by Western blot analysis (Figure 3a and e). To assess the impact of MCM5 on glioma cell sensitivity to temozolomide and apoptosis, we carried out CCK-8 assays and flow cytometry experiments. The results indicated that MCM5 knockdown heightened temozolomide sensitivity (Figure 3b) and promoted cell apoptosis (Figure 3c and d). Conversely, MCM5 overexpression inhibited temozolomide sensitivity (Figure 3f) and reduced cell apoptosis (Figure 3g and h). Further insights from clone formation and CCK-8 proliferation experiments revealed that the clone formation rate and cell proliferation rate were lower in MCM5 knockdown groups compared to control groups. In contrast, MCM5 overexpression groups induced the opposite effects (Figure 3i-l). These results collectively demonstrate the critical role of MCM5 in modulating proliferation, temozolomide sensitivity, and apoptosis in glioma cells.
 |
Figure 3 Effect of MCM5 on GBM cell apoptosis, proliferation, and chemosensitivity. (a) Detection of the expression of MCM5 in U87 and U251 cells after MCM5 knockdown transfection (sh-MCM5), compared to control group transfection (sh-NC) by WB. (b) The IC50 detected by the CCK8 assay in U87 and U251 cells after sh-MCM5, compared to sh-NC. ** p < 0.01. (c) The ratio of total apoptosis was examined by flow cytometry in U87 and U251 cells after sh-MCM5, compared to sh-NC. (d) The statistical figure of apoptotic activity in U87 and U251 cells after sh-MCM5, compared to sh-NC. *** p < 0.001. (e) Detection of the expression of MCM5 after MCM5 overexpression transfection (lv-MCM5), compared to control group transfection (lv-NC) by WB. (f) The IC50 detected by the CCK8 assay in U87 and U251 cells after lv-MCM5, compared to lv-NC. * p < 0.05, ** p < 0.01. (g) The ratio of total apoptosis was examined by flow cytometry in U87 and U251 cells after lv-MCM5, compared to lv-NC. (h) The statistical figure of apoptotic activity in U87 and U251 cells after lv-MCM5, compared to lv-NC. *** p < 0.001. (I and j) CCK8 assays were used to evaluate U87 and U251 cell proliferation after sh-MCM5 or lv-MCM5, compared to sh-NC or lv-NC, respectively. * p < 0.05, ** p < 0.01, *** p < 0.001. (k and l) Cell clone formation assay was used to evaluate U251 cell clone formation ability after sh-MCM5 or lv-MCM5, compared to sh-NC or lv-NC, respectively. * p < 0.05. |
The MCM5 Upstream Regulator Analysis Identifies the Upstream Transcriptional Regulators
Transcription factors play a pivotal role in the regulation of gene expression. Utilizing the UCSC Genome Browser (https://genome.ucsc.edu/), we predicted sequences in the promoter region of MCM5. Subsequently, the DAVID website (http://david.abcc.ncifcrf.gov/) was employed to predict potential transcription factors for MCM5. To further investigate, we analyzed the expression correlation between MCM5 and the predicted transcription factors in GBM tissue samples based on the CPTAC database. The results revealed a positive correlation between MCM5 and several transcription factors, including CREB1, CTCF, NFYB, NRF1, PBX1, TEAD1, and USF1 (Figure 4a). To gain insights into the transcription factor binding motif for MCM5, we generated motifs using WebLogo (http://weblogo.berkeley.edu) (Figure 4b-h). These findings collectively suggest that the regulation of MCM5 expression may be influenced by additional transcription factors. The logical progression from sequence prediction to correlation analysis and motif generation strengthens our understanding of the potential regulatory network governing MCM5 expression in GBM.
 |
Figure 4 The MCM5 upstream regulator analytic identifies the upstream transcriptional regulators. (a) Correlation analysis of gene expression between MCM5 and transcription factors based on the CPTAC database. (b-h) Transcription factors binding to the MCM5 promoter Motif were predicted by using the WebLogo tool (Crooks et al 2004) available at http://weblogo.berkeley.edu. |
GBM-Infiltrating Immune Cells Were Estimated in Different Risk Groups
We extended our investigation to explore the role of immune cell infiltration in tumor growth. Utilizing the previously identified 21 prognostic chemotherapy-related genes (Figure 2a), we developed a prognostic risk score model, categorizing patients into high-risk and low-risk groups based on the median of the risk score. Subsequently, we assessed immune cell infiltration using XCELL, TIMER, QUANTISEQ, MCPCOUNTER, and EPIC software. Among the immune cell types analyzed, including T cell CD4+ Th2 (XCELL), T cell CD8+ (TIMER), T cell CD4+ (non-regulatory), Tregs (T cell regulatory), and uncharacterized cell populations (QUANTISEQ and EPIC), positive correlations with the risk score were evident. Conversely, the remaining cell types displayed negative correlations (Figure 5a). These findings underscore the potential significance of immune cells in tumor growth and provide valuable insights for further research into the complex interplay between chemotherapy-related genes and the tumor microenvironment in GBM.
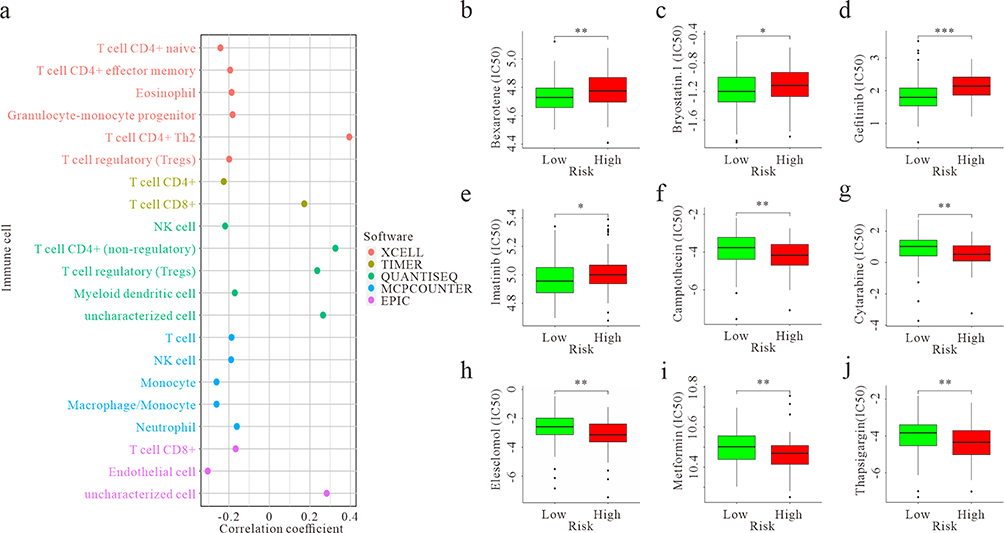 |
Figure 5 GBM-infiltrating immune cells and chemosensitivity were estimated using a risk assessment model. (a) Predictive maps of GBM-infiltrating immune cells using XCELL, TIMER, QUANTISEQ, MCPCOUNTER, and EPIC software based on the TCGA database. p < 0.05. (b-e) The model acted as a potential predictor for chemosensitivity, as high-risk scores were related to a higher IC50 for chemotherapeutics. * p < 0.05, ** p < 0.01, *** p < 0.001. (f-j) The model acted as a potential predictor for chemosensitivity, as high-risk scores were related to a lower IC50 for chemotherapeutics. ** p < 0.01. |
Chemosensitivity Was Estimated in Different Risk Groups
We further investigated differences in drug sensitivity between the high- and low-risk groups by analyzing the IC50 of chemotherapeutic agents. The results revealed significant differences in drug sensitivities between the high- and low-risk groups. Patients in the low-risk group exhibited greater sensitivity to Bexarotene, Bryostatin.1, Gefitinib, and Imatinib (Figure 5b-e). Conversely, patients in the high-risk group demonstrated higher sensitivity to Camptothecin, Cytarabine, Elesclomol, Metformin, and Thapsigargin (Figure 5f-j). In summary, these findings underscore the potential pivotal role of immune cells in tumors and emphasize the importance of identifying drug sensitivities in tumors with different risk profiles. This knowledge is crucial for tailoring individualized therapies in the realm of cancer treatment.
Discussion
The drug resistance observed in GBM is a complex phenomenon influenced by various factors, including tumor stem cells, the microenvironment, cellular stress responses to chemotherapy, drug penetration into tumor tissues, and resistance mediated by DNA damage repair pathways.7 Conventional single transcriptome or proteomics analyses have limitations in fully capturing the changes in gene expression related to GBM resistance.24,25 To address this, our study systematically investigated chemotherapy-related gene expression differences in GBM patients by synthesizing transcriptomic and proteomic data from the TCGA and CPTAC databases.
Our findings revealed consistent changes at both mRNA and protein levels, particularly in biological processes related to key pathways such as cell response to drugs, DNA replication, and the cell cycle. Notably, MCM5 emerged as a gene with independent prognostic value, showing a significant correlation between its high expression and poor prognosis in GBM patients. The positive correlation of MCM5 expression with clinical survival and tumor grade underscored its crucial role in GBM.
MCM5, a member of the MCM family of chromatin-binding proteins, is implicated in cell cycle regulation and is upregulated during the transition from G0 to G1/S phase.26,27 Given the commonality of abnormal cell cycle regulation in tumors, targeting MCM5 function holds promise as a potential strategy to inhibit the excessive proliferation of tumor cells.20,21,23,28–30 Importantly, we first reported that MCM5 promotes glioma cell U87 and U251 proliferation and resistance to TMZ, aligning with previous research indicating its role in cisplatin resistance in head and neck squamous cell carcinoma. However, further studies with the incorporation of more cell lines are necessary to confirm this scenario. In recent years, patient-derived xenograft (PDX) models have garnered significant attention in research due to their capacity to maintain the microenvironment and histological features of primary tumors, including colon cancer, stomach cancer, and esophageal cancer.31–34 In contrast to cancer cell lines, PDX models accurately represent the heterogeneity of tumors at both inter- and intra-tumoral levels.34 Consequently, utilizing the PDX model is deemed more robust for investigating the involvement of MCM5 in GBM chemotherapy resistance.
Through upstream regulatory analysis, we identified several transcription factors positively correlated with MCM5 expression, including CREB1,35 CTCF,36 and NFYB,37 suggesting a complex regulatory network influencing MCM5 expression. NFYB plays an important role in drug resistance, especially in oxaliplatin-resistant colon cancer. It promotes oxaliplatin resistance by upregulating the expression of E2F1, thereby inhibiting apoptosis through Sirt1-dependent deacetylation. Furthermore, the NFYB-E2F1 axis upregulated the expression of CHK1, which is a key factor in inhibiting oxaliplatin-induced apoptosis and maintaining tumor formation in OR-CRC cells. Knockdown of E2F1 reduced the expression of Pol κ, which is required for CHK1 activation, thereby making OR-CRC cells more sensitive to oxaliplatin.37 At the same time, CTCF also plays a role in regulating drug resistance, while CREB1 is closely related to sensitivity to chemotherapy drugs.38–40 These findings reveal the complexity of MCM5 expression being regulated by multiple transcription factors and provide important clues for further studying the drug resistance mechanisms of tumors and developing targeted treatment strategies.
Immune checkpoint inhibitors represent a widely utilized and highly effective form of immunotherapy for combating tumors.41–43 Alongside these inhibitors, alternative immunotherapies like CAR T-cell therapy and oncolytic virus therapy have gained FDA approval.44,45 While TMZ-induced lymphopenia has shown promise in augmenting antitumor vaccination efforts by triggering passive immune responses, it’s crucial to acknowledge the associated risks.46,47 Lymphopenic conditions, notably in GBM patients, have been associated with compromised immune surveillance and heightened susceptibility to opportunistic infections.48 Additionally, lymphopenia can hinder active anti-tumor immune responses by depleting both T and NK cells. This depletion stems from the reduced activity of O6-methylguanine-DNA-methyltransferase (MGMT), a DNA repair enzyme, induced by TMZ.49,50 The present study utilized a set of 21 prognostic genes associated with chemotherapy to develop a risk assessment model, categorizing patients into high- and low-risk cohorts according to their respective risk scores. Subsequently, XCELL, TIMER, QUANTISEQ, MCPCOUNTER, and EPIC software tools were employed to assess immune cell infiltration in patients from high- and low-risk groups, offering valuable insights for tailoring immune-based therapeutic strategies in the context of chemotherapy for patients with varying risk profiles. While the role of MCM5 in regulating immune cells has not been reported, studies indicate its importance in the transcription activation of Stat1 target genes, raising the possibility of its involvement in tumor immune escape and potential implications for immunotherapy responses. These implied that MCM5 is a target of immunotherapy. Finally, our analysis of drug sensitivity within the high-risk group revealed an elevated sensitivity to specific chemotherapy drugs, offering important insights for tailored therapeutic strategies.
Conclusions
In summary, our study sheds light on the pivotal role of MCM5 in GBM, unveiling its significance as a prognostic marker and potential therapeutic target. Through exploration, we unraveled its involvement in fostering cell proliferation and conferring resistance to chemotherapy in GBM. The revelation of intricate upstream regulatory factors, coupled with a comprehensive examination of immune cell infiltration and drug sensitivity, enriches our understanding. Altogether, these findings intricately position MCM5 as a promising and nuanced therapeutic avenue for tailoring personalized treatment strategies in the complex landscape of GBM.
Data Sharing Statement
Data will be available upon request.
Ethics and Consent Statement
All data in this study were obtained from the TCGA and CPTAC databases, and were approved by the medical ethics committee of Shenzhen University School of Medicine (approved no. PN-202300147).
Acknowledgment
This study was supported by the National Natural Science Foundation of China (82303593), the Natural Science Foundation of Guangdong Province (2022A1515111162), the China Postdoctoral Science Foundation (2023M742396), the Shenzhen Medical Research Found (SMRF, A2303015). Pearl River Talent Project of Guangdong Province (2021QN02Y426), and Shenzhen Peacock Plan Project (827/000655).
Author Contributions
All authors made a significant contribution to the work reported, whether that is in the conception, study design, execution, acquisition of data, analysis and interpretation, or in all these areas; took part in drafting, revising or critically reviewing the article; gave final approval of the version to be published; have agreed on the journal to which the article has been submitted; and agree to be accountable for all aspects of the work.
Disclosure
The authors declare that there is no conflict of interest in this work.
References
1. Alifieris C, Trafalis DT. Glioblastoma multiforme: pathogenesis and treatment. Pharmacol Ther. 2015;152:63–82. doi:10.1016/j.pharmthera.2015.05.005
2. Omuro A, DeAngelis LM. Glioblastoma and other malignant gliomas: a clinical review. JAMA. 2013;310(17):1842–1850. doi:10.1001/jama.2013.280319
3. Feng B, Lu X, Zhang G, Zhao L, Mei D. STING agonist delivery by lipid calcium phosphate nanoparticles enhances immune activation for neuroblastoma. Acta Materia Medica. 2023;2(2):216–227. doi:10.15212/amm-2023-0011
4. Ortiz R, Perazzoli G, Cabeza L, et al. Temozolomide: an Updated Overview of Resistance Mechanisms, Nanotechnology Advances and Clinical Applications. Curr Neuropharmacol. 2021;19(4):513–537. doi:10.2174/1570159x18666200626204005
5. Iturrioz-Rodríguez N, Sampron N, Matheu A. Current advances in temozolomide encapsulation for the enhancement of glioblastoma treatment. Theranostics. 2023;13(9):2734–2756. doi:10.7150/thno.82005
6. Karachi A, Dastmalchi F, Mitchell DA, Rahman M. Temozolomide for immunomodulation in the treatment of glioblastoma. Neuro Oncol. 2018;20(12):1566–1572. doi:10.1093/neuonc/noy072
7. Jiapaer S, Furuta T, Tanaka S, Kitabayashi T, Nakada M. Potential Strategies Overcoming the Temozolomide Resistance for Glioblastoma. Neurol Med Chir. 2018;58(10):405–421. doi:10.2176/nmc.ra.2018-0141
8. Roh J, Im M, Kang J, Youn B, Kim W. Long non-coding RNA in glioma: novel genetic players in temozolomide resistance. Anim Cells Syst (Seoul). 2023;27(1):19–28. doi:10.1080/19768354.2023.2175497
9. Wang Y, Wang Y, Qin Z, et al. The role of non-coding RNAs in ABC transporters regulation and their clinical implications of multidrug resistance in cancer. Expert Opin Drug Metab Toxicol. 2021;17(3):291–306. doi:10.1080/17425255.2021.1887139
10. Erasimus H, Gobin M, Niclou S, Van Dyck E. DNA repair mechanisms and their clinical impact in glioblastoma. Mutat Res Rev Mutat Res. 2016;769:19–35. doi:10.1016/j.mrrev.2016.05.005
11. Lee SY. Temozolomide resistance in glioblastoma multiforme. Genes Dis. 2016;3(3):198–210. doi:10.1016/j.gendis.2016.04.007
12. Le Rhun E, Preusser M, Roth P, et al. Molecular targeted therapy of glioblastoma. Cancer Treat Rev. 2019;80:101896. doi:10.1016/j.ctrv.2019.101896
13. Yang K, Wu Z, Zhang H, et al. Glioma targeted therapy: insight into future of molecular approaches. Mol Cancer. 2022;21(1):39. doi:10.1186/s12943-022-01513-z
14. Yan Y, Xu Z, Dai S, Qian L, Sun L, Gong Z. Targeting autophagy to sensitive glioma to temozolomide treatment. J Exp Clin Cancer Res. 2016;35:23. doi:10.1186/s13046-016-0303-5
15. Chong JP, Thömmes P, Blow JJ. The role of MCM/P1 proteins in the licensing of DNA replication. Trends Biochem Sci. 1996;21(3):102–106.
16. Pellegrini L. The CMG DNA helicase and the core replisome. Curr Opin Struct Biol. 2023;81:102612. doi:10.1016/j.sbi.2023.102612
17. Tanaka S, Araki H. Helicase activation and establishment of replication forks at chromosomal origins of replication. Cold Spring Harbor Perspect. Biol. 2013;5(12):a010371. doi:10.1101/cshperspect.a010371
18. Xiang S, Reed DR, Alexandrow MG. The CMG helicase and cancer: a tumor “engine” and weakness with missing mutations. Oncogene. 2023;42(7):473–490. doi:10.1038/s41388-022-02572-8
19. Proctor I, Stoeber K, Williams GH. Biomarkers in bladder cancer. Histopathology. 2010;57(1):1–13. doi:10.1111/j.1365-2559.2010.03592.x
20. Gao H, Wei H, Yang Y, et al. Phase separation of DDX21 promotes colorectal cancer metastasis via MCM5-dependent EMT pathway. Oncogene. 2023;42(21):1704–1715. doi:10.1038/s41388-023-02687-6
21. Jiang Y, Guo H, Tong T, et al. lncRNA lnc-POP1-1 upregulated by VN1R5 promotes cisplatin resistance in head and neck squamous cell carcinoma through interaction with MCM5. Mol Therapy. 2022;30(1):448–467. doi:10.1016/j.ymthe.2021.06.006
22. Zhang LL, Li Q, Zhong DS, Zhang WJ, Sun XJ, Zhu Y. MCM5 Aggravates the HDAC1-Mediated Malignant Progression of Lung Cancer. Front Cell Develop Biol. 2021;9:669132. doi:10.3389/fcell.2021.669132
23. Yang Y, Yan Y, Yin J, et al. O-GlcNAcylation of YTHDF2 promotes HBV-related hepatocellular carcinoma progression in an N(6)-methyladenosine-dependent manner. Signal Transduction Targeted Therapy. 2023;8(1):63. doi:10.1038/s41392-023-01316-8
24. Mao W, Ding Z, Wang K, Chen M. Cuproptosis-related MTF1 inhibits kidney renal clear cell carcinoma progression by suppressing proliferation and regulating immune cell infiltration. Acta Materia Medica. 2023;2(3):310–322. doi:10.15212/amm-2023-0016
25. Li J, Ma S, Zheng Y, et al. Prognostic value and immune infiltration analyses of cuproptosis-related genes in hepatocellular carcinoma. Acta Materia Medica. 2023;2(4):386–399. doi:10.15212/amm-2023-0035
26. Namdar M, Kearsey SE. Analysis of Mcm2-7 chromatin binding during anaphase and in the transition to quiescence in fission yeast. Exp Cell Res. 2006;312(17):3360–3369. doi:10.1016/j.yexcr.2006.07.001
27. Sharma G, Sharma A, Krishna M, Ahluwalia P, Gautam G. Diagnostic performance of minichromosome maintenance 5 (MCM5) in bladder cancer: a systematic review and meta-analysis. Urol Oncol. 2022;40(6):235–242. doi:10.1016/j.urolonc.2022.03.001
28. Gong B, Ma M, Yang X, Xie W, Luo Y, Sun T. MCM5 promotes tumour proliferation and correlates with the progression and prognosis of renal cell carcinoma. Int Urol Nephrol. 2019;51(9):1517–1526. doi:10.1007/s11255-019-02169-3
29. Mao J, Shen J, Lu X, et al. MCM5 is an oncogene of colon adenocarcinoma and promotes progression through cell cycle control. Acta Histochem. 2023;125(6):152072. doi:10.1016/j.acthis.2023.152072
30. Mio C, Lavarone E, Conzatti K, et al. MCM5 as a target of BET inhibitors in thyroid cancer cells. Endocr Relat Cancer. 2016;23(4):335–347. doi:10.1530/erc-15-0322
31. Abdolahi S, Ghazvinian Z, Muhammadnejad S, Saleh M, Asadzadeh Aghdaei H, Baghaei K. Patient-derived xenograft (PDX) models, applications and challenges in cancer research. J Transl Med. 2022;20(1):206. doi:10.1186/s12967-022-03405-8
32. Liu Y, Wu W, Cai C, Zhang H, Shen H, Han Y. Patient-derived xenograft models in cancer therapy: technologies and applications. Signal Transduction Targeted Therapy. 2023;8(1):160. doi:10.1038/s41392-023-01419-2
33. Shi J, Li Y, Jia R, Fan X. The fidelity of cancer cells in PDX models: characteristics, mechanism and clinical significance. Int, J, Cancer. 2020;146(8):2078–2088. doi:10.1002/ijc.32662
34. Yoshida GJ. Applications of patient-derived tumor xenograft models and tumor organoids. J Hematol Oncol. 2020;13(1):4. doi:10.1186/s13045-019-0829-z
35. Li B, Zheng L, Ye J, et al. CREB1 contributes colorectal cancer cell plasticity by regulating lncRNA CCAT1 and NF-κB pathways. Sci China Life Sci. 2022;65(8):1481–1497. doi:10.1007/s11427-022-2108-x
36. Wei Z, Wang S, Xu Y, et al. MYC reshapes CTCF-mediated chromatin architecture in prostate cancer. Nat Commun. 2023;14(1):1787. doi:10.1038/s41467-023-37544-3
37. Fang Z, Gong C, Yu S, et al. NFYB-induced high expression of E2F1 contributes to oxaliplatin resistance in colorectal cancer via the enhancement of CHK1 signaling. Cancer Lett. 2018;415:58–72. doi:10.1016/j.canlet.2017.11.040
38. Lai Q, Li Q, He C, et al. CTCF promotes colorectal cancer cell proliferation and chemotherapy resistance to 5-FU via the P53-Hedgehog axis. Aging. 2020;12(16):16270–16293. doi:10.18632/aging.103648
39. Masic D, Fee K, Bell H, et al. Hyperactive CREB subpopulations increase during therapy in pediatric B-lineage acute lymphoblastic leukemia. Haematologica. 2023;108(4):981–992. doi:10.3324/haematol.2022.281177
40. Wang Y, Hu Z, Liu Z, et al. MTOR inhibition attenuates DNA damage and apoptosis through autophagy-mediated suppression of CREB1. Autophagy. 2013;9(12):2069–2086. doi:10.4161/auto.26447
41. Arrieta VA, Dmello C, McGrail DJ, et al. Immune checkpoint blockade in glioblastoma: from tumor heterogeneity to personalized treatment. J Clin Invest. 2023;133(2).
42. Ghouzlani A, Kandoussi S, Tall M, Reddy KP, Rafii S, Badou A. Immune Checkpoint Inhibitors in Human Glioma Microenvironment. Front Immunol. 2021;12:679425. doi:10.3389/fimmu.2021.679425
43. Liu H, Zhao Q, Tan L, et al. Neutralizing IL-8 potentiates immune checkpoint blockade efficacy for glioma. Cancer Cell. 2023;41(4):693–710.e8. doi:10.1016/j.ccell.2023.03.004
44. June CH, O’Connor RS, Kawalekar OU, Ghassemi S, Milone MC. CAR T cell immunotherapy for human cancer. Science. 2018;359(6382):1361–1365. doi:10.1126/science.aar6711
45. Shalhout SZ, Miller DM, Emerick KS, Kaufman HL. Therapy with oncolytic viruses: progress and challenges. Nat Rev Clin Oncol. 2023;20(3):160–177. doi:10.1038/s41571-022-00719-w
46. Su YB, Sohn S, Krown SE, et al. Selective CD4+ lymphopenia in melanoma patients treated with temozolomide: a toxicity with therapeutic implications. J Clin Oncol. 2004;22(4):610–616. doi:10.1200/jco.2004.07.060
47. Trinh VA, Patel SP, Hwu WJ. The safety of temozolomide in the treatment of malignancies. Expert Opin Drug Saf. 2009;8(4):493–499. doi:10.1517/14740330902918281
48. Sengupta S, Marrinan J, Frishman C, Sampath P. Impact of temozolomide on immune response during malignant glioma chemotherapy. Clin Dev Immunol. 2012;2012:831090. doi:10.1155/2012/831090
49. Nabors LB, Lamb LS, Goswami T, Rochlin K, Youngblood SL. Adoptive cell therapy for high grade gliomas using simultaneous temozolomide and intracranial mgmt-modified γδ t cells following standard post-resection chemotherapy and radiotherapy: current strategy and future directions. Front Immunol. 2024;15:1299044. doi:10.3389/fimmu.2024.1299044
50. Lamb LS, Pereboeva L, Youngblood S, et al. A combined treatment regimen of MGMT-modified γδ T cells and temozolomide chemotherapy is effective against primary high grade gliomas. Sci Rep. 2021;11(1):21133. doi:10.1038/s41598-021-00536-8
 © 2024 The Author(s). This work is published and licensed by Dove Medical Press Limited. The
full terms of this license are available at https://www.dovepress.com/terms
and incorporate the Creative Commons Attribution
- Non Commercial (unported, 3.0) License.
By accessing the work you hereby accept the Terms. Non-commercial uses of the work are permitted
without any further permission from Dove Medical Press Limited, provided the work is properly
attributed. For permission for commercial use of this work, please see paragraphs 4.2 and 5 of our Terms.
© 2024 The Author(s). This work is published and licensed by Dove Medical Press Limited. The
full terms of this license are available at https://www.dovepress.com/terms
and incorporate the Creative Commons Attribution
- Non Commercial (unported, 3.0) License.
By accessing the work you hereby accept the Terms. Non-commercial uses of the work are permitted
without any further permission from Dove Medical Press Limited, provided the work is properly
attributed. For permission for commercial use of this work, please see paragraphs 4.2 and 5 of our Terms.