Back to Journals » Cancer Management and Research » Volume 12
MCM10 Acts as a Potential Prognostic Biomarker and Promotes Cell Proliferation in Hepatocellular Carcinoma: Integrated Bioinformatics Analysis and Experimental Validation
Received 23 June 2020
Accepted for publication 12 September 2020
Published 5 October 2020 Volume 2020:12 Pages 9609—9619
DOI https://doi.org/10.2147/CMAR.S267493
Checked for plagiarism Yes
Review by Single anonymous peer review
Peer reviewer comments 2
Editor who approved publication: Professor Rudolph Navari
Wei Wan, Yu Shen, Quanxi Li
Department of Hepatobiliary Surgery, The Second People’s Hospital of Lianyungang, Liangyungang City 222023, People’s Republic of China
Correspondence: Quanxi Li
Department of Hepatobiliary Surgery, The Second People’s Hospital of Lianyungang, Liangyungang City 222023, People’s Republic of China
Tel +86-13382950660
Email [email protected]
Background: Hepatocellular carcinoma (HCC) is one of the most common human malignant tumors. The prognosis of HCC patients is still unsatisfying. Thus, it is of great importance to identify novel molecules and functional pathways associated with the pathophysiology of HCC. In this study, we performed the integrated bioinformatics analysis and experiment validation to identify novel biomarkers in the prognosis and progression of HCC.
Materials and Methods: Gene expression profiles were obtained from Gene Expression Omnibus database (GSE33294) for the screening of the differentially expressed genes (DEGs) between HCC tissues and matched non-tumor tissues. The DEGs were subjected to Gene Ontology (GO), Kyoto Encyclopedia of Genes and Genomes (KEGG) pathway enrichment analysis and Gene Set Enrichment Analysis (GSEA). The key genes in HCC were further subjected to overall survival analysis of HCC patients. The in vitro functional studies were performed to validate the biological functions of the key gene in HCC cell progression.
Results: A total of 2,334 DEGs were screened from GSE33294 dataset, including 1,120 up-regulated and 1,214 down-regulated genes. GO, KEGG and GSEA results showed that DEGs are significantly associated with the biological process of cell cycle, cell division and DNA replication. The Kaplan–Meier survival analysis results showed that the key genes from the minichromosome maintenance protein complex (MCM) family including MCM8, MCM10, MCM2, MCM3, MCM4, MCM6 and MCM7 were significantly correlated with the overall survival of the HCC patients. Further validation studies showed that MCM10 was significantly up-regulated in the HCC cell lines, and knockdown of MCM10 significantly suppressed cell proliferation as determined by the cell counting kit-8 and BrdU incorporation assays and increased the caspase-3 activity of HCC cells.
Conclusion: The comprehensive bioinformatics analysis identified several key genes that were associated with the prognosis of HCC patients. The validation study results indicated that MCM10 may be an important predictor for poorer prognosis of HCC patients and may act as an oncogene to promote HCC cell progression.
Keywords: hepatocellular carcinoma, GSE33294, bioinformatics, hub genes, MCM10, prognosis
Introduction
Hepatocellular carcinoma (HCC) is one of the most common human malignant tumors and represents one of the leading causes of cancer-related deaths in the world. There were about 1 million new cases and about 0.5 million deaths caused by HCC in 2019 worldwide.1 In the People's Republic of China, the HCC patients make up more than 50% of the HCC cases worldwide, which may be due to the high incidence of hepatitis B virus (HBV) infection.2,3 There is growing evidence showing that aberrant expression of oncogenes or tumor suppressor genes has been closely associated with the development of HCC.4 Due to the lack of the effective early diagnosis for HCC, the prognosis of HCC patients is still unsatisfying. So far, sorafenib has been approved by the US Food and Drug Administration for treating HCC at advanced stages; while the high cost, low efficiency and adverse effects of sorafenib have largely limited its use.5 In this regard, it is necessary for us to investigate the correlation between novel gene functions and the pathophysiology of HCC, which may help us to discover novel diagnostic biomarkers and therapies for HCC.
Owing to the rapid development of high-throughput technologies, studies have developed rapid methods to identify the differentially expressed genes (DEGs) and related signaling pathways, which are related to the pathophysiology of different human malignancies.6,7 Among these studies, integrative bioinformatics strategies have been employed to analyze the DEGs in a large number of tumor samples. For example, Xie et al,8 analyzed four Gene Expression Omnibus (GEO) datasets including GSE19665, GSE55092, GSE94660, and GSE121248 and identified key genes and pathways involved in HBV-related HCC.8 Ma et al,9 obtained the mRNA expression profiles from the GEO database and the Cancer Genome Atlas-Liver Hepatocellular Carcinoma database, and the results showed that eleven hub genes with the most interactions were suggested as potential biomarkers in HCC.9 Yan et al,10 conducted a comprehensive study on bioinformatics, clinical analysis and in vitro validation and found that Misato family member 2, pseudogene had significant diagnostic and prognostic value in HCC.10 Due to the rapid increase in the number of microarray datasets, the analysis of these datasets has not been sufficient. Thus, more efforts should be invested in analyzing these datasets related to the pathophysiology of HCC, which may help us to identify novel diagnostic and prognostic biomarkers for HCC.
In this study, we downloaded the GSE33294 datasets (3 human HCC tissues and 3 matched non-tumor tissues) from the GEO database.11 GEO RNA-seq experiments Interactive Navigator (GREIN; http://www.ilincs.org/apps/grein/)12 tool was used to extract the DEGs. In addition, Gene Ontology (GO), Kyoto Encyclopedia of Genes and Genomes (KEGG) pathway enrichment analysis and Gene Set Enrichment Analysis (GSEA) were performed in these DEGs. Survival analysis of the enriched genes were conducted to find important biomarkers. Finally, we performed the validation studies and in vitro functional studies to investigate the potential role of minichromosome maintenance protein complex 10 (MCM10) in the pathophysiology of HCC.
Materials and Methods
Collection of Microarray Data
The microarray data was downloaded from the GEO database (http://www.ncbi.nlm.nih.gov/geo/) under the accession number GSE33294. The GPL10999 Illumina Genome Analyzer IIx platform was used. A total of three human HCC tissues and three matched non-tumor tissues were included in this dataset.
Data Reprocessing and DEG Screening
The GREIN tool was used to analyze the differences in the gene expression levels (signature) between non-tumor group and HCC group in the GSE33294 datasets. GREIN is a web application with comprehensive analytical toolbox, which provides manipulation and analysis of RNA-seq data. We identified DEGs between human normal liver tissues and human HCC tissues. After the raw expression data were normalized by trimmed mean of M-values (TMM) using the edgeR, we performed differential expression analysis (HCC tissues vs normal tissues). The screening threshold of DEG was set to a false discovery rate (FDR) <0.05 and |logFC| >1.5 (where FC is the fold change), and differential expression results were visualized as heatmap and volcano plot. The DEGs were then exported into excel for further analysis.
Functional Analysis of DEGs
An ontology-based tool, enrichR (https://amp.pharm.mssm.edu/Enrichr/), was used to perform GO enrichment and KEGG pathway enrichment analysis for the DEGs.13 The enrichR is an open and comprehensive resource for selected gene sets. GO enrichment analysis including biological processes, cellular components and molecular function, identified which GO terms were over or underrepresented within a given set of genes.13 The KEGG knowledge database, an integrated database resource, is generally used to identify functional and metabolic pathways.13
GSEA Analysis of DEGs
GSEA of DEGs was performed with JAVA program (http://software.broadinstitute.org/gsea/index.jsp) against MSigDB H hallmark gene sets and C5 Go gene set. The hallmark gene sets summarize information across multiple gene sets by emphasizing genes that display coordinate expression and represent well-defined biological processes, thereby reducing variation and redundancy, and providing a better delineated biological space for GSEA analysis.14 Genes were ranked with the metric of absolute “signal to noise” value and 1000 random sample permutations were carried out.
Overall Survival Analysis of DEGs
The overall survival analysis of the DEGs in the patients with HCC was analyzed by using the Gene Expression Profiling Interactive Analysis (GEPIA) database.15 The GEPIA is an outstanding interactive web tool for analyzing the RNA-seq expression data of 9,736 tumors and 8,587 normal samples from The Cancer Genome Atlas and the Genotype-Tissue Expression projects. GEPIA can provide customizable functions such as tumor/normal differential expression analysis, patient survival analysis, profiling according to cancer types or pathological stages, and correlation analysis. In this study, the Kaplan–Meier curves were plotted using the GEPIA database including 364 patients with HCC. The log-rank P-value (P < 0.05) and hazard ratio with the 95% confidence interval were calculated. P < 0.05 was considered statistically significant.
Cell Lines, Cell Culture and Transfection with Small Interfering RNAs
LO2, HepG2, SMMC7221 and HCC-LM3 cells were obtained from the Cell Bank of Shanghai Institutes for Biological Sciences, Chinese Academy of Sciences (Shanghai, People's Republic of China). The cells were cultured in the DMEM medium (Thermo Fisher Scientific, Waltham, MA, USA) supplemented with fetal bovine serum (FBS; Thermo Fisher Scientific) and were kept in a humidified incubator at 37°C with 5% CO2. The MCM10 siRNAs (si-MCM10#1 and siMCM10#2) and the scrambled control siRNA (si-NC) were obtained from RiboBio (Guangzhou, People's Republic of China). SiRNAs were transfected into the SMMC7721 and HCC-LM3 cells using Lipofectamine 2000 reagent (Invitrogen, Thermo Fisher Scientific) according to the manufacturer’s protocol. At 24 hours after transfection, cells were processed for further experimental assays.
RNA Isolation and RT-qPCR
Total RNA was purified from cell lines using the MiniBEST Universal RNA extraction kit (TaKaRa, Dalian, People's Republic of China). A total of 2 μg RNA was reversely transcribed into cDNA using PrimeScript 1st strand cDNA Synthesis Kit (Takara). The real-time PCR was performed on an Applied Biosystems (Applied Biosystems, Thermo Fisher Scientific) using One Step PrimeScript™ RT-PCR Kit (Takara) in accordance with the manufacturer’s protocol. GAPDH was used as the reference control for MCM10 expression. The relative expression of MCM10 was calculated using the 2−ΔΔCt method.
Western Blotting
Cells were lysed using the RIPA buffer (Beyotime, Beijing, People's Republic of China) supplemented with protease inhibitors (Roche, Basel, Switzerland). The protein concentration of the samples were measured by BCA protein assay kit (Thermo Fisher Scientific). Equal amounts of proteins (50 µg) were separated on a 10% SDS-PAGE gel. The separated proteins were then transferred to the polyvinylidene difluoride membranes (Beyotime). After incubating with 1.5% skimmed milk, the membranes were then probed with the antibodies including anti-MCM10 and anti-β-actin (Cell Signaling Technology, Danvers, MA, USA). The membranes were then detected against the Horseradish peroxidase-conjugated secondary antibodies (Cell Signaling Technology). The signal on the membranes were detected using the ECL kit (Thermo Fisher Scientific) in accordance with the manufacturer’s protocol.
Cell Counting Kit-8 (CCK-8) Assay
Cell proliferative ability was measured by the CCK-8 kit (Beyotime) in accordance with the manufacturer’s protocol. Briefly, SMMC7721 and HCC-LM3 cells transfected with different siRNAs were seeded in a 96-well plate, and after culturing for indicated time duration, cells were incubated with 10 µL of CCK-8 reagent at room temperature for 4 hours. The cell proliferation was detected by measuring the absorbance value at 450 nm using a microplate reader.
BrdU Incorporation Assay
Cell proliferation was evaluated by the BrdU incorporation assay. Briefly, SMMC7721 and HCC-LM3 cells transfected with different siRNAs were seeded on 6-well plates, and were incubated with 10 µM BrdU (Beyotime) for 4 hours followed by staining with mouse anti-BrdU antibody (Cell Signaling Technology) overnight in the dark at 4°C. After that, the cells were treated with fluorescein isothiocyanate-conjugated goat anti-mouse IgG (Dako, Glostrup, Denmark). Propidium iodine (PI) (Sigma) (50 μg/mL) was used to stain nuclei as the control to all cells in each group. The labelling index was expressed as the number of positively labelled nuclei/total number of nuclei.
Caspase-3 Activity
The caspase-3 activity of the transfected SMMC7721 and HCC-LM3 cells were measured by the Caspase-3 activity kit (Abcam, Cambridge, MA, USA) in accordance with the manufacturer’s protocol.
Statistical Analysis
GraphPad Prism software was used to perform the statistical analysis. One-way ANOVA was used for determination of significance of differences among treatment groups. A P-value less than 0.05 was considered to be statistically significant.
Results
Analysis of DEGs
Firstly, the density distribution plot is shown in Figure 1A, and prior to DEGs analysis, the Pearson correlation coefficients between samples were determined by RNA-seq correlation analysis, and the Pearson correlation coefficient of each sample was greater than 0.9 (Figure 1B), implying good repeatability. Furthermore, principal component analysis was performed on the DEGs and the PCA results indicated that the non-tumor group and hepatocellular carcinoma group were divided into two distinctive groups (Figure 1C). Similarly, t-NSE analysis further confirmed the distinctive clustering of the two groups (Figure 1D). In this regard, the DEGs could distinguish between non-tumor group and hepatocellular carcinoma group, suggesting the robustness of the microarray-data for discovering tumor-specific genes for HCC. The expression microarray datasets were processed using the GREIN online analysis tool to obtain the DEGs. A total of 2,334 DEGs were screened from xxx dataset, including 1,120 up-regulated and 1,214 down-regulated genes (Figure 1E). The cluster heatmap of the top 100 upregulated and down-regulated genes is shown in Figure 1F. The results of the DEGs are also presented using the volcano plot on the basis of |FC|>1.5 and an adjusted P-value <0.05 (Figure 1G).
 |
Figure 1 Differential analysis of the GEO datasets (GSE33294). (A) Density distribution. (B) Pearson correlation between samples. (C) Principal component analysis plot of the counts of the detected genes in six samples. (D) t-Distributed Stochastic Neighbor Embedding (t-NSE) analysis of the counts of the detected genes in six samples. (E) Heatmap of the DEGs between non-tumor group and hepatocellular carcinoma group. (F) Heatmap plot of the DEGs with the adjusted P-values. (G) Volcano plot of the differentially expressed genes. |
Gene Ontology Analysis and Gene Ontology Enrichment Analysis of the DEGs
Furthermore, we used the enrichR online tool to perform the Gene ontology analysis and enrichment analysis. As shown in Figure 2A, the DEGs were classified into biological process, cellular component and molecular function by the GO analysis. In the aspect of biological process, the high number of DEGs was associated with “alpha-amino acid catabolic process,” “epoxygenase P450 pathway,” and the “aromatic amino family catabolic process,” for example. In the aspect of cellular component, the high number of DEGs was associated with “spindle,” “platelet alpha granule lumen,” and “mitotic spindle,” for example. In the aspect of molecular function, the high number of DEGs was associated with eg, “steroid hydroxylase activity,” “arachidonic acid monooxygenase activity,” and “arachidonic acid epoxygenase activity.” Further analysis showed that the top 40 genes were enriched in “cell cycle G1/S phase“, “G1/S transition of mitotic cell cycle” and “mitotic cell cycle phase” in the biological process; in “chromosome, centromeric region,” “platelet alpha granule lumen,” and “spindle” of the cellular component, and in “arachidonic acid monooxygenase activity,” “arachidonic acid epoxygenase activity,” and “steroid hydroxylase activity” of the molecular function (Figure 2B).
 |
Figure 2 Gene ontology (GO) enrichment analysis of the DEGs. (A) GO analysis of differentially expressed genes. (B) The top 40 genes enriched in the GO terms were shown. |
KEGG Analysis of DEGs
Then the DEGs were searched against the KEGG pathway, the top pathways are shown in Figure 3A, and these pathways include “cell cycle,” “drug metabolism,” “retinol metabolism,” “chemical carcinogenesis,” “complement and coagulation cascades,” “metabolism of xenobiotics by cytochrome P450,” “valine,” “leucine and isoleucine degradation,” “fatty acid degradation,” “tryptophan metabolism,” and “PPAR signalling pathway.” The top 40 genes associated with enriched pathways include “retinol metabolism,” “drug metabolism,” “arginine biosynthesis” and so on and are shown in Figure 3B.
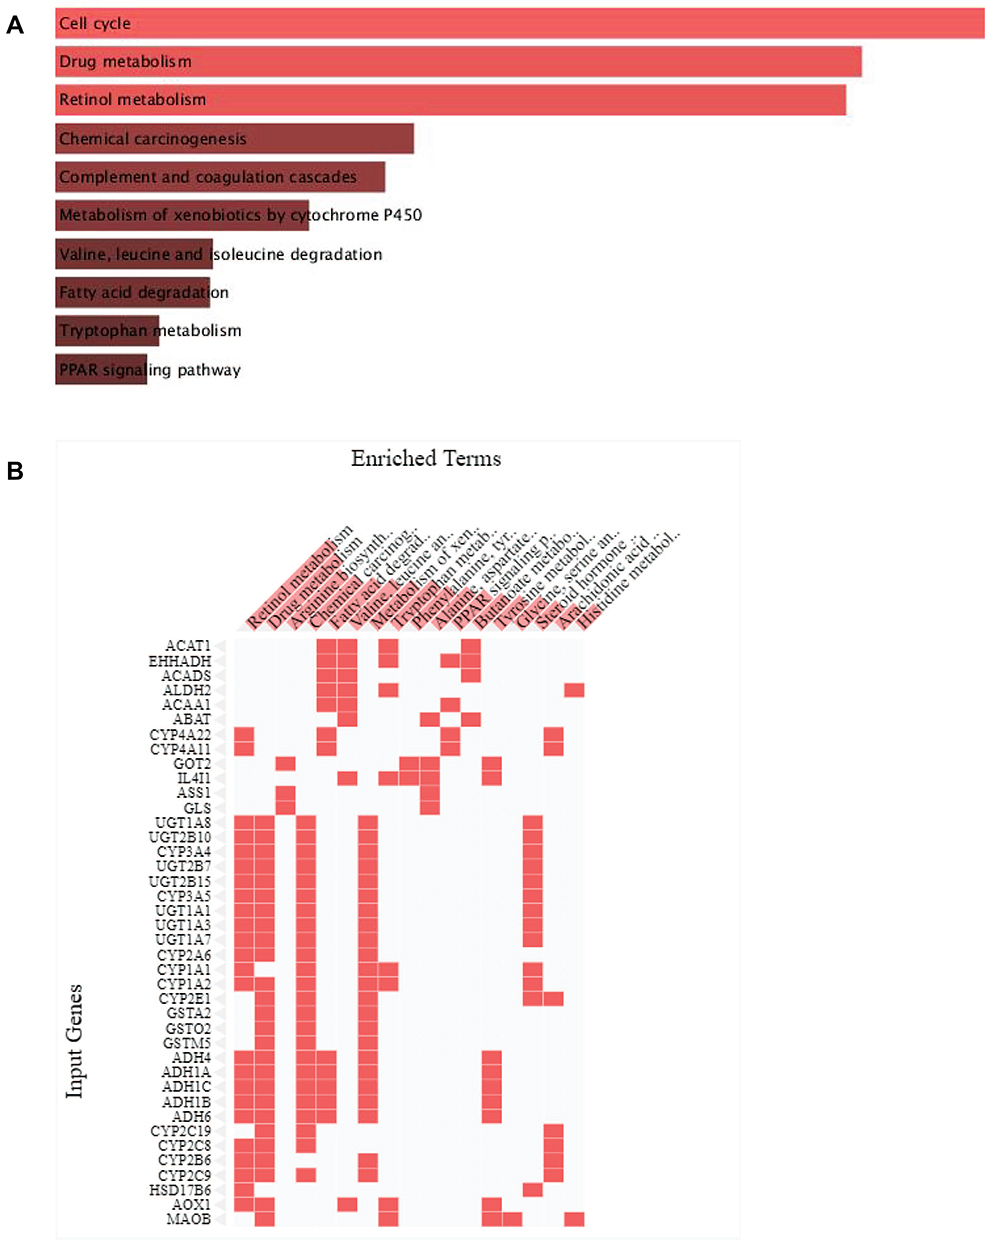 |
Figure 3 KEGG pathway enrichment analysis of the DEGs. (A) KEGG pathway enrichment analysis of differentially expressed genes. (B) The top 40 genes enriched in the KEGG pathway are shown. |
GSEA Analysis of DEGs
Firstly, the DEGs were research against the hallmark gene sets, and as shown in Figure 4A, the top two enriched terms were G2M checkpoint and mitotic spindle, and the NES values were 3.62 and 3.59 respectively; when the DEGs were searched against the GO gene sets, the top enriched GO terms included cell cycle, cell cycle progress, mitotic cell cycle, cell cycle phase transition, cell division, mitotic nuclear division and the NES scores were 4.00, 3.94, 4.26, 3.70, 4.09 and 4.23, respectively (Figure 4B).
 |
Figure 4 GESA analysis of the DEGs. (A) GESA analysis of DEGs using hallmark gene sets. (B) GESA analysis of DEGs using GO gene sets. |
Overall Survival Analysis of the DEGs in Patients with HCC
Based on the enriched terms in GO enrichment analysis, we further chose genes enriched in the “cell cycle G1/S phase,” “G1/S transition of mitosis,” and “mitotic cell cycle phase.” A total of 19 genes were searched against the GEPIA database to construct the Kaplan–Meier survival curve. As shown in Supplemental Figure S1, PRIM2, RANBP3L, CDT1, CDC6, CDC25A, CDC7, DBF4, POLA2, POLA1, ORC6, CDC45, and ORC1 were significantly associated with the overall survival of HCC patients. Furthermore, we focused our analysis on the correlation between the MCMs family and the overall survival analysis, as shown in Figure 5, the high expression of MCM8, MCM10, MCM2, MCM3, MCM4, MCM6, and MCM7 were significantly correlated with shorter overall survival of the HCC patients. Among these MCMs, the role of MCM10 has not been deciphered in HCC, thus, further validation study was performed to determine the potential role of MCM10 in HCC progression.
 |
Figure 5 Overall survival analysis of the differentially expressed genes (MCM8, MCM10, MCM2, MCM3, MCM4, MCM6, and MCM7) in the patients with HCC by using the GEPIA database. |
Validation of the Candidate Gene
By using qRT-PCR and Western blot analysis, we analyzed MCM10 expression in normal liver cell lines and HCC cell lines, and as shown in Figure 6A, MCM10 mRNA expression levels were significantly higher in the HCC cancer cell lines than that in normal liver cells (Figure 5A). In order to confirm the in vitro biological function of MCM10 in HCC cells, we designed two siRNAs for MCM10. Both SMMC7721 and HCC-LCM3 cells transfected with MCM10 siRNAs exhibited downregulation of MCM10 in both mRNA and protein levels (Figure 6B and C). The CCK-8 analysis showed that MCM10 knockdown significantly suppressed the cell proliferation of SMMC7721 and HCC-LM3 cells (Figure 6D and E); consistently, the BrdU incorporation assay revealed that MCM10 knockdown attenuate the proliferative potentials of SMMC7221 and HCC-LM3 (Figure 6F and G). Moreover, MCM10 knockdown also significantly increased the caspase-3 activities of SMMC772 and HCC-LM3 cells (Figure 6H and I).
 |
Figure 6 Knockdown of MCM10 suppressed HCC cell proliferation and increased caspase-3 activity. (A) The mRNA and protein expression levels of MCM10 in different cell lines. (B) MCM10 mRNA and protein expression levels in SMMC7721 cells after MCM10 siRNAs transfection or scrambled siRNA transfection. (C) MCM10 mRNA and protein expression levels in HCC-LM3 cells after MCM10 siRNAs transfection or scrambled siRNA transfection. (D and E) Cell proliferation as determined by CCK-8 assay in SMMC7721 and HCC-LM3 cells after MCM10 siRNAs transfection or scrambled siRNA transfection. (F and G) Cell proliferation as determined by BrdU incorporation assay in SMMC7721 and HCC-LM3 cells after MCM10 siRNAs transfection or scrambled siRNA transfection. (H and I) Caspase-3 activity in SMMC7721 and HCC-LM3 cells after MCM10 siRNAs transfection or scrambled siRNA transfection. N = 3. *P < 0.05, **P < 0.01 and ***P < 0.001 compared to control groups. |
Discussion
Due to the lack of the effective early diagnosis for HCC, the prognosis of HCC patients is still unsatisfying. Thus, it is of great importance to identify novel molecules and functional pathways associated with the pathophysiology. In this study, we used the GSE33294 datasets to perform the integrative bioinformatics analysis. Chan et al,11 first generated the GSE33294 dataset and found that differentially expressed adenosine deAminase that act on RNA (ADAR) family members have great prognostic value and diagnostic potential for HCC.11 However, other differential genes in the datasets were not further explored. In the present study, we compared the non-tumor group and HCC group and identified 2,334 differentially expressed genes using the GREIN online analysis tool. Further GO, KEGG pathways and GSEA analysis revealed that several key genes may be associated with cell division and cell cycle regulation, which may contribute to proliferative capacity of the HCC cells. In the overall survival analysis, we found that the MCM family members were significantly associated with overall survival of the patients. Validation studies further identified that MCM10 may be a novel gene that contributes to the pathophysiology of HCC.
Up to date, thousands of microarrays related to HCC have been performed according to the GEO datasets results. Various hub genes with potential diagnostic and prognostic values for HCC have been identified across different studies. Want et al,16 analyzed two datasets (GSE 94,508 and GSE 97332) and found that up-regulation of hsa_circ_0000517 predicts poor prognosis of HCC patients.16 Zhang et al,17 analyzed the GSE 36376 datasets and revealed that carbonic anhydrase II was associated with the clinicopathological characteristics of HCC patients.17 In this study, the GO enrichment and GSEA analysis of DEGs results showed that the DEGs were closely associated with cell cycle regulation, cell division as well as DNA replication; consistently, the KEGG analysis also showed that the top enriched pathway was related to cell cycle. Indeed, studies have shown that aberrant cell cycle, division and DNA replication are important indicators for the aggressiveness of the cancer cells.18 According to the GO analysis, a total of 19 genes were enriched in these biological processes. The 19 genes were further used to perform the overall survival analysis of HCC patients, and all these genes were associated with the overall survival of these patients.
Among these 19 genes, we focused on the MCM family members, as they have been found to play important roles in regulating the tumorigenesis. Previous studies have found that MCM2, MCM3, MCM4, MCM6, MCM7, MCM8, and MCM10 were all up-regulated in the HCC tissues compared to matched non-tumor tissues.19 MCM2, MCM7, and MCM6 could predict the poorer survival of the HCC patients.19 Knockdown of MCM6 suppressed the S/G2-phase progress in HCC cells.19 By using bioinformatics analysis, MCM3 was identified as a key predictor for poor survival of HCC patients.20,21 Overexpression of MCM3 promoted HCC radio-resistance by activating the NF-κB pathway.22 Survival analysis in the GSE14520 cohort suggested that expression of MCM4 was significantly associated with HBV-related HCC overall survival.23 Xiong et al, performed the high throughput circRNA sequencing analysis and found that MCM8 was associated with the clinical outcomes of HCC patients. Though MCM10 was found to be up-regulated in the HCC tissues as revealed in the previous literatures, the prognostic role of MCM10 in HCC has not been revealed. In the present study, we identified that high expression of MCM10 was associated with poor overall survival of patients with HCC based on the bioinformatics analysis. However, more clinical data should be collected to confirm the prognostic role of MCM10 in HCC patients. Moreover, the molecular biological functions of MCM10 in HCC has not been identified. As such, we further chose MCM10 in the subsequent validation studies.
The validation results showed that MCM10 was up-regulated in the HCC cell lines, suggesting that MCM10 may be an oncogene in HCC. In fact, MCM10 has been identified as an oncogene in other types of cancers. Yang and Wang,24 showed that MCM10 promoted the invaded/migrated potentials of breast cancer cells via Wnt/β-catenin signaling.24 MCM10 can act as an oncogene to promote cell proliferation of prostate cancer.25 Consistently, our results showed that MCM10 knockdown suppressed cell proliferation and increased the caspase-3 activity of the HCC cells, suggesting that MCM10 may act as an oncogene to promote HCC cell progression.
In summary, the comprehensive bioinformatics analysis identified several key genes that were associated with the prognosis of HCC patients. The validation study results indicated that MCM10 may be an important predictor for poorer prognosis of patients with HCC and may act as an oncogene to promote HCC cell progression. However, further studies are required to decipher the mechanistic role of MCM10 in the pathophysiology of HCC.
Funding
There is no funding to report.
Disclosure
The authors report no conflicts of interest in this work.
References
1. Forner A, Reig M, Bruix J. Hepatocellular carcinoma. Lancet. 2018;391(10127):1301–1314. doi:10.1016/S0140-6736(18)30010-2
2. Li J, Xing J, Yang Y, et al. Adjuvant (131)I-metuximab for hepatocellular carcinoma after liver resection: a randomised, controlled, multicentre, open-label, Phase 2 trial. Lancet Gastroenterol Hepatol. 2020;5(6):548–560. doi:10.1016/S2468-1253(19)30422-4
3. Zhou M, Wang H, Zeng X, et al. Mortality, morbidity, and risk factors in China and its provinces, 1990-2017: a systematic analysis for the Global Burden of Disease Study 2017. Lancet. 2019;394(10204):1145–1158. doi:10.1016/S0140-6736(19)30427-1
4. Craig AJ, von Felden J, Garcia-Lezana T, Sarcognato S, Villanueva A. Tumour evolution in hepatocellular carcinoma. Nat Rev Gastroenterol Hepatol. 2020;17(3):139–152.
5. Bruix J, da Fonseca LG, Reig M. Insights into the success and failure of systemic therapy for hepatocellular carcinoma. Nat Rev Gastroenterol Hepatol. 2019;16(10):617–630. doi:10.1038/s41575-019-0179-x
6. Finotello F, Rieder D, Hackl H, Trajanoski Z. Next-generation computational tools for interrogating cancer immunity. Nat Rev Genet. 2019;20(12):724–746. doi:10.1038/s41576-019-0166-7
7. Kulasingam V, Pavlou MP, Diamandis EP. Integrating high-throughput technologies in the quest for effective biomarkers for ovarian cancer. Nat Rev Cancer. 2010;10(5):371–378. doi:10.1038/nrc2831
8. Xie S, Jiang X, Zhang J, et al. Identification of significant gene and pathways involved in HBV-related hepatocellular carcinoma by bioinformatics analysis. PeerJ. 2019;7:e7408. doi:10.7717/peerj.7408
9. Ma X, Zhou L, Zheng S. Transcriptome analysis revealed key prognostic genes and microRNAs in hepatocellular carcinoma. PeerJ. 2020;8:e8930.
10. Yan L, Yue C, Xu Y, Jiang X, Zhang L, Wu J. Prognostic value and molecular regulatory mechanism of MSTO2P in hepatocellular carcinoma: a comprehensive study based on bioinformatics, clinical analysis and in vitro validation. Onco Targets Ther. 2020;13:2583–2598. doi:10.2147/OTT.S245741
11. Chan TH, Lin CH, Qi L, et al. A disrupted RNA editing balance mediated by ADARs (Adenosine DeAminases that act on RNA) in human hepatocellular carcinoma. Gut. 2014;63(5):832–843. doi:10.1136/gutjnl-2012-304037
12. Mahi NA, Najafabadi MF, Pilarczyk M, Kouril M, Medvedovic M. GREIN: An Interactive Web platform for re-analyzing GEO RNA-seq data. Sci Rep. 2019;9(1):7580. doi:10.1038/s41598-019-43935-8
13. Kuleshov MV, Jones MR, Rouillard AD, et al. Enrichr: a comprehensive gene set enrichment analysis web server 2016 update. Nucleic Acids Res. 2016;44(W1):W90–97. doi:10.1093/nar/gkw377
14. Liberzon A, Birger C, Thorvaldsdóttir H, Ghandi M, Mesirov JP, Tamayo P. The molecular signatures database hallmark gene set collection. Cell Syst. 2015;1(6):417–425. doi:10.1016/j.cels.2015.12.004
15. Tang Z, Li C, Kang B, Gao G, Li C, Zhang Z. GEPIA: a web server for cancer and normal gene expression profiling and interactive analyses. Nucleic Acids Res. 2017;45(W1):W98–w102. doi:10.1093/nar/gkx247
16. Wang X, Wang X, Li W, Zhang Q, Chen J, Chen T. Up-regulation of hsa_circ_0000517 predicts adverse prognosis of hepatocellular carcinoma. Front Oncol. 2019;9:1105. doi:10.3389/fonc.2019.01105
17. Zhang H, Zhuo C, Zhou D, et al. Association between the expression of carbonic anhydrase II and clinicopathological features of hepatocellular carcinoma. Oncol Lett. 2019;17(6):5721–5728.
18. Vassilev A, DePamphilis ML. Links between DNA replication, stem cells and cancer. Genes. 2017;8(2):2. doi:10.3390/genes8020045
19. Liu Z, Li J, Chen J, et al. MCM family in HCC: MCM6 indicates adverse tumor features and poor outcomes and promotes S/G2 cell cycle progression. BMC Cancer. 2018;18(1):200. doi:10.1186/s12885-018-4056-8
20. Zhuang L, Yang Z, Meng Z. Upregulation of BUB1B, CCNB1, CDC7, CDC20, and MCM3 in tumor tissues predicted worse overall survival and disease-free survival in hepatocellular carcinoma patients. Biomed Res Int. 2018;2018:7897346. doi:10.1155/2018/7897346
21. Yang W-X, Pan -Y-Y, You C-G. CDK1, CCNB1, CDC20, BUB1, MAD2L1, MCM3, BUB1B, MCM2, and RFC4 may be potential therapeutic targets for hepatocellular carcinoma using integrated bioinformatic analysis. Biomed Res Int. 2019;2019:1245072. doi:10.1155/2019/1245072
22. Yang Q, Xie B, Tang H, et al. Minichromosome maintenance 3 promotes hepatocellular carcinoma radioresistance by activating the NF-κB pathway. J Exp Clin Cancer Res. 2019;38(1):263. doi:10.1186/s13046-019-1241-9
23. Liao X, Liu X, Yang C, et al. Distinct diagnostic and prognostic values of minichromosome maintenance gene expression in patients with hepatocellular carcinoma. J Cancer. 2018;9(13):2357–2373. doi:10.7150/jca.25221
24. Yang WD, Wang L. MCM10 facilitates the invaded/migrated potentials of breast cancer cells via Wnt/beta-catenin signaling and is positively interlinked with poor prognosis in breast carcinoma. J Biochem Mol Toxicol. 2019;33(7):e22330. doi:10.1002/jbt.22330
25. Cui F, Hu J, Ning S, Tan J, Tang H. Overexpression of MCM10 promotes cell proliferation and predicts poor prognosis in prostate cancer. The Prostate. 2018;78(16):1299–1310. doi:10.1002/pros.23703
 © 2020 The Author(s). This work is published and licensed by Dove Medical Press Limited. The
full terms of this license are available at https://www.dovepress.com/terms
and incorporate the Creative Commons Attribution
- Non Commercial (unported, 3.0) License.
By accessing the work you hereby accept the Terms. Non-commercial uses of the work are permitted
without any further permission from Dove Medical Press Limited, provided the work is properly
attributed. For permission for commercial use of this work, please see paragraphs 4.2 and 5 of our Terms.
© 2020 The Author(s). This work is published and licensed by Dove Medical Press Limited. The
full terms of this license are available at https://www.dovepress.com/terms
and incorporate the Creative Commons Attribution
- Non Commercial (unported, 3.0) License.
By accessing the work you hereby accept the Terms. Non-commercial uses of the work are permitted
without any further permission from Dove Medical Press Limited, provided the work is properly
attributed. For permission for commercial use of this work, please see paragraphs 4.2 and 5 of our Terms.